
Abstract
Risk assessments of genetically modified animals include evaluating animal health and whether food products are safe and nutritious. We gathered empirical data on the health, growth, and nutritional composition of animal products from six offspring of a genome-edited (GnEd) bull homozygous for the dominant PC POLLED allele. These offspring did not differ in their growth, health, or development compared with controls. All nutrient values in the meat from control and GnEd offspring fell within the range found in beef databases. Milk composition varied within controls, between control and GnEd offspring, and over time; however, all values except sulfur percentage were within peer-reviewed literature ranges. Both meat and milk composition are influenced by breed, nutrition, parity, and days in milk. These data suggest that regulatory product composition studies should be hypothesis driven, risk based, and be prompted by novel product hazards hypothesized to result from any biochemical pathways targeted by the intended alteration.
Introduction
Horns on cattle are a safety concern to both animals and their human handlers, 1 but current high-producing dairy breeds consist of livestock that are nearly all horned. Disbudding dairy cows at birth is a routine procedure that also has animal welfare concerns, 1 but introducing the dominant polled (hornless) trait into the dairy population by crossbreeding would also introduce nonproductive traits by linkage drag. 2 The fastest and most effective way to introduce the POLLED allele would be by genome editing (GnEd) elite dairy bulls. 2
However, without acceptance of the milk and meat from these animals into the human food chain, this approach will not be feasible. We hypothesized that the offspring of a dairy bull that was GnEd to be homozygous POLLED would be healthy and produce milk and meat products that would be safe to eat, and nutritionally comparable with analogous products derived from conventional cattle sold and eaten every day.
The Codex Guideline for the conduct of food safety assessment of foods derived from recombinant-deoxyribonucleic acid (DNA) animals 3 recommends evaluations of food product composition and animal health as essential components of the overall approach to ensure the safety of food derived from recombinant-DNA (rDNA) animals. A “recombinant-DNA animal” is defined as “an animal in which the genetic material has been changed through in vitro nucleic acid techniques, including recombinant deoxyribonucleic acid (DNA) and direct injection of nucleic acid into cells or organelles.”
In undertaking these evaluations, it is important to compare the health status of the rDNA animal with the health status of the appropriate conventional counterpart. This means animals with a known history of safe use as food grown under equivalent, or as close as possible, husbandry conditions including gender, parity, and lactation stage as the rDNA animals. 4 Ideally, these conventional comparators should be of a similar genetic background to the progenitors of the rDNA animals.
In addition, it is important to know the range or variation in key nutritional components of the food product produced by the rDNA animal to provide an appropriate context to determine the significance of any differences between conventional comparators and rDNA animals. Unlike the International Life Sciences Institute Crop Composition Database that contains data obtained from studies conducted over a number of years at worldwide locations,5–7 there is no analogous database for animal source food composition.
Moreover, plant sources of food can contain endogenous components and antinutrients that, when present in high concentrations, can be toxic to humans and animals, 8 whereas animal products do not typically contain such compounds and are, therefore, not routinely subjected to extensive compositional analyses. 4 Health status has proven to be a reliable indicator of animal product safety, and is used in combination with other ante- and postmortem inspections to determine that healthy food from animals produced through conventional breeding is safe to eat.
The overall goal of this project was to provide empirical data on the development, health, and nutritional composition of animal products derived from the six offspring of a GnEd dairy bull homozygous for the dominant PC Celtic POLLED allele, 9 as a companion article to our earlier study on the genomic and polled phenotypic analyses of these calves. 10 In addition to comparing the nutritional composition of milk and meat from these offspring with contemporary conventional comparators, we also compiled compositional data on selected raw beef cuts (shoulder and rump) from global databases to document the range of naturally occurring nutritional variation in these muscles.
As previously reported, 10 four of the six calves carried an integrated copy of the pCR™2.1 plasmid (Invitrogen, Waltham, MA) backbone in the PC allele they inherited from their GnEd sire. We also examined whether the prokaryote promoter that drives the expression of the bacterial gene for ampicillin resistance (bla) and kanamycin/neomycin resistance (neo) in pCR2.1 resulted in the expression of these genes in the muscle of cattle. Finally, in the absence of an identified safety hazard, we examined the rationale and value of requiring compositional data of food derived from rDNA animals and contemporary comparator controls to satisfy regulatory agency standards.
Results
Growth
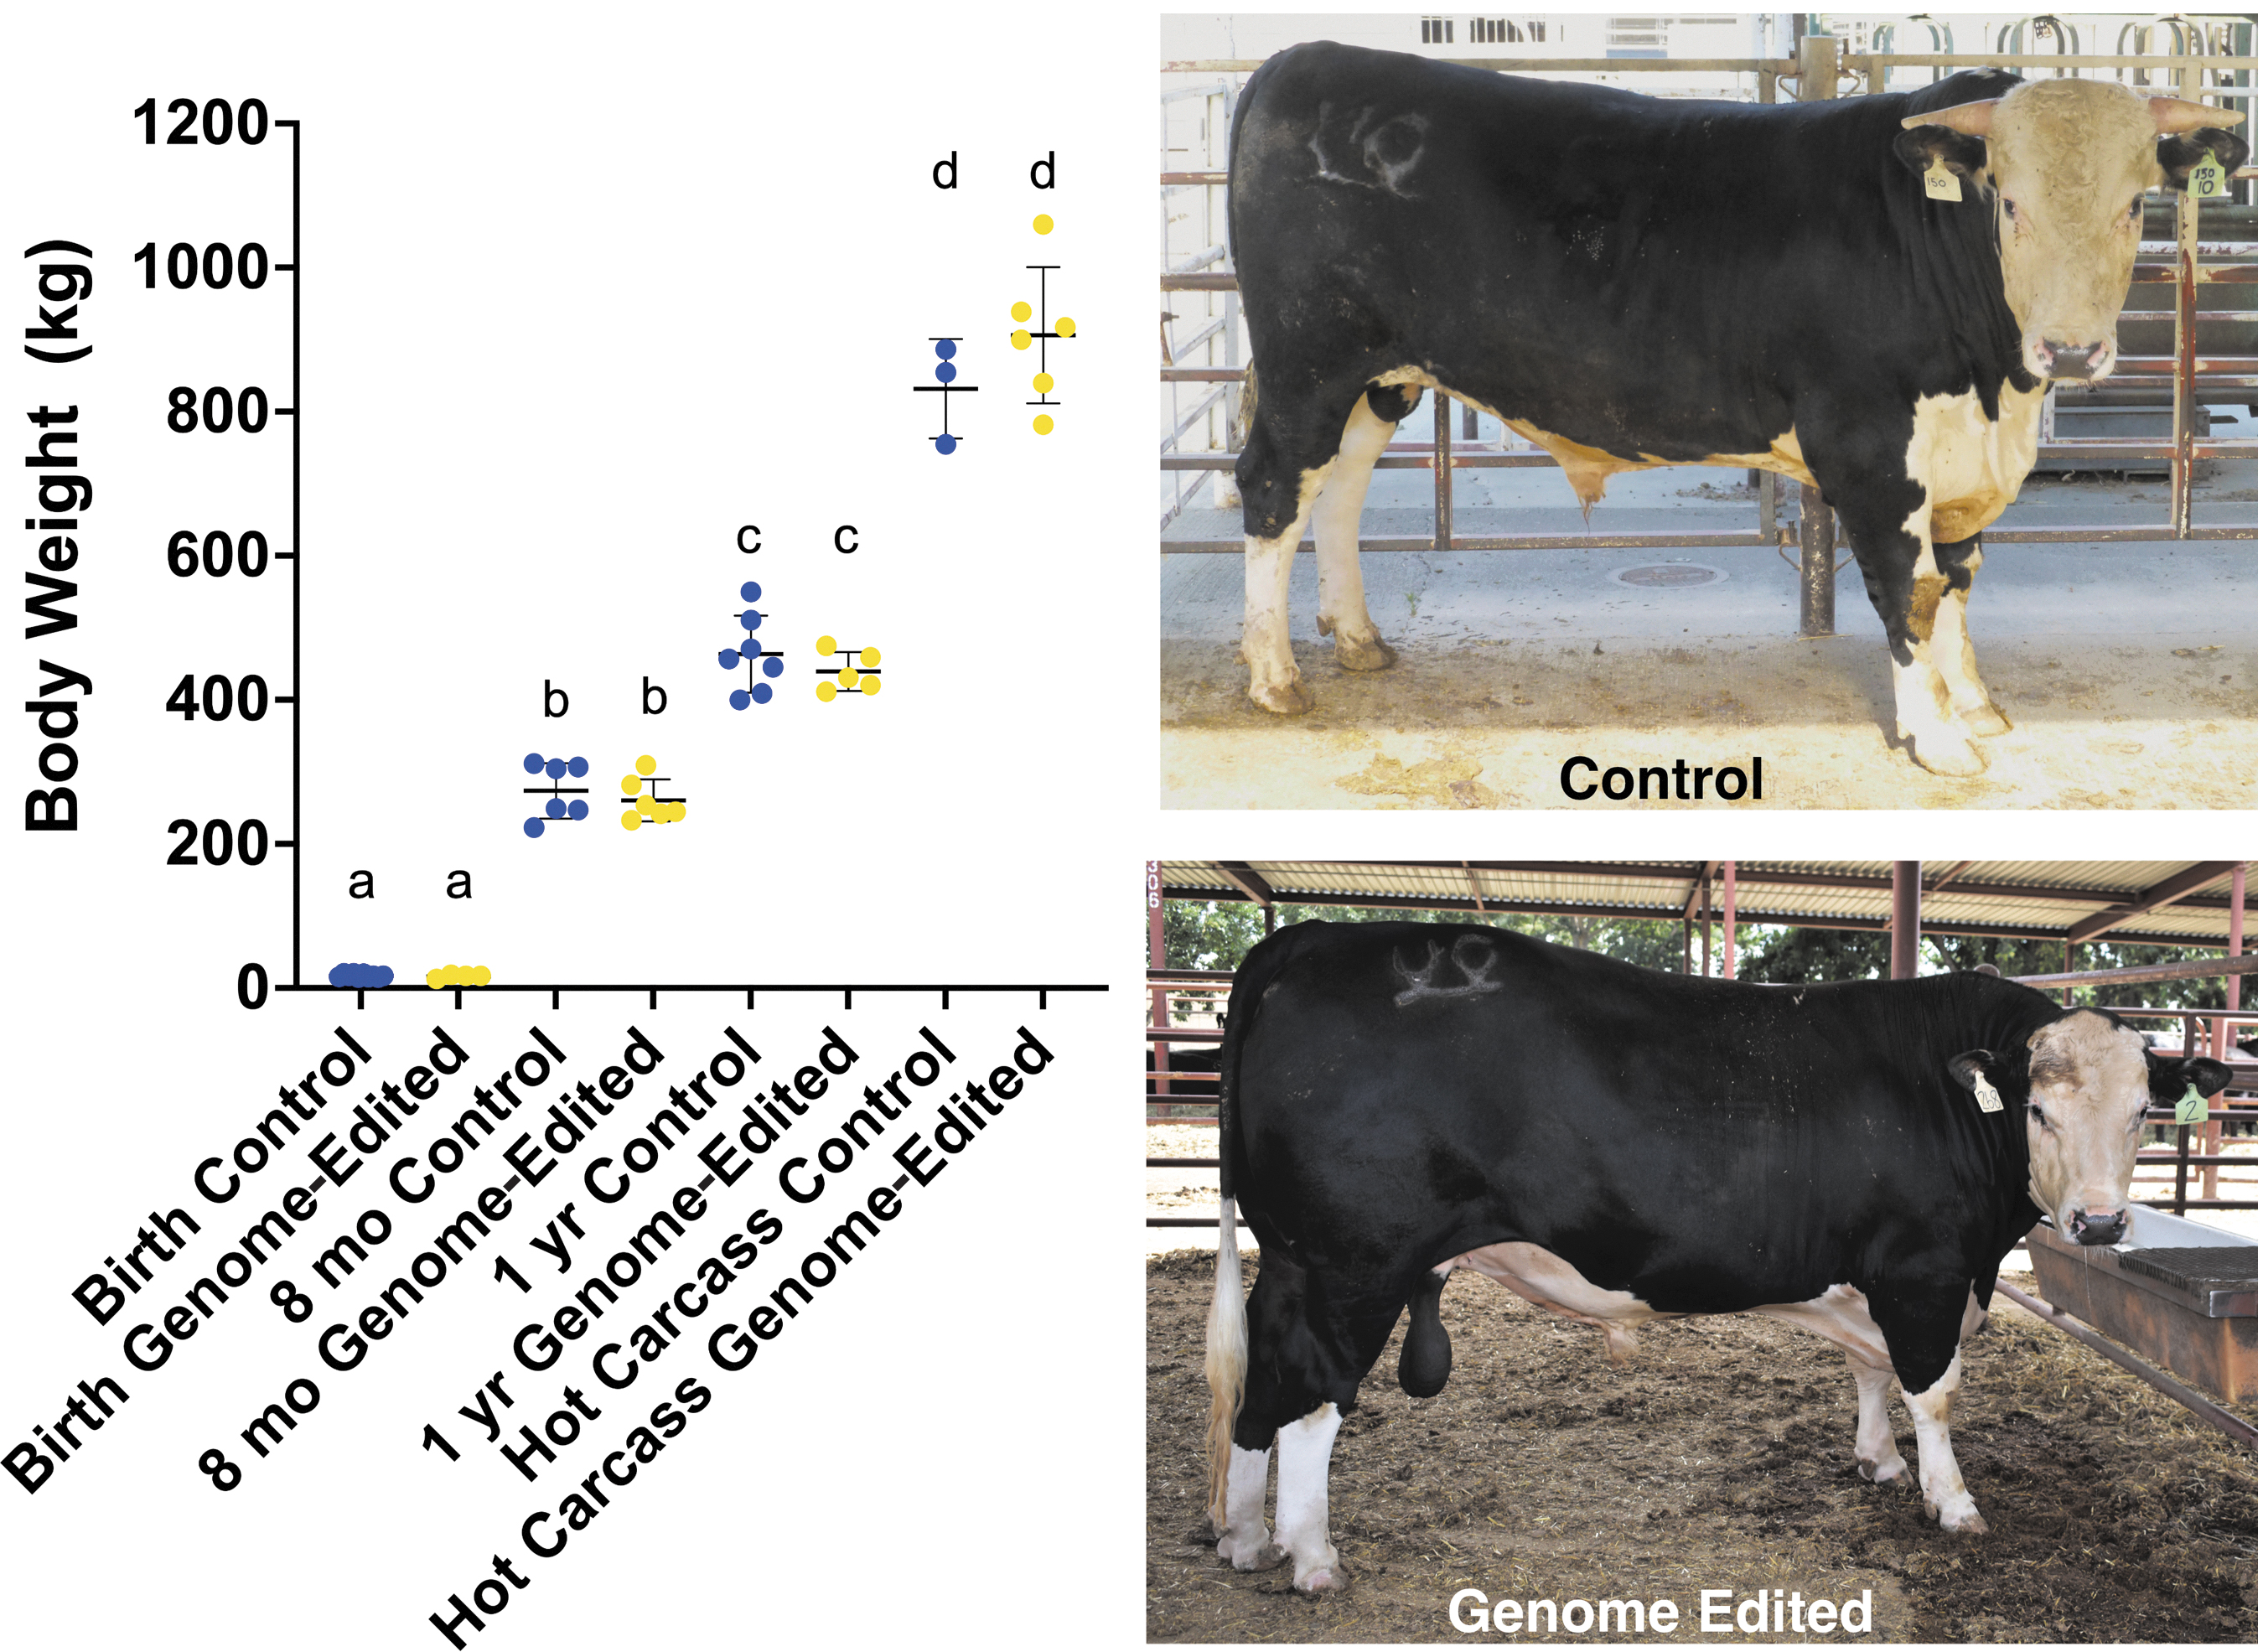
Cattle that inherited a POLLED allele from the GnEd bull (n = 6) showed no differences in their overall growth when compared with contemporary controls (n = 3–10; Fig. 1).
Blood chemistry and hematology
The blood chemistry (Table 1) and hematology (Table 2) values were within normal reference intervals for the age of the cattle for both control and offspring of the GnEd bull except creatine kinase in both groups at ∼12 months of age. There were effects of age on 12 of the hematology and 14 of the blood chemistry measurements, effects of genotype on 6 of the hematology and 2 of the blood chemistry measurements, and interactions between age and genotype on 6 of the hematology and 6 of the blood chemistry measurements (p < 0.05; Tables 1 and 2).
p < 0.05; **p < 0.01; ***p < 0.001; ****p < 0.0001.
AG, anion gap; ALB, albumin; ALP, alkaline phosphatase; AST, aspartate aminotransferase; Bicarb, bicarbonate; BIL, bilirubin total; BUN, blood urea nitrogen; CK, creatine kinase; CON, control; CR, creatinine; GEN, genotype; GGT, gamma-glutamyl transferase; GLOB, globulin; GLU, glucose; GnEd, genome-edited; NS, not significant; SDH-37, sorbitol dehydrogenase; TP, total protein.
p < 0.05; **p < 0.01; ***p < 0.001; ****p < 0.0001.
B, basophils; E, eosinophils; fibr, fibrinogen; GEN, genotype; HCT, hematocrit; HGB, hemoglobin; L, lymphocytes; M, monocytes; MCH, mean corpuscular hemaglobin; MCHC, MCH concentration; MCV, mean corpuscular volume; MPV, mean platelet volume; N, neutrophils; N/A, unbalanced data set, could not do repeated measure analysis; NS, not significant; P, platelets; Plas, plasma; prot, protein; RBC, red blood cells; RDW, red cell distribution width; WBC, white blood cells.
There were also effects of cow-to-cow variation on six of the hematology and three of the blood chemistry measurements (p < 0.05; Tables 1 and 2). Comparing control with GnEd offspring within each time point, there were significant differences at a single time point for red blood cells, monocytes, basophils, bicarbonate, glucose, and albumin, and significant differences at two time points for blood urea nitrogen (GnEd lower at both ∼8 and ∼12 months) (p < 0.05; Table 1).
Breeding soundness
A breeding soundness examination was performed on the five male polled offspring (RC.calves2–6) and five control male offspring (HO1.calves1&3, HH.calves3–5). Four of the five polled bulls were satisfactory potential breeders. One produced semen with good motility (75%) and few abnormal sperm (10%), but his right testicle was undescended. Four of the five control bulls were rated satisfactory potential breeders. One had three attempts to produce satisfactory semen (ranging from 451 to 528 days of age) but each time had >60% abnormally shaped sperm, so a classification was deferred.
The female polled offspring of the GnEd bull (RC.calf1) produced a normal healthy male calf from natural mating with a horned Hereford bull. This offspring was a homozygous HORNED bull, or a null segregant, as determined by polymerase chain reaction (PCR) of his genomic DNA (gDNA) extracted from whole blood (data not shown). The calf died unexpectedly at 4 weeks of age that unfortunately resulted in agalactia in RC.calf1. A necropsy determined the cause of his death was sepsis.
Meat composition
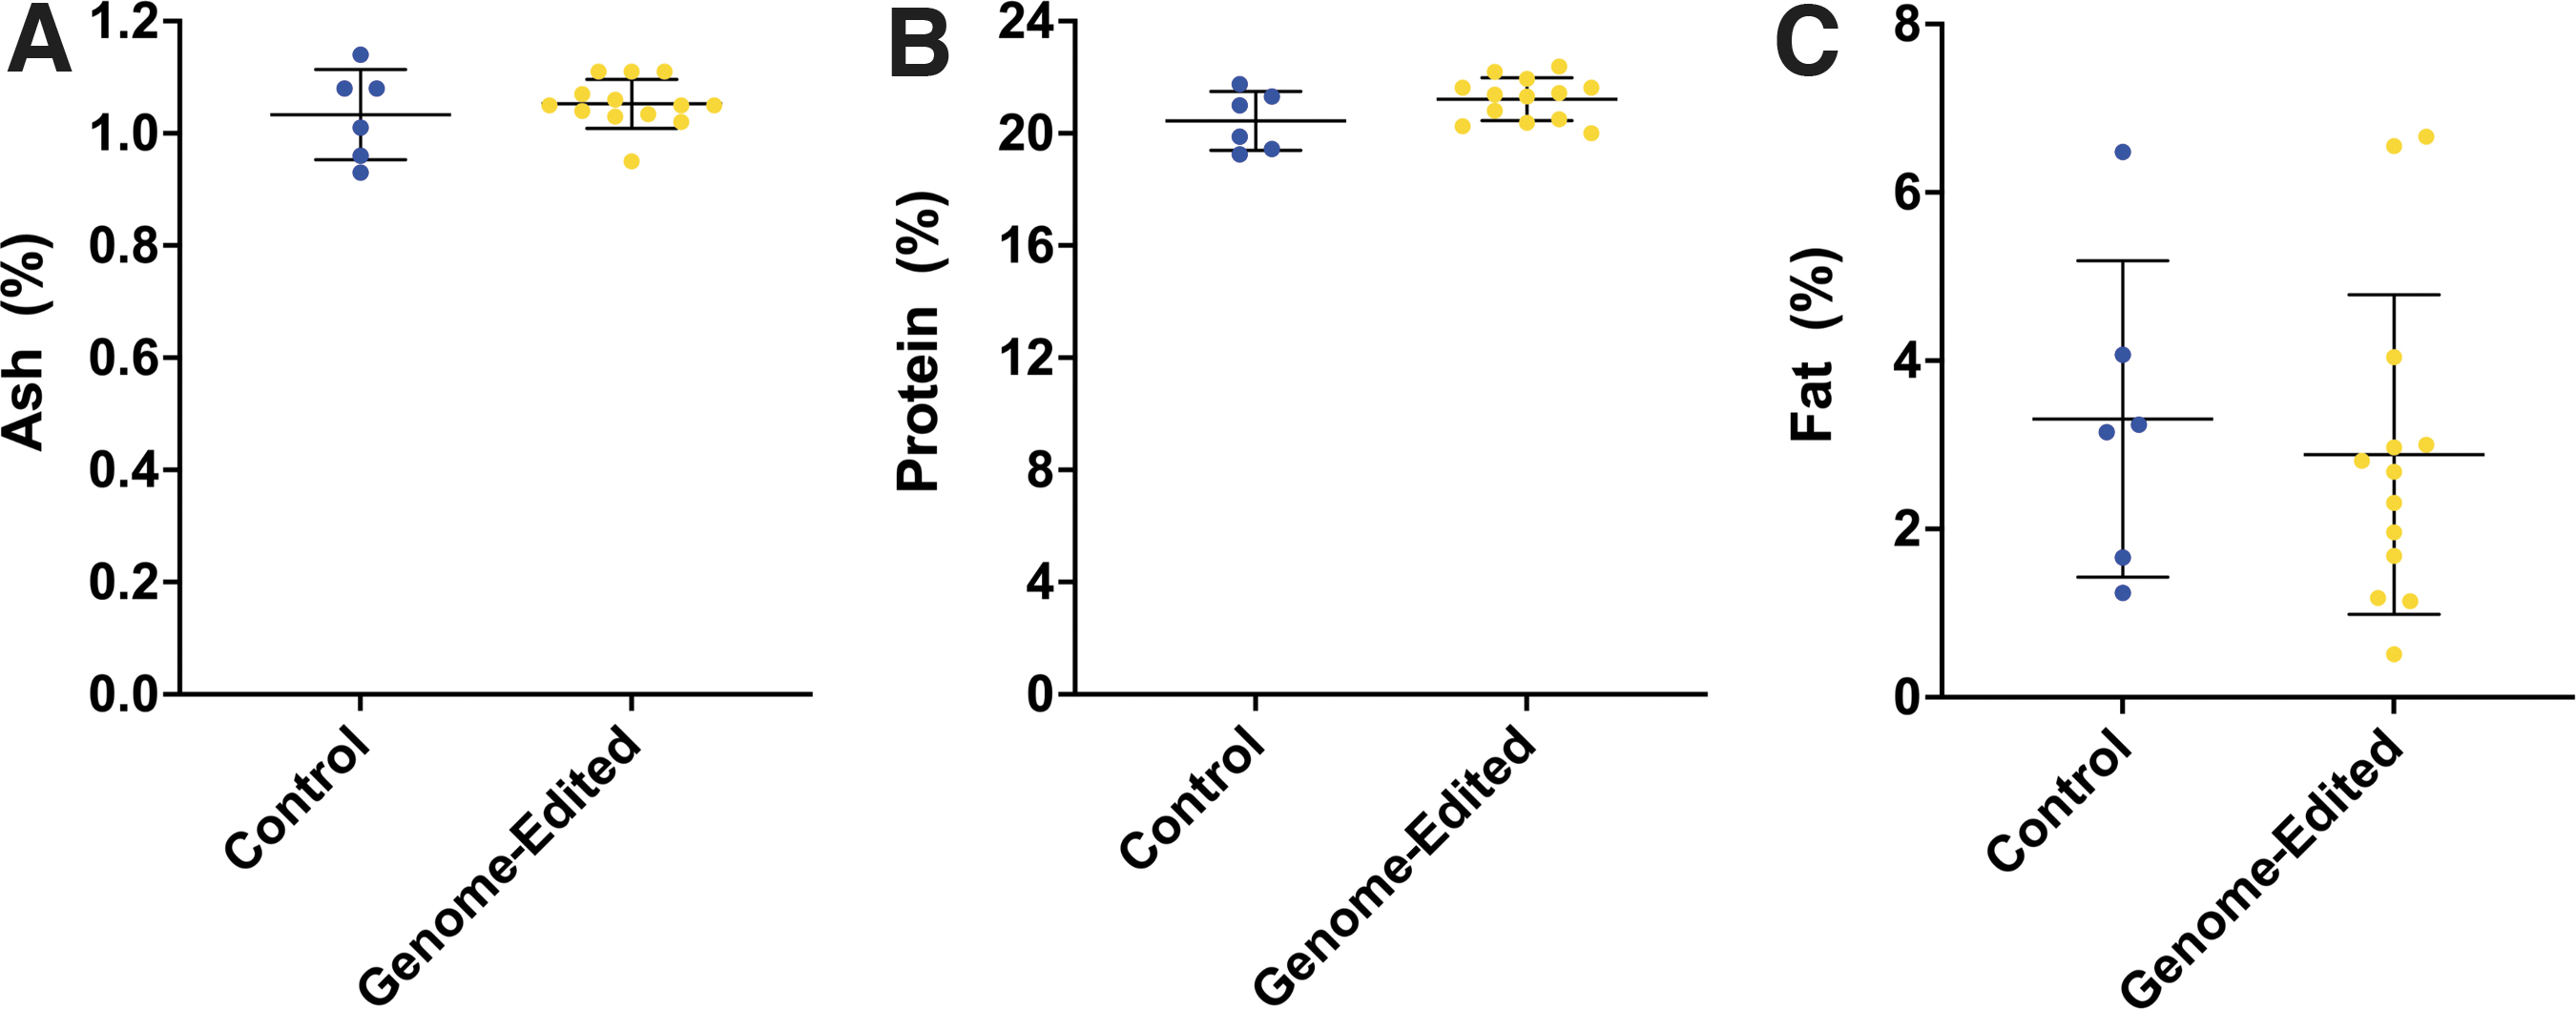
All nutrient values for sirloin cap, chuck arm, and tri-tip collected from polled offspring of the GnEd bull, the GnEd bull itself, and control comparator offspring were within the range of values found in the literature for raw beef composition across 37 countries (Table 3). When we compared the various nutrient levels with those in the control comparator offspring (proximate analyses are in Fig. 2), only one, vitamin B12, was lower (p < 0.05) in the meat from the offspring of the GnEd bull compared with controls, whereas 11 amino acids were found to be in higher (p < 0.05) concentration in the meat from the offspring of the GnEd bull compared with controls (Table 3).
p < 0.05 compared with control cattle.
When the offspring of the GnEd bull and control comparator offspring nutrient levels were compared with the average of published values, the control meat was significantly different from published values in fat (p = 0.0071; Supplementary Fig. S2), iron (p = 0.0115; Supplementary Fig. S4), and vitamin B12 (p = 0.0039; Supplementary Fig. S4), whereas the polled offspring of the GnEd bull meat was significantly different from published values in fat (p < 0.0001; Supplementary Fig. S2), tryptophan (p < 0.0001; Supplementary Fig. S3), and niacin (p = 0.009; Supplementary Fig. S4).
Milk composition
The nutrient values for milk collected from the single heifer offspring of the GnEd bull (RC.calf1) and four control cows (HH.calves1–2, HO1.calf2, #3113) were all within the range of values found in the literature for whole milk, except S (Table 4). When we compared the nutrient levels between RC.calf1 and the control comparators, there were significant differences for true protein %, casein %, Ca %, P %, Mg %, and S %, where RC.calf1 milk had higher levels of all of these nutrients.
%Sulfur values are from both the literature and calculated from the range of % true protein.
p < 0.0001.
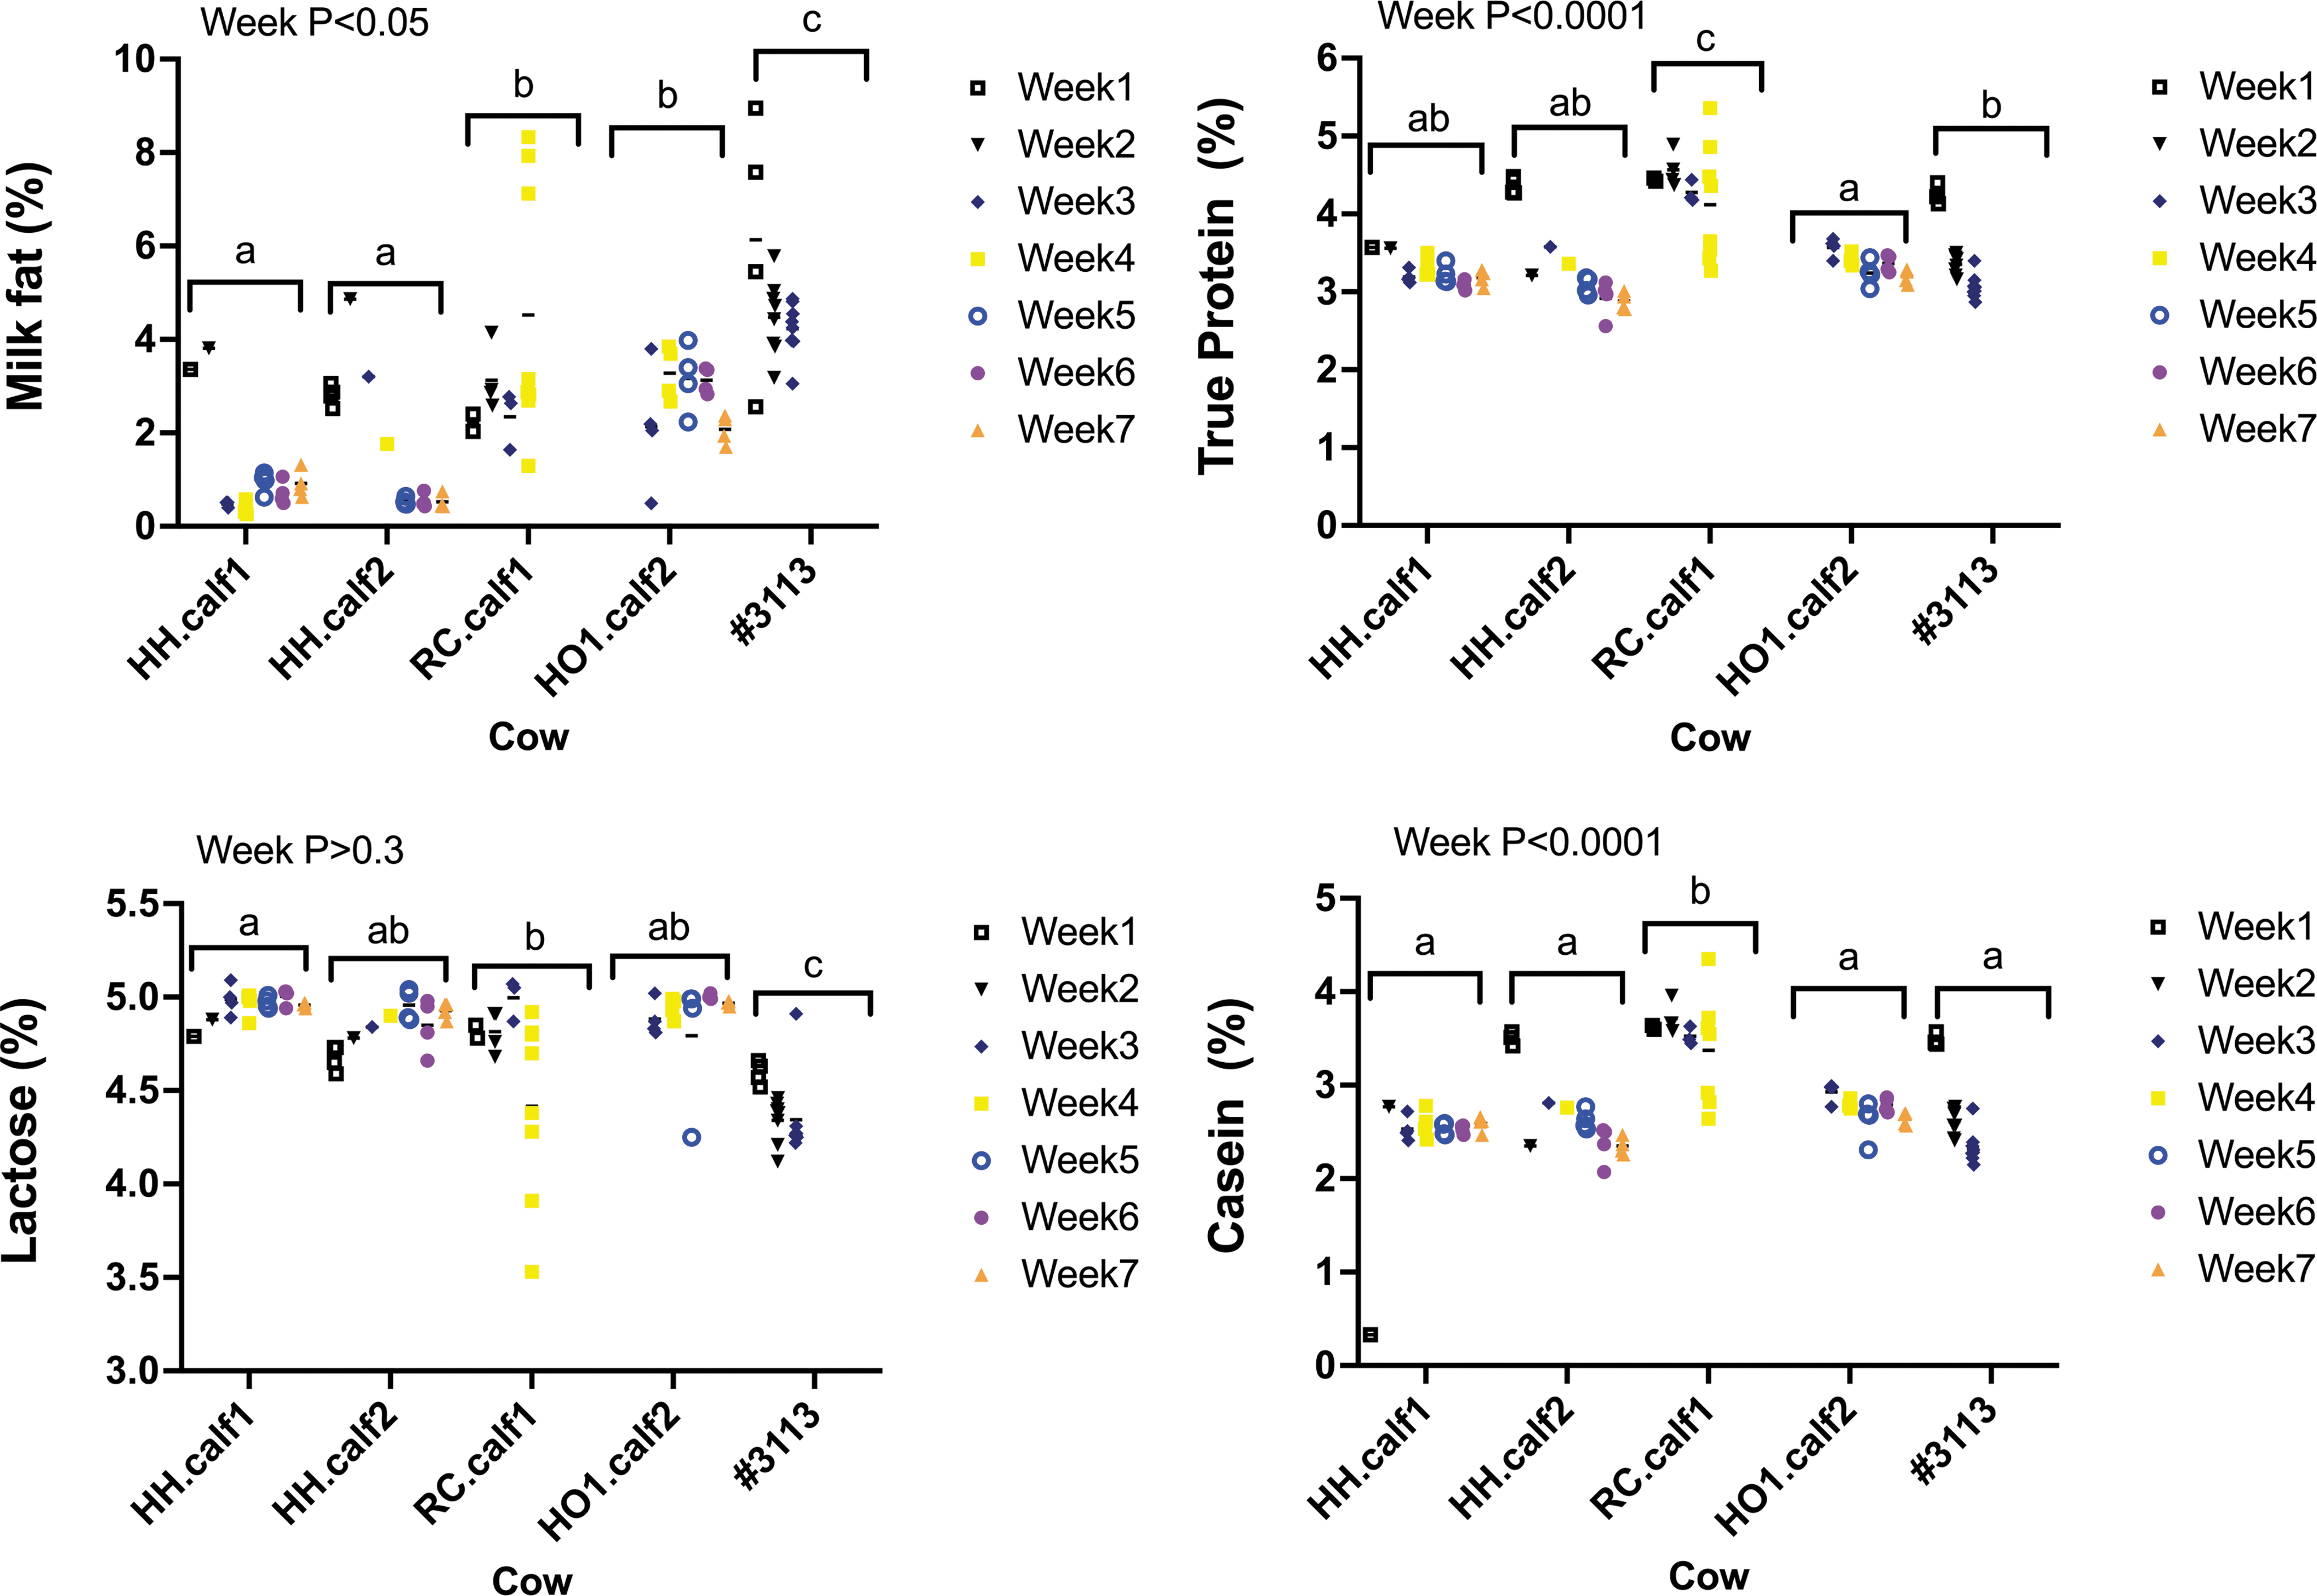
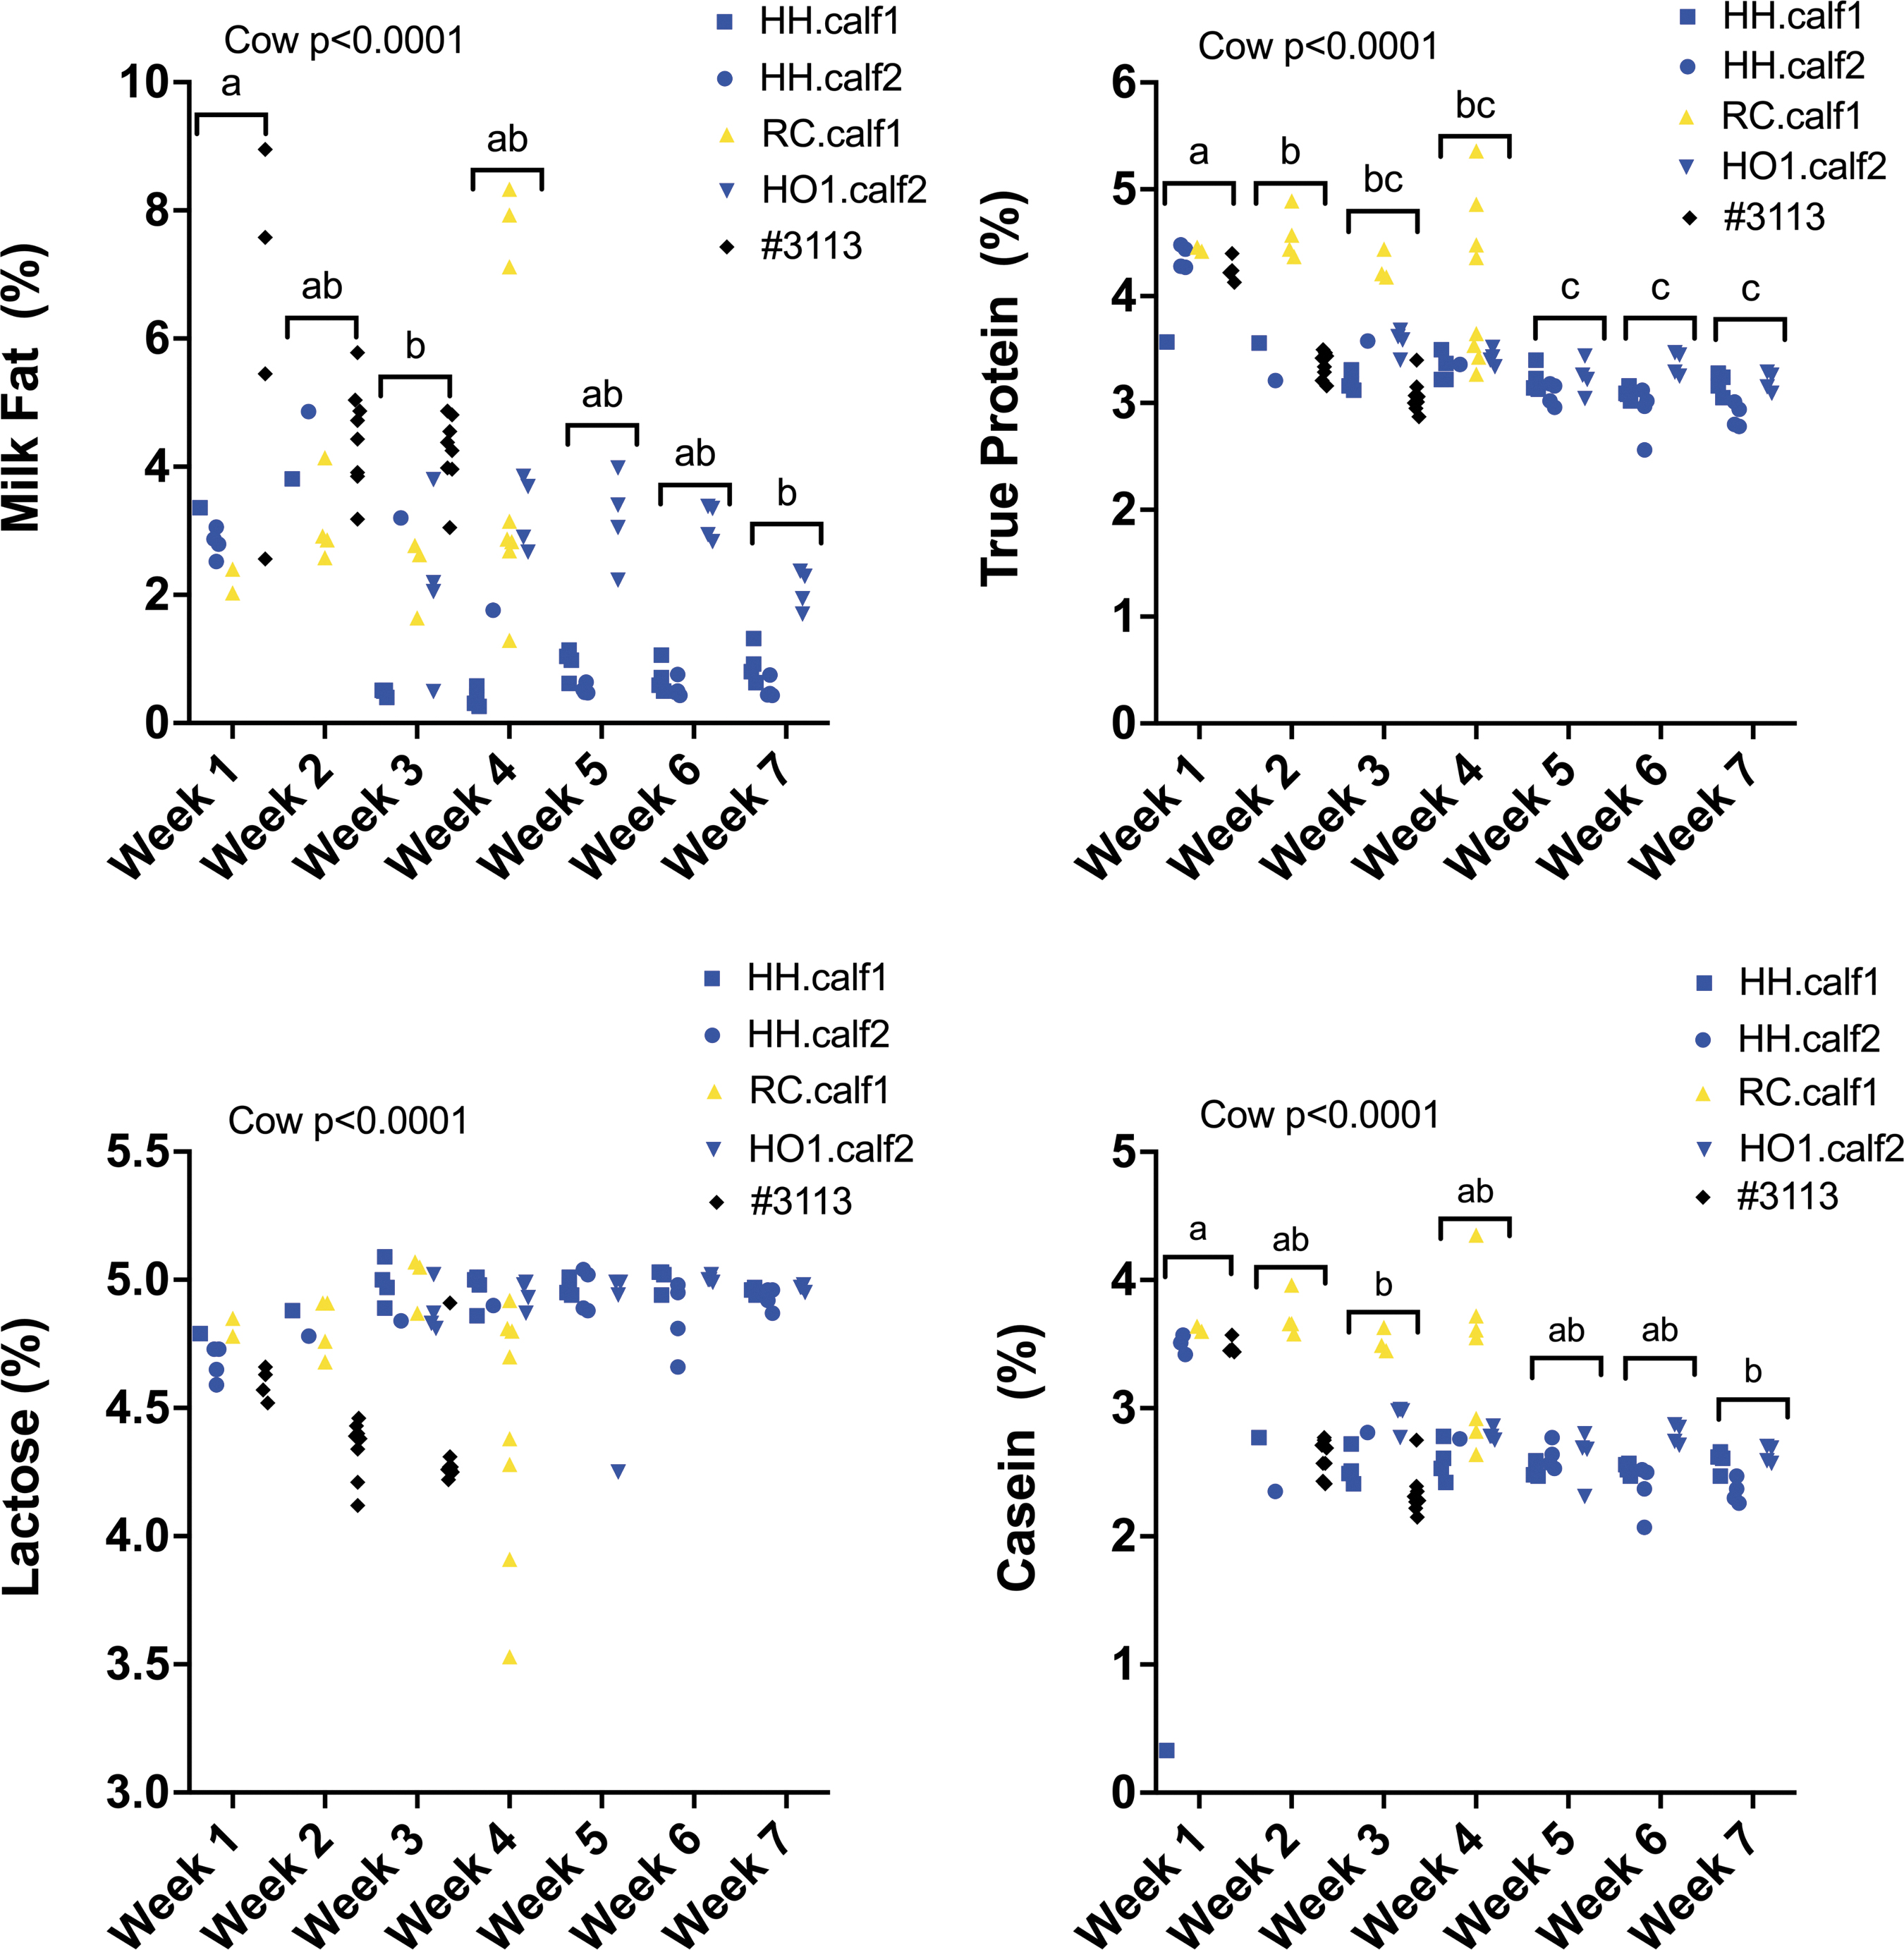
There were also significant differences between individual cows (p < 0.0001; Fig. 3; Supplementary Fig. S5) for all nutrients measured (fat %, true protein %, lactose %, casein %, Ca %, P %, Mg %, Na %, S %, and Cl %). Nutrient levels also varied significantly from week to week (Fig. 4 and Supplementary Fig. S6) for % true protein (p < 0.0001), % fat (p < 0.05), % casein (p < 0.0001), % Ca (p < 0.05), % P (p < 0.002), % Mg (p < 0.0001), and % S (p < 0.01).
Antibiotic residues in meat and milk
Four of the offspring (RC.calves1, 4, 5, 6) inherited an integrated copy of the pCR2.1 plasmid backbone from their GnEd sire. This plasmid backbone encodes a bacterial gene for ampicillin resistance (bla) and a bacterial gene for kanamycin/neomycin resistance (neo). We examined one of these animals (RC.calf1) and her contemporary control (HO1.calf2) for evidence of antibiotic residues in their meat and milk. The levels of aminoglycoside antibiotics (including kanamycin) and β-lactam antibiotics (including ampicillin) in the meat and milk of these two cows were below detection limits (as specified in the Materials and Methods section).
Antibiotic resistance gene expression in meat
We also examined whether the prokaryote promoter in pCR2.1 that is designed to express neo and bla genes in bacteria resulted in expression of these genes in the muscle of cattle carrying pCR2.1 in their genome. We extracted RNA from muscle tissue of the six polled offspring of the GnEd bull (RC.calves1–6) and three contemporary controls (HO1.calves1–3), DNase treated the RNA and used reverse transcription-PCR to detect expression product of the bacterial genes bla and neo. All muscle samples expressed a similar amount of EEF1A2 mRNA, a housekeeping gene (Supplementary Fig. S7).
We detected low levels of expression of bla mRNA in five of the nine meat samples, RC.calf1 and 5 (polled offspring with the plasmid), RC.calf3 (polled offspring without the plasmid), and HO1.calf1 and 2 (comparator controls) (Supplementary Fig. S7). Likewise neo mRNA expression was detected in meat from three animals, RC.calf1 and 4 (polled offspring with the plasmid), and HO1.calf1 (comparator control). We concluded that the low level of expression of bla and neo found in the muscle RNA was due to low level contamination with bacteria carrying common antibiotic resistance genes. Ninety-five percent (20/21) of the bla and neo cDNA (17/18 clones) and gDNA (3/3 PCR products) sequences differed by 1–7 bp from that of pCR2.1 (data not shown).
The rate of single nucleotide polymorphism (SNP) detection in cloned products was 33 SNPs/14,604 bp. We amplified and cloned bla and neo from RC.calf1 gDNA under the same PCR conditions and found that 6/10 clones each had at least 1 bp error, at a rate of 8 errors/8,015 bp. By extrapolation, we predict that 18/33 SNPs across 18 clones (14,604 bp) were accurate and 15/33 were due to GoTaq errors.
Discussion
Animal health evaluations
The Codex Guideline 3 suggests that the health evaluation for rDNA animals should include general health and performance indicators, including behavior, growth and development, general anatomy, and reproductive function, if appropriate; and physiological measures including clinical and analytical parameters. In addition to phenotyping for the intended trait of hornlessness, we measured growth, blood chemistry and hematology, and reproductive function. Every calf underwent a complete physical examination at ∼1 week, 8 months, and 1 year of age.
Cattle that inherited a POLLED allele from a cloned GnEd bull, including the four (RC.calves1, 4, 5, 6) that inherited a copy of the pCR2.1 plasmid backbone in addition to the POLLED allele, had no differences in their growth, overall health, or fertility when compared with contemporary controls. The GnEd offspring and contemporary controls had blood chemistry measures that were within the normal literature range except creatine kinase in both groups at ∼12 months of age.
A few measures of blood chemistry and blood cell counts differed between the offspring of the GnEd bull and contemporary controls at different time points, but never consistently across all three time point measurements. Others have examined similar hematological parameters in the offspring of genetically modified cows that express human lactoferrin proteins in their mammary gland, and no differences were observed between six lactoferrin transgenic bulls and three wild-type comparator control bulls. 11
Food safety evaluations
For the food safety evaluation, the Codex Guideline 3 suggests that analyses of concentrations of key components of the rDNA animal and, especially those typical of the food, should be compared with an equivalent analysis of a conventional counterpart grown and bred under the same husbandry conditions. The stated purpose of this comparison is to establish that substances that are nutritionally important, or that can affect the safety of the food, have not been altered in a manner that would have an adverse impact on human health.
Key nutrients are defined as “those components in a particular food that may have a substantial impact in the overall diet. They may be major constituents (fats, proteins and carbohydrates as nutrients, or enzyme inhibitors as anti-nutrients) or minor compounds (minerals, vitamins).” The guidance states that “the statistical significance of any observed differences should be assessed in the context of the range of natural variations for that parameter to determine its biological significance.”
In discussions with the FDA regarding these GnEd animals, it was communicated that if GnEd animals were to enter the food supply, it would be necessary to provide a nutritional compositional analysis of edible muscle tissues of the investigational animals including key nutrients, and that this should be compared with equivalent analysis of a conventional counterpart. This analysis should focus on muscle, but, if available, could also include data on liver, kidney, and fat.
In addition, information regarding the composition of milk from the heifer was requested if there was an intent for the milk from lactating dairy cows to enter the food supply. Any additional available information that would help with a human food safety evaluation (e.g., any feeding studies performed) or information from the literature was additionally deemed useful, but that such information should be limited to animals edited at the PC Celtic POLLED allele, and not be from animals produced through conventional breeding.
We performed a proximate analysis (moisture, protein, fat, carbohydrate, and ash) on the meat, milk component analysis on the milk (butterfat, true protein, lactose, total solids, freezing point depression, and casein), plus minerals (Fe, Zn in meat; P in meat and milk; Na, Cl, S, Ca, Mg in milk), vitamins B2, B3, B6, and B12 (in meat), and amino acids (in meat). We analyzed individual meat samples from all six offspring of the GnEd bull and conventional comparators and milk from the one female offspring and conventional comparator controls, and also collated milk and meat compositonal data from various sources to provide information regarding statistical significance of any observed differences related to natural variation.
Meat and milk compositional analyses
All nutrient values in the meat from controls and the offspring of the GnEd bull fell within the ranges for conventional beef as documented in the literature. Cattle that inherited a POLLED allele from the GnEd bull showed no differences in proximate analytes (Fig. 2) when compared with contemporary controls; however, there were minor differences in the concentration of vitamin B12 and several amino acid concentrations when comparing the meat of the offspring of the GnEd bull with contemporary controls (Table 3).
As these values were well within the range of natural variation, they are unlikely to be biologically significant. Bovine meat and milk composition is known to be influenced by husbandry conditions, breed, gender, nutrition, parity, and days in milk, making it difficult to obtain appropriate comparators in experiments with a limited number of GnEd animals. The Codex Guideline 3 recognizes this problem stating that “it should be acknowledged that, particularly in the case of certain animal species, the available number of samples may be limited and there is likely to be large variation between animals, even those bred and raised under the same husbandry conditions.”
We saw effects of both the individual cow and the stage of lactation on milk compositional analytes. The protein percentage in the milk produced by RC.calf1 was higher than that produced by the four control cows, whereas #3113 had multiple milk parameters that were significantly different from those of all other cows. Different breeds produce milk of different compositions and the milk composition also changes during lactation. 12 For example, Holsteins have >7% true protein at day 3 of lactation that drops to 2.82% at day 30 of lactation. This is a more extreme difference than changes in milk protein we measured in RC.calf1 from day 7 (4.44% true protein) to day 30 (3.47% true protein) of lactation.
The elevated percentages of casein, Ca, P, Mg, and S in the milk from the polled RC.calf1 heifer are at least partially explained by the higher protein levels seen in her milk. Casein makes up 76–78% of the total protein in milk, 13 and the S content in milk is also determined by the amount of milk protein that includes the S amino acids methionine and cysteine. Similarly, the percentages of Ca, P, and Mg are all correlated with the protein content of milk. 14 One of the issues with our milk data is that we only had a single GnEd female offspring of the GnEd bull (RC.calf1) to work with, and milk composition is known to vary considerably between individuals. In addition, we did not have a large number of appropriate comparator controls available.
The FDA's legal standard of identity of milk is “the lacteal secretion, practically free of colostrum, obtained by the complete milking of one or more healthy cows.” It is further stipulated that milk that is in final package form for beverage use must “contain not less than 8.25% milk solids, not fat and not less than 3.25% milkfat.” Similarly, for the Australian and New Zealand governments, a food that is sold as cow's milk must be milk from cows and contain no less than 32 g/kg of milkfat, and contain no less than 30 g/kg of true protein. 15
By these standards, both the offspring of the GnEd bull and contemporary controls produced some milk samples that were nonsalable when analyzed on an individual quarter basis (Fig. 3), but in practice, the milk that is in final package form for beverage use is mixed together in bulk from a large number of animals and adjusted to meet these nutrient specifications. Similarly, the requirements for bovine meat being sold in Australia/New Zealand are that meat flesh consists of skeletal muscle and any attached animal ride, fat, connective tissue, nerve, blood, or blood vessels. 16 Nutritionally, dried meat is required to be <15% water and ≥16% protein. All of our raw meat samples from GnEd animals contained at least 20% protein when fully hydrated (at least 68.8% moisture).
Two genetically engineered (GE) animals have so far been approved for food use in the United States, the AquAdvantage GE salmon first reported in 1992, 17 and GalSafe® pigs first described in 2003. 18 The compositional analysis for approval of the salmon included tissue samples from a total of 73 salmon analyzed for proximates, minerals, vitamins, amino acids, and fatty acid content. In those analyses, the average value for each analyte derived from 30 diploid and triploid GE (“treated,” TX) fish was compared with 33 Atlantic Salmon contemporary controls (“sponsor control,” SC) raised alongside the TX fish, and 10 non-GE diploid and triploid farmed Atlantic salmon (“farm control,” FC) from commercial farms in Maine and Canada.
It was determined that if the results were SC ≤ TX ≤ FC, the results for TX salmon were considered to be similar to “control salmon” (SC and FC salmon) results. If the mean for the TX salmon fell outside the range of either the SC or FC group, the minimum and maximum values (extreme values) for the TX salmon were compared with the range of values from the SC and FC salmon. If these extreme values from the TX salmon did not fall outside the range of values from the SC and FC salmon, the results for TX salmon were considered to be similar to “control salmon” results.
If TX salmon were not considered similar to “control salmon,” individual values were then compared, and if the individual values for the TX salmon were not more than 10% beyond the range of values for the individual “control salmon,” the values for the TX salmon were considered to be within normal biological variability and thus similar to the “control salmon.” 19
Using an analogous rationale, all of the milk or meat compositional data we obtained from the six offspring of the GnEd hornless bull were within normal biological variability and thus similar to the control cattle data with the exception of milk S %, where some of the contemporary controls and many of the milk samples from the single polled female offspring had a higher S % than was observed in the literature. This may be methodological as very few actual calculations of milk S % are published and we had to calculate milk S % from published milk protein values. In our methods, we justify our calculated ratio of true protein–S to be 108.6 g/g.
Other publications have calculated ratio of true protein–S to be 129.9 g/g based on using different values both for nonprotein nitrogen in milk and for the methionine and cysteine composition of milk protein. 20 Our actual measurements found the true protein–S ratio to be exactly the same in the milk from both the contemporary control group (n = 70) and the milk from the polled offspring of a GnEd bull (n = 19): 84.0 g/g (SD 5.6) and 83.7 g/g (SD 3.9), respectively. So although the average S % we found for the polled offspring of a GnEd bull was marginally higher than the literature range, this can justifiably be considered to result from the elevated % true protein in the milk.
We calculate that there is actually 3.78 g methionine/100 g crude protein (CP) and 1.26 g cysteine/100 g CP in cow's milk, rather than 2.97 g/100 g CP and 0.94 g/100 g CP, respectively, as measured by Pieniaźek et al., 21 given that methionine is 21.8% S and cystine is 23.7% S, and the ratio of methionine to cystine in cow's milk is 3:1. 22 Our finding of elevated milk S % compared with actual or calculated literature values does not raise any nutritional or other safety concerns regarding human consumption of this milk, and in fact almost certainly reflects an elevated protein concentration in these milk samples.
Recently, the FDA concluded that there was a reasonable certainty of no harm for human consumers of food from GalSafe pigs after nutrient analysis of a single pooled tenderloin sample per group. These pooled samples comprised meat from at least three litters of homozygous (n = 5) and hemizygous (n = 5) GalSafe pigs, along with conventional comparator contemporary control pigs. Samples were pooled by genotype and analyzed for 93 different analytes, including moisture, protein, fat, ash, calories, carbohydrates, dietary fiber, fatty acid profile, mineral profile, selenium, cholesterol, sugar profile, vitamin profile, and amino acid profile.
A freedom of information request summary available on the FDA website stated, “Most values fell within 20% of reference values for raw pork tenderloin from the National Nutrient Database for Standard Reference available from the USDA (USDA, FoodData Central). Of the 19 values reported to be >20% different from the USDA database, only three values (Total Trans Fat %, Saturated Fatty Acid [C12:0], and Niacin) had a >20% difference between GalSafe pigs and the comparator pigs. These values were 23.8%, 22.4%, and 23.3% different from the comparator control pigs, respectively, suggesting that the differences were due to either the small sample size, husbandry/feeding practices, or the processing of the samples. Additionally, the live weight for three of the five GalSafe pigs at slaughter was greater than the average live weight of typically marketed pigs, which may explain the higher fat/fatty acid content.”
Based on these data, it was determined that there were no toxicological or nutritional hazards to humans consuming the GalSafe edible tissues. 23 In the current experiment, some of our values differed by >20% from the comparator controls (Tables 3 and 4); however, this was not always statistically significant, and was within the range reported in the literature except for the milk S % as previously discussed.
An indiscriminate requirement to peform a nutritional compositional analysis of edible products including “key components of the recombinant-DNA animal and, especially those typical of the food” as outlined in the Codex Guideline 3 for traits like polled that are not designed or expected to impact meat and milk composition provides little useful data to inform food safety assessments. In addition, in the absence of any criteria to determine which key components in animal products pose a human food safety hazard, and at what levels of increase or decrease (i.e., effect size), it is not possible to perform sample size calculations.
Value versus expense of comparator controls
Given the expense and difficulty of obtaining appropriate comparators in experiments with a limited number of GnEd animals, it is worth considering the value of generating contemporary comparator data. It costs ∼$1,500 per year to feed and maintain one animal at the UC Davis beef facility. Meat nutritional analysis cost $948 per sample for our full analysis (proximate analysis, 18 amino acids, Fe, Zn, P, riboflavin, niacin, and vitamins B6 and B12), which does not include all compositional analytes that could be analyzed in meat (e.g., additional minerals and vitamins plus a fatty acid analysis).
Our milk analysis cost $42 per sample in the United States, but the equivalent testing in Australia, for example, was priced out at $500 per sample (for lactose, butterfat, true protein, casein, Ca, Na, P, Mg, S, and Cl). If there is a statistical difference in compositional analytes between the GnEd animals and conventional comparators, but all of the values lie within those located in the literature or standard database reference values, this difference is not likely to be a nutritional hazard.
The generation and maintenance of conventional comparators are expensive and impracticable, if not an unfeasible undertaking for experiments in which no conventional comparators are routinely being produced or raised (e.g., nonedited animals of the same genotype). In our experiment, we intentionally produced and raised three control horned Holstein bull × horned Hereford calves to serve as conventional comparators, one of which was female (HO1.calf2). Although meat from these comparator animals was able to be sold at the end of the experiment to help defray their expenses, as distinct from the offspring of the GnEd bull that cannot enter the food supply under U.S. regulations, this approach adds significant expense to GnEd animal experiments, especially with large livestock species.
It is also at odds with the guiding principles of the three Rs of animal experimentation (i.e., replacement, reduction, and refinement), which calls for a reduction in the number of animals used in research to the minimum needed without meaningfully diminishing the amount and quality of information gleaned from experiment. 24
It has been proposed that the compositional assessment of GE organisms should follow a stepwise approach to determine what, if any, compositional data generation is necessary. 25 If traits are designed to affect or regulate biochemical pathways and cascades, hypothesis-driven compositional studies looking at affected pathways might well be warranted. 8 The list of compositional analytes that pose a potential human food safety hazard should be based on a hypothesis generated by the nature of the trait being introduced. 26 Experiments can then be designed to measure the appropriate key nutrients to test that specific hypothesis.
Antibiotic resistance genes in food
In the case of the GalSafe pig, the FDA identified the nptII gene (also known as the neo gene), as a potential human food safety hazard. This gene encodes the aminoglycoside-3′-phosphotransferase enzyme under the control of an α1,3-galactosyltransferase promoter in the pPL657 rDNA construct in the GalSafe pig genome. The nptII gene is already widely distributed among soil and enteric bacteria, and confers resistance to aminoglycoside antibiotics (e.g., kanamycin, neomycin, geneticin) that have no or only limited therapeutic relevance in human and veterinary medicine. 27
One safety stipulation was that these pigs be raised without the use of aminoglycosides to treat bacterial infections. The producers of GalSafe pigs are also required to collect, isolate, and test bacteria collected during different life stages of the GalSafe pigs to monitor for development of resistance to aminoglycosides. 23 Horizontal gene transfer from the genome of the GalSafe pigs to their microflora in the absence of a transposable element or a transfer vector organism 28 is highly unlikely.
In this study, we assayed milk and meat samples for antibiotic residues, and meat samples for the expression of antibiotic resistance genes. This was done in part due to our previous publication detailing that four of the six polled offspring of a GnEd bull (RC.calves1, 4, 5, 6) inherited a copy of the pCR2.1 plasmid backbone in addition to the POLLED allele. 10 The integrated plasmid sequence includes two bacterial antimicrobial resistance genes: one for β-lactam resistance (bla) and the other for kanamycin/neomycin (aminoglycoside) resistance (neo) under the control of a prokaryotic promoter to facilitate growth and selection of the plasmid in bacteria.
However, these analyses were also done in part to address confusing reports after the publication of a preprint, 29 after which numerous sources claimed that these cattle would contribute to the development of antibiotic resistant bacteria.30–34 One article 35 even went so far as to erroneously claim that a Cas9-expressing plasmid had been introduced, “sparing the scientists the complexities of dealing with unstable protein.”
The Codex Guideline 3 states, “Gene transfer from animals and their food products to gut microorganisms or human cells is considered a rare possibility because of the many complex and unlikely events that would need to occur consecutively. Nevertheless, the possibility of such events cannot be completely discounted.” The latter statement is qualified with regard to food containing antibiotic resistance markers by adding, “In cases where there are high levels of naturally occurring bacteria which are resistant to the antibiotic, the likelihood of such bacteria transferring this resistance to other bacteria will be orders of magnitude higher than the likelihood of transfer between ingested foods and bacteria.” The genetic basis for antibiotic resistance was present long before the introduction of antibiotics. 36
In assessing whether antibiotic resistance marker genes represent a potential human food safety hazard, the Codex Guideline 3 recommends considering whether the antibiotic resistance genes are already widely distributed among soil and enteric bacteria, and the clinical and veterinary use and importance of the antibiotic in question. 27 The β-lactam and aminoglycosides are two classes of antibiotics for which resistance genes are widespread among many bacterial species. 37
The bla gene is widespread in enterobacterial genera such as Escherichia, Haemophilus, Neisseria, and Salmonella, and confers resistance to β-lactam antibiotics (e.g., ampicillin, penicillin G, and amoxycillin) that are used for therapy only in defined areas of human medicine, although they are used extensively in livestock and equine medicine. And as discussed earlier with regard to the nptII (or neo) gene, aminoglycoside antibiotics have no or only limited therapeutic relevance in human and veterinary medicine, 27 being used mostly in equine medicine.
None of the animals in the study were treated with any antibiotics during their lifetime, and unsurprisingly we could not detect any antibiotic residues in milk or meat from either RC.calf1 or contemporary comparator HO1.calf2. Both bla and neo mRNA were occasionally detected in meat samples from both control and polled offspring of the GnEd bull with and without the plasmid in their genome. Almost all (95%) of the bla and neo cDNA sequences that were cloned from these meat samples had polymorphisms ranging from one to seven as compared with the reported sequence of these genes in the pCR2.1 plasmid (data not shown), presumably derived from naturally occurring bacteria on the meat samples carrying these widespread antibiotic resistance genes. This rate of SNPs detected was 2.3-fold higher than the rate of proofreading error due to Taq polymerase.
Antibiotic resistant bacteria have been detected on meat samples from multiple species in other studies including raw chicken,38,39 pork, 40 beef, and turkey. 41 A recent study examined the level and types of antibiotic resistance found in the oral bacteria of humans eating meat or other animal products as compared with humans on a vegan diet (for at least a year before the study was undertaken), and no differences between the groups were observed. 42
Hazard identification and food safety assessments
The data presented in this study and our earlier report 10 provide the types of data suggested by the Codex Guideline. 3 Similar to rDNA plants, core molecular studies characterizing the nature of the alteration and presence of unintended plasmid sequences should be evaluated as a routine part of food safety assessments as was done in our studies. In the past decade, after the editing of the cell line that produced the original founder GnEd polled bull, 43 there have been many advancements in GnEd including the increased use of ssDNA repair templates, 44 which obviates the need for the use of a donor plasmid. This effectively precludes the possibility of integration of donor plasmid sequences in the end product.
If a novel protein is expressed in GnEd animals, then protein characterization and hazard identification encompassing toxicity and allergenicity should be performed on the resulting food products as a part of the core protein characterization studies for food safety assessments. It has been proposed 26 that additional studies should only be required when a food safety hazard is identified in the first set of core molecular and protein characterization studies. 25 And furthermore, that problem formulation should be employed to design hypothesis-driven supplementary studies that should only be performed to characterize hazard and exposure when a hazard is identified. Both hazard identification and exposure are required to calculate the potential risks, if any, posed by GnEd animals.
Conclusions
In the case of the PC Celtic POLLED allele, there are no novel expressed substances or expression products to assess for toxicity, bioactivity, and allergenicity; nor was there any biological reason to hypothesize that the polled phenotype would have major impacts on the composition of milk and meat. The health and product compositional data we collected for a 2 year period suggested that the six polled offspring of the GnEd bull were healthy, and products derived from them were nutritionally similar to contemporary comparator cattle and within the norms of known biological variability.
In the absence of any biologically plausible hypothesis for an adverse effect resulting from the PC Celtic POLLED allele substitution, measuring a catalog of compositional analytes does not provide useful information to inform food safety assessments, given the well-established background compositional variation known to exist in milk and meat.
The Bigger Picture
Materials and Methods
Animals
All animals were housed at the UC Davis Beef Barn and managed by facility personnel as approved by the UC Davis Institutional Animal Care and Use Committee (protocol #18855). The breeding of the cattle was described by Young et al. 10 . In brief, 16 contemporary animals were included in this study (Table 5), 12 of which were described by Young et al. 10 These 12 have had their genomes sequenced and include 6 polled offspring of the homozygous GnEd polled bull (RCI002) RC.calves1–6, 3 horned offspring of the Horned Holstein sire of RCI002 (CO-OP OMAN LOGAN-ET; HO1), HO1.calves1–3 (Supplementary Fig. S1), and 3 purebred Horned hereford offspring HH.calves1–3.
AN, Angus; full, meat analyzed for proximates, amino acids, four vitamins, three minerals; GnEd, genome-edited; HH, horned Hereford; HO1, Holstein bull CO-OP OMAN LOGAN-ET; RCI002, RCI-002 BURI-ETN; partial, meat analyzed for proximates, vit B12 and iron; Pc#, GnEd Pc including pCR2.1 plasmid sequence; Pc*, GnEd Pc; Pc, Celtic POLLED allele.
Four additional comparator animals were included, all of which were born to Horned hereford cows: two were polled and sired by an Angus bull (AN.calves1–2) and two were purebred Horned Herefords sired by a third Horned hereford bull (HH.calves4–5). One cow was also included, 3113, a Horned hereford × Angus crossbred cow (Table 5). She was not initially included as a contemporary control animal, but she calved at a similar time to RC.calf1 and was under similar husbandry conditions and as such provided a milk comparator for this cow. Milk was collected from her for 3 weeks at which stage she rejected her calf and ceased producing milk.
Veterinary examinations
Calves (n = 6 GnEd offspring; n = 10 controls) underwent a complete physical examination at ∼1 week, 8 months, and 1 year of age. At the time of each physical examination, blood was drawn from the jugular or tail vein into evacuated tubes spray coated with K2 EDTA (Becton Dickson and Company, NJ) and analyzed for both complete blood counts and blood chemistry by the UC Davis Veterinary Medical Teaching Hospital. The typical reference range for blood analytes from 1 week old, 8 month old, and adult cattle was sourced from two veterinary medical teaching hospitals,45–48 and other primary publications.11,49–57
Where available, minimum and maximum values were used as the range of reference values. Otherwise, the calculation of mean ± 2 × SD was used to generate a 95% confidence interval as a reference range of values.
The average ages for the 1 week, 8 months, and 1 year veterinary examinations and blood draws were 9, 250, and 377 days for the offspring of the GnEd bull; and 11, 263, and 387 days for the control offspring. After the 1 year health examination, the bulls were subjected to a breeding soundness examination, following the standards set forth by the Society for Theriogenology, including semen collection through electroejaculation and analysis for sperm motility and morphology.
The average age for the breeding soundness examination was 447 days for the offspring of the GnEd bull and 440 days for the control offspring. The offspring of the GnEd bull were killed by captive bolt at ages ranging from 643 to 1,137 days at the UC Davis Veterinary School and incinerated. The control offspring were killed by captive bolt at the UC Davis meat laboratory at ages ranging from 587 to 1,045 days.
Meat analysis
A sample of both sirloin cap and chuck arm was dissected from the carcasses of the polled offspring of the GnEd bull (RC.calves1–6) and controls (HO1.calves1–3), trimmed of excess fat, and frozen at −80°C. A sample of tri-tip was dissected from the carcass of the GnEd bull and frozen at −80°C. The muscle was analyzed by Eurofins Microbiology Laboratories (Garden Grove, CA) by proximate analysis (n = 13 GnEd offspring; n = 6 control; Table 5) as well as for 18 amino acids, Fe, Zn, P, riboflavin, niacin, and vitamins B6 and B12 (n = 8 GnEd offspring; n = 4 control; Table 5), using AOAC International methods (Rockville, MD).
Reference nutrient data for beef were sourced for cuts of raw meat in comparable areas of the carcass to our sampling sites (sirloin cap and chuck arm) and included chuck, flank, filet, sirloin, striploin, tenderloin, stewing steak, ground beef, short ribs, shoulder, flat ribs, beef steak, beef back (Austria only), blade (Australia, France and Italy only), and buttock/rump (Argentina, Italy, Australia, New Zealand, United Kingdom, Serbia, Sweden, Netherlands, and Slovenia only).
Nutrient data for U.S. beef or beef imported from Australia graded either USDA Choice or Select were sourced from the USDA National Beef Database. 58 These animals were younger than 42 months of age. 59 Nutrient data for beef from 22 European countries (Austria, Belgium, Czech Republic, Denmark, Estonia, Finland, France, Germany, Iceland, Italy, Lithuania, Netherlands, Norway, Poland, Portugal, Serbia, Slovakia, Slovenia, Spain, Sweden, Switzerland, and the United Kingdom), plus Pakistan, Tunisia, Japan, Iran, and Canada, were sourced from EuroFIR Food EXplorer (membership required) or from individual country databases listed on their site. 60 Nutrient data from New Zealand, 61 Mexico, 62 Colombia, 63 West Africa, 64 Argentina, 65 Brazil, 66 Peru, 67 and Turkey 68 were sourced from individual country databases (Supplementary Table S1).
Milk analysis
Calves were separated from their dams (n = 5) for 2–12 h before milking. Milk was collected by hand milking once or twice weekly, at lactation stages ranging from day 7 (week 1) through day 53 (week 7) of lactation. All four quarters were collected individually at each milking except for five collections wherein samples were combined from all quarters due to the small quantities obtained. Milk was placed immediately on ice, and a Broad Spectrum Microtab® II (Advanced Instruments, Inc.) pellet was dissolved in the milk before freezing at −20°C. Milk collected for antibiotic residue testing from RC.calf1 (day 29 of lactation) and HO1.calf2 (day 46 of lactation) was pooled equally from all four quarters and frozen without the addition of a Microtab II pellet.
Milk samples (n = 101) were analyzed for moisture (%), fat (%), true protein (%), lactose (%), solids (%), freezing point depression (%), and casein (%) using Fourier Transform Infrared Spectroscopy (Dairy One Cooperative, Ithaca, NY). Most of the samples (n = 93) were of a sufficient volume to also be analyzed by Dairy One for Ca %, P %, Mg %, Na %, S %, and Cl %. For Ca, P, Mg, Na, and S, samples were digested using a CEM Microwave Accelerated Reaction System (MARS6), with MarsXpress Temperature Control, using 50 mL calibrated Xpress Teflon PFA vessels with Kevlar/fiberglass insulating sleeves (CEM, Matthews, NC). The digested samples were then analyzed by inductively coupled plasma (ICP) using a Thermo iCAP 6300 ICP Radial Spectrometer (Thermo Scientific, Waltham, MA).
The chloride ion was measured using potentiometric titration. In brief, 1–5 g milk was extracted for 15 min in 50 mL 0.1 N HNO3, followed by potentiometric titration with AgNO3 (0.01 or 0.10 N) using a Metrohm 905 Titrando Titration Unit equipped with an Ag-ring electrode, controlled by Metrohm Tiamo software (Dairy One).
Nutrient data for fluid cow milk were sourced from online nutrient databases,69,70 and other literature.13,20,71–79 Given a scarcity of data for S % in milk, we also calculated the expected range of this nutrient from the range in the literature of % true protein in milk. Milk protein contains 2.97 g methionine/100 g CP and 0.94 g cystine/100 g CP. 21 Methionine is 21.8% S and cystine is 23.7% S. Thus, the CP–S ratio is 114.94 g/g. Milk true protein can be calculated from milk CP by multiplying by 0.945, as 5.5% of nitrogen in milk is nonprotein nitrogen, 13 so the true protein–S ratio is 108.6 g/g. Thus the expected range of S % in milk based on the range of % true protein in milk is 0.017 − 0.046% (Table 4).
PCR of antibiotic resistance gene expression
RNA was extracted from muscle tissue using Trizol (Invitrogen) and quality checked using electrophoresis through 3-(N-Morpholino)propanesulfonic acid-formaldehyde gels. The RNA was DNase treated using TURBO Dnase (Invitrogen) and 1 μg was reverse transcribed using GoScript (Promega, Madison, WI), primed with oligo dT and random hexamers in a 20 μl reaction volume, and heated according to the manufacturer's instructions. Control reactions were performed that omitted either the GoScript or the RNA.
PCR was performed using GoTaq (Promega) and primers designed to detect Escherichia coli β-lactamase (bla) (F: TTCCGTGTCGCCCTTATTCCCT; R: CAGTGAGGCACCTATCTCAGCG; Tm 65°C, 40 cycles), bacterial neomycin phosphotransferase (neo) (F: GATGGATTGCACGCAGGTTCTCC; R: CGTCAAGAAGGCGATAGAAGGCG; Tm 67°C, 40 cycles), and a housekeeping gene EEF1A2 (F: TCTACAAATGCGGGGGCATC; R: CTGCCTTCAGCTTGTCCAGT; Tm 62°C, 30 cycles), which has previously been found suitable for evaluating gene expression changes in muscle tissue. 80
gDNA extracted from RC.calf1 was used as a positive control for the bla and neo PCRs. All bla and neo PCR products detected in muscle cDNA were gel purified, cloned into pCR™4-TOPO® TA (Invitrogen), and three clones for each PCR product were sequenced in both directions. The PCR products of bla and neo from RC.calf1 gDNA were cloned into pCR4-TOPO TA and five clones were sequenced in both directions to measure the background error rate of GoTaq polymerase. We also used bla primers to PCR amplify the gDNA that was coextracted from the muscle tissue from cattle that showed bla expression but were not carrying the pCR2.1 plasmid backbone sequence. These PCR products were likewise sequenced in both directions.
Antibiotic residues in meat and milk
Skeletal muscle (600 g) and milk (90 mL) from HO1.calf2 (control cow) and RC.calf1 (Polled GnEd cow with insertion of pCR2.1 vector sequence in the genome) were analyzed for the presence of β-lactam antibiotics (amoxicillin, ampicillin, cloxacillin, dicloxacillin, nafcillin, oxacillin, and penicillin G) by liquid chromatography-tandem mass spectrometry (LC-MS-MS) using a modification of the USDA method CLG-BLAC.03, and for aminoglycosides (dihydrostreptomycin, gentamycin, hygromycin, kanamycin, neomycin, paromomycin, spectinomycin, and streptomycin) by LC-MS-MS using the USDA method CLG-AMG 4 (Eurofins DQCI LLC, Fresno, CA).
The detection limits for β-lactams in meat and milk were <2.0 μg/kg amoxicillin, <3.0 μg/kg ampicillin (<1.0 μg/kg in milk), <4.0 μg/kg cloxacillin (<1.0 μg/kg in milk), <5.0 μg/kg dicloxacillin (<1.0 μg/kg in milk), <5.0 μg/kg nafcillin (<2.0 μg/kg in milk), <3.0 μg/kg oxacillin (<1.0 μg/kg in milk), and <4.0 μg/kg penicillin G (<1.0 μg/kg in milk). The detection limits for aminoglycosides in both meat and milk were <10 μg/kg dihydrostreptomycin, <50 μg/kg gentamycin, <20 μg/kg hygromycin, <20 μg/kg kanamycin, <20 μg/kg neomycin, <25 μg/kg paromomycin, <50 μg/kg spectinomycin, and <20 μg/kg streptomycin.
Statistics
Data were analyzed by one way or two way analysis of variance (ANOVA) using Prism 9 (GraphPad Software, San Diego, CA) followed by a post hoc Tukey or Bonferroni test while controlling for multiple testing. Data were transformed to normality or homogeneity of variance when necessary. Time, genotype, and cow were considered fixed effects. Health data were analyzed using a repeated measures ANOVA. Effect of genotype on milk and meat nutrients was analyzed by Student's t-test. Significance was declared at p < 0.05.
Footnotes
Acknowledgments
We acknowledge the following: Recombinetics, Eagan, MN, for developing the GnEd bull, RCI002 (Holstein Registry RCI-002 BURI-ETN), partially supported by USDA NIFA National Research Initiative Competitive Grant no. 2015-67015-23316 (T.S. Sonstegard), and Marissa Fisher and the students and staff of the UC Davis Animal Science Beef Barn for their assistance and expertise handling and managing the cattle. The residents and students of the UC Davis veterinary teaching hospital large animal clinic, in particular Drs. Tara Urbano and Paolo Tempini, were instrumental in monitoring the health of the animals.
Authors' Contributions
J.F.T. contributed to methodology, validation, formal analysis, investigation, data curation, writing—original draft, review, and editing. A.E.Y. was involved in conceptualization, methodology, investigation, data curation, and funding acquisition. B.R.N. was involved in investigation and resources. X.Y. was in charge of methodology. T.F.B. carried out investigation. A.L.V. carried out conceptualization, methodology, resources, writing—original draft, review and editing, supervision, project administration, and funding acquisition.
Author Disclosure Statement
No competing financial interests exist.
Funding Information
This project was supported by funds provided by USDA NIFA AFRI Biotechnology Risk Assessment Grant award no. 2017-33522-27097.
References
Supplementary Material
Please find the following supplemental material available below.
For Open Access articles published under a Creative Commons License, all supplemental material carries the same license as the article it is associated with.
For non-Open Access articles published, all supplemental material carries a non-exclusive license, and permission requests for re-use of supplemental material or any part of supplemental material shall be sent directly to the copyright owner as specified in the copyright notice associated with the article.