
Abstract
Alternative glycosylation of immunoglobulin G (IgG) is functionally important in multiple human physiological and pathological states. Our understanding of molecular mechanisms that regulate IgG glycosylation is vague because of the complexity of this process, which involves hundreds of genes. Several genome-wide association (GWA) studies have revealed a network of genes associated with IgG glycosylation that are pleiotropic for a number of diseases. Here, we report a design of a versatile system for IgG production and gene manipulations that can be used for in vitro functional follow-up of GWA hits or any gene of interest. The system is based on CRISPR-dCas9, extended by a piggyBac integrase compatible vector, and drives IgG production in HEK-293F cells. We validated our systems that stably express VPR-dCas9 and KRAB-dCas9 by manipulation of four glyco-genes with a known role in IgG glycosylation, and then functionally validated three GWAS hits for IgG glycosylation with an as-yet-unknown role in this process.
Introduction
Immunoglobulin G (IgG), a glycoprotein secreted by plasma cells, is the most abundant antibody in the human plasma. It plays a role in multiple humoral immune processes, such as complement activation and complement-dependent cytotoxicity, antigen neutralization, antibody-dependent cell-mediated cytotoxicity, phagocytosis, and hypersensitivity reactions. The glycan part is essential for the antibody because alternative glycosylation influences its structural stability, conformation, half-life, as well as effector functions.1–3 Alternative glycosylation can shift antibody activity from anti-inflammatory to proinflammatory and vice versa, and the complete removal of N-glycans from IgG results in the loss of both activities.4,5 Proper glycosylation can significantly improve efficacy of therapeutic monoclonal antibodies, and glycoengineering has an important role in drug development. 6
A conserved glycosylation site at Asn297 of the constant Fc region of IgG enables post-translational structural change of the Fc region required for optimal binding of antibody to different Fc gamma receptors (FcγR). Any change in glycan composition at this site can affect Fc structure and alter interaction with FcγR. 7 The IgG-Fc glycan is predominantly a bi-antennary complex structure composed of two N-acetylglucosamine (GlcNAc) and tri-mannose core, which can further be extended by addition of galactose, sialic acid, fucose, and bisecting GlcNAc (bisection). 8 Since the relative levels of these IgG glycoforms vary between individuals, 9 IgG glycome composition is extremely heterogenic in the human population. Several hundred differentially glycosylated IgG variants can be present in an individual at any given time. Furthermore, IgG glycome varies during life and in disturbed homeostasis. Differential IgG glycosylation is implicated in various physiological10,11 and pathological states12–15 as well as in aging.16,17 Indeed, IgG and its glycosylation are extensively studied in various diseases on an epidemiological scale because robust methods for high-throughput glycomics and glycoproteomics analyses are available. 18
Molecular mechanisms by which alternative IgG glycosylation is regulated are only vaguely understood. Yet, they are important in disturbed homeostasis, different pathological states and aging. The reason for this is the complexity of the glycan biosynthetic pathways, which include genes for glycosyltransferases and glycosidases that add or remove monosaccharides to/from a glycan structure, but also other enzymes as well as various other proteins such as transporters, transcription factors, and so on. Several genome-wide association studies (GWAS), including the most recent one performed on more than 10,000 individuals, revealed a network of genes associated with IgG glycosylation, which are pleiotropic with a number of different diseases and pathophysiological states.19–22 How these loci are functionally related to IgG glycosylation and diseases through the regulation of alternative IgG glycosylation remains to be resolved.
For in vitro functional follow-up of GWA hits, there is a need for an appropriate model cell system that would allow gene manipulations and analysis of the resulting glycan phenotype. Such a system must produce sufficiently high levels of IgG antibodies so that IgG glycosylation can be analyzed. On the other hand, it should enable reproducible and fast manipulation of gene expression. A highly efficient and simple transient expression system, capable of producing sufficient amounts of native secreted IgG antibodies, has already been developed by Vink et al. and is based on the suspension cell line FreeStyle™ 293-F (HEK-293F). 23 Importantly, IgG produced by this HEK-293F transient system shows glycosylation that resembles that of normal human plasma-derived IgG. 24 We used the system developed by Vink et al. as a foundation, and we upgraded it with a transposon vector combined with our CRISPR-dCas9-based modular system for orthogonal gene regulation. 25 As a result, we generated a transient expression system with stably integrated VPR-dCas9 and KRAB-dCas9 cassettes for up- and downregulation of any gene of interest only by co-transfection of cells with appropriate single guide RNAs (gRNA). As a proof of principle, we selected four glyco-genes coding for glycosyltransferases with defined function in IgG glycosylation and manipulated their transcriptional activity in our newly developed stable VPR-dCas9 and KRAB-dCas9 HEK-293F cell lines. Following transcriptional modulation, we analyzed changes in glycan phenotype on secreted IgG molecules. After successful validation of our system on these selected glyco-genes, we used it to study three GWAS hits for IgG glycosylation19,22 with as-yet-unknown role in this process.
Methods
Construction of piggyBac-based vectors for genomic integration
Plasmid pBackBone-BZ described in Josipović et al. (see supplement therein) 25 was used as the backbone for piggyBac (PB)-based vector construction. All restriction endonucleases were from New England Biolabs (Ipswich, MA) unless indicated otherwise. First, 48 bp complementary oligonucleotides LeftH-Esp3I_sense and LeftH-Esp3I_antisense were designed to include Esp3I restriction site and Acc65I and SalI cohesive ends. The oligonucleotides were annealed and cloned in pBackBone-BZ cut with Acc65I and SalI. Next, 51 bp oligonucleotides RightH-BbsI_sense and RightH-BbsI_antisense containing BbsI restriction site and XbaI and XhoI cohesive ends were annealed and cloned in the pBackBone-BZ with XbaI and XhoI to form a plasmid named pBB-ARMs.
Plasmid pUK21gg optimized for Golden Gate cloning from pUK2125 was used as an intermediate to clone the insulator sequences and inverted terminal repeats (ITRs) of the PB transposon system. First, 84 bp complementary oligonucleotides MCS-assemble_sense and MCS-assemble_antisense including BsaI and Esp3I restriction sites flanked by XbaI and XhoI cohesive ends were annealed and cloned in pUK21gg with XbaI and XhoI. Next, the 146 bp insulator sequence (U.S. patent no. US8133699B2, 2012) was custom-synthetized (Macrogen Europe BV, Amsterdam, The Netherlands) as two pairs of complementary oligonucleotides containing NheI and XhoI cohesive ends flanking the insulator sequence. They were annealed and cloned in pUK21gg cut with NheI and XhoI (New England Biolabs). This was repeated with XbaI and SalI (New England Biolabs) to generate two tandem insulator sequences.
ITRs of the PB transposon were amplified by polymerase chain reaction (PCR) with PB3-FW and PB3-RE primers from plasmid pBCAG-eGFP (Addgene, Watertown, MA; plasmid #40973). Next, pUK21gg was cut with Esp3I, and the PCR products were cut with BsaI and ligated to produce two plasmids, each containing left or right ITRs and two insulator sequences, named PB-ARM-L and PB-ARM-R. ITRs and insulator sequences were inserted in the backbone pBB-ARMs in two steps. First, PB-ARM-L and PB-ARM-R were cut with BsaI, while pBB-ARMs were linearized with Esp3I to enable insertion of left ITRs and insulator sequences. The intermediary construct was linearized with BpiI (Thermo Fisher Scientific, Waltham, MA), and right ITRs and insulator sequences were inserted to obtained complete PB backbone (donor) vector optimized for Golden Gate cloning.
Two different Cas9 orthologs were used for the production of stable cell lines: dSaCas9 from Staphylococcus aureus and dSpCas9 from Streptococcus pyogenes (dCas9 denotes “deactivated” Cas9 with no nuclease activity but intact DNA-binding activity). To obtain PB-VPR-dSaCas9 vector for stable genomic integration, Golden Gate modules Ig-dual bridge oligonucleotide, EFS promotor, VPR domain, dSaCas9, T2A-X-puro, X-P2A-Clover, and bGH terminator were assembled using BsaI in the PB backbone vector. To obtain PB-KRAB-dSpCas9 vector for stable genomic integration Golden Gate modules Ig-dual bridge oligonucleotide, EFS promotor, KRAB domain, dSpCas9, T2A-X-puro, X-P2A-Ruby, and bGH terminator were assembled with BsaI in the PB backbone vector. The Golden Gate assembly system is described in Josipović et al. (see supplement therein). 25
Hyperactive PB transposase that recognizes PB ITRs was designed according to the sequence described in Doherty et al. 26 and codon optimized for human cell lines. All unwanted restriction sites and potential splicing donors and acceptors were then removed. The PB transposase DNA sequence was custom synthesized (Integrated DNA Technologies, Coraville, IA) and amplified with primers C9_seq1 and C9_seq2 to produce I-IV module for Golden Gate assembly named HyPB-Xpress. The purified PCR product was cloned in pUK21gg with XbaI and XhoI. HyPB-Xpress together with SV40 promotor, SV40 terminator, and Ig-dual bridge oligonucleotide was assembled with BsaI in pBackBone-BZ by Golden Gate cloning, forming a PBase expression vector.
To reduce unwanted recombination of repeating sequences, all plasmids were amplified in NEB® Stable Competent Escherichia coli bacteria (New England Biolabs). Sequences of the used oligonucleotides and PCR primers are listed in Supplementary Table S1. Details of plasmids and modules used in Golden Gate cloning are described in Supplementary Table S2.
Construction of plasmids encoding IgG heavy and light chains
The IgG light chain (LC) DNA sequence was kindly provided by Gestur Vidarsson (Sanquin Blood Supply Foundation, Amsterdam, The Netherlands) and amplified using Herculase II Fusion DNA Polymerase (Agilent Technologies, Santa Clara, CA) with Ig-PstI-tNS-1-FW and corr-Igk-tNS-4-XhoI-RE primers (Supplementary Table S3) flanked by PstI and XhoI sites. The purified PCR product was cloned in pUK21gg using PstI and XhoI. A BsaI restriction site in the IgG LC sequence was removed by two different approaches: using the QuickChange Lightning Site-Directed Mutagenesis Kit (Agilent) with LC_noBsaI-S and LC_noBsaI-A oligonucleotides or by substituting the complete intron sequence with LC-BbsI_rm_Intron-S and LC-BbsI_rm_Intron-A annealed oligonucleotide containing BbsI cohesive ends to obtain two different constructs. The IgG LC was then amplified in both constructs with LC-BsaI-2-NcoI-FW and LC-BsaI-2-KasI-RE using Herculase II Fusion DNA Polymerase (Agilent) to obtain BsaI restriction sites, leaving NcoI and KasI cohesive ends for the next step. The T2A module was linearized with NcoI and KasI, and IgG LC PCR products were cut with BsaI to produce Golden Gate module plasmids pLC_Int-T2A and pLC_noInt-T2A by ligation.
The IgG heavy chain (HC) was synthesized as 1,499 bp long gBlock (Integrated DNA Technologies) and cloned in pUK21gg with PstI and SacI, yielding the module plasmid pHC_1-f3.
pHC_1-f3 and pLC_Int-T2A or pLC-noInt-T2A modules were assembled with CbH promotor, bGH terminator, and short stuffer oligonucleotide Ig_B-A_dual into pBackBone plasmid using the Golden Gate method with BsaI restriction enzyme to produce IgG-T2A-Int and IgG-T2A-noInt construct.
p3SVLT construction
Plasmid p3SVLT was used to enhance protein production in transfected cells. Cloning codon optimized version of SV40 large T antigen was obtained as a small HindIII-SV40-LT-EcoRI insert, which was kindly provided by Tom Vink. The insert was ligated in a linearized pCDNA3 (# V79020; Invitrogen, Carlsbad, CA) vector digested with EcoRI (New England Biolabs) and HindIII (New England Biolabs). The ligation reaction was done at a vector-to-insert ratio of 1:3 according to the Quick Ligation™ Kit, and the final construct was amplified in XL10-Gold® Ultracompetent Cells (StrateGene, Bellingham, WA).
pX_mCerulean3 construction
DNA sequence of mCerulean327 was amplified from mCerulean3-N1 (# 54730; Addgene) using FP_CC_NcoI_Fw and FP_KasI_Rev primers. The PCR product was cloned in pUK21gg with NcoI and KasI, producing the pX-mCerulean3 plasmid, which was assembled with multiguide RNA module containing six random gRNA molecules, SV40 promoter, and SV40 terminator following the Golden Gate assembly protocol (BsaI) to produce the mCerulean_test plasmid.
Construction of backbone for plasmids designed for magnetic-activated cell sorting
The magnetic-activated cell sorting (MACS) backbone plasmid was derived from a backbone plasmid with a secondary cassette described in Josipović et al. 25 First, the backbone plasmid was linearized with Esp3I (Thermo Fisher Scientific) and purified using a QIAquick PCR Purification Kit (Qiagen, Hilden, Germany). The 874 bp fragment containing the LNGFR gene was amplified from the pMACS-LNGFR plasmid (Miltenyi Biotec, Gladbach, Germany) using the primers LNGFR-FW and delta_LNGFR-RE. Promotor and terminator modules were amplified from plasmids described previously 25 using primer pairs pro_SV40_PstI-FW, pro_SV40_XhoI and ter_SV40_PstI-FW, ter_SV40_XhoI-RE, respectively. All modules were cut with BsaI and purified using either the QIAquick Gel Extraction Kit or the QIAquick PCR Purification Kit (Qiagen). The backbone and the modules were ligated to obtain the pBB_NEW_LNGFR plasmid.
Construction of IgG-gRNA-bearing plasmids and plasmids for MACS
Plasmid constructs of IgG-gRNA-bearing plasmids were constructed in a modular system by the Golden Gate cloning method, as described in Josipović et al. 25 for targeting of genes B4GALT1, ST6GAL1, FUT8, MGAT3, RUNX3, SPPL3, and GGA2. Non-targeting gRNA was used as a control and was specifically designed for each dSpCas9 and dSaCas9 ortholog. Briefly, the final assembly was conducted with modules for antibody HC and LC, Cbh promoter and bGH terminator, and single guide or multiguide RNA molecule in a backbone pBackBone-BZ for IgG-gRNA plasmids or backbone pBB_NEW_LNGFR for plasmids designed for MACS with BsaI restriction enzyme. The IgG expression cassette that drives expression of the antibody HC and LC linked by a 2A self-processing peptide and a furin cleavage site was designed based on the work of Fang et al. 28 Details of plasmids and modules used in Golden Gate cloning are described in Supplementary Table S2, and primers and custom oligonucleotides are listed in Supplementary Table S1. For glycosyltransferases B4GALT1 and FUT8, we used a single gRNA for each gene. For ST6GAL1, we used all three gRNAs listed in the Supplementary Material on a single plasmid, since we could not achieve sufficient regulation using ST6GAL1_A-sg03 alone. For each of the other genes—MGAT3, GGA2, RUNX3, and SPPL3—we used three gRNAs on a single plasmid (Supplementary Table S1). When more than one gRNA (listed in the Supplementary Material) was used, we did not test them individually, but rather used them together in the multiguide system on a single plasmid in all experiments.
Dot blot assay
A dot blot assay was conducted to assess the expression levels of IgG from HEK-293F cells transfected with IgG-encoding plasmids. Briefly, the membrane was washed with 1 × phosphate-buffered saline (PBS; 137 mM NaCl, 2.7 mM KCl, 10 mM Na2HPO4, 1.8 mM KH2PO4, pH 7.3) and dried. One microliter of IgG samples collected on days 3 and 5 after cell transfection and IgG standards diluted at ratios of 1:8, 1:16, 1:32, 1:64, and 1:128 as well as bovine serum albumin (control) were applied onto the nitrocellulose membrane (GE Healthcare, Chicago, IL) and blocked in 5% skim milk powder dissolved in 1 × PBST (1 × PBS with Tween® 20 at a ratio of 1:1 v/v) for 30 min on a shaker at room temperature (RT). Next, the membrane was incubated with goat anti-human IgG H&L (horseradish peroxidase; HRP) antibody (Abcam, Cambridge, UK) diluted 1:10,000 in 5% fat-free milk for 1 h on a shaker at RT. Finally, the membrane was washed four times with PBST for 15 min, and the antigen-antibody complex was visualized by using Clarity Max ECL luminol-peroxide (1:1) solution (Bio-Rad, Hercules, CA).
Establishment of polyclonal and monoclonal cell lines
To integrate the dCas9-based expression cassette into cultured cells, we used a modified PB system consisting of a donor vector (described above) and a separate vector for expression of the transposase, which facilitates integration of the portion of the donor vector flanked by ITR sequences. FreeStyle™ 293-F cells (Gibco, Grand Island, NY; HEK-293F) were grown in 125 mL polycarbonate Erlenmeyer flasks with a filter cap (Nalgene, Rochester, NY), on a PSU-20i Multi-functional Orbital Shaker at 140 rpm at 37°C with 8% CO2 and maintained in FreeStyle 293 medium (Gibco) in a total volume of 30 mL. When the cells reached the appropriate density, 500,000 cells/mL were plated on non-treated six-well plates. The cells were co-transfected with 100 ng of PB-VPR-dSaCas9 or PB-KRAB-dSpCas9 plasmid and 100 ng of PBase vector. The transfection was performed with 293fectin Transfection Reagent (Gibco) according to the manufacturer's protocol, which was adapted to the appropriate total volume of 2 mL per well. The cells were screened the next day for expression of fluorescent proteins mClover3 and mRuby3, 29 and were selected with 7 μg/mL of puromycin (Gibco) for 48 h. Cells were observed and passaged if needed until day 11 after transfection when a fraction of cells were frozen as polyclonal cell lines. Meanwhile, conditioned FreeStyle 293 medium was prepared by seeding 500,000 HEK-293F cells/mL in a 125 mL flask. The conditioned medium was harvested after 24 h by filtering the cell suspension through a 0.22 μm syringe filter. Eleven days after transfection, the cells were diluted to reach a density of 5 cells/mL and seeded on 96-well plates for suspension cells in a volume of 100 μL per well. One hour after seeding, the cells were screened by fluorescent microscopy, and wells with one cell were marked for further observation. Fifteen days after seeding, three PB-dSaCas9-VPR monoclonal cell lines and five PB-dSpCas9-KRAB were scaled up to a 24-well plate for suspension cells (CytoOne) and 5 days later to non-treated six-well plates for suspension cells. When they reached a density of 2.5 × 10⁶, two aliquots of each cell line were frozen according to the HEK-293FreeStyle manufacturer's protocol.
Puromycin validation
Monoclonal cell lines PB-dSaCas9-VPR-1 and PB-dSpCas9 and HEK-293F cells were thawed following the protocol from Vink et al. 23 The cells were subcultured three times before seeding them on non-treated six-well plates, 500,000 cells/mL. The next day, the cells were treated with 7 μg/mL of puromycin, which was removed by centrifugation (5 min, 100 g, 4°C) after 48 h. On day 3 after selection, the cells were counted using an EVE™ Automated Cell Counter (NanoEntek, Seoul, Korea).
Western blot
To verify the expression of dSaCas9 or dSpCas9 in established monoclonal and polyclonal cell lines, we performed Western blotting. FreeStyle™ 293-F cells (Gibco) served as a negative control. Approximately 5 × 10⁶ cells for each cell line were pelleted by centrifugation (5 min, 500 g) and washed twice in 700 μL 1 × PBS. Cells were lysed in RIPA buffer supplemented with Protease Inhibitor Cocktail (cOmplete™ ULTRA Tablets; Roche, Basel, Switzerland) and sonicated using Sonorex Super Ultrasonic bath (Bandelin, Berlin, Germany). Protein concentration was determined with BCA protein assay (Pierce™ BCA Protein Assay Kit; Thermo Fisher Scientific) according to the manufacturer's protocol. Sixty micrograms of protein was used for each sample, and β-actin served as a loading control. Rabbit anti-SaCas9 1:5,000 (ab203943; Abcam), mouse anti-SpCas9 1:1,000 (ab191468; Abcam), mouse anti-β-actin 1:2,000 (sc-69879; Santa Cruz Biotechnology, Santa Cruz, CA), goat anti-rabbit IgG H&L (HRP) 1:200,000 (ab6721; Abcam), and goat anti-mouse IgG H&L (HRP) 1:200,000 (ab205719; Abcam) antibodies were used. Specific proteins were visualized by Clarity™ Western ECL Substrate (Bio-Rad) according to the manufacturer's protocol using the Alliance Q9 Advanced (UVITECTM Cambridge) imaging system.
Transfection efficiency test
FreeStyle™ 293-F cells were plated on non-treated six-well plates at a density of 500,000 cells/mL. They were transfected with 500, 700, 900, 1,200, 1,600, 2,000, 2,400, and 2,800 ng of mCerulean_test plasmid with 293fectin Transfection reagent according to the manufacturer's protocol. The transfection efficiency was analyzed with fluorescence microscopy 24 h after transfection.
Transfection of stable polyclonal and monoclonal cell lines
Suspension-adapted monoclonal cell lines PB-dSaCas9-VPR-1 and PB-dSpCas9-KRAB-3 as well as polyclonal cell lines PB-dSaCas9-VPR-p and PB-dSpCas9-KRAB-p were maintained in the same manner as HEK-293F cells. The cell lines were grown until they reached appropriate density with ≥90 viability and were plated at a concentration of 500,000 cells/mL on non-treated six-well plates. Transfections were performed with 293fectin Transfection Reagent according to the manufacturer's protocol. Briefly, 2 μg of plasmids were diluted in Opti-MEM I Reduced Serum Medium (Gibco) in the final volume of 80 mL. The protocol from Vink et al. 23 was used for improved expression of IgG optimized for an ideal ratio of plasmids containing gRNA and IgG chains, p3SVLT, pORF-hp21 (InvivoGen, San Diego, CA), and pORF-hp27 (InvivoGen; mass ratio: 0.69/0.01/0.05/0.25). During vigorous vortexing, 80 mL of diluted 293-fectin was added dropwise to the diluted mixture of plasmids, and cells were allowed to grow for 5 days as described. After 5 days, cells were separated from supernatant (enriched with secreted IgG) by centrifugation (5 min, 4,000 g, 4°C). Cell pellets were used for analysis of gene expression, while supernatants were used for glycan analysis.
Reverse transcription and quantitative PCR
Isolation of total RNA was performed with the RNeasy Mini Kit (Qiagen) from cell pellets obtained 5 days after transfection according to the manufacturer's instructions. The concentration of RNA was determined by spectrophotometry at 260 nm, and equal amounts of RNA (50 ng) were subjected to reverse transcription using PrimeScript RTase (Takara, Shiga, Japan) and random hexamer primers (Invitrogen) for TaqMan Gene Expression Assay. Samples for detection of MGAT3 and RUNX3 transcript were treated with TURBO DNase (Invitrogen) to remove residual DNA, considering that primers detecting MGAT3 are able to detect genomic DNA as well as cDNA obtained from RNA transcripts. Reverse transcription quantitative PCR (RT-qPCR) was performed using the 7500 Fast Real-Time PCR System using TaqMan Gene Expression Master Mix according to the manufacturer's instructions in a total volume of 20 μL with the following assays: Hs00155245_m1 (B4GALT1), Hs00949382_m1 (ST6GAL1), Hs02379589_s1 (MGAT3), Hs00189535_m1 (FUT8), and Hs02800695_m1 (HPRT1). The gene HPRT1 was used as a reference gene to normalize gene expression in each sample where gene expression was manifested as a mean value of nine replicates using the ΔΔCt method. 30 Fold change (FC) was presented in comparison to gene expression in cells transfected with non-targeting gRNA control plasmid. To maintain easy comparability of up- and downregulated transcripts, fold regulation (FR) was calculated by taking the reciprocal value for every FC <1 and making it a negative number (thus, the FC of 0.5 is FR of −2; values for FC ≥1 equal FR).
MACS
Monoclonal cell lines PB-dSaCas9-VPR-1 and PB-dSpCas9-KRAB-3 transfected with plasmids designed for MACS were sorted 5 days after transfection according to the manufacturer's protocol with a MACS MicroBead Technology (Miltenyi Biotec) sorting kit. Gene expression of three biological replicates that went through the sorting procedure was compared to gene expression of three biological replicates that were not sorted using the ΔΔCt method (normalized to HPRT1 expression). FC was calculated as stated before in comparison to the mean of gene expression in cells (sorted and unsorted cells combined) transfected with non-targeting gRNA control plasmid.
Determination of MACSelect™ enrichment rate
Five days after transfection of polyclonal cell lines PB-dSaCas9-VPR-p and PB-dSpCas9-KRAB-p with plasmids designed for MACS, the enrichment rate was determined by comparing magnetically labeled cells before and after MACS to fluorescent staining. The cells were centrifugated and re-suspended in PBE buffer according to the manufacturer's protocol (MACS® MicroBead Technology sorting kit; Miltenyi Biotec). Control FITC antibody was used specifically to stain cells that express LNGFR membrane protein and was added to cells at a ratio 1:10. The cells were counted on a fluorescent microscope before and after separation to determine the enrichment rate calculated by the formula given in the manufacturer's protocol.
Isolation of IgG secreted from FreeStyle™ 293-F cells
IgG was isolated from HEK-293F monoclonal and polyclonal cell culture supernatants using Protein G Agarose fast flow beads (Merck, Darmstadt, Germany). The beads were prewashed three times with 10 × bead volume of 1 × PBS. In each washing step, the beads were re-suspended in 1 × PBS and centrifugated at 150 g for 10 s, and the supernatant was removed. After the last wash, prewashed beads were re-suspended in 1 × PBS to make a 50:50 (v/v) bead slurry. Approximately 2 mL of HEK cell culture supernatant was mixed with an equal volume of 1 × PBS and 40 μL of prepared 50% bead slurry in a 5 mL tube. The samples were re-suspended by pipetting and were incubated for 1 h at RT with gentle shaking to allow IgG to bind to the beads. After incubation, the samples were centrifugated at 150 g for 10 s, and the supernatants were then carefully removed and discarded. The beads were washed three times with 300 μL of 1 × PBS and three times with 300 μL of ultrapure water to remove nonspecifically bound proteins. After the washing steps, bound IgG was eluted by incubating the beads in 100 μL of 0.1 M formic acid (Merck) for 15 min at RT with gentle shaking. Eluted IgG was neutralized with 17 μL of 1 M ammonium bicarbonate (Merck). IgG concentration in the eluate was measured using Nanodrop 8000 (Thermo Fisher Scientific). Samples were subsequently dried in a vacuum concentrator.
Glycan analysis
Release of N-glycans, glycan labeling, and clean-up of glycans were performed according to a previously established protocol 31 with some modifications. Briefly, dried IgG was denatured with sodium dodecyl sulfate (SDS; Invitrogen) and heated at 65°C. The excess SDS was neutralized with Igepal-CA630 (Merck), and N-glycans were released by 18 h incubation with PNGaseF (Promega, Madison, WA). The released glycans were fluorescently labeled with procainamide in a two-step reaction. In the first step, 25 μL of freshly prepared labeling solution, containing 172.8 mg/mL of procainamide hydrochloride in a mixture of dimethyl sulfoxide (DMSO) and glacial acetic acid (70:30, v/v), was added to each sample followed by incubation for 1 h at 65 °C. Then, in the next step, 25 μL of freshly prepared solution, containing 179.2 mg/mL of 2-picoline borane as a reducing agent in a mixture of DMSO and acetic acid (70:30, v/v), was added to each sample followed by incubation for 1.5 h at 65°C. Free label and reducing agent were removed from the samples using hydrophilic interaction liquid chromatography (HILIC) solid-phase extraction on a 0.2 μm GHP filter plate (Pall Corporation, Ann Arbor, MI). Glycans were eluted with ultrapure water and stored at −20°C until use.
Fluorescently labeled N-glycans were separated by hydrophilic interaction chromatography on a Waters Acquity ultra-performance liquid chromatography (UPLC) instrument (Waters, Milford, MA) consisting of a quaternary solvent manager, sample manager, and a FLR fluorescence detector set with excitation and emission wavelengths of 310 nm and 370 nm, respectively. The instrument was under the control of Empower 3 software, build 3471 (Waters). Labeled N-glycans were separated on a Waters BEH Glycan chromatography column, 100 × 2.1 mm i.d., 1.7 μm BEH particles, with 100 mM ammonium formate, pH 4.4, as solvent A and ACN as solvent B. The separation method used linear gradient of 75–62% ACN (v/v) at a flow rate of 0.4 mL/min over 31 min. Samples were maintained at 10°C before injection, and the separation temperature was 60°C. The system was calibrated using an external standard of hydrolyzed and procainamide-labeled glucose oligomers from which the retention times for the individual glycans were converted to glucose units (GU). Data processing was performed using an automatic processing method with a traditional integration algorithm, after which each chromatogram was manually corrected to maintain the same intervals of integration for all the samples. The chromatograms were separated in the same manner as chromatograms of human plasma-derived IgG glycans, into 24 peaks, and the amount of glycans in each peak was expressed as a percentage of total integrated area. The structural assignment of the glycans present in the chromatographic peaks was done based on overlay with the chromatogram of human plasma IgG glycans for which structures corresponding to each peak had been previously determined 32 as well as GU values of the glycan peaks using the GlycoStore database. The presence of glycans that contained terminal mannose and sialic acid residues in the chromatographic peaks was determined with exoglycosidase digestions. The enzymes α2-3,6,8,9 neuraminidase A and α1-2,3,6 mannosidase (New England Biolabs) were used for digestions. Aliquots of the procainamide-labeled glycan pool were digested according to the manufacturer's protocol. After overnight incubation at 37°C, the enzymes were removed by filtration through AcroPrep 96 Filter Plates, 10K (Pall Corporation). Digested glycans were then separated by HILIC-UHPLC for comparison against undigested glycans.
Statistical analysis
All statistical analyses were performed using R (The R Foundation for Statistical Computing, Vienna, Austria). Raw figures were prepared with R, with glycan structures added later using the standard symbols. 33 RT-qPCR data points were averages of two technical replicates; biological replicates were pooled from independent experiments. Differences between groups were assessed using the two-tailed Mann–Whitney U-test on ΔΔCt data, which were transformed and plotted as fold difference.
Glycans were measured as percentage of area of identified chromatographic peak in relation to total glycans (all glycan peak areas). Derived traits were calculated by summing the appropriate peaks. As each experimental batch of biological replicates contained a different baseline, differences between treatments and controls were united using “metafor” in R for the meta-analysis approach. To achieve normal distribution of glycan data, Box–Cox transformations (from “EnvStats” in R) were used where appropriate. The ability of the Box–Cox transformation to produce normally distributed data was confirmed on a larger data set from an earlier study using the same methodology 34 with help of “nortest” in R. After using either normally distributed data or the appropriate transformation, UPLC data for glycans were analyzed using Student's t-test either explicitly or implicitly by running meta-analysis (“metafor” in R) to combine multiple experimental runs.
Results
Generation of polyclonal and monoclonal VPR-dCas9 or KRAB-dCas9 FreeStyle™ 293-F cell lines
FreeStyle™ 293-F (HEK-293F) cells were used due to their ability to grow as suspension culture in a chemically defined medium at high cell densities, their ease of transfection, and their ability to produce high quantities of recombinant proteins. To establish HEK-293F cell lines with stably integrated VPR-dCas9 or KRAB-dCas9, we constructed a modular Golden Gate adapted plasmid vector based on the PB integration system (Fig. 1). Essentially, we augmented our existing modular system 25 with a new backbone plasmid designed for PB integration. The plasmid pBackBone-BZ was modified to contain PB inverted repeats recognized by the PB transposase, insulator sequences to prevent silencing upon genomic integration, and BsaI restriction sites for Golden Gate assembly, compatible with our previously constructed system. Expression of VPR-dCas9 and KRAB-dCas9 fusion proteins was driven by the weak EFS promotor to minimize off-target effect. Reporter genes mClover3 (for VPR-dCas9) and mRuby3 (for KRAB-dCas9) as well as puromycin resistance gene were fused with T2A and P2A self-cleaving peptides, respectively. HEK-293F cells were co-transfected with 100 ng PB VPR-dCas9 or KRAB-dCas9 and a minimal quantity (100 ng) of plasmid encoding PB integrase to achieve a low number of genomic integrations. Following puromycin selection, the efficiency of integration was assessed by fluorescence microscopy. Monoclonal cell lines were obtained by limiting dilution from VPR-dCas9 and KRAB-dCas9 polyclonal HEK-293F cells. To validate genomic stability of the expression cassette integrated by the PB system, another round of puromycin selection was performed after limiting dilution, and no decrease in cell viability or number was observed (Supplementary Table S4). Additionally, we verified continued stable expression of dCas9 fusions by observing fluorescence in monoclonal cell lines (mClover3 for VPR-dCas9 and mRuby3 for KRAB-dCas9). Finally, we verified expression and stability of dCas9 by Western blotting (Supplementary Fig. S1).
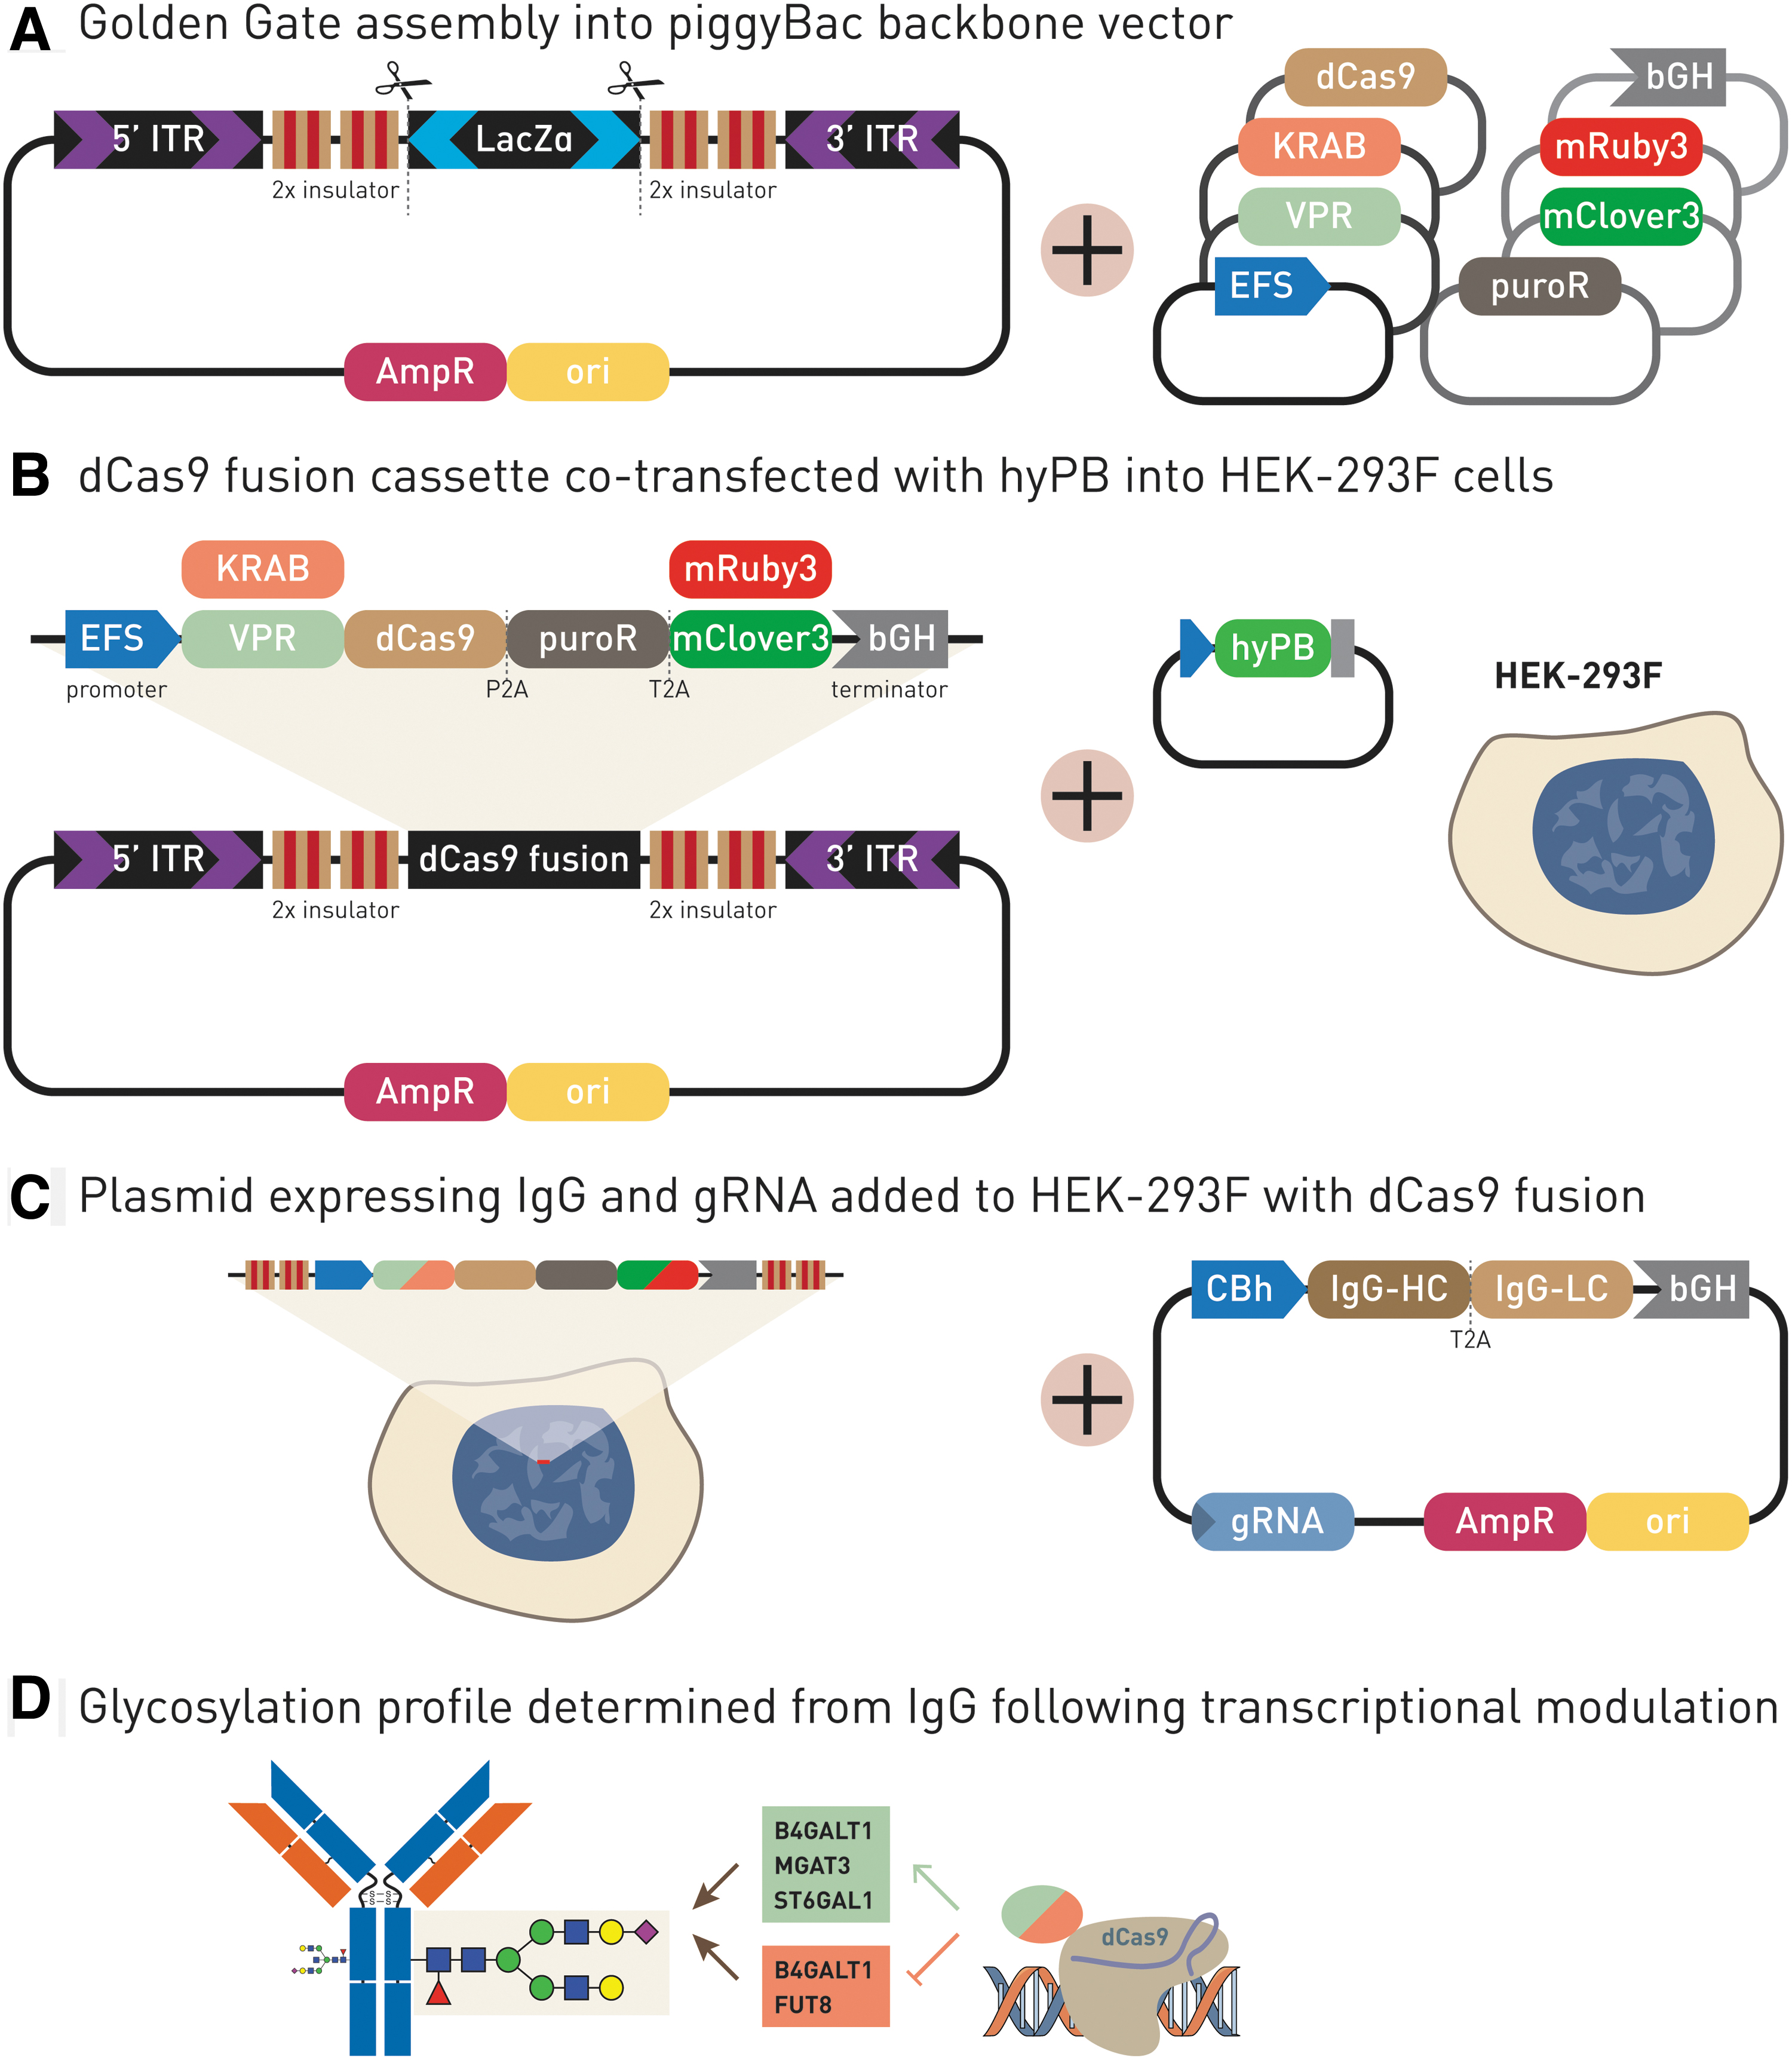
Generation of the HEK-293F transient expression system for the production of IgG with stably integrated VPR-dCas9 and KRAB-dCas9 cassettes for the up- and downregulation of glyco-genes.
Transfection efficiency in FreeStyle™ 293-F cells
In order to determine the optimal amount of plasmid DNA for highest transfection efficiency in our system, a multiguide RNA plasmid with the mCerulean3 reporter gene was designed, which is similar in size to IgG-gRNA-bearing plasmid (Supplementary Table S2). Cells were transfected with increasing amounts of plasmid DNA, and the optimal amount of plasmid DNA was determined to be 2 μg per million cells, with a transfection efficiency of 69% (Supplementary Fig. S2).
IgG glycan profiles of FreeStyle™ 293-F, and stable VPR-dCas9 and KRAB-dCas9 HEK-293F cell lines
The HEK-293F transient system for a high yield of IgG antibodies was first developed by Vink et al., 23 and we modified it as follows to match our experimental setup. We adapted the IgG expression system by cloning both IgG chains in one plasmid able to receive up to six gRNA molecules by BsaI Golden Gate cloning. IgG antibody quantities were measured using dot blots 3 and 5 days after transfection (Supplementary Fig. S3). The plasmid with an intron in IgG light chain (IgG-T2A-Int) produced higher quantities of IgG (15.1 mg/L) than the plasmid without the intron (IgG-T2A-noInt), which had a yield of 12.6 mg/L, peaking on day 5 following transfection (Supplementary Fig. S3). Therefore, we used the plasmid with IgG-T2A-Int and collected cells 5 days following transfection in all further experiments. IgG glycan profiles from HEK-293F cells were compared to the glycan profiles of IgG produced from the stable VPR-dCas9 and KRAB-dCas9 HEK-293F cell lines. The IgG glycan profiles from all three cell lines were nearly identical (Fig. 2 and Supplementary Fig. S4). Glycan structures were assigned to UPLC peaks according to our previous study. 35 All three profiles were characterized by four dominant peaks and a greater number of very small peaks. In all three profiles, the peak of the highest signal intensity, and thus the highest abundance, corresponded to the biantennary core-fucosylated N-glycan without galactose (FA2 glycan). The second most intense peak in all three profiles corresponded to the biantennary core-fucosylated N-glycan with one galactose bound on α-6 mannose arm (FA2(6)G1 glycan), while the third largest peak corresponded to the biantennary core-fucosylated N-glycan with one galactose bound on α-3 mannose arm (FA2(3)G1 glycan). The fourth main peak in the IgG N-glycan profiles of HEK-293F cells, VPR-dCas9, and KRAB-dCas9 cell lines corresponded to the biantennary core-fucosylated N-glycan with two galactoses (FA2G2 glycan). The relative abundances (average of three replicates) of the four dominant N-glycans were comparable between all three compared profiles. Glycans with bisecting GlcNAc and glycans with sialic acid as well as glycans without core fucose were generally present at low abundance in N-glycan profiles of IgG derived from all three cell lines (Fig. 2).
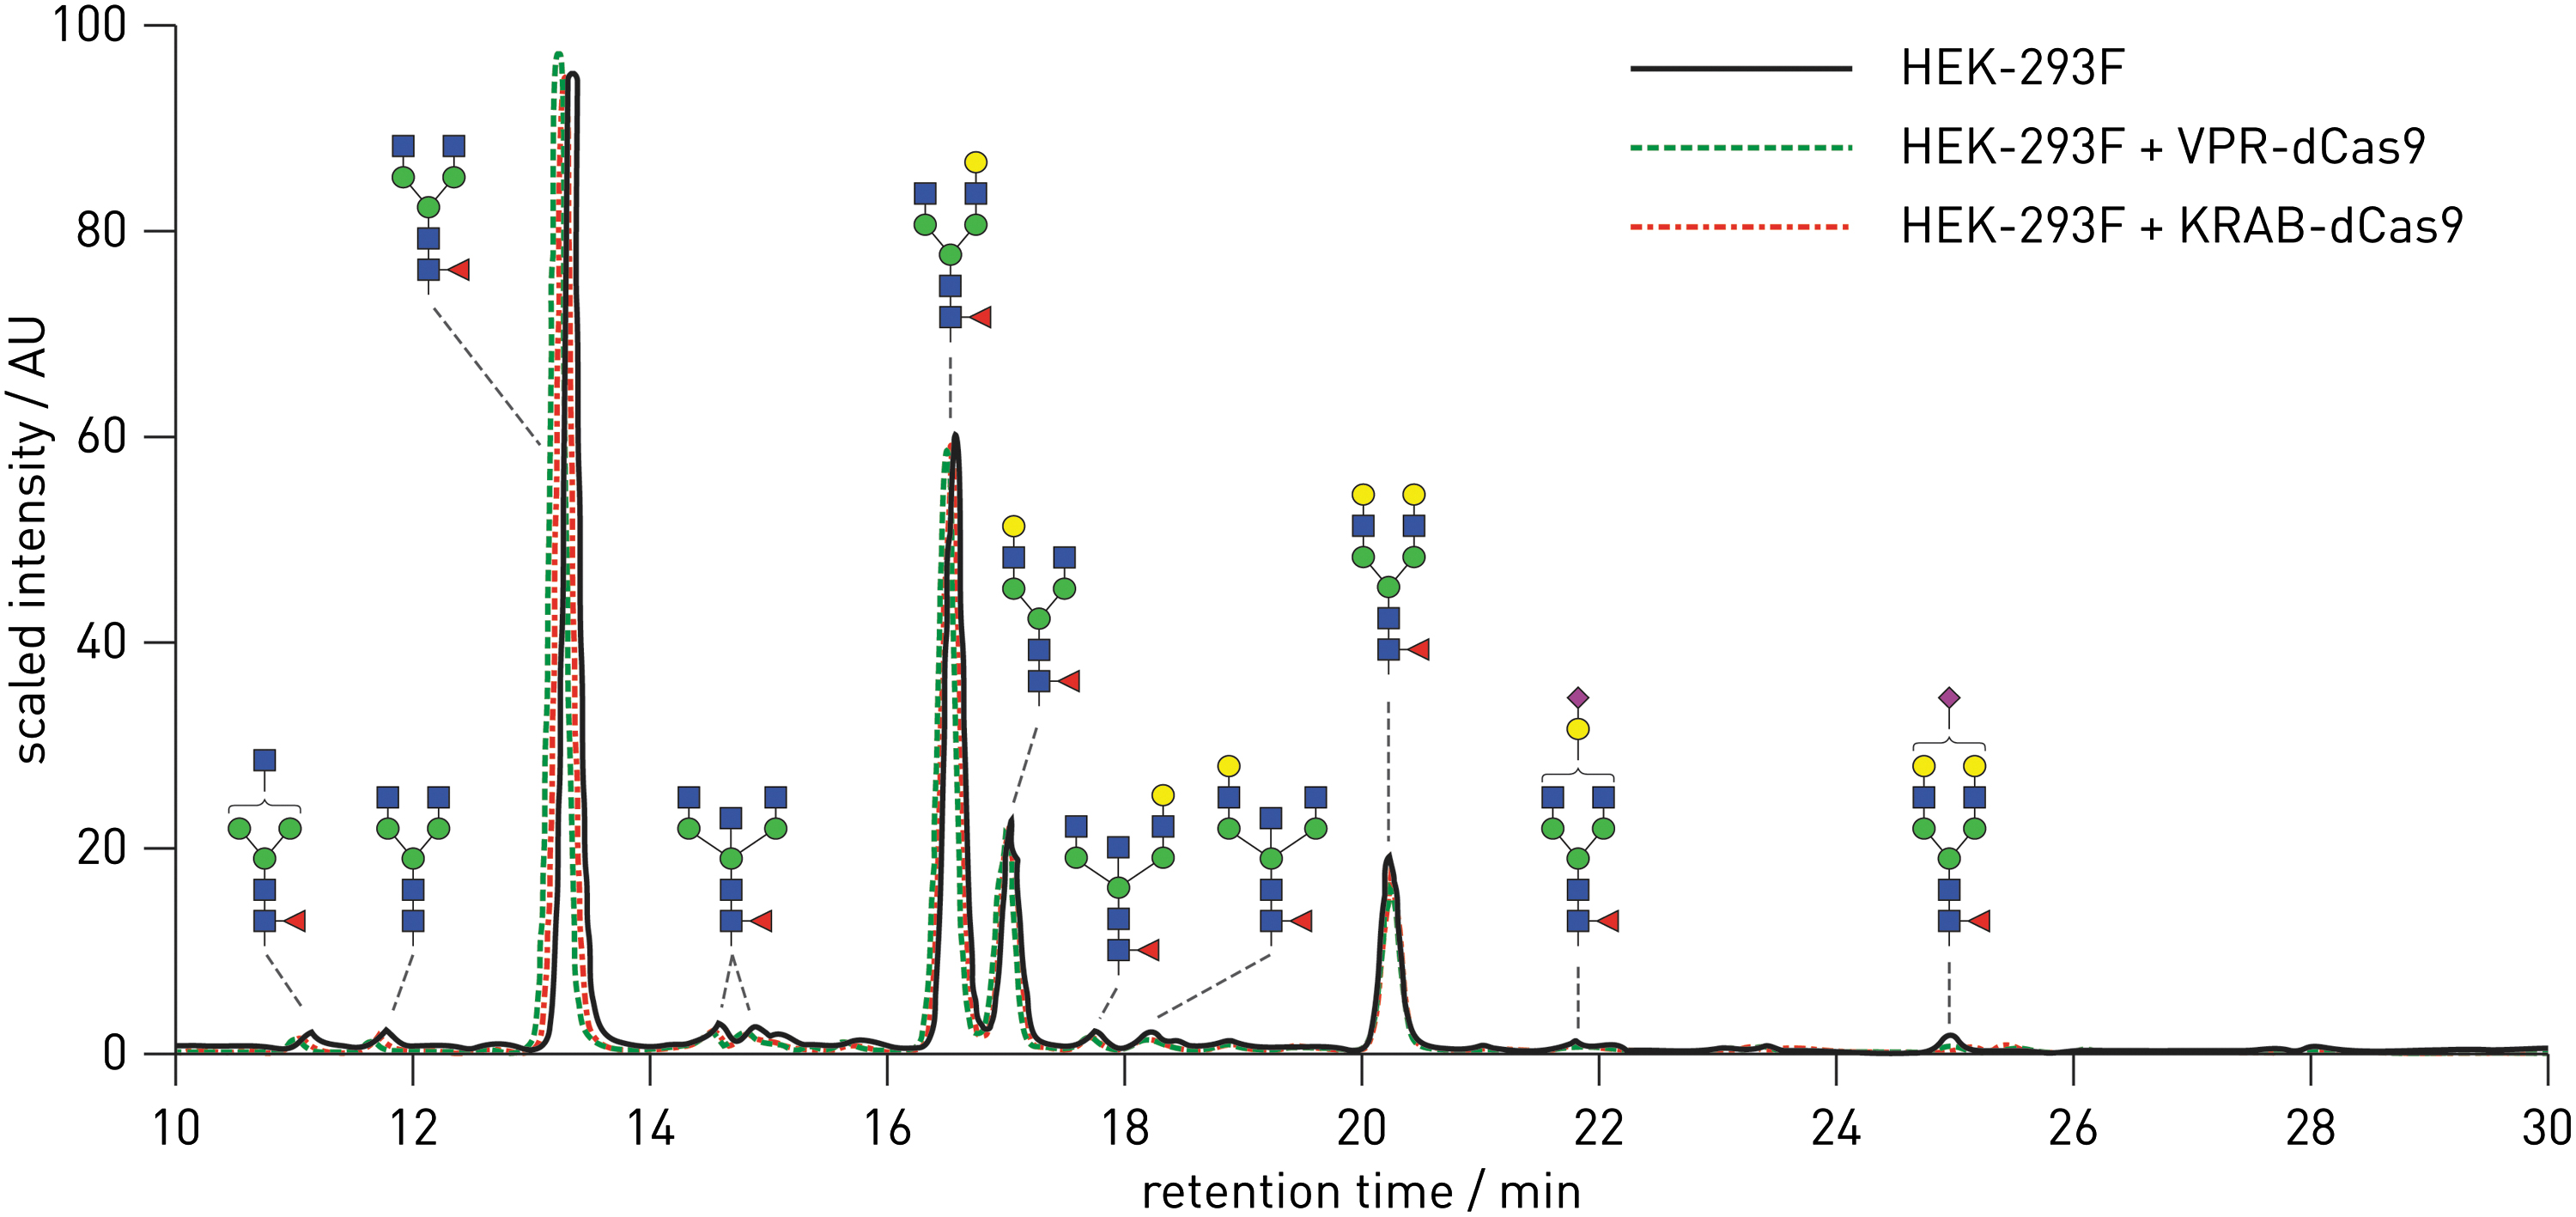
Comparison of N-glycan profiles of IgG produced in HEK-293F cells and in VPR-dCas9 and KRAB-dCas9 cell lines. The three profiles are scaled and overlapped, showing their similarity. Glycan structures contributing to each peak are shown using standard symbols. Color images are available online.
Manipulation of candidate glyco-genes in VPR-dCas9 and KRAB-dCas9 HEK-293F monoclonal cell lines
For testing the newly designed VPR-dCas9 and KRAB-dCas9 HEK-293F transient expression systems, we chose four glyco-genes (B4GALT1, FUT8, MGAT3, and ST6GAL1), encoding glycosyltransferases involved in biosynthetic pathways of the glycan structures found on IgG. We targeted these candidate genes using specific gRNAs. All four glyco-genes were detectably expressed in HEK-293F cells. Changes in gene expression as measured by RT-qPCR are given in Figure 3 (left panel). Overview of the relevant metabolic pathways is given in Figure 4. Changes relative to the reference housekeeping gene HPRT1 for all RT-qPCR data analyzed are given in Supplementary Table S5, indicating their baseline expression level in HEK-293F cells. Additional RT-qPCR raw data including those for RUNX3, GGA2, SPPL3, FUT8, and ST6GAL1 are given in Supplementary Table S6. Transcription levels were successfully modified for all four selected glyco-genes using VPR-dCas9 and the selected gRNAs. Following manipulation of gene expression, we observed changes in the glycosylation profile of IgG expressed in both HEK-293F stable cell lines (Fig. 5). Upon upregulation of B4GALT1 (coding for the enzyme that adds galactose to IgG) with VPR-dCas9, we observed an increase in galactosylated structures with a concomitant decrease in agalactosylated structures. Downregulation of B4GALT1 with KRAB-dCas9 showed the opposite effect on IgG glycosylation: a decrease in galactosylation, with a concomitant increase in agalactosylation. Decreased expression of FUT8 (coding for the enzyme that adds core fucose to IgG) using KRAB-dCas9 led to a decrease in fucosylation, while increased expression of MGAT3 (coding for the enzyme that adds bisecting GlcNAc to IgG) using VPR-dCas9 led to an increase in structures with bisecting GlcNAc. The upregulation of ST6GAL1 (encoding the enzyme that adds sialic acid to galactose containing glycan chain), using VPR-dCas9 and appropriate gRNAs, resulted in an increase in sialylated structures on IgG.
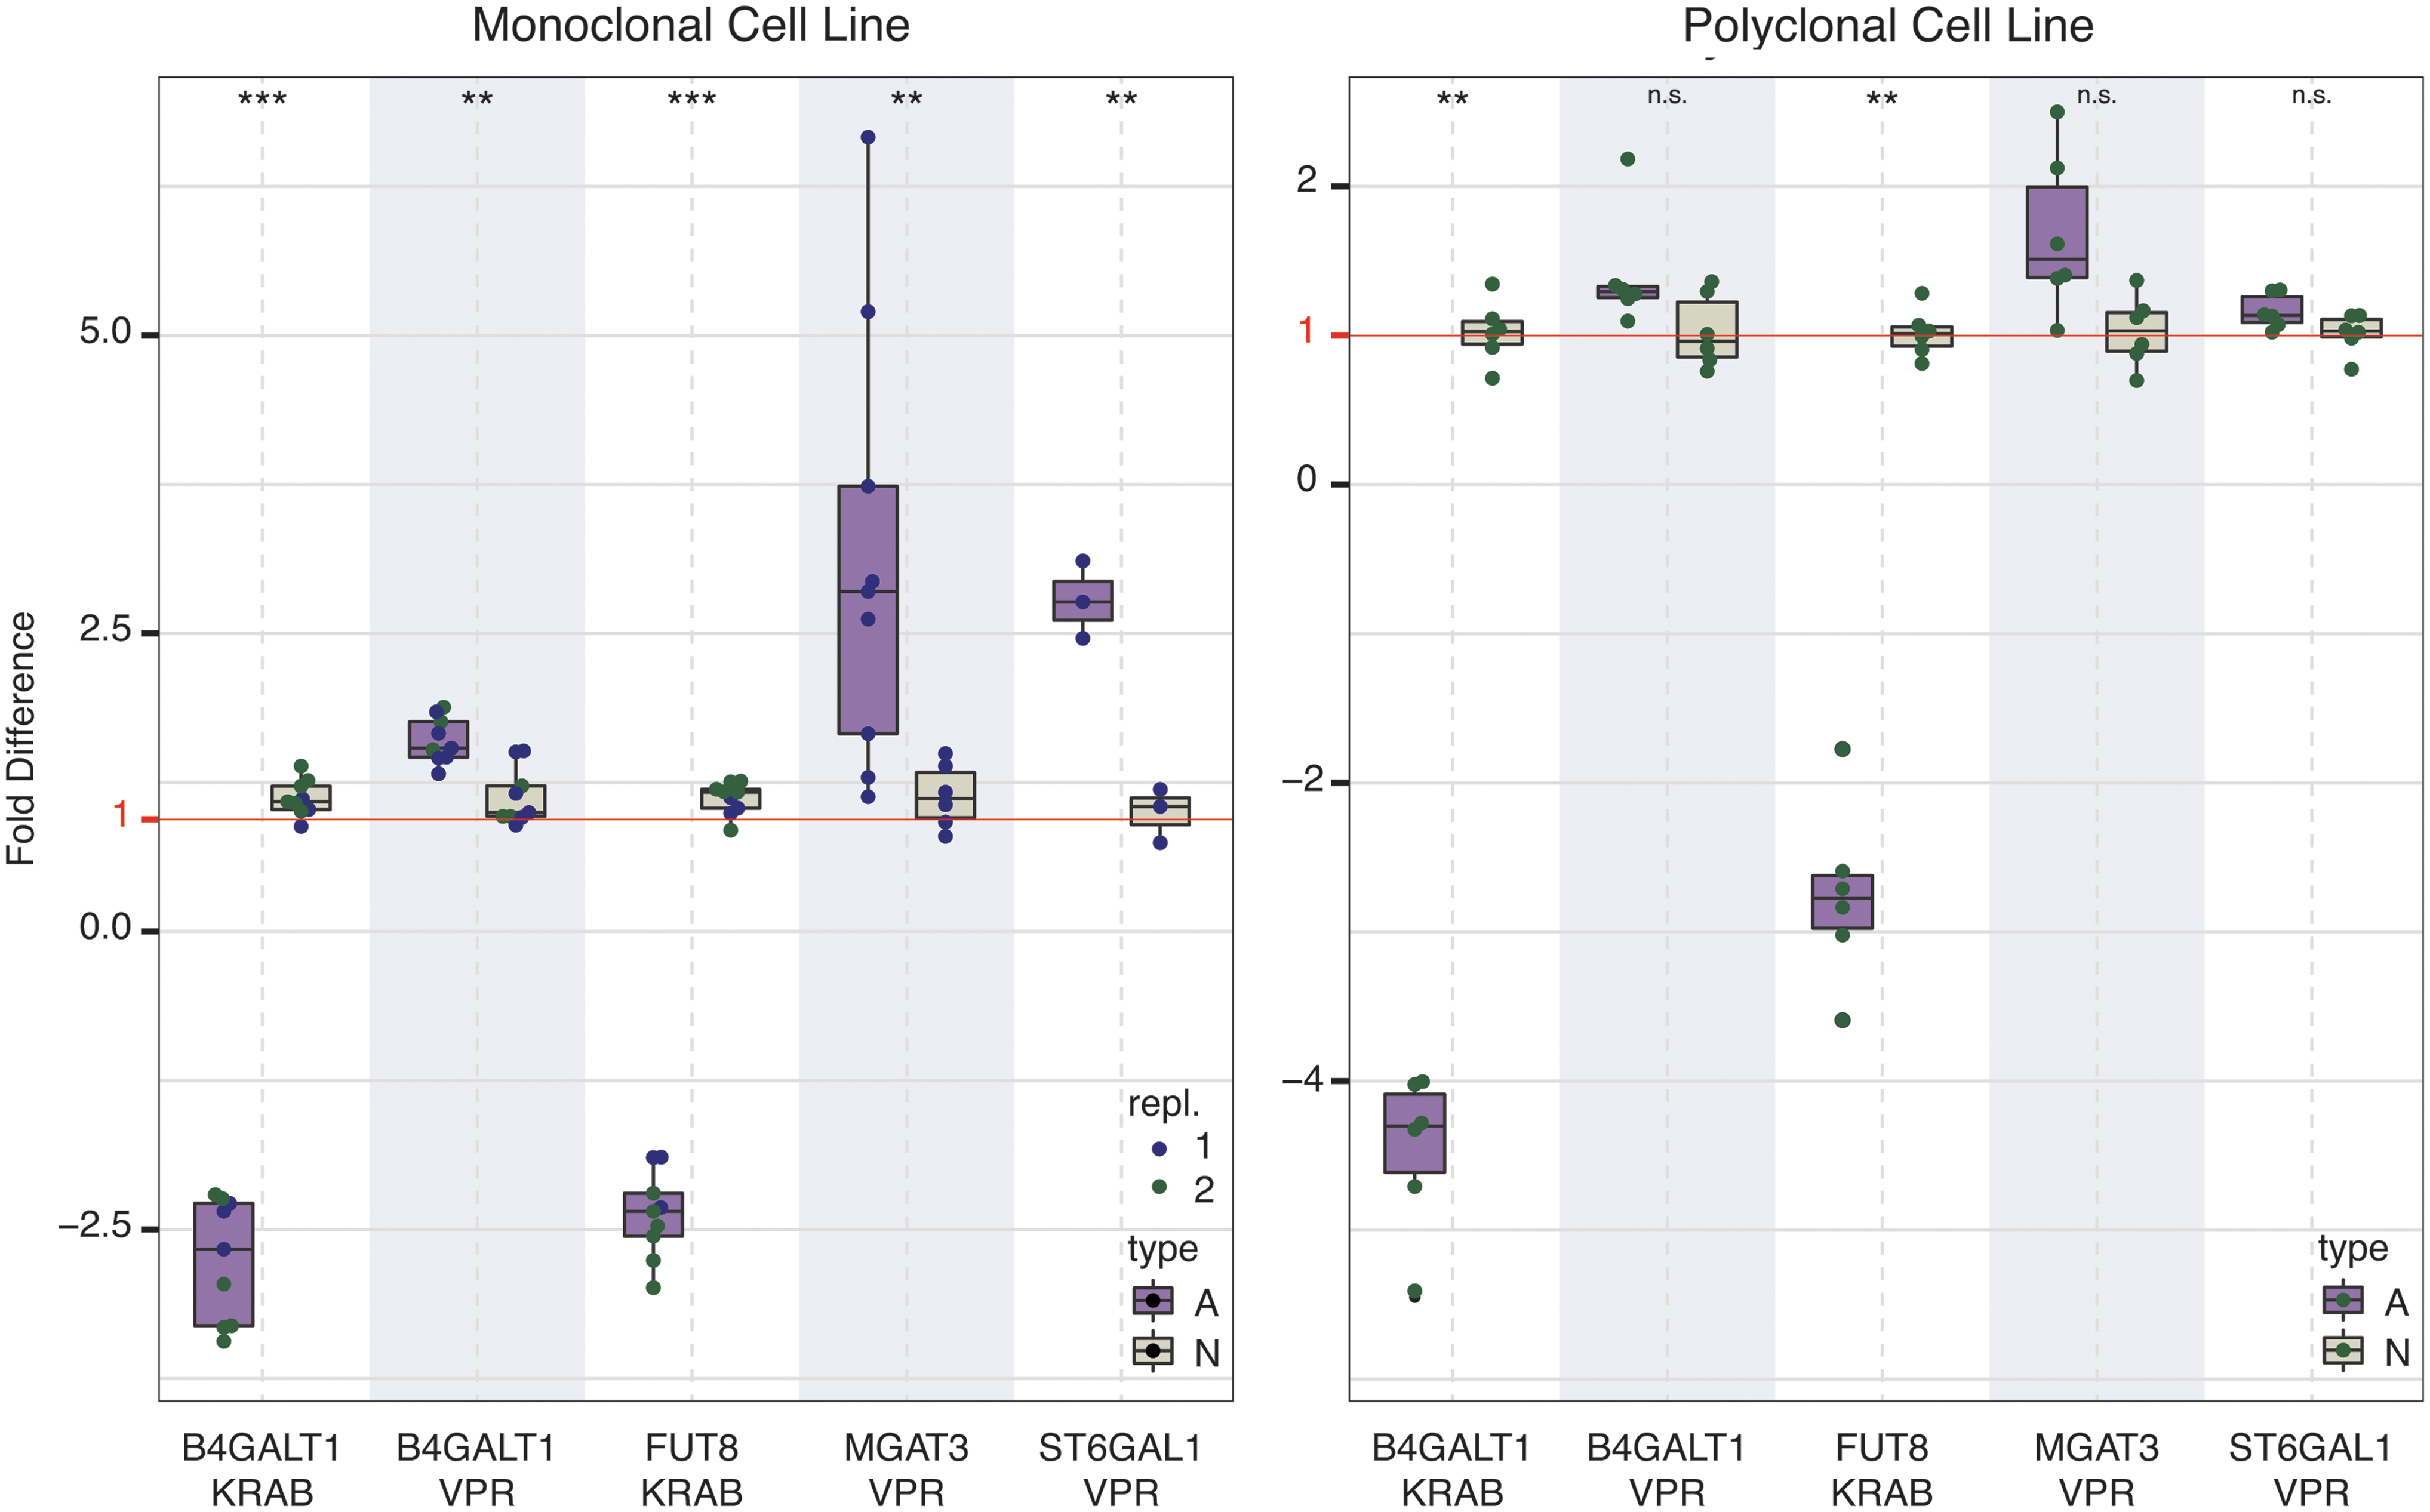
Changes in transcription of targeted genes as measured by RT-qPCR in monoclonal (left panel) and polyclonal (right panel) stable VPR-dCas9 and KRAB-dCas9 HEK-293F cell lines. Targeted glyco-genes and the type of stable HEK-293F cell line (VPR-dCas9 or KRAB-dCas9) used are indicated on the x-axis. Expression levels are shown as fold difference relative to the non-targeting control. The fold difference equals fold change for values >1; for fold change <1, a negative inverse is taken for better visual representation. For the monoclonal cell line, “repl” denotes the experimental replicate (independent experimental runs). Bars denoted with “A” (lavender) show experimental treatment, while “N” (tan) denotes non-targeting control. ***p < 0.001; **p < 0.01; *p < 0.05; n.s., not significant. RT-qPCR, reverse transcription quantitative polymerase chain reaction. Color images are available online.
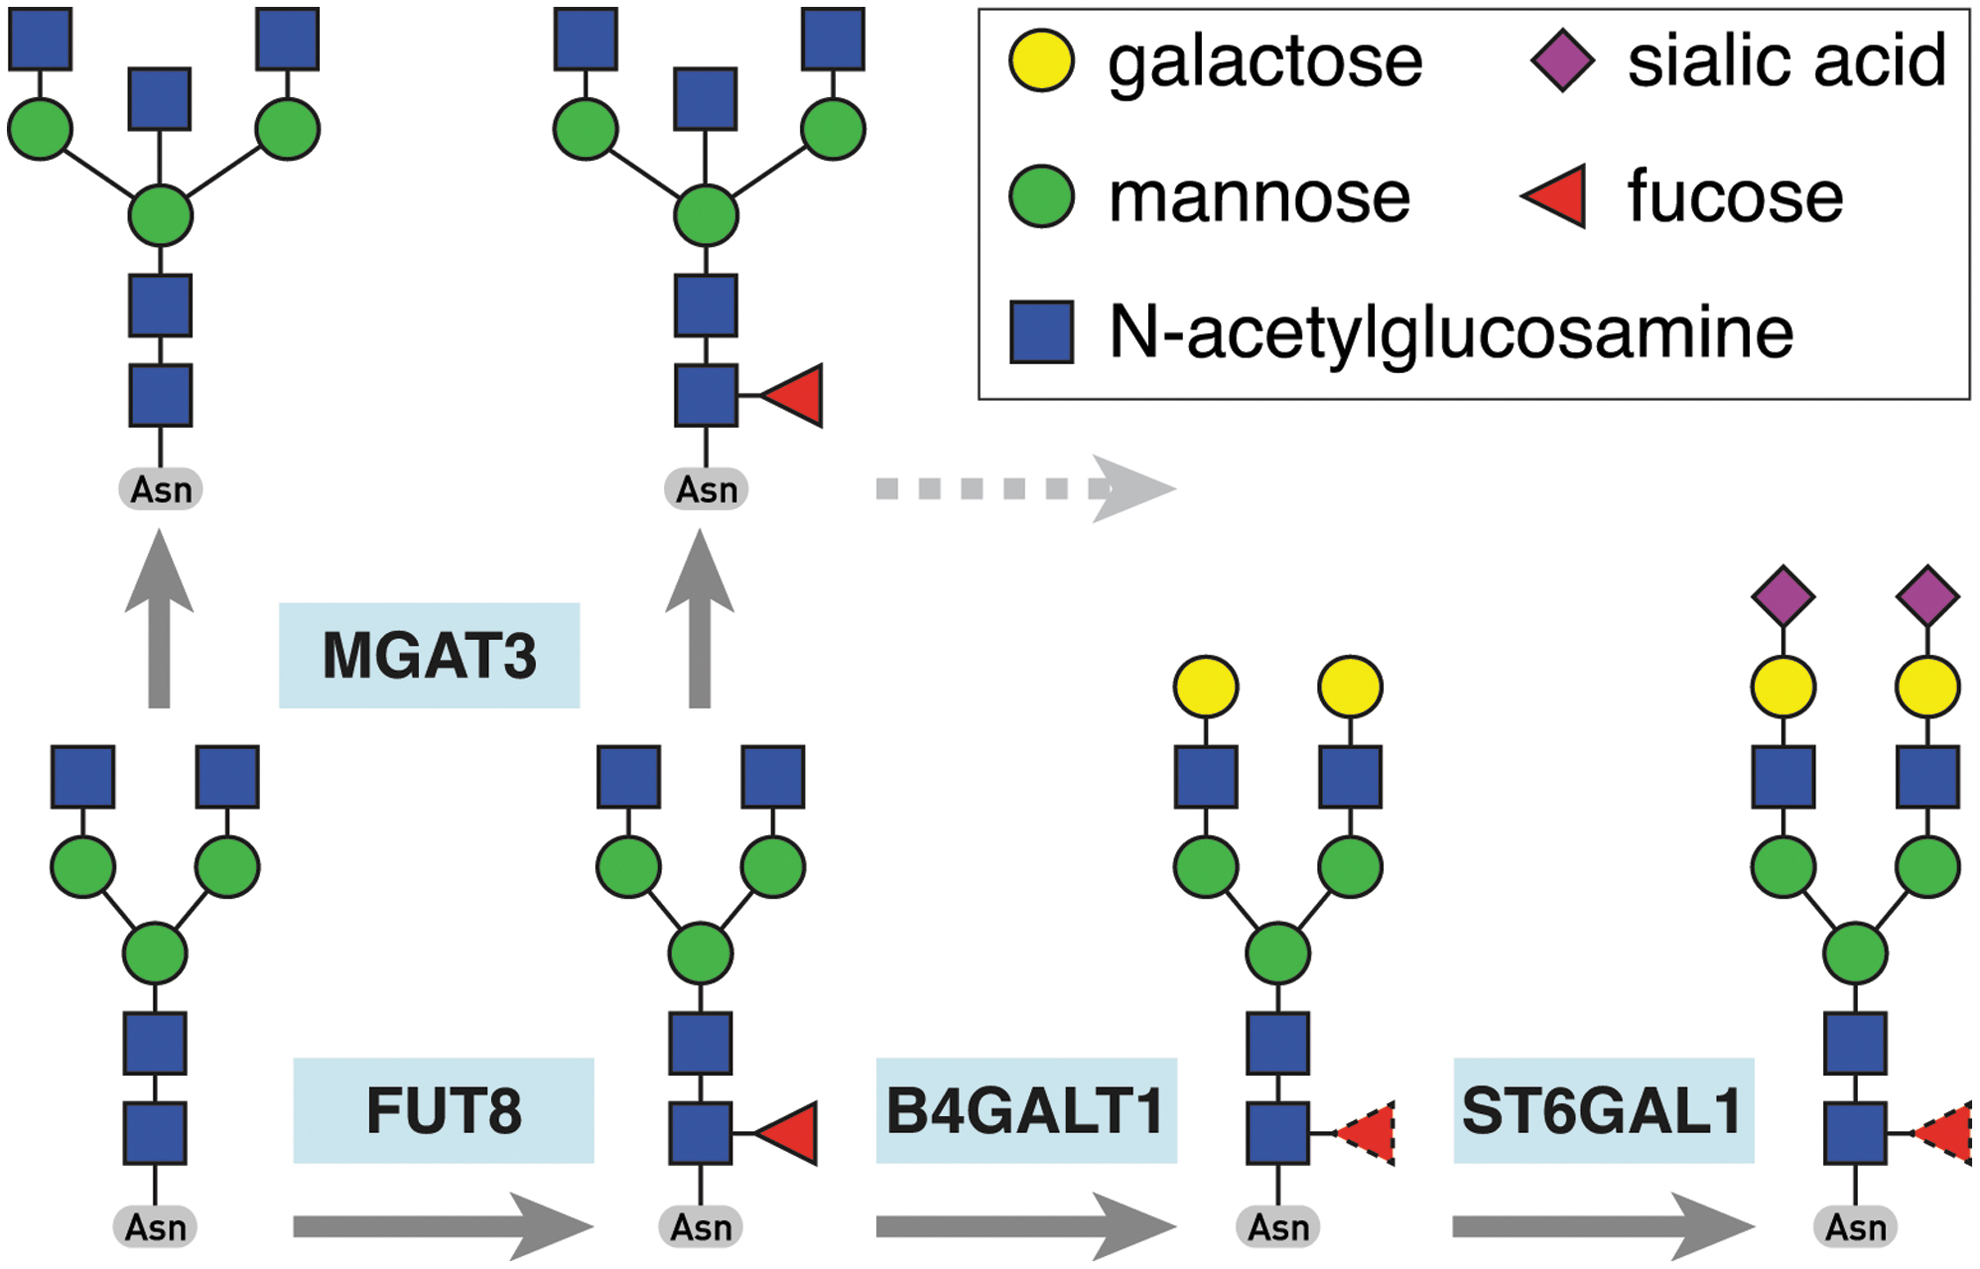
Simplified IgG glycosylation pathway showing the relevant genes encoding glycosyltransferases and the reactions they catalyze. Fucosyltransferase FUT8 adds a fucose to the core glycan structure, glycosyltransferase MGAT3 adds a bisecting N-acetylglucosamine to trimannose core of the glycan chain, while galactosyltransferase B4GALT1 and sialyltransferase ST6GAL1 extend the glycan structure with addition of galactose and sialic acid, respectively. Color images are available online.
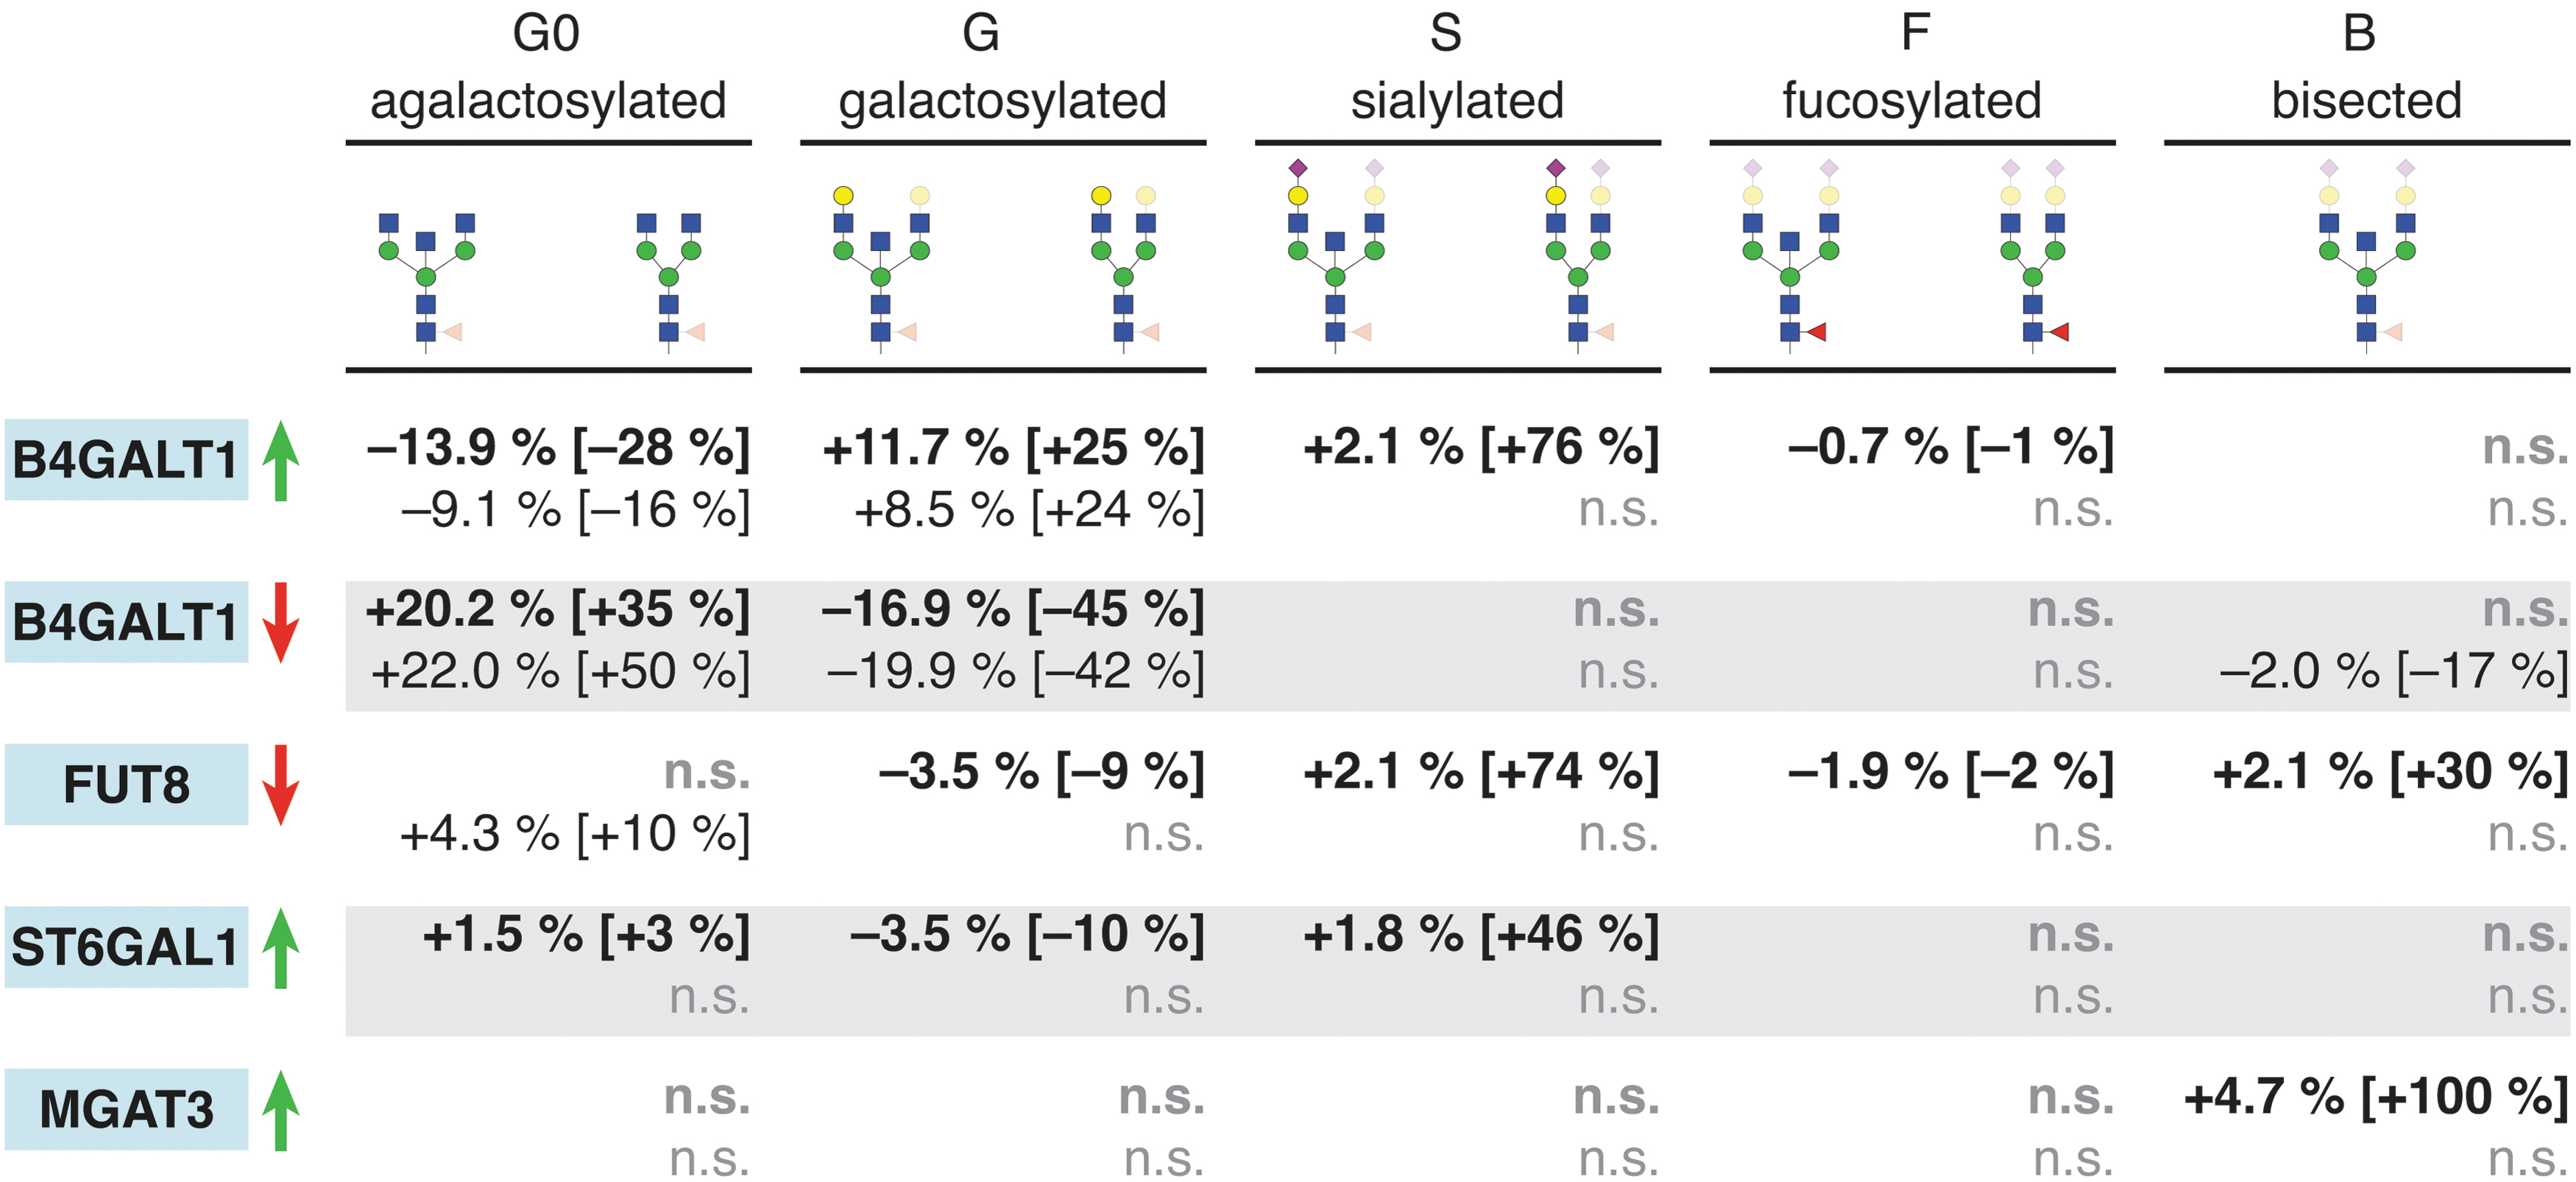
Effect of glyco-gene expression manipulation on IgG glycosylation profile. Right of the gene labels, the arrows indicate the direction of change in gene transcription (green up arrow: activation with VPR-dCas9; red down arrow: silencing with KRAB-dCas9). Glycan derived traits, as indicated, are shown for statistically significant (p < 0.05) changes as absolute change in percentage and as relative change (with non-targeting control as baseline) in square brackets. Upper line (bold typeface) shows data for monoclonal cell lines (nine biological replicates—independent samples, except for ST6GAL1, which was done in six biological replicates), while the lower line (regular typeface) shows results for the polyclonal cell line (six biological replicates). Color images are available online.
Manipulation of candidate glyco-genes in VPR-dCas9 and KRAB-dCas9 HEK-293F polyclonal cell lines and enrichment of transfected cells using MACS
In order to validate the data obtained using our monoclonal cell line–based system, the same experimental setup was repeated for all four genes using polyclonal VPR-dCas9 and KRAB-dCas9 HEK-293F cell lines. These polyclonal stable cell lines were also obtained by integration of dCas9 fusions and puromycin selection but without the limiting dilution step. Gene expression levels were comparable to those from monoclonal cell lines (Fig. 3, right panel). Transcription level of B4GALT1 (KRAB-dCas9), FUT8, and MGAT3 was significantly altered in the expected direction. Transcription level of B4GALT1 increased slightly (FC = 1.36), but the change was not statistically significant (p = 0.132). Changes in IgG glycosylation profile were similar to those measured in monoclonal cell lines (Fig. 5). The most robust change was related to galactosylation upon either up- or downregulation of B4GALT1, despite the fact that the change in transcription level of this gene (using VPR-dCas9) lacked statistical significance. However, no changes of sialylation and fucosylation could be observed following manipulation of ST6GAL1 and FUT8, and the modest relative increase (14.85%) in bisecting structures upon upregulation of MGAT3 was not statistically significant. Although results from the polyclonal cell lines largely matched those from the experiment in monoclonal lines, some parameters were not statistically significant, probably due to the decreased statistical power in the smaller sample (six replicates vs. nine in monoclonal cell lines).
After MACS enrichment of transfected cells, results of gene regulation, as measured by RT-qPCR, were similar to those before enrichment (Supplementary Fig. S5). The absolute rate of enrichment was 19–67% (48% difference) for B4GALT1/VPR, 38–77% (39%) for MGAT3, 31–75% (44%) for ST6GAL1, 19–66% (47%) for FUT8, and 33–70% (37%) for B4GALT1/KRAB.
Functional validation of genes associated with IgG glycosylation in VPR-dCas9 and KRAB-dCas9 HEK-293F monoclonal cell lines
As a proof of principle, we manipulated glycosyltransferases with a known role in IgG glycosylation and obtained expected glycan changes. Thus, we confirmed the usefulness of HEK-293F transient expression system, with stably integrated CRISPR-dCas9 fusions, for studying a potential role of any gene of interest in the process of IgG glycosylation. The next step was functional validation of the three genes associated with IgG glycosylation with hitherto unknown function in this process: RUNX3, GGA2, and SPPL3. The RUNX3 (runt-related transcription factor 3) and the GGA2 loci (Golgi associated gamma adaptin ear containing, ARF binding protein 2) were GWAS hits for IgG galactosylation and sialylation, respectively.19,22
SPPL3 protein (signal peptide peptidase-like 3) acts as an intramembrane-cleaving aspartyl protease of GxGD type, and it was demonstrated that its expression strongly affects intracellular glycosyltransferase levels and alters cellular N-glycosylation. 36 However, its role in glycosylation of IgG protein is not known. The three candidate genes were targeted using appropriate gRNAs in both VPR-dCas9 and KRAB-dCas9 HEK-293F monoclonal cell lines. Transcriptional level of these genes as well as N-glycosylation on IgG secreted from both cell lines were analyzed subsequently. All three genes were successfully up- or downregulated. However, IgG glycosylation was changed only in the case of RUNX3 and SPPL3 (Fig. 6). Upregulation of RUNX3 resulted in significant decrease of galactosylated structures with consequent increase in agalactosylated structures. Downregulation of SPPL3 was accompanied with hyperglycosylation phenotype, as sialylated and galactosylated structures were significantly increased with a concomitant decrease of agalactosylated glycans. Even though the transcriptional level of GGA2 was up- and downregulated in VPR-dCas9 and KRAB-dCas9 HEK-293F monoclonal cell lines, we could not observe any change in the IgG glycosylation profile. Additional data supporting the glycan analysis, with emphasis on raw UPLC chromatograms and their comparison, are given in Supplementary Figures S6–S21.
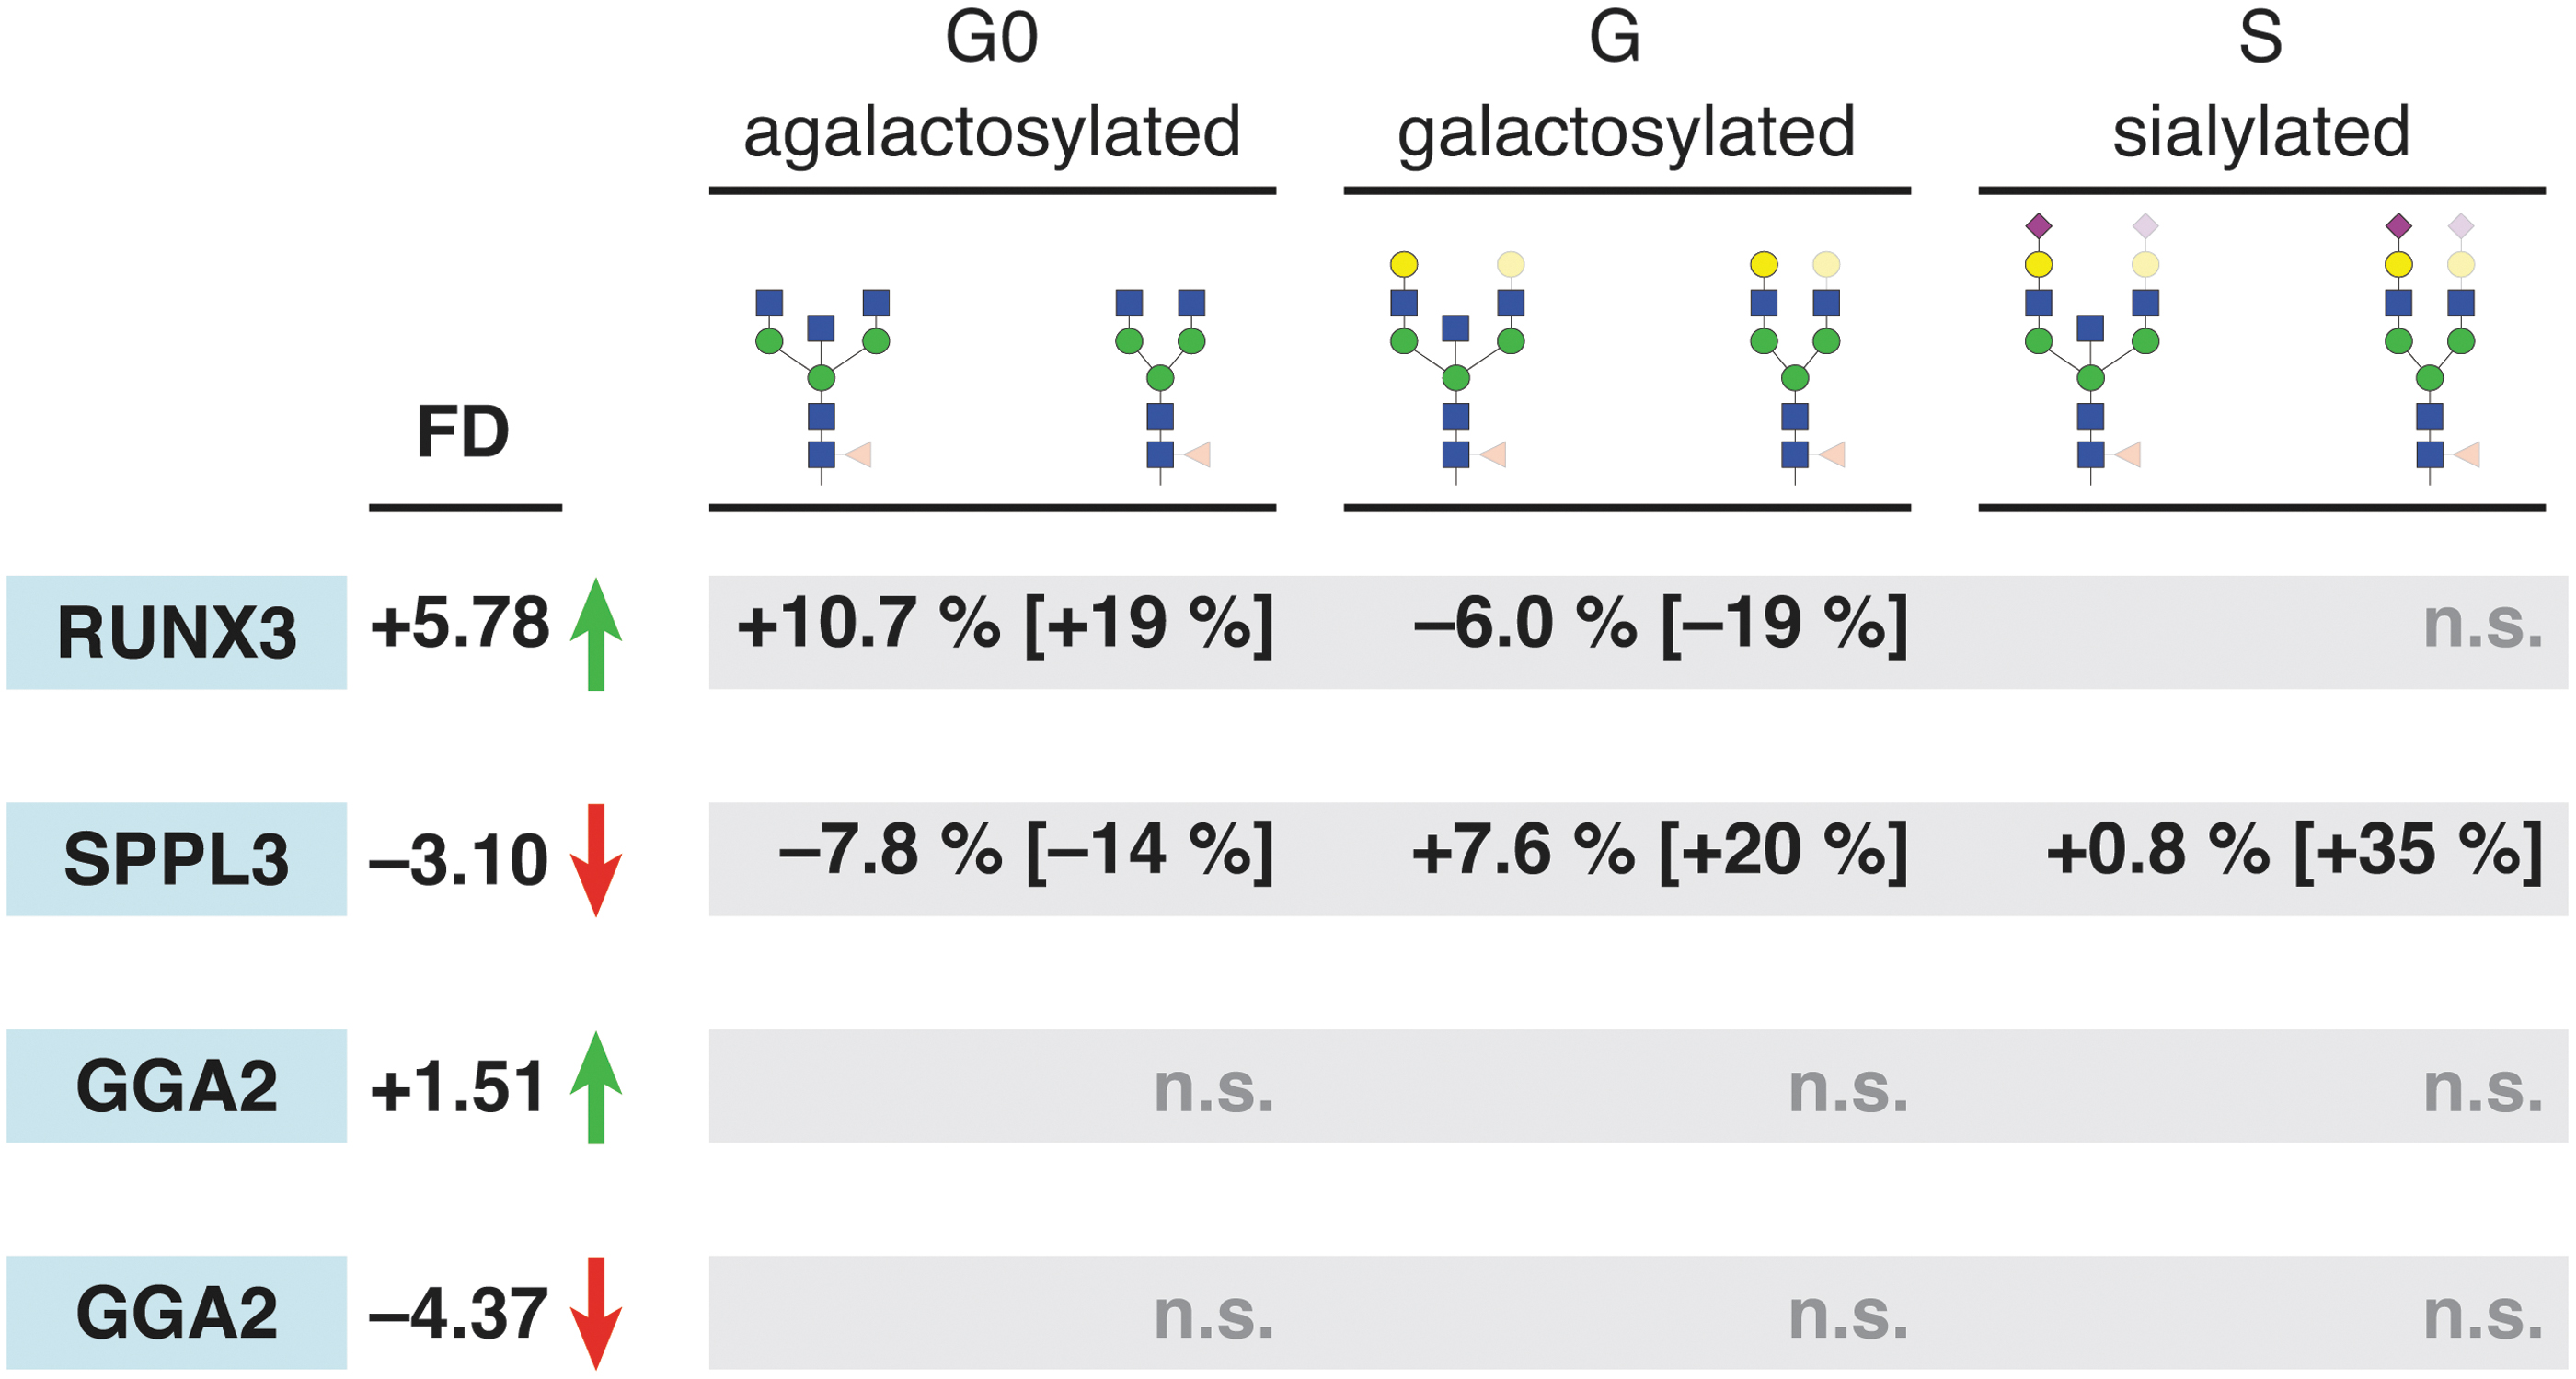
Some GWAS hits show effect on protein glycosylation. After changing expression of glycosyltransferases, we targeted GWAS hits implicated in various stages of protein glycosylation with dCas9-based effectors for transcriptional activation (VPR, green up arrow) or silencing (red down arrow). Changes in transcription are shown as fold difference (FD) and were significant to the level p < 0.05. Genes RUNX3 and SPPL3 were implicated in galactosylation and sialylation, respectively, and show differences in abundance of glycan structures accordingly. Relative differences (in square brackets) show a more profound change than absolute changes in percentage. All displayed changes are statistically significant (p < 0.05) unless denoted otherwise (n.s.). GWAS, genome-wide association studies. Color images are available online.
Statistical properties of IgG glycan data
In order to validate our statistical methods applied on glycan data, we used a previously published large data set (Klasić et al.; Edinburgh cohort, healthy controls, 120 observations) 34 fully compatible with our data. We found that glycan data can be transformed to normal distribution using the Box–Cox transformation for derived glycan traits “agalactosylated,” “galactosylated,” “monogalactosylated,” “digalactosylated,” “sialylated,” “monosialylated,” “disialylated,” “fucosylated,” and “bisected” (Supplementary Table S7). All derived traits passed multiple normality tests: Anderson–Darling, Cramer–von Mises, Lilliefors (Kolmogorov–Smirnov), Shapiro, and Shapiro–Francia tests (Supplementary Table S8). Thus, the usage of parametric statistical tests, which is implicitly necessary when pooling experiments using meta-analysis, is justified.
Discussion
Glycosylation is the most diverse post-translational modification of proteins, which increases the complexity of the human proteome by several orders of magnitude. 37 Alternative glycosylation is functionally important in multiple biological and pathophysiological processes, 38 but our understanding of molecular mechanisms regulating this template-free process is limited. The present knowledge is that glycome composition is inherited as a complex trait 39 regulated by a network of gene loci, 19 but mechanisms and roles of individual genes in this process are mostly unknown. Here, we report a design of a new and versatile transient system for IgG production based on an animal cell model, which can be used for functional validation of genes potentially involved in IgG glycosylation, identified by GWAS.19–22
This system is based on the CRISPR-dCas9 modular system for orthogonal gene manipulations, 25 extended by a PB integrase compatible vector, along with the system for IgG production in the HEK-293F cell line 24 (Fig. 1). While each individual component is useful on its own, the complete system represents a unique approach for studying effects of candidate gene up- or downregulation on IgG glycan phenotype. Stable integration of dCas9 fusions into the genome of HEK-293F cells facilitates the key step in gene manipulations, since cells do not have to be transfected with large plasmids encoding dCas9 fusions (typically 14 kbp and more) in each experiment. Since only the plasmid encoding IgG and gRNA needs to be transfected into a cell line with the dCas9 fusion already in place, the notoriously challenging step is fundamentally simplified, enabling high-throughput experimental setup, saving time and reagents costs. Different Cas9 orthologs (dSaCas9 and dSpCas9) were used in conjunction with effector domains conferring opposite activities (VPR, KRAB) to allow for antagonistic gene regulation if desired, although this configuration was not used in our experimental setup. A particularly elegant aspect of this system is colocalization of the IgG expression cassette (modified for monocistronic expression) and up to six simultaneously expressed gRNAs, which ensures that IgG is secreted only from the cells where targeted gene regulation also takes place. In cases when transcription needs to be analyzed in transfected cells, the system can be configured to include a MACS-based enrichment of transfected cells. We hypothesized that for small and moderately sized plasmids, this costly step could be omitted because of outstanding transfection efficiency (Supplementary Fig. S2). To be certain, we performed MACS-based enrichment on VPR-dCas9 and KRAB-dCas9 polyclonal cell lines after targeting B4GALT1, ST6GAL1, MGAT3, and ST6GAL1 and observed no statistically significant change in expression of these genes with or without MACS (Supplementary Fig. S5). This experiment further demonstrates the simplicity of our system, as there is no need for any type of selection of transfected cells.
The existing flexible platform for Golden Gate assembly 25 was extended with a new “backbone” (donor) plasmid, which enables easy genomic integration using the PB system. Essentially, the assembled cassette is flanked by appropriate ITR sequences, with additional insulator sequences that facilitate stable long-term expression following genomic integration. This method for stable integration is surprisingly efficient and much less technically demanding than lentiviral delivery. This approach is possible with cell lines, while lentiviral delivery is indispensable only when working with primary cells. Finally, if there is no need to have a cell line with strictly defined integrations, a polyclonal cell line shows sufficient reproducibility that it can be used instead of a monoclonal line. So, the time-consuming step of limiting dilution can be omitted. Our data set confirms that polyclonal cell lines can be used for most purposes. For all practical purposes, the answers from experiments with monoclonal and polyclonal cell lines were qualitatively identical, although polyclonal cell lines show somewhat weaker dCas9-based activity and glycosylation phenotype. To validate our newly developed system, we chose to manipulate four glyco-genes with known roles in IgG glycosylation: FUT8, encoding for alpha-(1,6)-fucosyltransferase, which adds fucose on a core of bi-antennary structure; B4GALT1, encoding for beta-1,4-galactosyltransferase 1, which transfers galactose to N-acetylglucosamine (GlcNAc); MGAT3, encoding for beta-1,4-mannosyl-4-beta-N-acetylglucosamintransferase, which produces bisecting GlcNAc; and ST6GAL1, encoding for beta-galactosidase alpha-2,6-sialyltransferase, which adds sialic acid to galactose containing glycan chain. Indeed, IgG glycosylation is dependent on expression levels of these glycosyltransferases in the secretion pathway of plasma B cells, whose function is mimicked by our transient system based on HEK-293F cells. Since the glycan profile of HEK-293F cells showed a low abundance of glycans with bisecting GlcNAc and sialic acids, expression of ST6GAL1 and MGAT3 was manipulated in order to increase the relative abundance of those structures. Likewise, FUT8 was only manipulated with KRAB in order to downregulate its expression and increase the abundance of glycans without a core fucose, which are ordinarily underrepresented in the glycan profile of HEK-293F cells. When FUT8, B4GALT1, MGAT3, and ST6GAL1 were up- and downregulated with VPR-dCas9 and KRAB-dCas9 fusions, we obtained expected changes in glycan abundances in the monoclonal cell line. Most of the changes were replicated in the polyclonal cell line. When upregulating B4GALT1 using VPR-dCas9, we observed not only the expected increase in the level of glycans with galactose, but also a small but statistically significant increase in the level of glycans with sialic acid. Similar results have already been reported previously 24 and can be explained simply by the presence of increased levels of glycans with galactose(s), which actually serve as acceptor substrates for sialyltransferase ST6GAL1. However, it has also been demonstrated that the enzymes B4GALT1 and ST6GAL1 interact with each other, and that the activity of both enzymes is higher when they act together in a complex.40,41 Therefore, it is possible that following VPR-dCas9-based transcriptional activation of the B4GALT1 gene, the increased level of B4GALT1 enzyme led to increased formation of B4GALT1/ST6GAL1 heterodimers, which then increased the catalytic activity of ST6GAL1 and resulted in a slight increase in the level of glycans with sialic acid. Silencing of the FUT8 gene with KRAB-dCas9 resulted in an approximately 60% decrease in FUT8 mRNA, but such a decrease in mRNA level was accompanied by only a very small decrease in the level of fucosylated IgG glycans (around 90% of total glycans that originated from IgG obtained from HEK cells after KRAB-dCas9-based silencing of the FUT8 gene corresponded to glycans with core fucose). In humans, around 95% of all glycans attached to blood plasma IgG contain core fucose. 42 It has also been observed that the level of total (summed) IgG glycans with core fucose does not vary much between individuals from the general population (the level of fucosylated IgG glycans is generally high in individuals from the general population and ranges from 87% to 97%, and the minimum level observed in the general population was 68%). 42 Moreover, it has been demonstrated that the degree of protein fucosylation generated by the action of the FUT8 enzyme is dependent on the context of the protein. 43 Our results indicate that the residual expression level of fucosyltransferase 8 after KRAB-dCas9-based silencing of the FUT8 gene was still sufficient to enable efficient fucosylation of IgG glycans.
It should be noted that the expression of glycosyltransferases is generally low in HEK293 cells (and derived cell lines). For this reason, it is possible that even small changes in expression (especially as seen in polyclonal cell lines) result in detectable glycan changes. In the context of SPPL3 and its role in protein galactosylation, it is possible that even small changes in B4GALT1 expression compensate for SPPL3 activity. Along with a generally low abundance of glyco-gene products (enzymes) in cells, their known activity as homo- and heterodimers might exacerbate the effect of small transcriptional changes due to kinetics more sensitive to the abundance of the enzyme, with a critical concentration required for dimerization. This is a highly speculative but plausible explanation.
Results for gene expression and glycan change were comparable for mono- and polyclonal cells, which validates both systems as fit for reproducible functional analysis of candidate genes potentially involved in IgG glycosylation. Also, it should be noted that the percentage of transfected cells after MACS enrichment was about equal to transfection efficiency with the smaller plasmid without LNGFR. Therefore, no difference in change in expression of targeted genes between gRNA-only and gRNA-LNGFR plasmids was observed, since a higher transfection efficiency exactly balanced the level of enrichment by MACS. Still, the MACS option is potentially useful in cases of transfection with larger constructs, where the size of the LNGFR marker would be a small percentage of the total plasmid size (therefore having only a minor influence on transfection efficiency). In such scenario, one or two rounds of MACS enrichment process could dramatically increase the percentage of transfected cells, thus removing background noise or obviating the need for antibiotic selection.
After a successful validation of our system using glyco-genes with known function in IgG glycosylation as a proof of principle, we chose three gene loci associated with IgG glycosylation with yet unknown exact role in this process. Two of the loci—RUNX3 and GGA2—are recently published GWA hits for IgG glycosylation,19,22 while SPPL3 was shown to liberate medial/trans-Golgi glycosyltransferases from their N-terminal membrane anchors to regulate the intracellular pool of active Golgi glycosyltransferases and the extent of N-glycosylation of cellular glycoproteins. 44 However, its role in glycosylation of a single plasma protein such as IgG has not yet been studied. We were able to confirm the role of the two loci, RUNX3 and SPPL3, in IgG glycosylation, while manipulation of the GGA2 gene did not show any effect on IgG glycans. Upregulation of RUNX3 in the VPR-dCas9 monoclonal cell line resulted in a decrease in galactosylated structures with a concomitant increase in agalactolysed structures (Fig. 6). To explore the pathway involving RUNX3 and its effect on IgG galactosylation further, we measured the transcriptional activity of B4GALT1 following RUNX3 upregulation. However, no significant changes in B4GALT1 transcript levels were observed. This might suggest that RUNX3 does not suppress B4GALT1 directly but rather through some indirect pathway that should be investigated further. Indeed, Klarić et al. 19 proposed a functional network of loci associated with IgG glycosylation where most of the nodes clustered around a group of TFs known to have central roles in B-cell maturation and differentiation, and RUNX3 was one of them. This clustering suggests that the regulatory network acting in B lymphocytes is driven by transcription factors and affects the expression of key glycosyltransferase enzymes either directly or through a complicated TF-driven network.
Upregulation of SPPL3 in the VPR-dCas9 monoclonal cell line was followed by hyperglycosylation of plasma IgG antibodies, which is in line with the model of SPPL3 activity on cellular glycoproteins proposed by Voss et al. 36 One of the first identified SPPL3 substrates was MGAT5 (alpha-1,6-mannosylglycoprotein 6-beta-N-acetylglucosaminyltransferase) responsible for biosynthesis of branched, complex-type N-glycans, 36 which are, however, not present in the IgG glycan profile. Recently, secretome analysis of Sppl3–/– mouse embryonic fibroblasts (MEFs) identified B4GALT1 and ST6GAL1 as possible SPPL3 substrates. 45 The significant increases in galactosylation and sialylation that we observed after manipulation of SPPL3 (Fig. 6) are in accordance with secretome studies in MEFs, and they highlight the importance of SPPL3 in the regulation of B4GALT1 and ST6GAL1 activity in IgG glycosylation.
In conclusion, we demonstrated that our newly developed system with stably integrated CRISPR-dCas9 fusions for transient expression of IgG is an excellent tool for studying role of genes associated with IgG glycosylation by GWAS. Although the system was designed specifically for studying IgG glycosylation, it can easily be repurposed to serve as a model for other proteins and their posttranslational modifications, with appropriate targeting via gRNA. Further, many technologies developed in this study can be used alone or as an extension of the modular dCas9-based system for orthogonal gene regulation and epigenetic manipulation. 25
Footnotes
Author Disclosure Statement
G.L. is the founder and owner of Genos Ltd., a private research organization that specializes in high-throughput glycomic analyses and has several patents in this field. J.K. is an employee of Genos Ltd. None of the other authors has any conflicts of interest to declare.
Funding Information
The work on design and generation of the CRISPR-dCas9-based transient system for IgG production and gene manipulations performed in the Laboratory of Epigenetics, Faculty of Science, University of Zagreb, was supported by Centre of Competence in Molecular Diagnostics grant (#KK.01.2.2.03.0006), Croatian National Centre of Research Excellence in Personalized Healthcare grant (#KK.01.1.1.01.0010), and European Regional Development Fund Grant, project CasMouse (#KK.01.1.1.04.0085). Glycosylation analysis was performed in the Genos Glycoscience Research Laboratory and was partly supported by the European Union's Horizon 2020 grant IMForFuture (grant #721815), Centre of Competence in Molecular Diagnostics grant (#KK.01.2.2.03.0006), and Croatian National Centre of Research Excellence in Personalized Healthcare grant (#KK.01.1.1.01.0010).
References
Supplementary Material
Please find the following supplemental material available below.
For Open Access articles published under a Creative Commons License, all supplemental material carries the same license as the article it is associated with.
For non-Open Access articles published, all supplemental material carries a non-exclusive license, and permission requests for re-use of supplemental material or any part of supplemental material shall be sent directly to the copyright owner as specified in the copyright notice associated with the article.