
Abstract
Introduction:
Often, bioinformatics uses summary sketches to analyze next-generation sequencing data, but most sketches are not well understood statistically. Under a simple mutation model, Blanca et al. analyzed complete sketches, that is, the complete set of unassembled k-mers, from two closely related sequences. The analysis extracted a point mutation parameter θ quantifying the evolutionary distance between the two sequences.
Methods:
We extend the results of Blanca et al. for complete sketches to parametrized syncmer sketches with downsampling. A syncmer sketch can sample k-mers much more sparsely than a complete sketch. Consider the following simple mutation model disallowing insertions or deletions. Consider a reference sequence A (e.g., a subsequence from a reference genome), and mutate each nucleotide in it independently with probability θ to produce a mutated sequence B (corresponding to, e.g., a set of reads or draft assembly of a related genome). Then, syncmer counts alone yield an approximate Gaussian distribution for estimating θ. The assumption disallowing insertions and deletions motivates a check on the lengths of A and B. The syncmer count from B yields an approximate Gaussian distribution for its length, and a p-value can test the length of B against the length of A using syncmer counts alone.
Results:
The Gaussian distributions permit syncmer counts alone to estimate θ and mutated sequence length with a known sampling error. Under some circumstances, the results provide the sampling error for the Mash containment index when applied to syncmer counts.
Conclusions:
The approximate Gaussian distributions provide hypothesis tests and confidence intervals for phylogenetic distance and sequence length. Our methods are likely to generalize to sketches other than syncmers and may be useful in assembling reads and related applications.
INTRODUCTION
Next-generation sequencing has expanded nucleic acid databases so rapidly that some sequence comparisons now occur on the petabase scale (Edgar et al., 2022; Schmidt and Hildebrandt, 2017). At this scale, a sequence is often summarized by a sketch, a set of short oligonucleotides called submers, judiciously selected from the sequence (Edgar, 2021). Sketches can bypass slow computations like assembly and alignment with alignment-free methods, for example, they can compare sequences by exact matching of submers, possibly with hashes or probabilistic methods like Bloom filters.
Call an oligonucleotide of length k a k-mer. The set of all k-mers in a sequence can be viewed as a complete sketch. In contrast, given a hash function from k-mers to numbers, the MinHash sketch uses only the k-mers producing the s smallest hashes to summarize a sequence. Several central limit theorems (CLTs) relevant to the complete and MinHash sketches (Blanca et al., 2022) are available to sharpen the many applications of k-mer-based methods, including database search (Harris and Medvedev, 2020; Solomon and Kingsford, 2016), metagenomic sequence comparison (Wood and Salzberg, 2014), and alignment-free sequence comparison (Ondov et al., 2016; Sarmashghi et al., 2019; Song et al., 2014). For fixed size s, however, the s submers in a MinHash sketch become less dense within the sequence as the sequence length grows.
Motivated by applications better served by sketches that approximate a fixed density throughout a sequence (see, e.g., Manber, 1994), investigators have developed several other selection rules for submers (Shaw and Yu, 2022). On one hand, some sketches (universal hitting sets, polar sets, etc. [Orenstein et al., 2017; Zheng et al., 2021]) do not require explicit probability models, the foundation of our methods. On the other hand, probability models have usefully analyzed sketches based on submers like minimizers (Roberts et al., 2004; Schleimer et al., 2003), minimally overlapping words (Frith et al., 2021), and syncmers (Edgar, 2021). Minimizers are among the oldest submers (Roberts et al., 2004; Schleimer et al., 2003), and they and related techniques have many mature applications such as read mapping (Li, 2018), taxonomy (Wood et al., 2019), and sequence assembly, among others (Roberts et al., 2004; Sommer et al., 2007; Ye et al., 2012). Other submers may eventually prove superior to minimizers in such applications, so the present article presents CLTs pertinent to a sketch of current interest, based on parametrized syncmers (Dutta et al., 2022). Like the complete and MinHash sketches (Blanca et al., 2022), syncmer sketches can provide an estimate of average nucleotide divergence (Ondov et al., 2016) to which we add sampling errors, enriching applications to phylogeny reconstruction (Morgenstern et al., 2015).
Originally, Edgar (2021) emphasized two types of syncmers, closed and open. Dutta et al. (2022) generalized Edgar’s ideas elegantly with parametrized syncmers. Both articles note that a simple technique, random downsampling, can reduce syncmer density as desired. The present article embraces the full generality of parametrized syncmers under possible downsampling. Henceforth, “syncmers” usually refers to parametrized syncmers.
Blanca et al. (2022) produced some CLTs for complete k-mer sketches, so the present article presents Gaussian approximations relevant to unordered sets of syncmers. Empirical evidence suggests that the approximations are useful, and the SI (Supplementary Information) derives them through “proofs” containing uncontrolled approximations. In a mild abuse of language, therefore, we refer to our Gaussian approximations as CLTs.
Let the simple mutation model of the Abstract generate a mutated sequence B from sequence A, where A is a reference sequence or some subsequence from it. Our main theorem, the conserved syncmer CLT, estimates with sampling error the phylogenetic distance between A and B. We also give a syncmer CLT that estimates with sampling error the length of the mutated sequence. Syncmer counts alone yield a p-value that can flag the presence of statistically significant insertions or deletions for further investigation. Our code implements the conserved syncmer and syncmer CLTs.
As motivation, our conserved syncmer CLT has at least one promising future application. Consider the problem of mapping a query sequence onto a reference genome. The reference genome should be chosen from among alternatives by minimizing its phylogenetic distance to the query sequence. If the query sequence is represented by a set of unassembled reads without sequencing errors (under present technology, an unrealistic assumption) and without gaps in coverage, it yields a sketch consisting of an unordered set of syncmers. Our conserved syncmer CLT can estimate phylogenetic distance by comparing the unordered sketches from the query sequence and the genomes. The syncmer CLT can also estimate the length of the query sequence from its unordered sketch, without requiring assembly. Our CLTs furnish sampling errors for all their estimates. Most applications of the CLTs require a k-mer uniqueness condition (stated formally in Section 2.1): informally, within each pairwise comparison of query and reference sequences, identical k-mer sequences usually imply k-mer homology.
Sequencing errors obstruct mapping of unassembled reads as a present application because the reads require arduous postprocessing and comparison to remove their errors. A syncmer sketch is a subset of the complete sketch, however, so its selection may reduce the postprocessing required to remove relevant errors from unassembled reads. Regardless, the future application of our results to unassembled sequences does not exclude other more accessible applications. For example, the conserved syncmer and syncmer CLTs still apply if the query sequence is represented by a (relatively) error-free draft genome.
For practicality, the main text focuses on the concepts required to use our code knowledgeably. In overview, it makes some educated guesses about Gaussian approximations relevant to syncmers and then verifies the accuracy of the guesses empirically. Although the statements and their verifications can be understood to the level of detail given, the SI indicates the intuition behind the approximations and contains the details of computing the Gaussian parameters. Section 2 states our two CLTs informally using aggregate parameters such as means and variances. It summarizes the mathematical results used in the code, deferring detailed technical derivations and lengthy formulas to the Supplementary Data S1. Our GitHub site http://tinyurl.com/syncmer-clt also explains the detailed running of the code. Section 3 assesses the accuracy of the CLTs empirically with simulations. It also examines the practical performance of the CLTs in determining the lengths of 25 mitochondrial sequences and their average nucleotide identity (ANI) when compared with a reference mitochondrial sequence for Homo sapiens neanderthalensis. The ANIs were computed from syncmer counts, so all mitochondrial genomes (including the reference genome) could have been represented by unassembled reads.
The SI contains some ancillary results of independent interest, for example, it gives the distribution of syncmer overlaps. Its main purpose, however, is to demonstrate our CLTs under the assumption that every k- and s-mer in the relevant sequences is unique. Unlike Blanca et al. (2022), we also offer several heuristics to control the practical errors in our CLTs caused by k- and s-mer replicates. When optimizing syncmer parameters for specific purposes, the heuristics can speed empirical experimentation with k- and s-mer lengths, so Sections 3 and 4 state and examine the heuristics.
METHODS
String notations: Let “
The simple mutation model—prior work
To formalize Section 1’s description, consider two strings of equal length, one a reference sequence
Applications of the simple mutation model usually require some version of the following k-mer uniqueness condition, mentioned in Section 1. For every k-mer sequence x, let the multiplicity
In some applications, B is homologous to A within a larger genome A*, requiring an extension of the k-mer uniqueness condition to A* outside A. The extended k-mer uniqueness condition includes the k-mer uniqueness condition, along with (4) if
Parametrized syncmers—prior work
k-Mer order
Given
Some hashing applications to double-stranded DNA consider two k-mers sequences equivalent if they are reverse complements of each other. Canonical hash functions map reverse complementary k-mers sequences
Syncmer sketches
The submers relevant to the present article are parametrized syncmers (Dutta et al., 2022). Although the following describes them in full generality, a reader who understands only open syncmers (Edgar, 2021) can understand our CLTs. Our notations mostly follow Edgar (2021), who invented syncmers, and Dutta et al. (2022), who introduced parametrized syncmers.
To describe the selection rule for parametrized syncmers (Dutta et al., 2022), fix a k-mer size k >1 and consider a random one-to-one hash function
Formally, for a k-mer with span
Some specific examples of syncmers follow. Closed syncmers have an s-minimizer at their end, that is,
An s-minimizer tie may occur if the two different minimum s-mers within a k-mer match. By convention, s-minimizer ties are typically broken in favor of the leftmost s-minimizer but regardless, s-minimizer ties may be negligible if s is large enough. For simplicity, therefore, the theory below assumes that the s-minimizer within a k-mer is unique. Sections 3 and 4 revisit the (mild) practical discrepancies caused by s-minimizer ties.
Downsampling can reduce the size of a syncmer sketch by discarding syncmers randomly but reproducibly with fixed probability
Formally, let
The Gaussian approximation for the k-mer count L
Some preliminary terminology relating sets and multisets is useful. If
Let
Now, consider a sequence
Let the subscript
In the following,
Consider a reference sequence
In the following,
Given the exact L or its estimate
Again, the equation
Eqs (3) and (5) can contribute steps to a bioinformatics pipeline. Our code implements Eqs (3) and (5) verbatim, inputting the k-mer count L and not the sequence length L + k − 1. In anticipation of actual usage, unless noted otherwise throughout Section 3, the sequence length L + k − 1 is substituted for the k-mer count L in both code input and interpretation of code output. Section 3 therefore implicitly examines when the difference k − 1 is negligible in practice. To anticipate, if k is a few percent of L + k − 1, our CLTs can conflate the sequence length and k-mer count without harm.
In Eq (3), the downsampled syncmer count
Similarly, the observable syncmer counts
Estimates with sampling errors for mitochondrial lengths and mutation probabilities
Syncmer sketches bypass computationally intensive methods like alignment and assembly while producing many similar biological results. To validate our results, we compared them with the gold standard of assembled sequences, as follows.
For reference and query sequences, GenBank yielded the complete mitochondrial genomes of Homo sapiens neanderthalensis and 24 other taxa. The file “mitochondria.csv” in the GitHub repository gives taxonomic names, common names, and the National Center for Biotechnology Information (NCBI) accession numbers for the taxa and their mitochondrial sequences. Along with great apes, monkeys, and other mammals, the 24 taxa also included the following nonmammalian taxa: penguin (Eudyptes chrysolophus), snake (Trimerodytes annularis), crocodile (Crocodylus porosus), turtle (Graptemys ouachitensis), frog (Bufo gargarizans), fish (Latimeria menadoensis), jellyfish (Pelagia noctiluca), and sea urchin (Echinocrepis rostrata).
We accessed NCBI servers on November 15, 2023, at the (abbreviated) URL http://tinyurl.com/blastn-blast2seq. They estimated the pairwise Basic Local Alignment Search Tool (BLAST) ANI between our reference and query mitochondrial sequences. Our programs also estimated the complement of the Mash containment index in Eq (7) from syncmer counts, as well as estimating 95%
The mitochondrial reference sequence for Homo sapiens neanderthalensis has length 16565 (all sequence lengths in nucleotides). To detect insertions and deletions in the mitochondria of the 24 taxa relative to the assembled reference length 16565, Eqs (3) and (4) provide hypothesis tests against fixed lengths. To verify the results of the hypothesis test, syncmers provide a natural estimator for sequence length from Eq (2) and a 95% CI from Eqs (3) and (4), which we then plotted against the gold standard of the true mitochondrial lengths of the 24 taxa.
RESULTS
This section examines only mid-open syncmers, because of their optimality properties (Shaw and Yu, 2022). The CIs above take milliseconds to calculate. Our simulations therefore evaluate only statistical accuracy, not computational speed. The R programming language was used to graph the simulation results.
As described in Section 2.5, throughout this section our code usage substituted the sequence length L + k − 1 for the k-mer count L for both input and output. To anticipate, if k is a few percent of L + k − 1, the sequence length and k-mer count can be conflated in our CLTs without harm.
Simulated CIs for the k-mer count L
Section 2.5 describes how to sample 95% L-CIs. Figure 1 plots the sample average of the endpoints of the CI for lengths L + k − 1 = 10 n (n = 2, 3, 4, 5). The difference between the endpoints quantifies the precision of the CI.
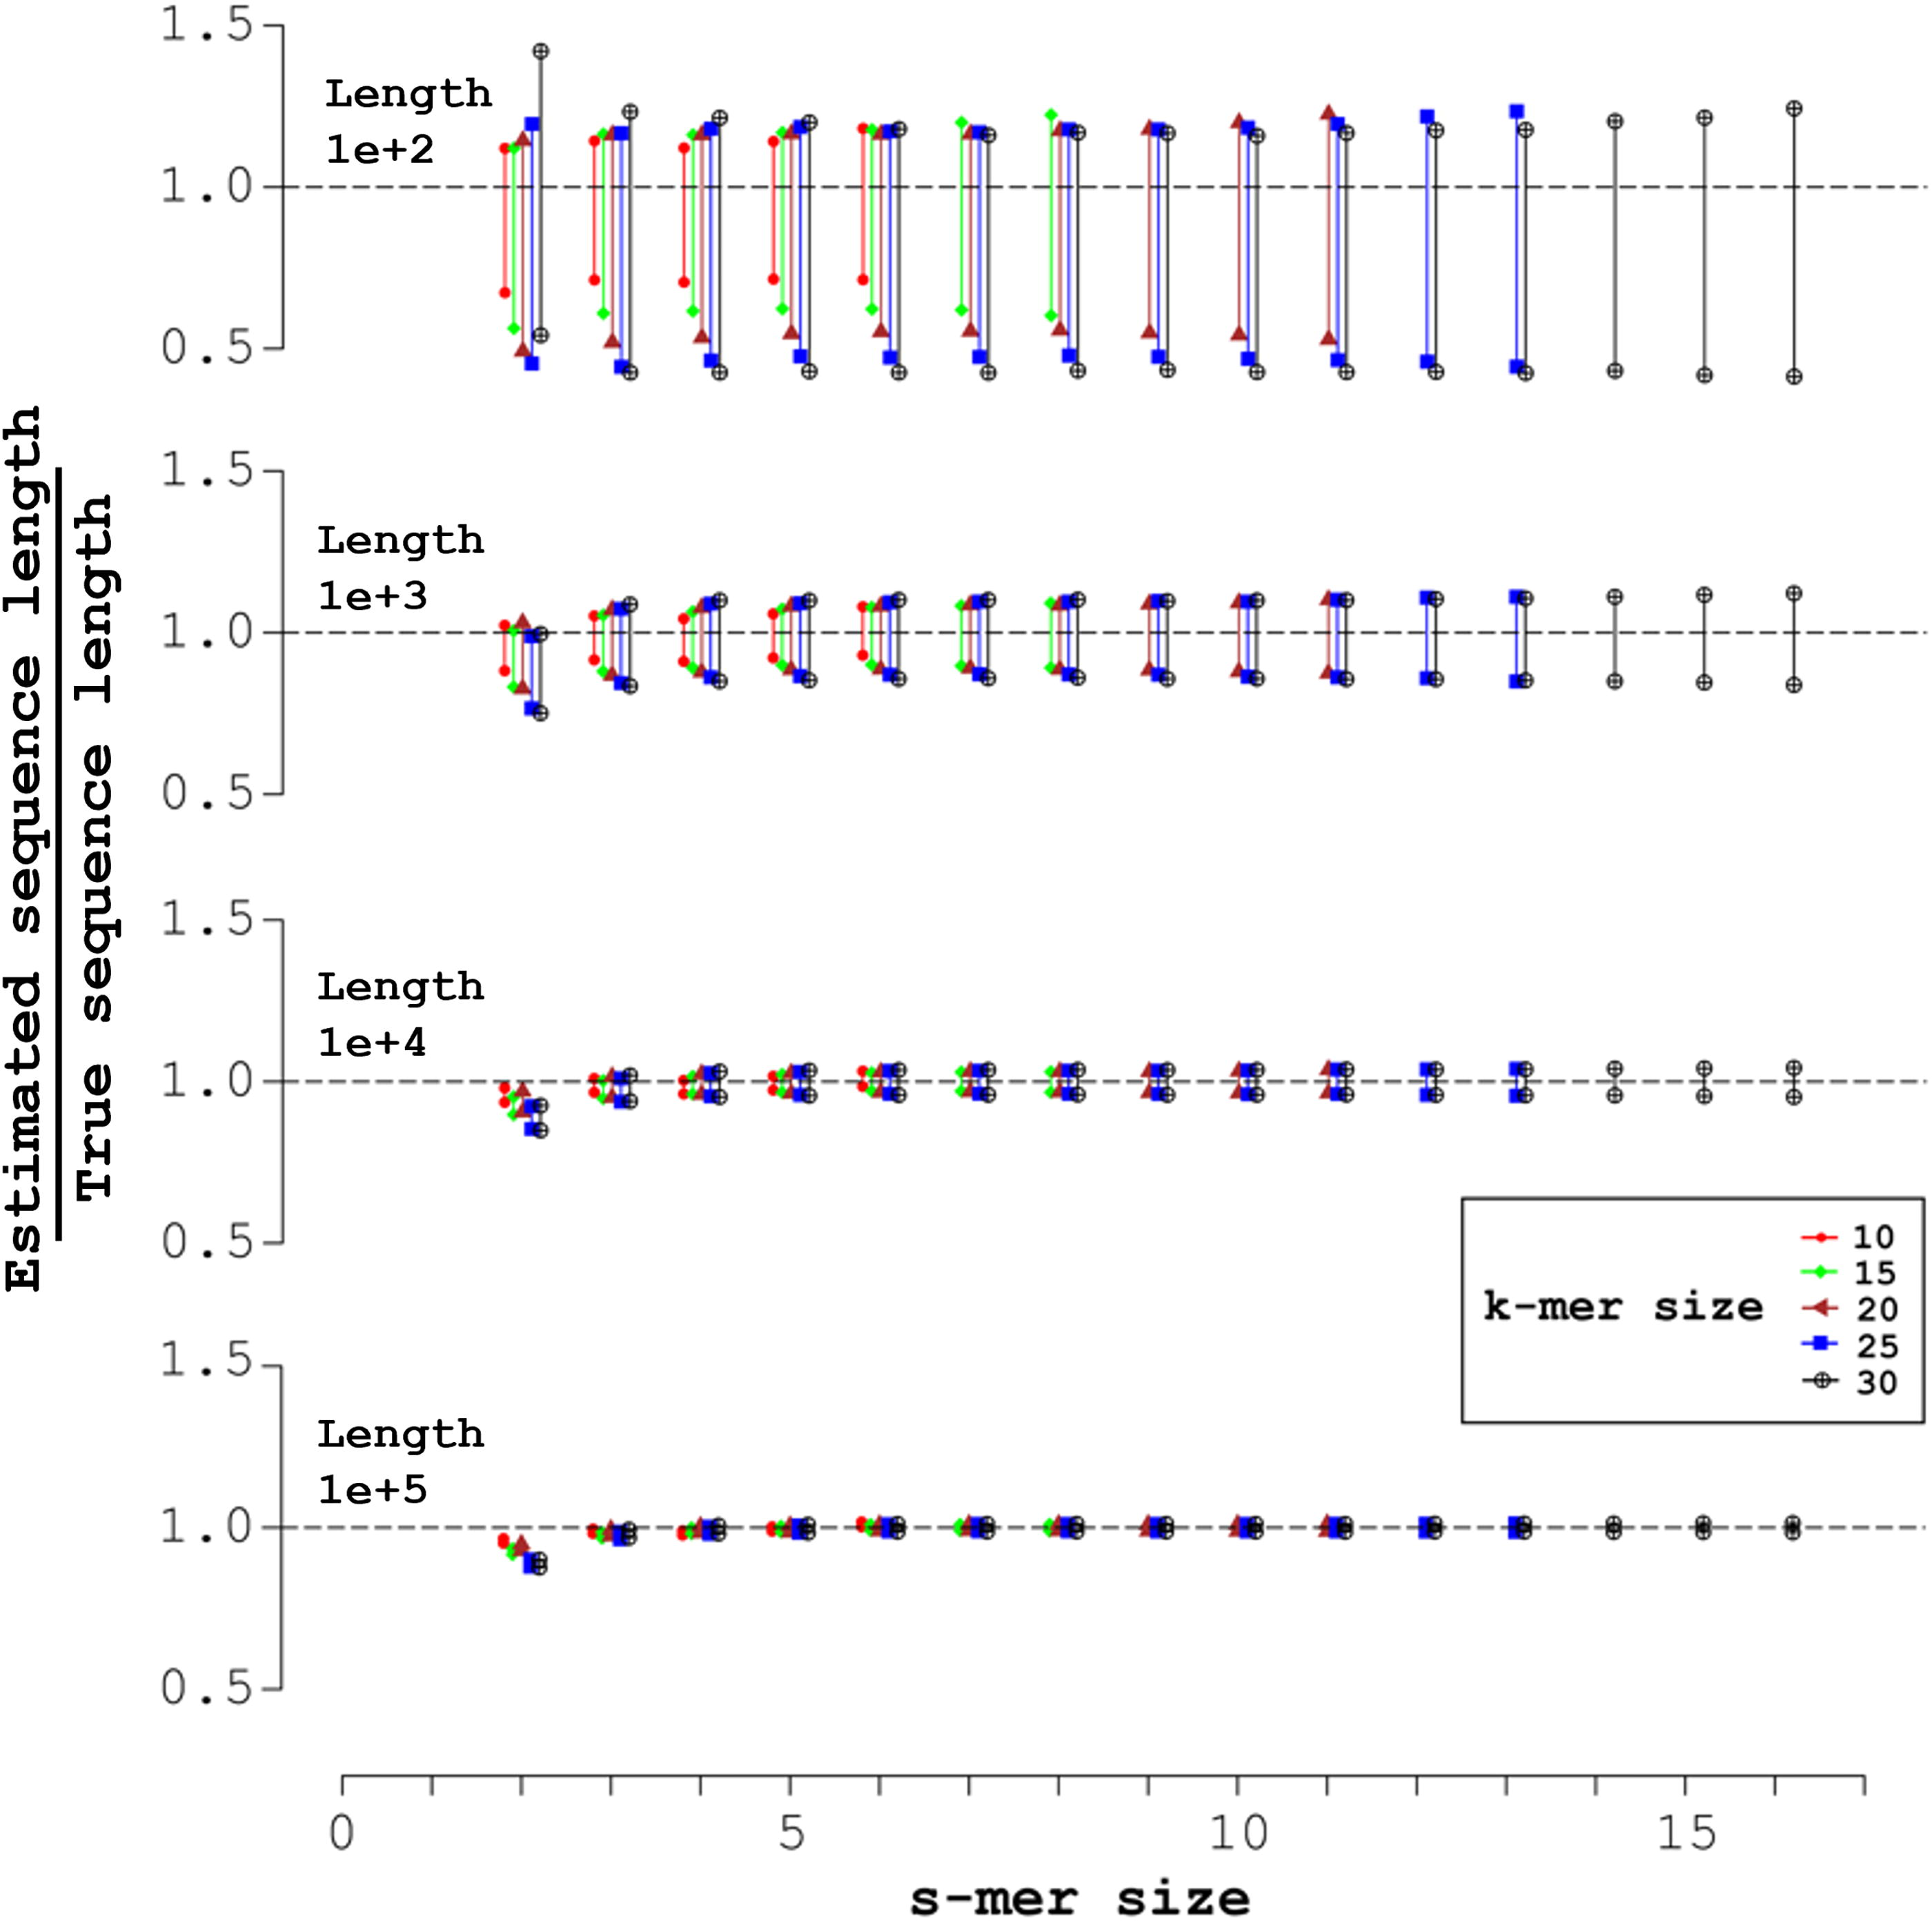
Mid-open syncmers and expected 95% confidence intervals (CIs) for the length L + k − 1. Each of the four simulations shown generated 1000 random sequences of uniform nucleotide composition, with sequence length L + k − 1 indicated in the upper left. The X-axis indicates the s-mer size, with each k-mer size corresponding to a vertical pair of markers over the s-mer size. Over each s-mer size, from left to right the k-mer sizes are: 10 (red circles); 15 (green diamonds); 20 (brown triangles); 25 (blue squares); and 30 (black crosses inside circles). The markers display the sample averages of the endpoints of the 1000 95% CIs, with the Y-axis giving the ratio of the estimated k-mer count directly from the code to the true length. The horizontal dashed line indicates an ideal estimate, with ratio 1.0.
Figure 2 plots accuracy, the probability that the sampled CIs above contain the true length L + k − 1, for L + k − 1 = 10 n (n = 2, 3, 4, 5).
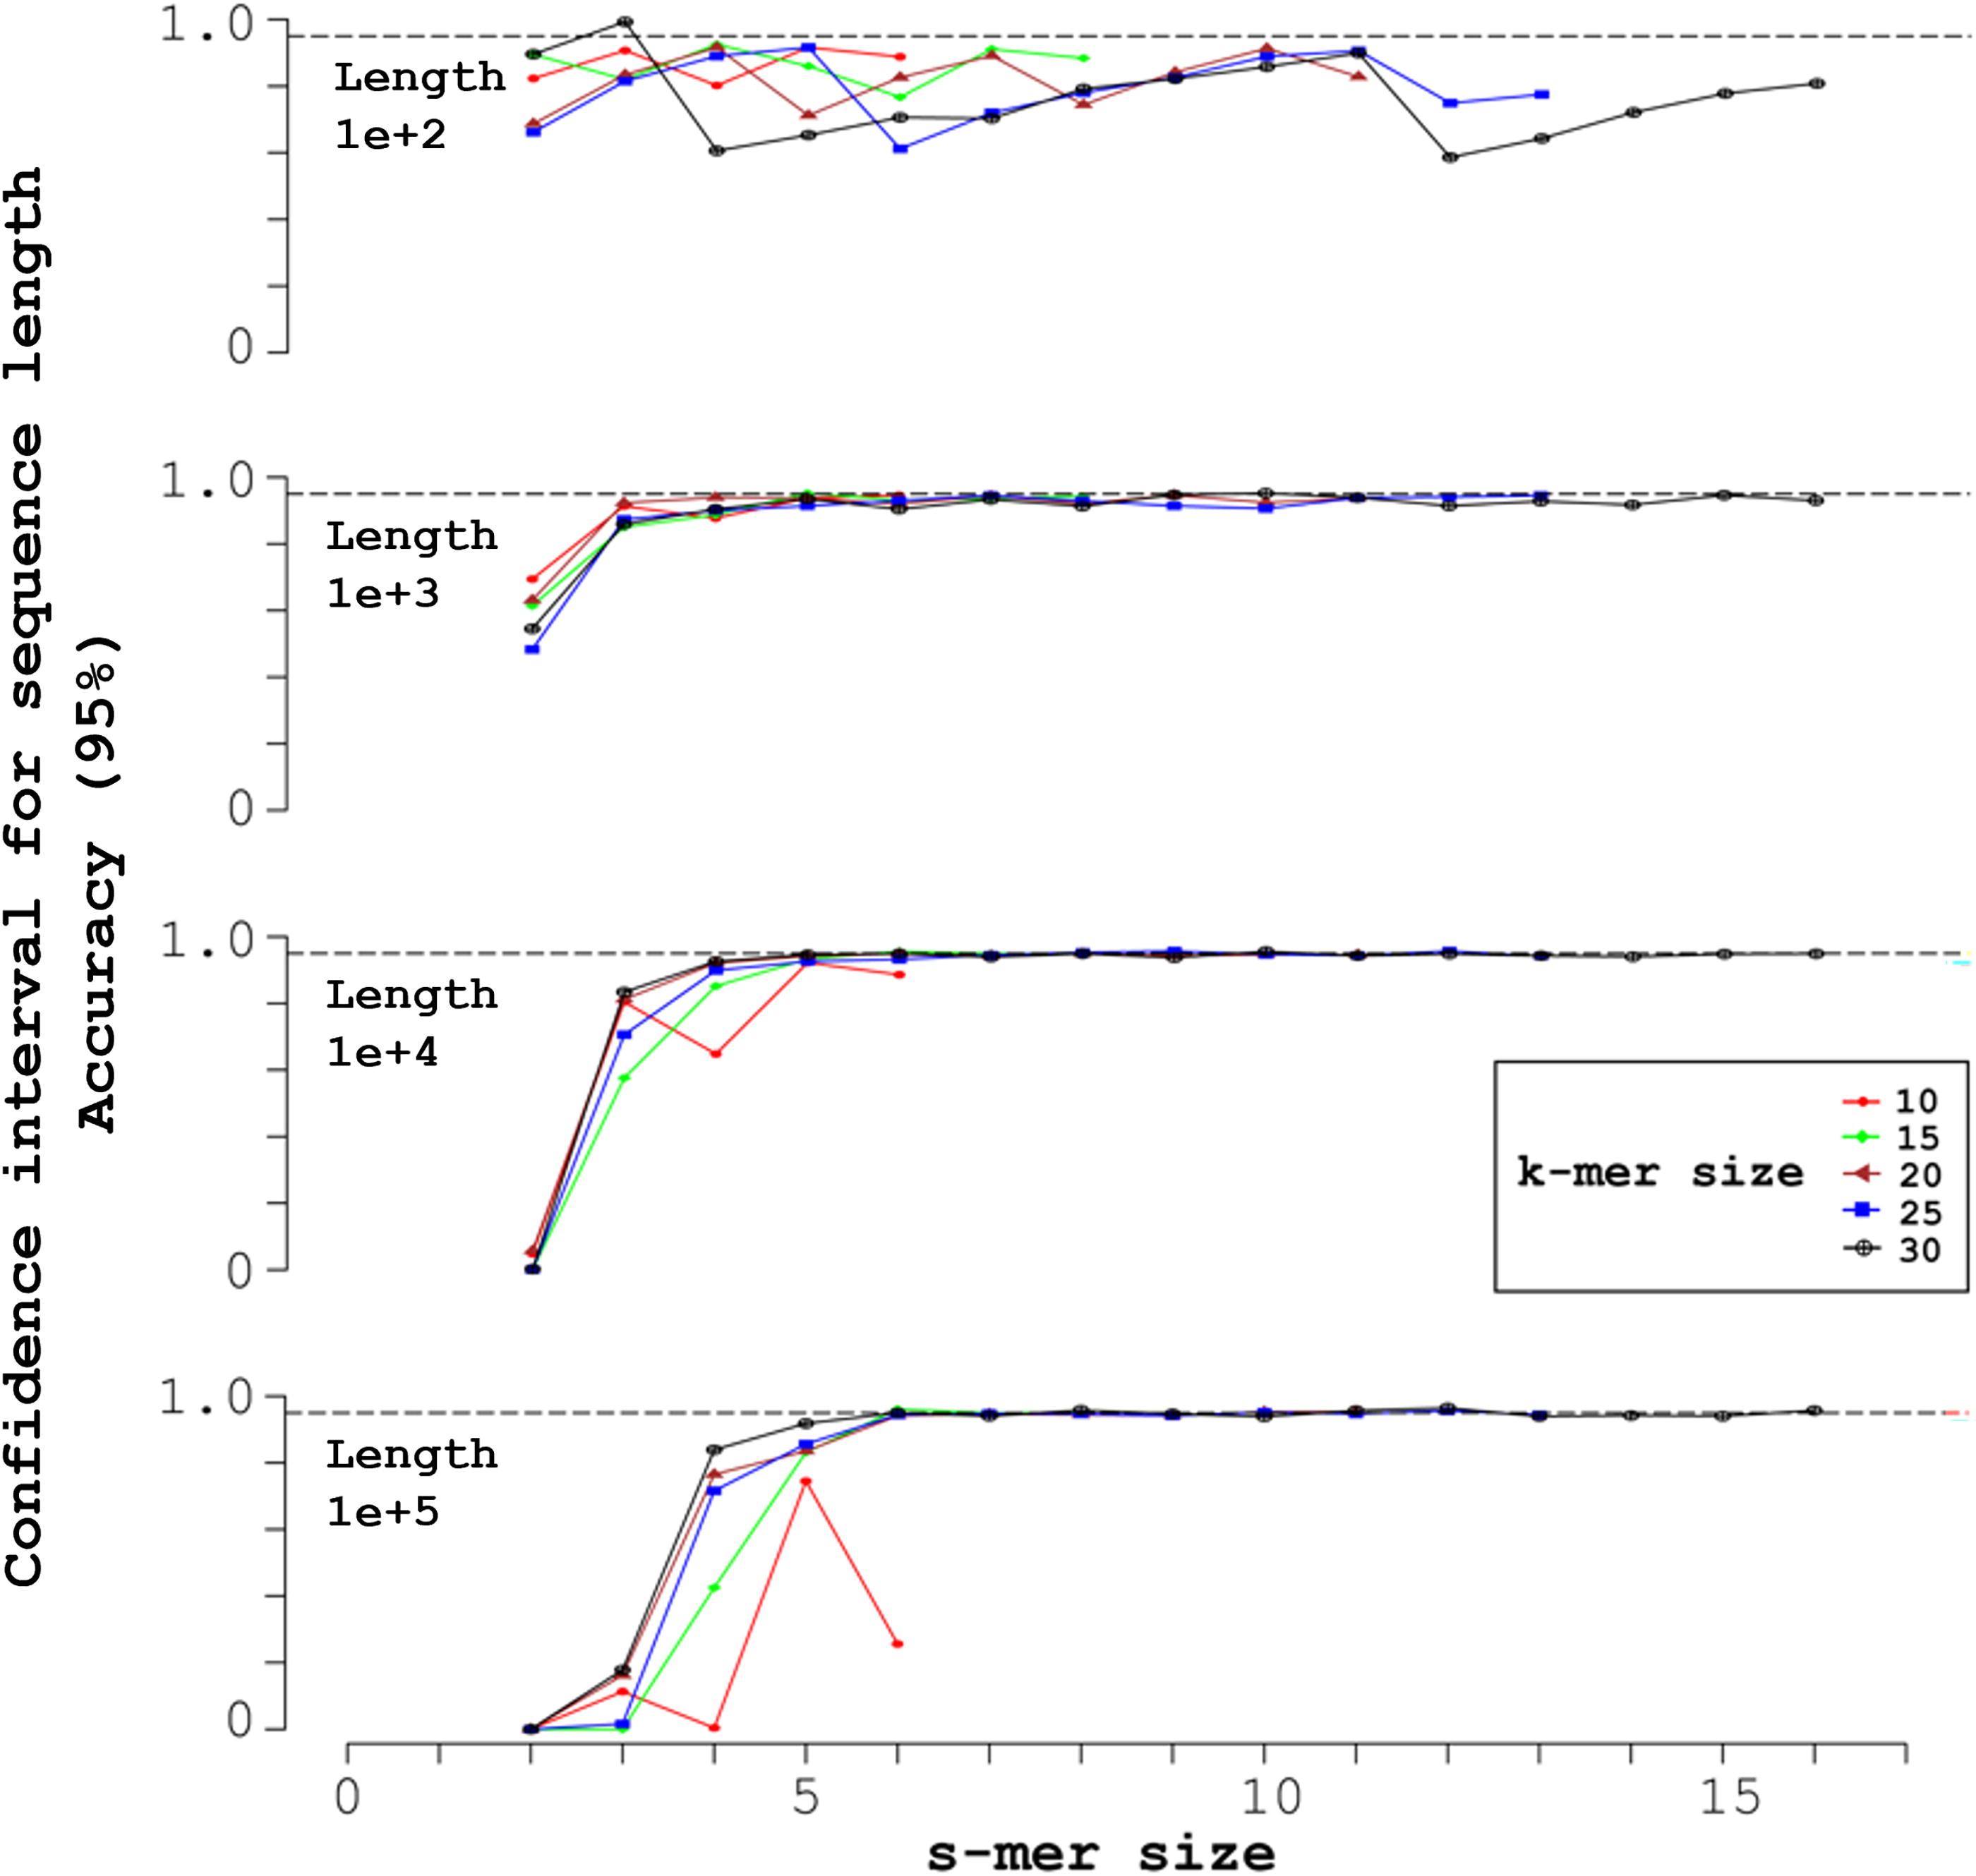
Mid-open syncmers and accuracy of 95% CIs for the length L + k − 1. Each of the four simulations shown generated 1000 random sequences of uniform nucleotide composition, with the length L + k − 1 indicated in the upper left. The X-axis indicates the s-mer size, with each k-mer size corresponding to a vertical pair of markers over the s-mer size. Over each s-mer size, from left to right the k-mer sizes are: 10 (red circles); 15 (green diamonds); 20 (brown triangles); 25 (blue squares); and 30 (black crosses inside circles). The markers indicate the accuracy of the corresponding 95% CI. The horizontal dashed line indicates ideal accuracy, 0.95.
In Figure 1, which displays the sample-averaged endpoints of CIs for the length L + k − 1, the number of syncmers sampled is (approximately) proportional to L; and the standard deviation of the number, to
Ideally, a 95% CI should give a 0.95 accuracy. Figure 2 shows that most L-CIs at L + k − 1 = 102, for example, are inaccurate. According to a classical CLT heuristic, a CLT approximation at p = 0.05 requires about 30 independent samples (Fisher, 1925, p. 80), possibly 20, and at a minimum 10 (Corder and Foreman, 2011). The syncmers number about L/(u + 1), where u = k–s. The classical CLT heuristic directly implies a Submer heuristic about the minimum number of submers that our CLTs require for accuracy (i.e., about 10–30). Thus, sequences of length L + k − 1 = 102 typically appear to produce too few syncmers to support an accurate CLT approximation.
The simulations used a uniform frequency of random letters, so the match probability from Supplementary Section S3 is q = 1/4. Supplementary Section S3 and Supplementary Eq (S17) contain a k-mer uniqueness heuristic indicating that L4−
k
/2 must be small. For L + k − 1 = 105 and k = 10 in Figure 2,
Similarly, our calculation of the correlations in the CLTs neglects s-minimizer ties in syncmers. Supplementary Section S3.2 in the SI has a s-minimizer heuristic asserting that the quantity
In addition, for s = 2 in Figure 2, the accuracies for 2 ≤ s ≤ 6 display an odd-even s-alternation, that is, the accuracy decreases for the even s succeeding each odd s. The SI shows that in the absence of s-minimizer ties, the distance between consecutive mid-open syncmers exceeds
Based on these results, Section 4 contains some qualitative heuristics for selecting L, k, and s empirically to improve the precision and accuracy of L-CIs with mid-open syncmers. The SI also contains heuristics for avoiding s-minimizer ties.
Figure 3 displays the sample-averaged endpoints of the CIs for the mutation probability
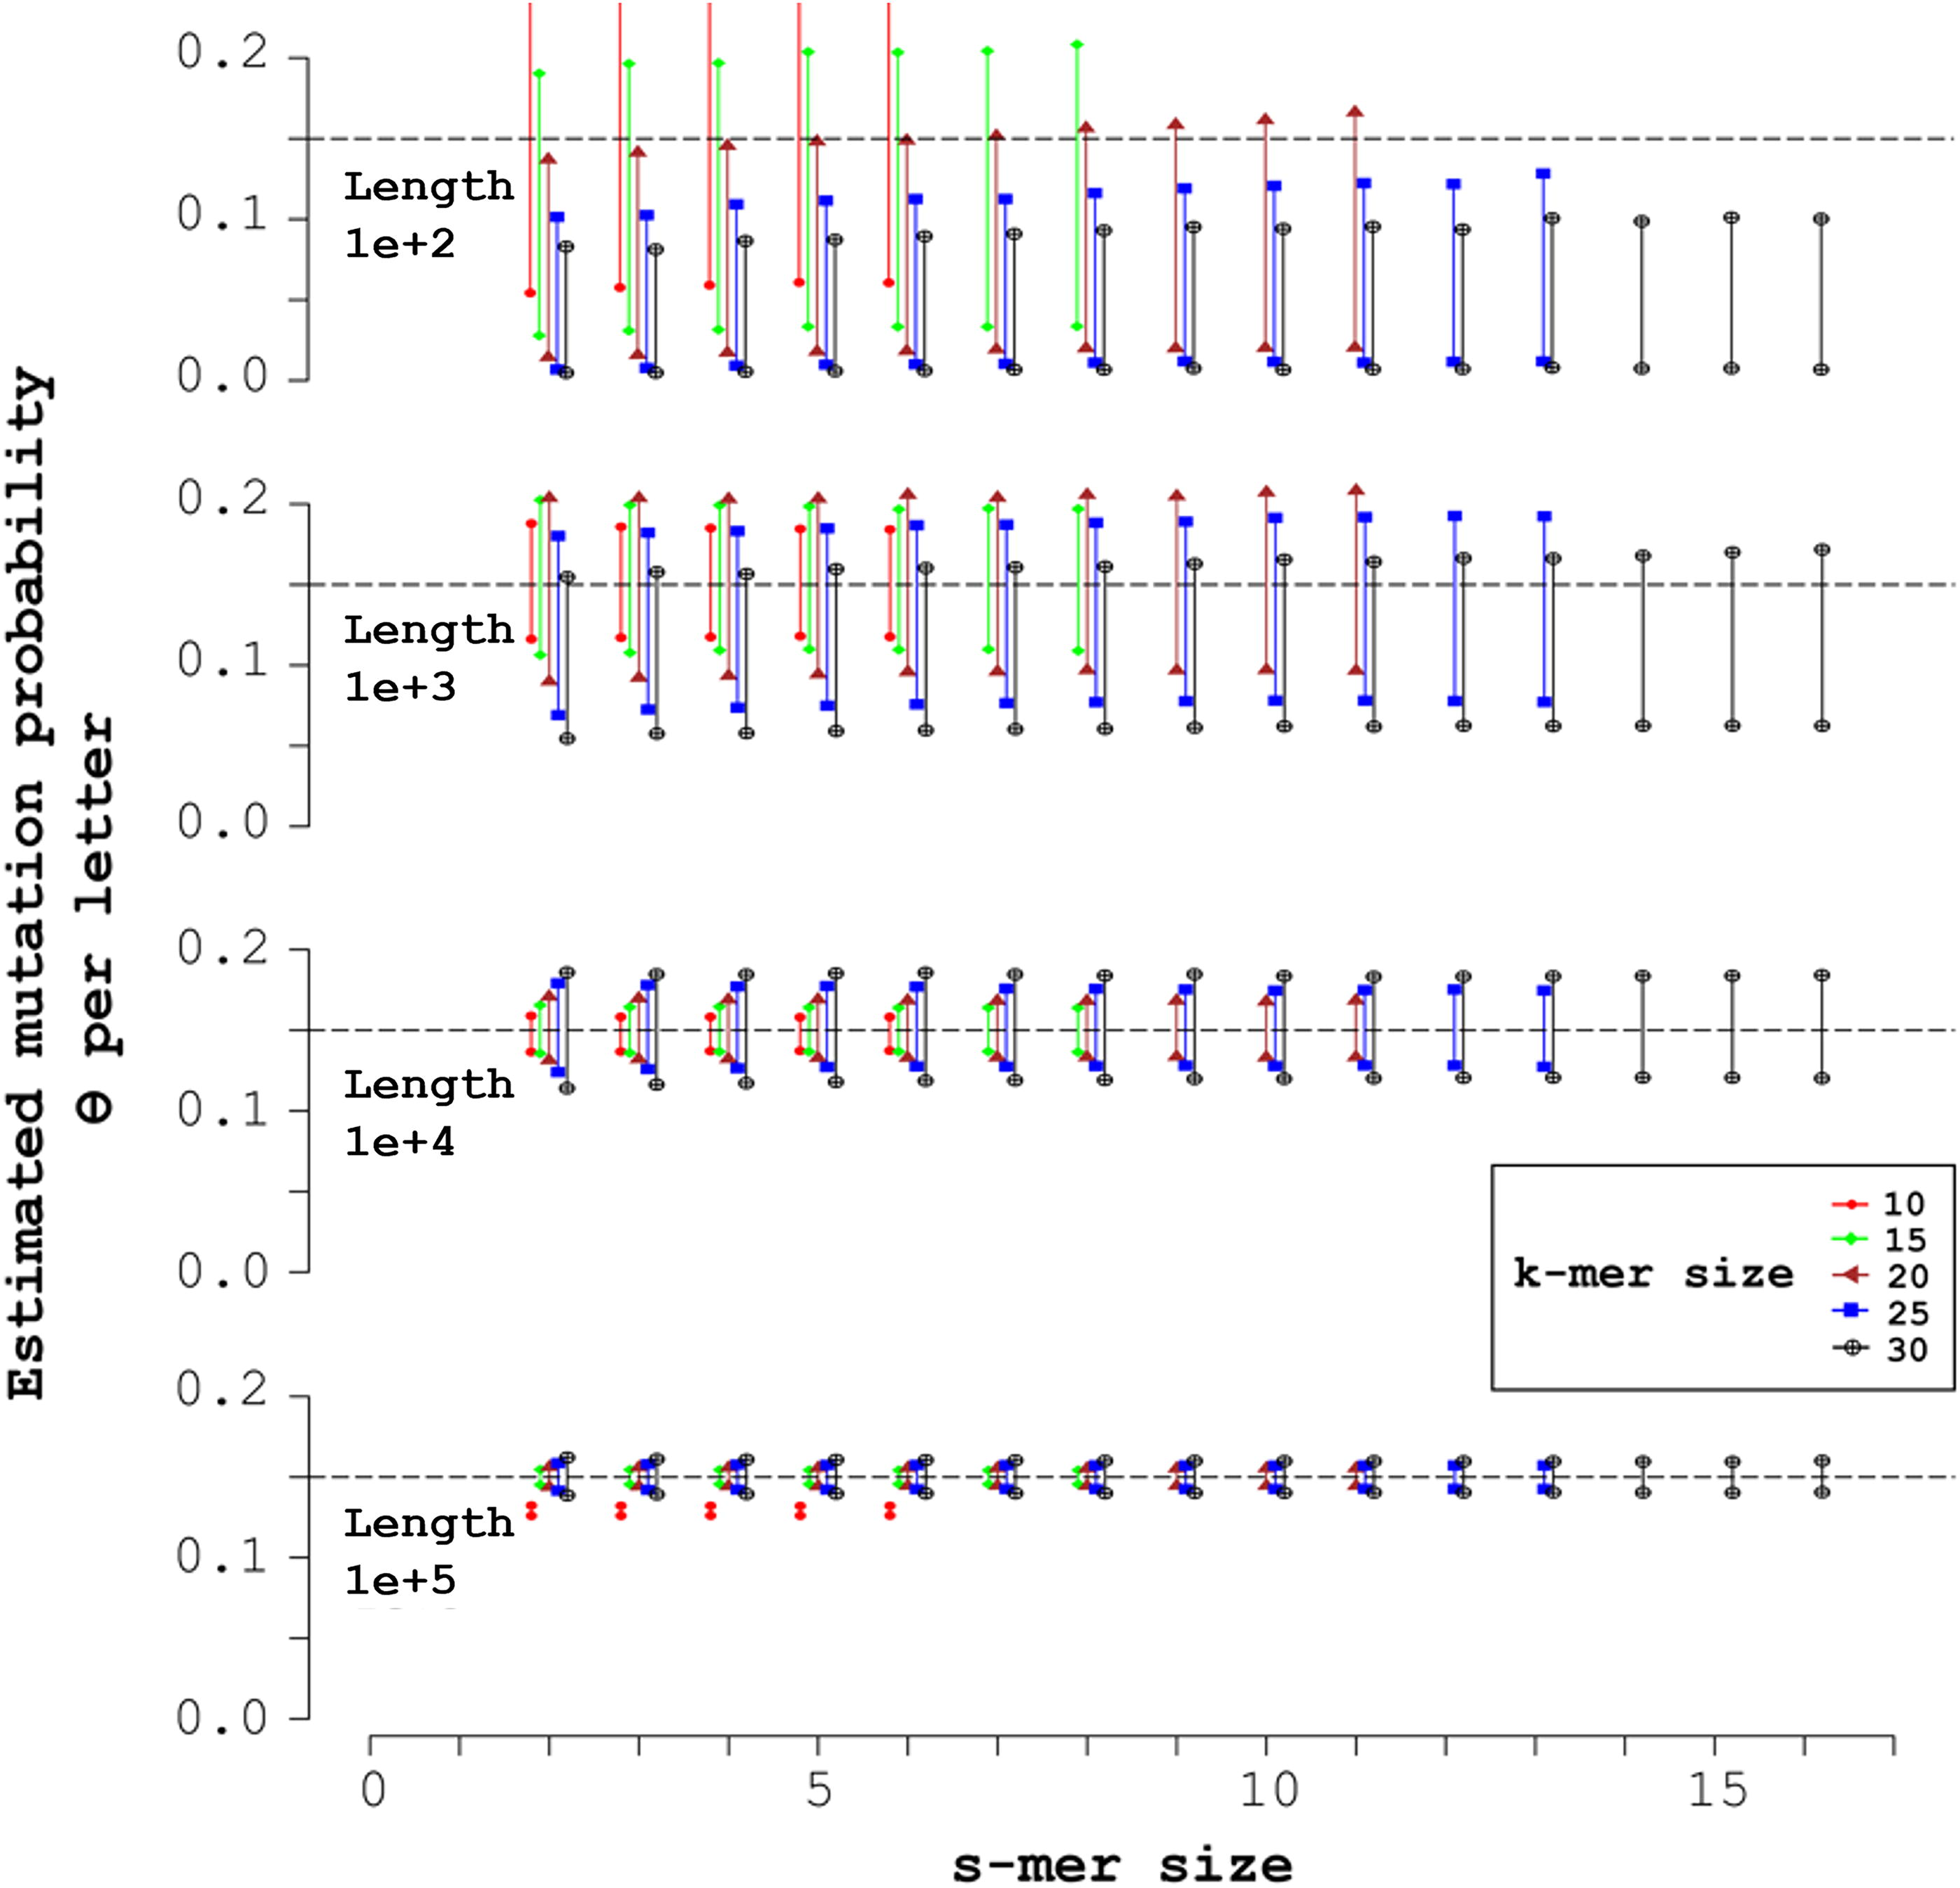
Mid-open syncmers and expected 95% CIs for mutation probability θ = 0.15. Each of the four simulations shown generated 1000 random sequences of uniform nucleotide composition, with the length L + k − 1 indicated in the upper left. The X-axis indicates the s-mer size, with each k-mer size corresponding to a vertical pair of markers over the s-mer size. Over each s-mer size, from left to right the k-mer sizes are: 10 (red circles); 15 (green diamonds); 20 (brown triangles); 25 (blue squares); and 30 (black crosses inside circles). The markers indicate the accuracy of the corresponding 95% CI. The horizontal dashed line indicates ideal accuracy, 0.95.
Figure 4 plots accuracy, the probability that the sampled CIs above contain the true θ (ideally, a 95% CI gives 0.95 accuracy).
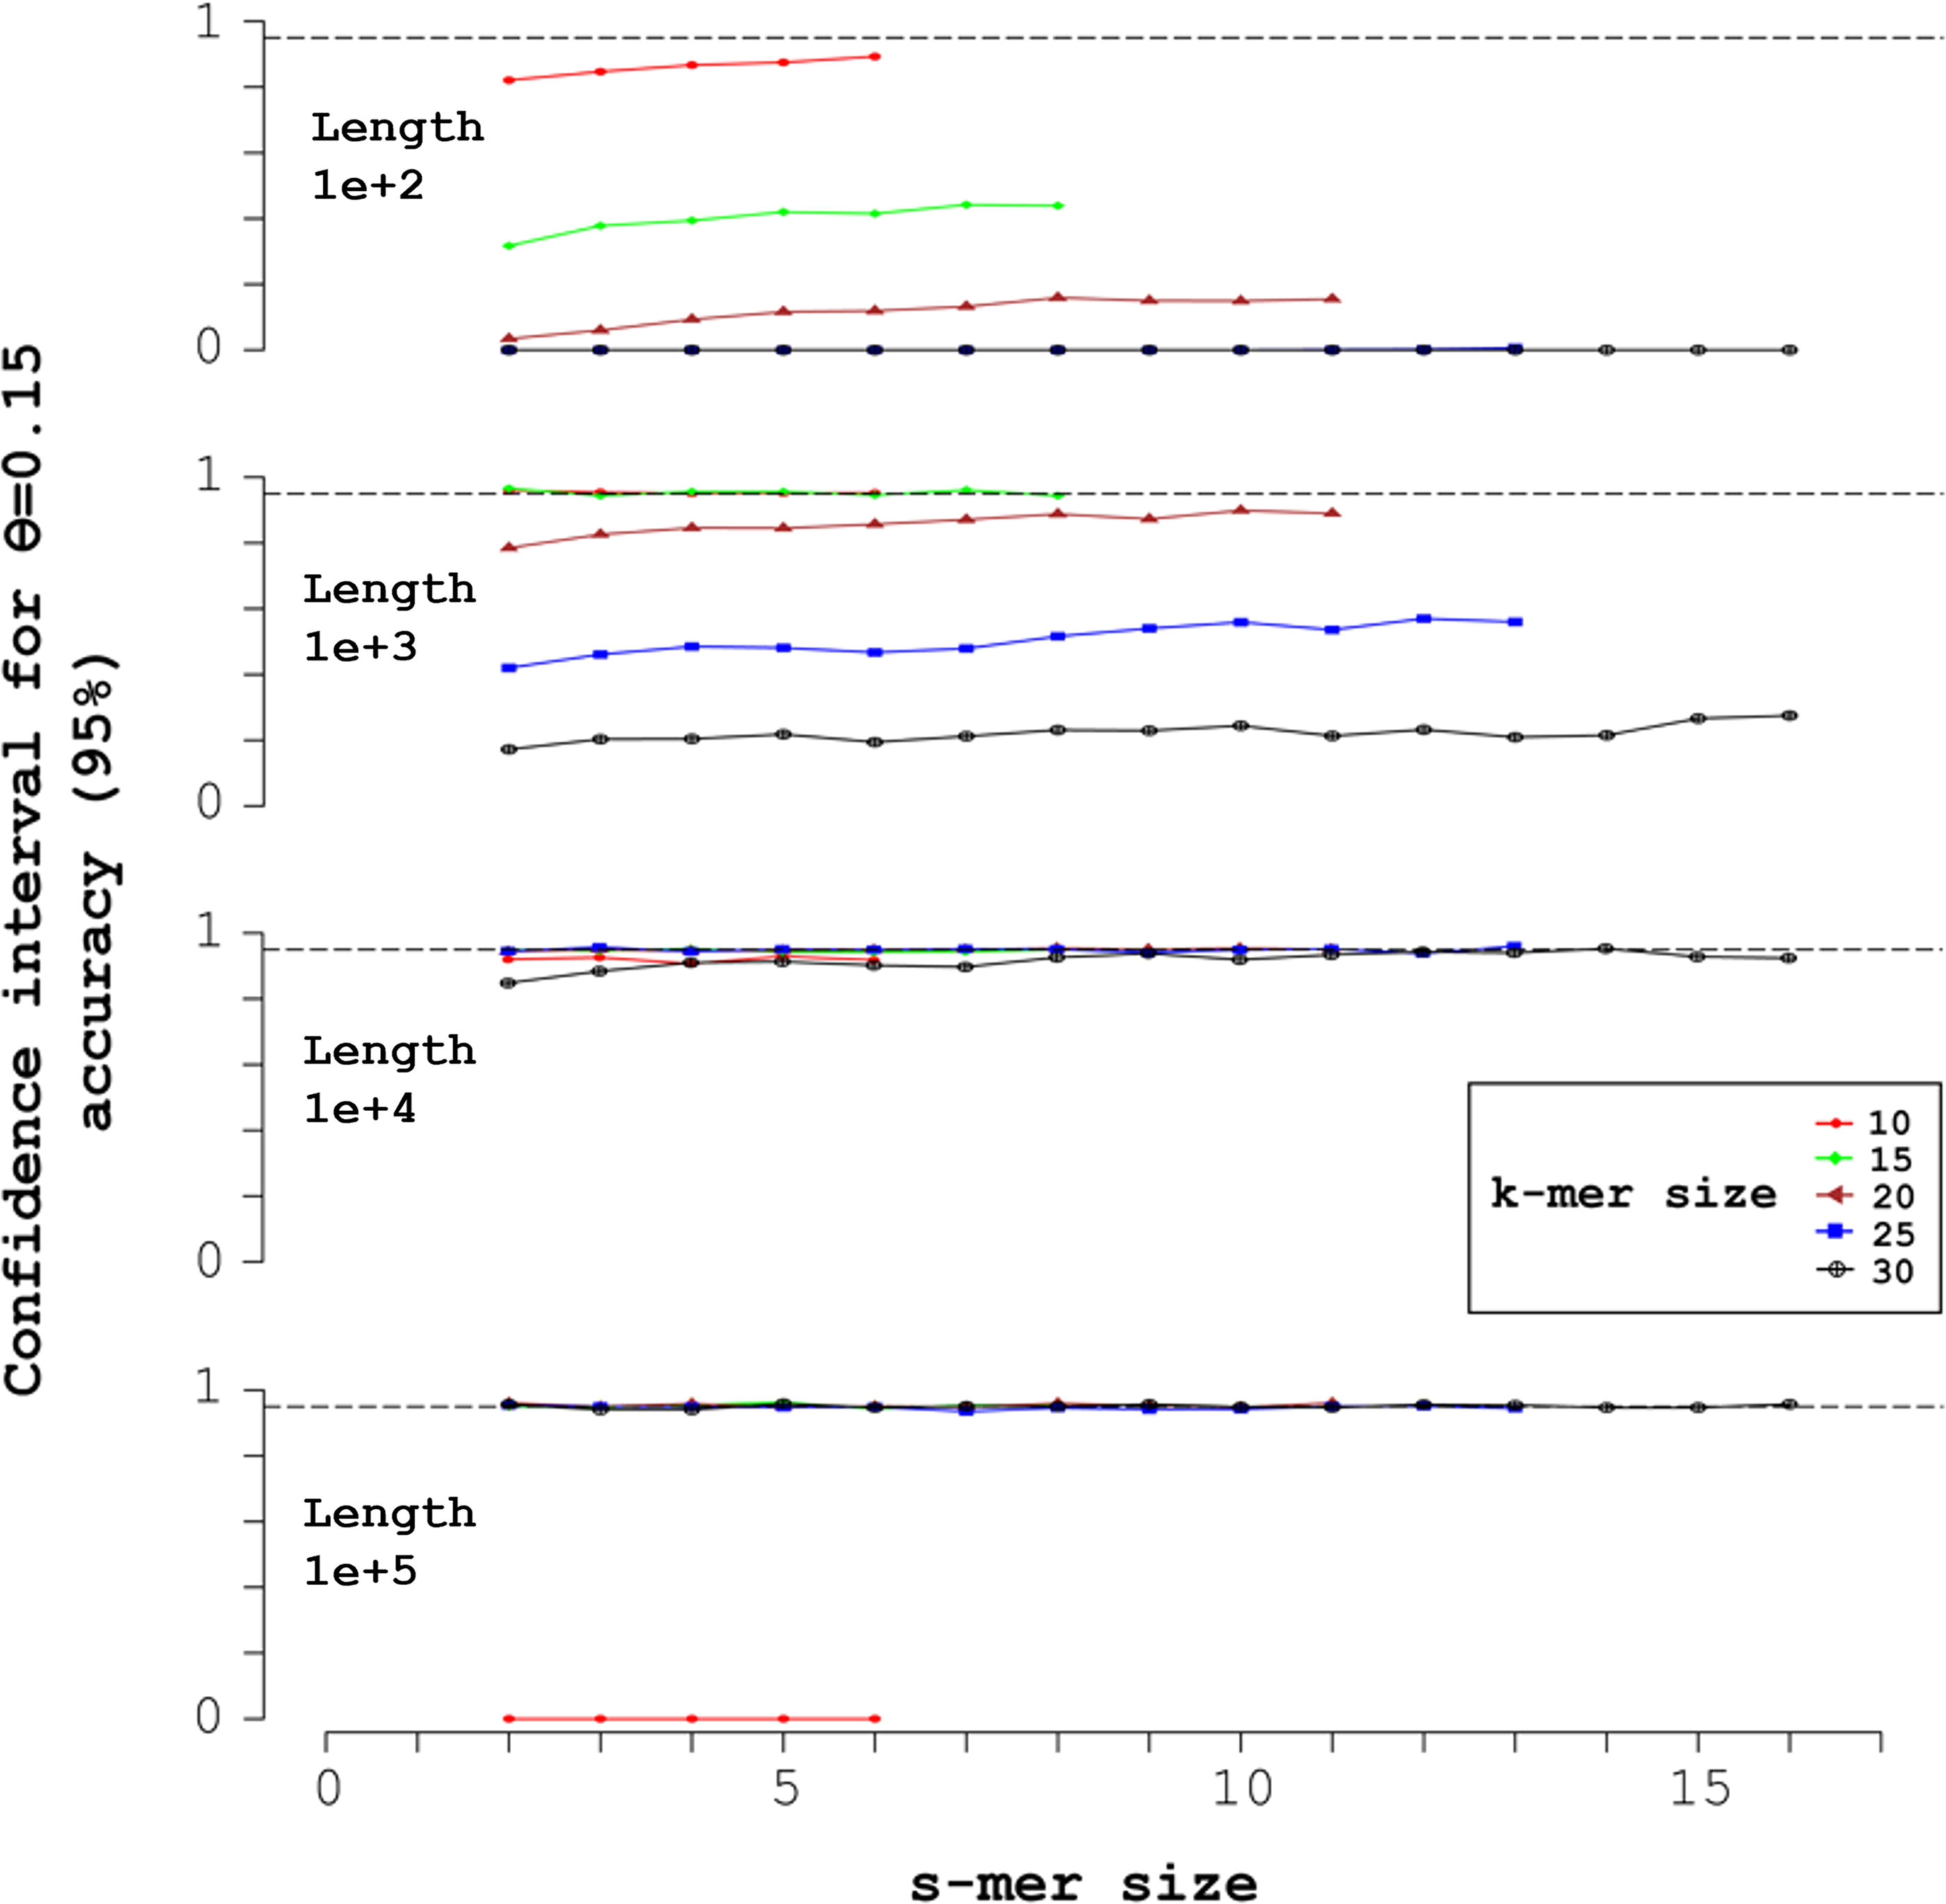
Mid-open syncmers and accuracy of 95% CIs for mutation probability θ = 0.15. Each of the four simulations shown realized 1000 random sequences of uniform nucleotide composition, with length L + k − 1 indicated in the upper left. The X-axis indicates the s-mer size, with each k-mer size corresponding to a vertical pair of markers over the s-mer size. Over each s-mer size, from left to right the k-mer sizes are: 10 (red circles); 15 (green diamonds); 20 (brown triangles); 25 (blue squares); and 30 (black crosses inside circles). The markers indicate the accuracy of the corresponding 95% CI. The horizontal dashed line indicates ideal accuracy, 0.95.
In Figure 3, the mutation probability
Figure 4 displays the accuracy of
Supplementary Figure S1 for θ = 0.05 and Supplementary Figure S2 for θ = 0.25 display accuracies analogous to Figure 4 for θ = 0.15. They illustrate the effect on accuracy of varying θ.
As previously stated, the conserved submer heuristic requires about 10–30 conserved syncmers. The approximate count is about
The inaccuracies in θ-estimates in Supplementary Figure S1 and Supplementary Figure S2 are not confined specifically to short s-mers, suggesting that as in the θ-estimates in Figure 4, s-minimizer ties are not influential.
Excel was used to graph mitochondrial results, all derived from mid-open (k,s) = (13,7)-syncmers without downsampling (
Figure 5 plots the syncmer ANI (i.e., 1 −
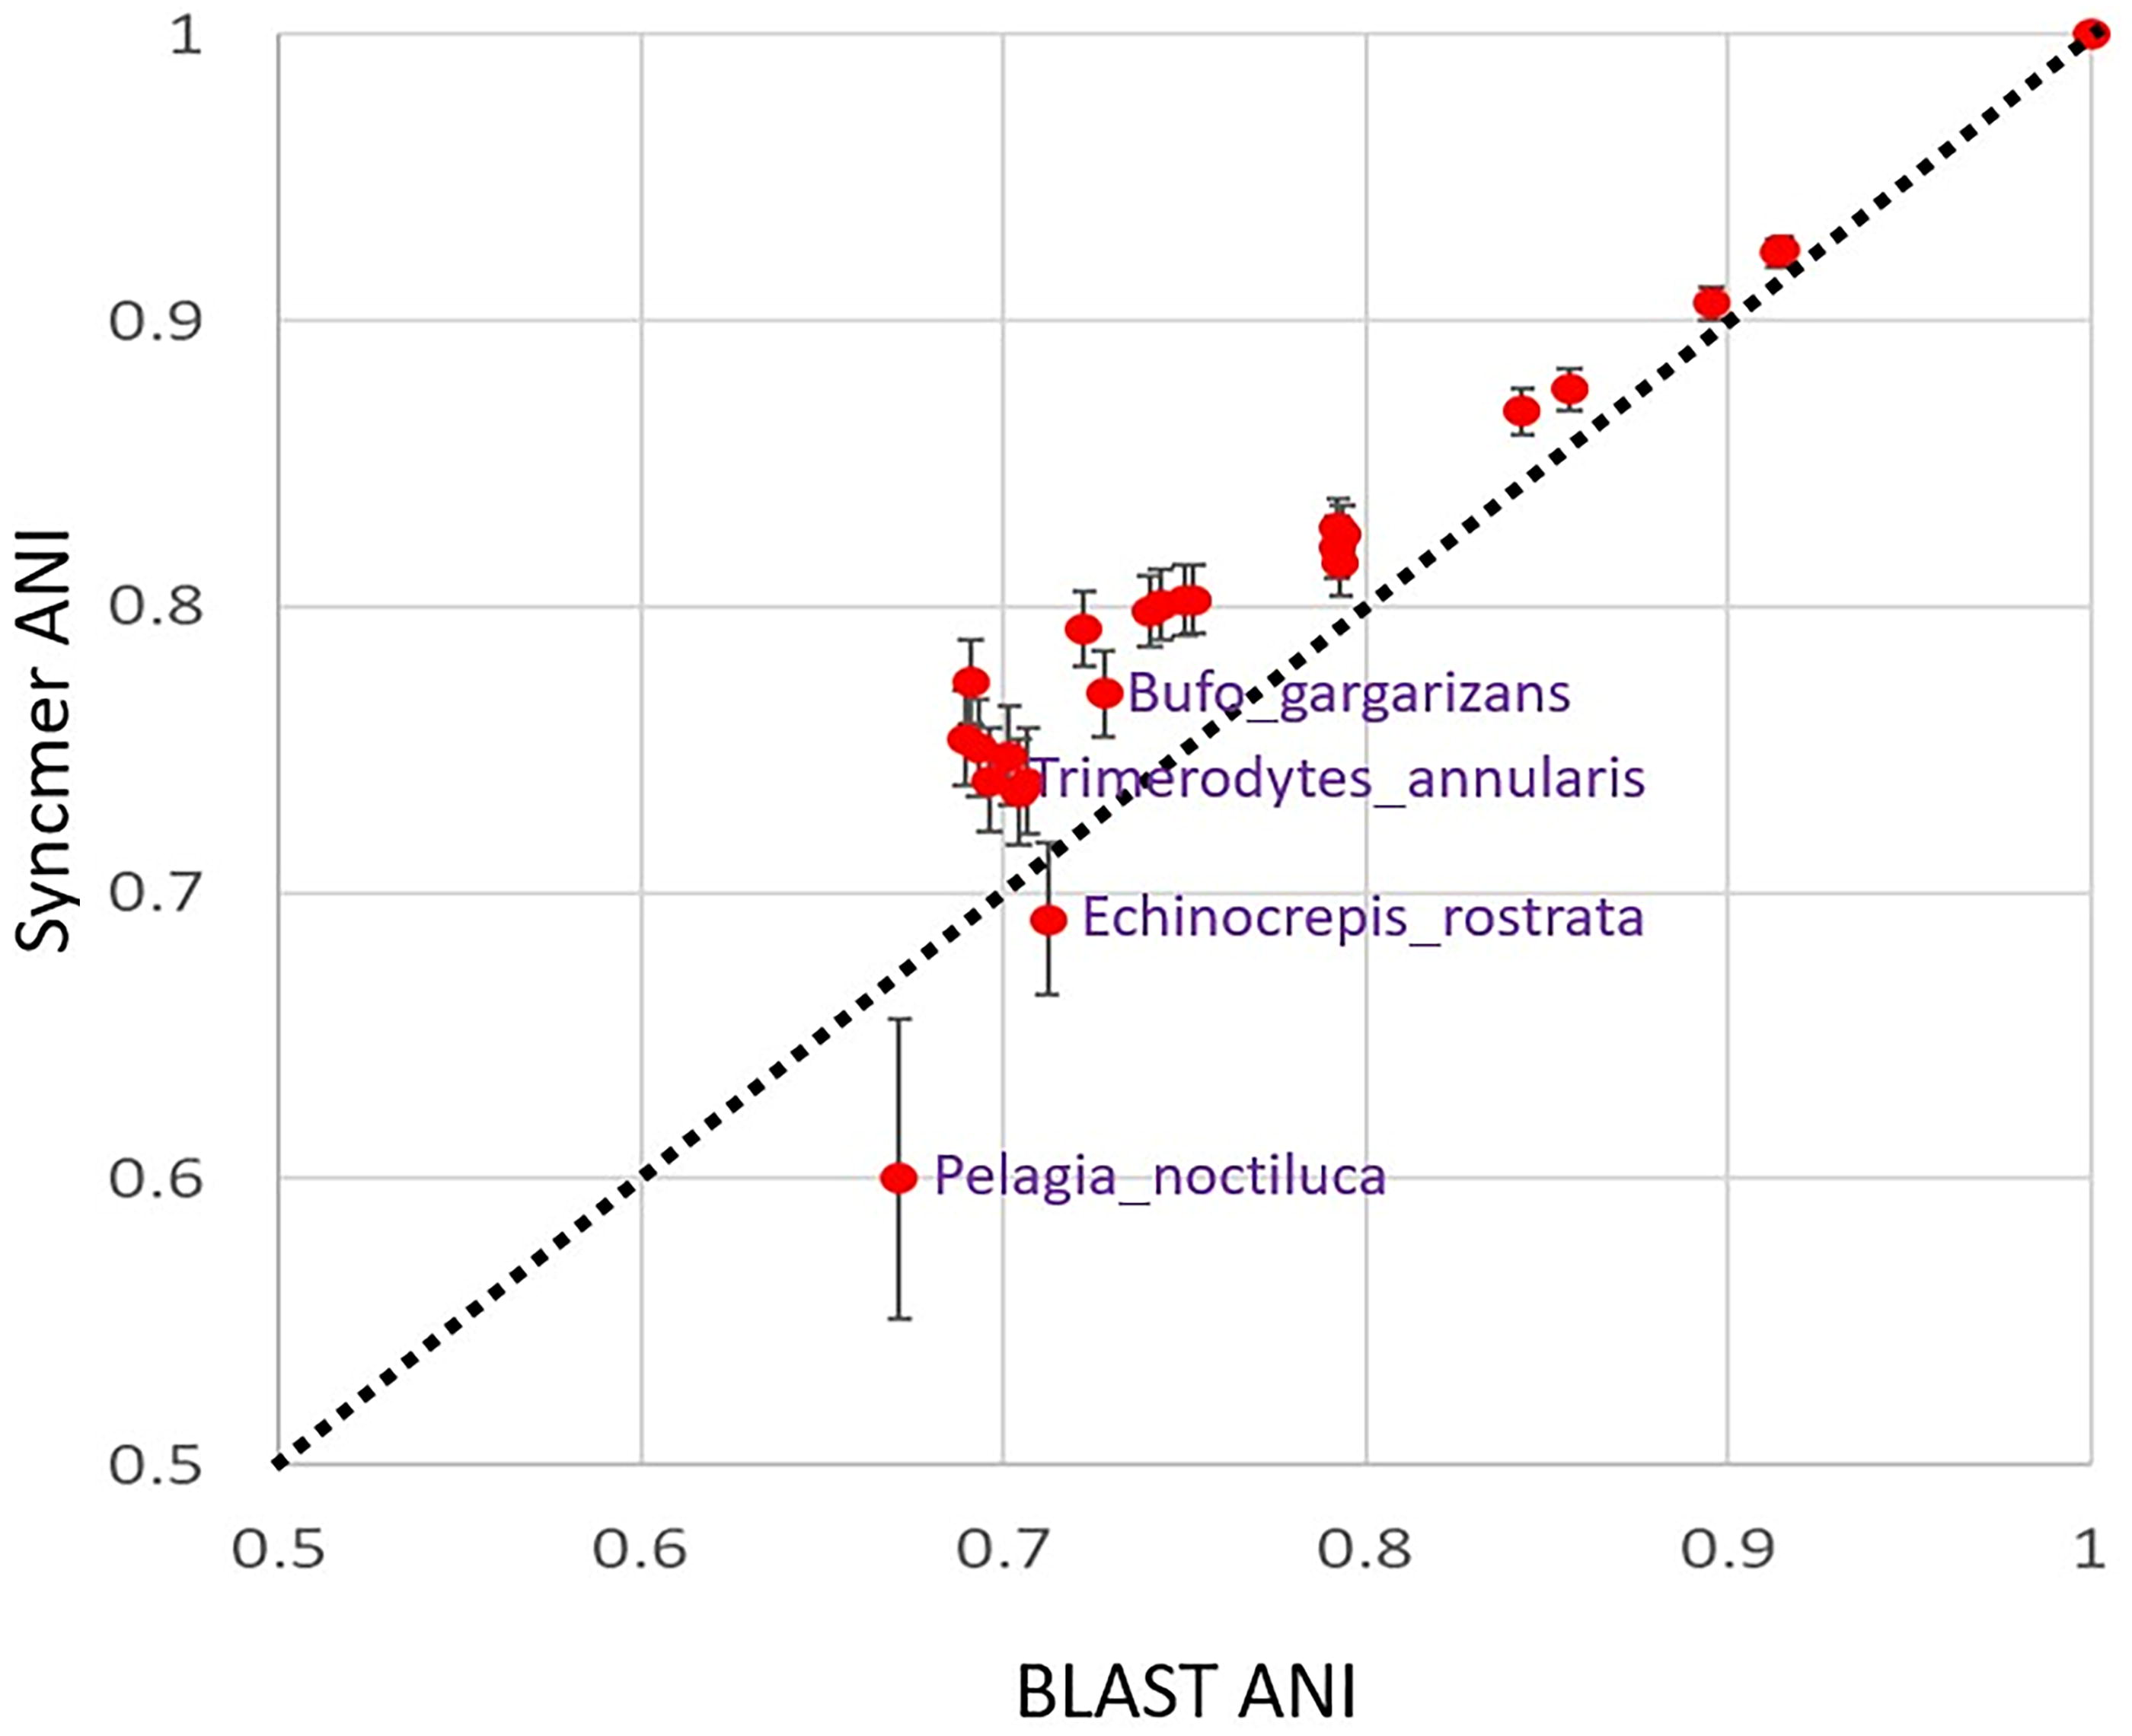
ANI from syncmer counts vs. ANI calculated by BLAST. This figure plots the syncmer ANI [1-θ from Eq (7)] against the BLAST ANI for each of the 25 mitochondria in the SI. On the upper right at (1.0, 1.0) is the reference mitochondrial genome sequence A, Homo sapiens neanderthalensis. Mutation increases away from the reference toward the lower left. Without error bars, the deviations from the diagonal line Y = X might appear disconcerting, particularly for Pelagia noctiluca, but the error bars on the syncmer ANI, the CIs from Eq (6), widen as mutation increases. The widening improves the consistency of the two measures of ANI, but discrepancies remain. The algorithm producing the syncmer ANI has a probabilistic interpretation given in the text, however, unlike the algorithm producing the BLAST ANI. ANI, average nucleotide identity; BLAST, Basic Local Alignment Search Tool.
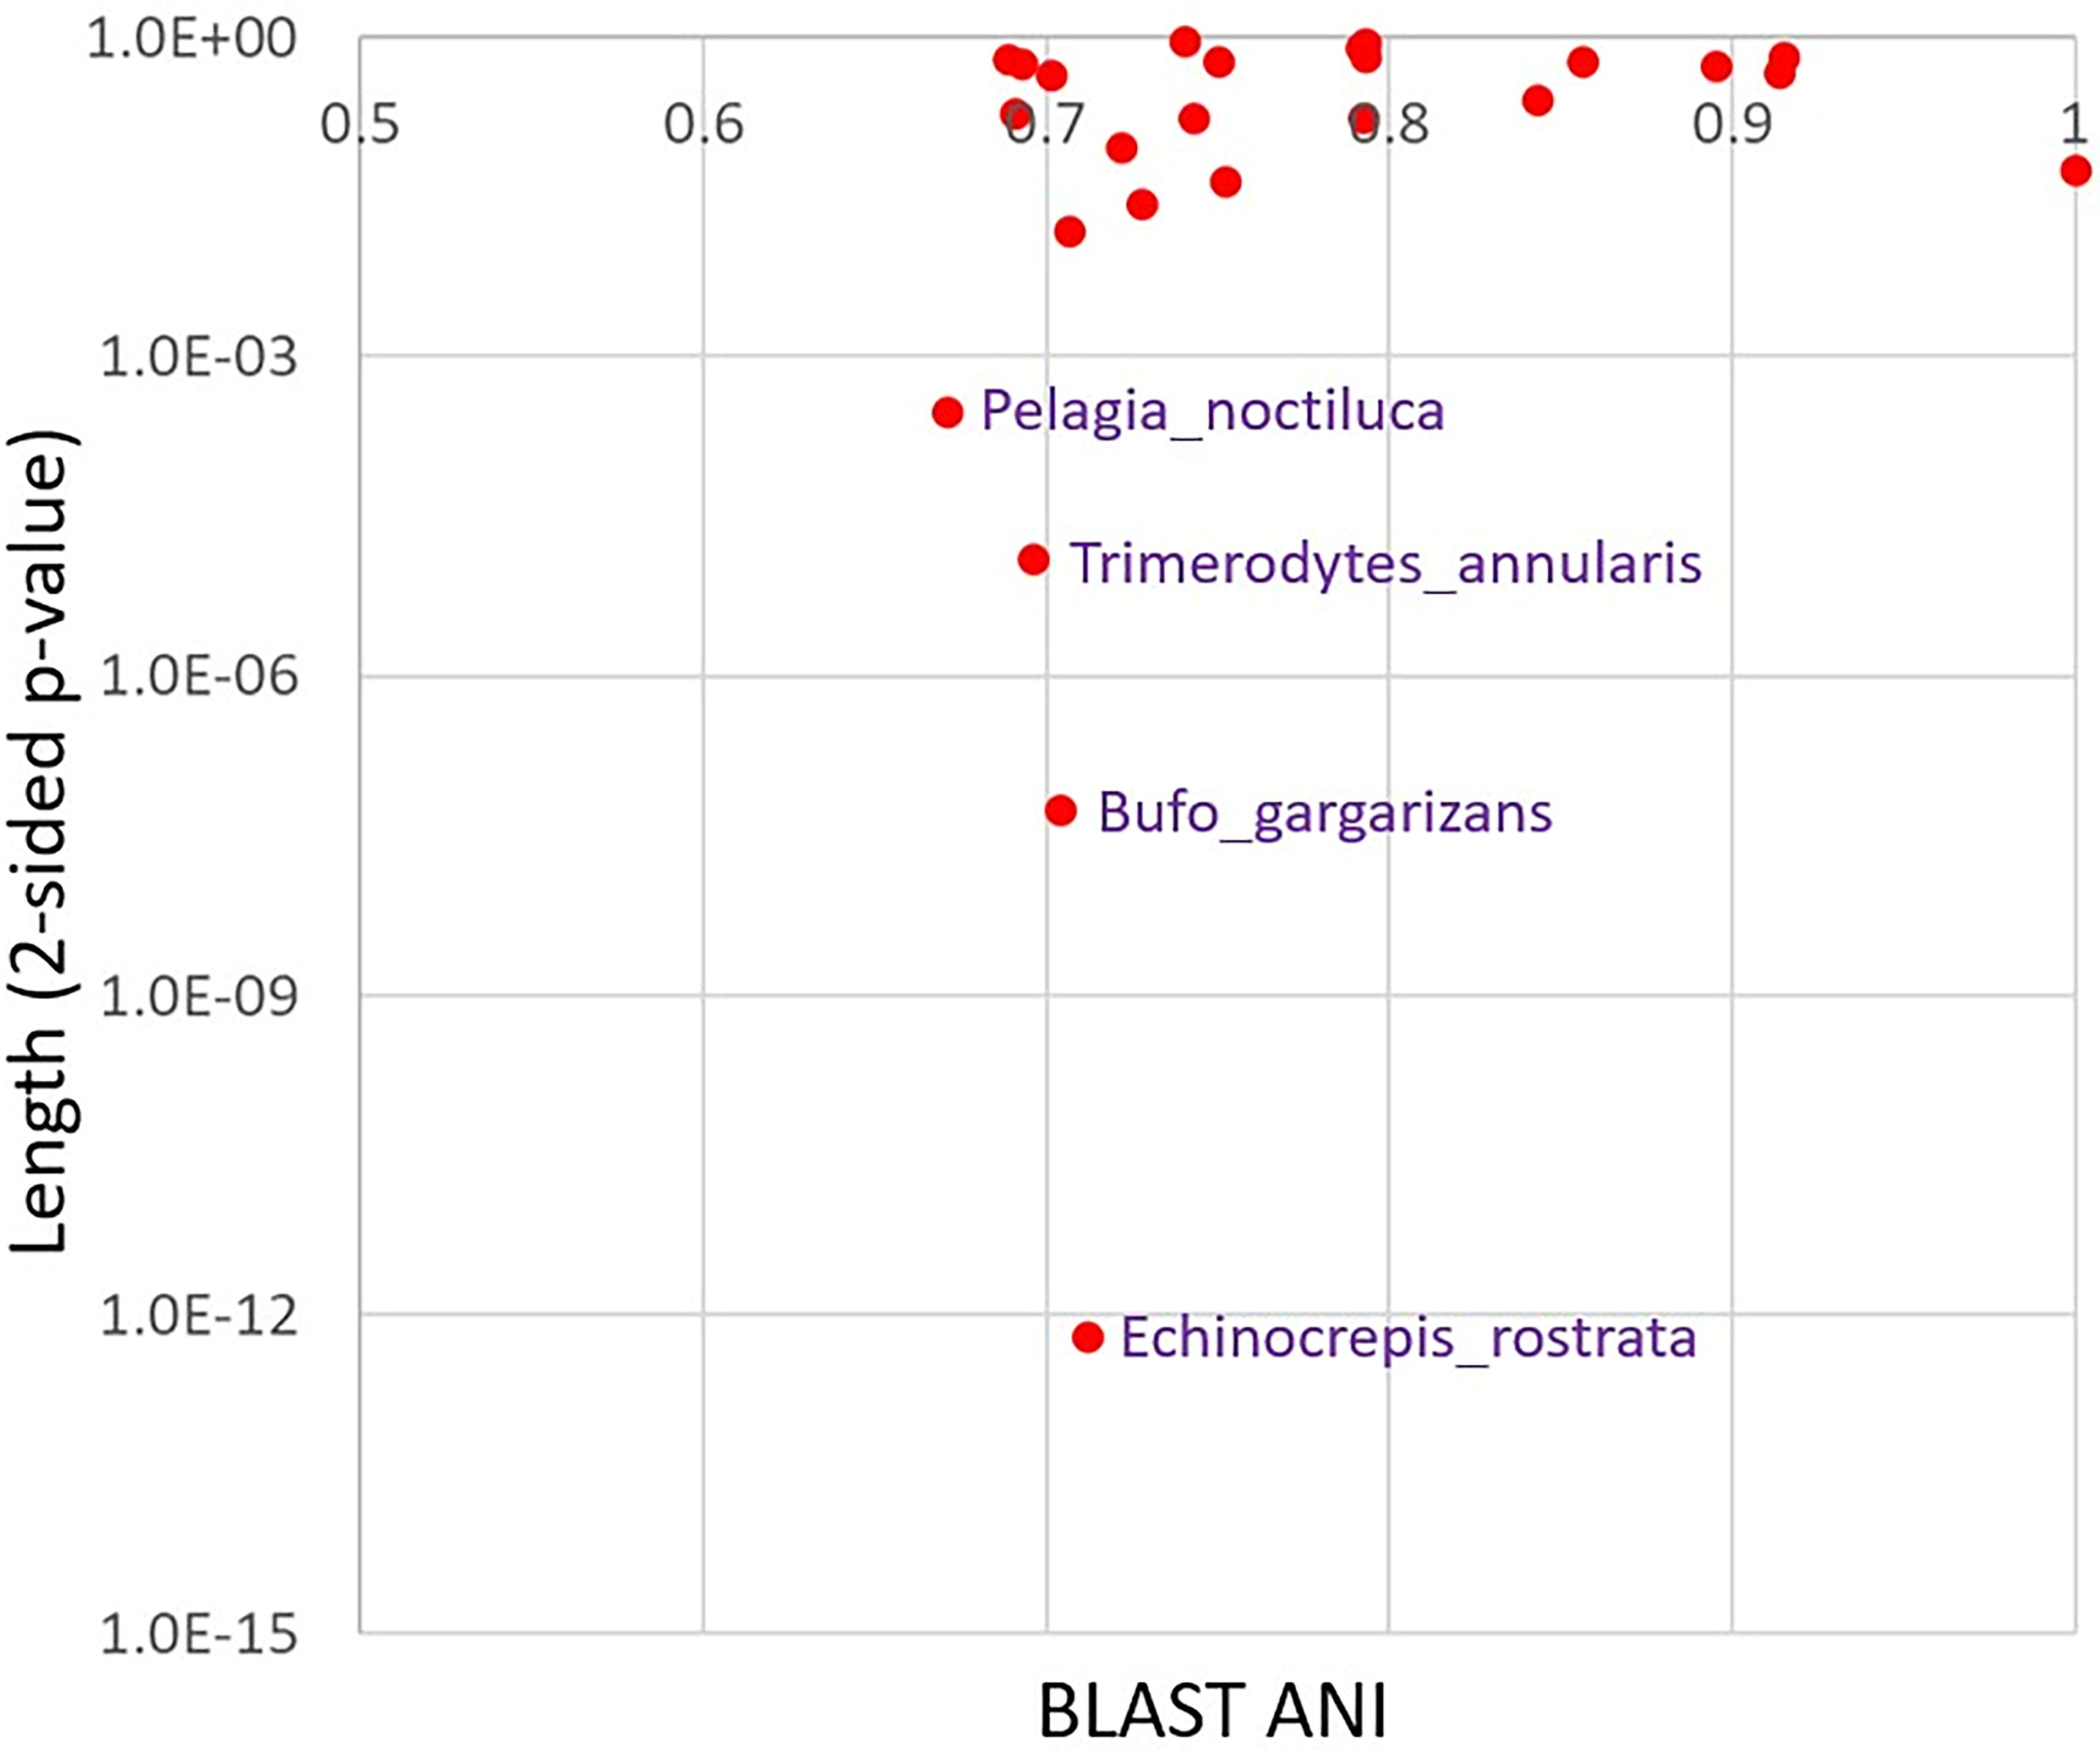
p-Value for the reference length yielding the syncmer count vs. the BLAST ANI. This figure plots the p-value based on Eqs (3) and (4) on the Y-axis against the BLAST ANI on the X-axis for each of the 25 mitochondria in the SI. The BLAST ANI facilitates the reader’s ability to correlate points between Figures 5 and 6. The p-value tests whether the syncmer count from the corresponding mitochondrial sequence B comes from the same mitochondrial length as the reference mitochondrial sequence A under the probability models of the text. It therefore can test for the presence of insertions or deletions in passing from the reference to the query sequence.
Figure 6 labels four mitochondrial genomes. The corresponding p-values show that the stated probability models likely require insertions or deletions in the reference mitochondrial sequence A from Homo sapiens neanderthalensis to produce the syncmer counts in the query sequences B.
In Figure 7 and in this paragraph, all lengths are in nucleotides. The points yield an unweighted correlation coefficient r = 0.760, with r2 = 0.578. In Figure 7, most points lie close to the diagonal dotted line Y = X, indicating accurate length estimates, with the point (16916, 16247) farthest below it (and corresponding to C. porosus). To explain the anomaly, consider the multiset of syncmers from a mitochondrial sequence (multiset, because some syncmer sequences may appear several times within the mitochondrial sequence). The Excel file “mitochondria.csv” in the GitHub repository shows that all 25 mitochondria have 21 or fewer replicate syncmers, except C. porosus (44), E. chrysolophus (41), Ornithorhynchus anatinus (51), and T. annularis (64). The C. porosus mitochondrion is the shortest of the four exceptions (16916 compared with 17059, 17019, and 17511, respectively). It has a repetitive, simple sequence of about 500 nt near its end (see Supplementary Section S4). The C. porosus anomaly emphasizes the importance of syncmer uniqueness to sequence matching.
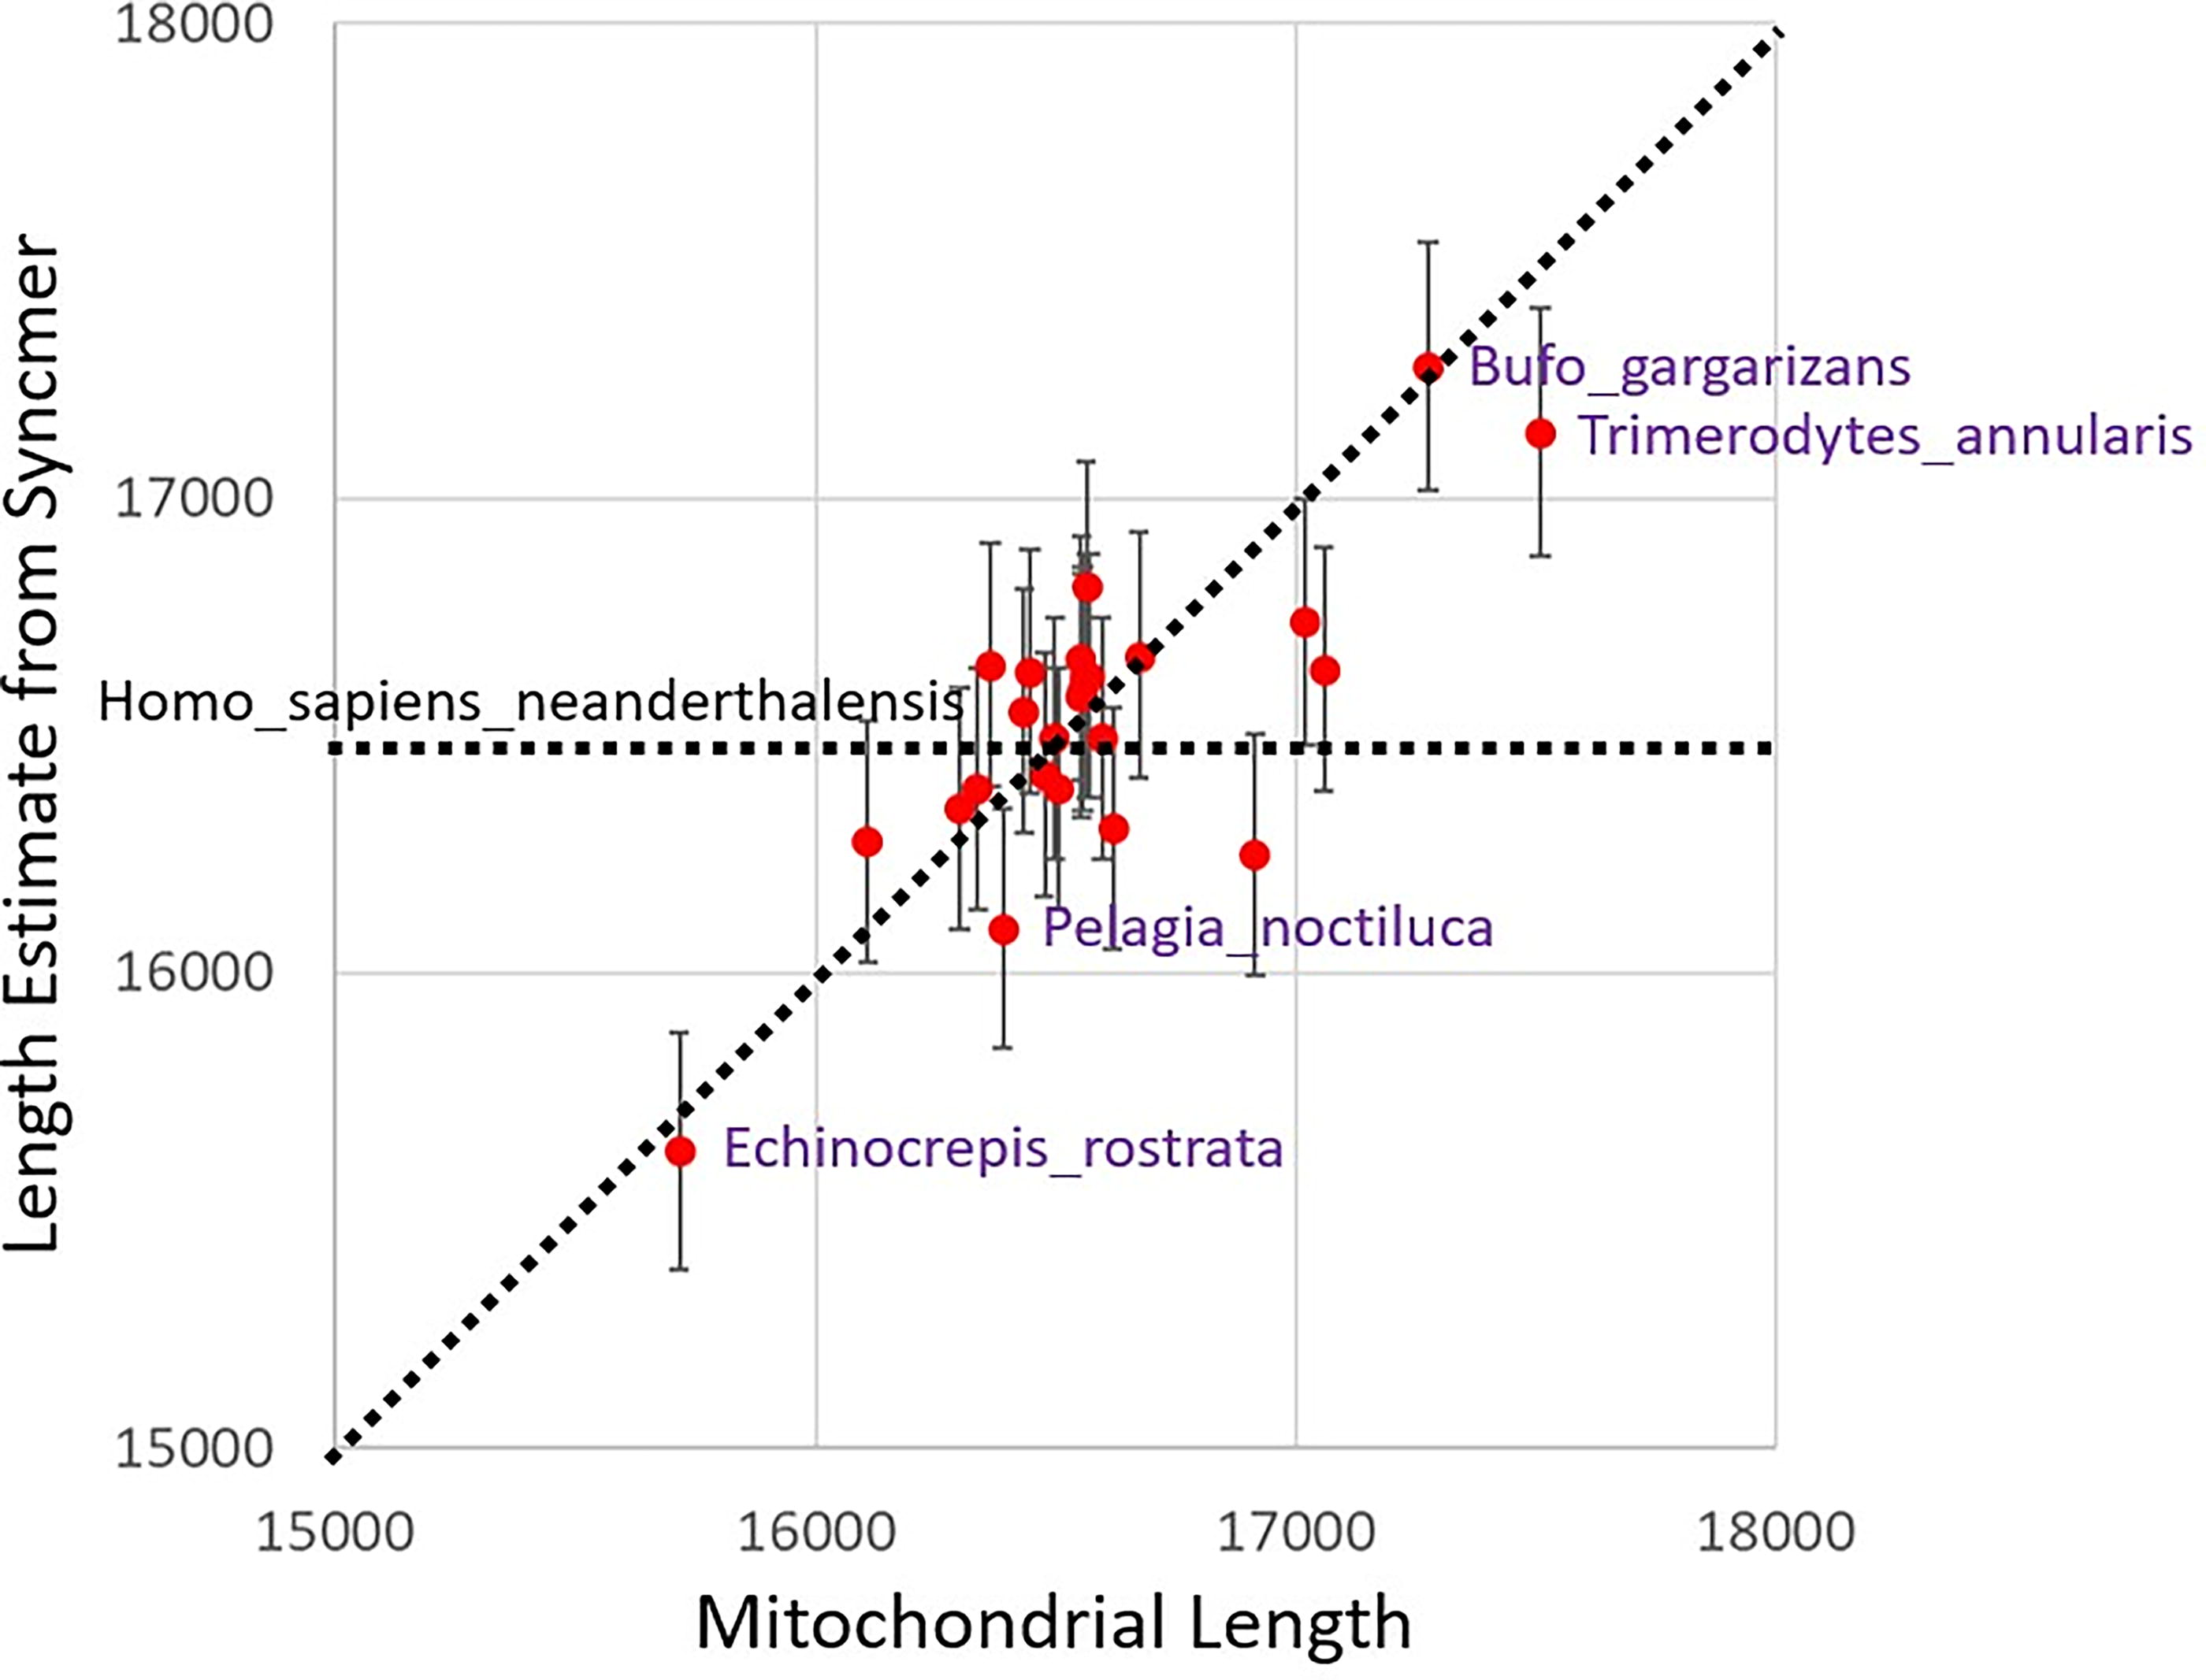
Syncmer mitochondrial length estimate with 95% CI vs. actual mitochondrial length. In this figure, all lengths are in nucleotides. The Y-axis indicates the mitochondrial length estimates along with their 95% CIs from Eqs (2)–(4) and the syncmer counts. The X-axis indicates the assembled mitochondrial length, usually unavailable in applications. The plot also displays a horizontal line corresponding to the length L + k − 1 = 16565 of the mitochondrial reference, Homo sapiens neanderthalensis.
Throughout, the present article assumes a simple mutation model excluding insertions and deletions (Blanca et al., 2022). It then presents CLTs for syncmers in a sequence and for syncmers conserved across both reference and query sequences. On one hand, the conserved syncmer CLT quantifies a phylogenetic distance with sampling errors as a mutation probability corresponding to an ANI. The conserved syncmer CLT provides sampling errors for the Mash containment index (Ondov et al., 2019) for syncmers. The conserved syncmer CLT may therefore provide a model for estimating sampling errors for other Mash containment indexes.
In anticipation of actual code usage, Section 3 substitutes the sequence length L + k−1 for the k-mer count L in both input and output, but if k is a few percent of L + k − 1, the conflation is harmless. Section 3 showed that in specific cases, the syncmer CLT for L provides reasonable approximations if L + k − 1 is more than about 104. In general also, the syncmer CLT for length from Eq (3) likely requires a syncmer count
On one hand, if the mutated sequence B is represented by unassembled reads, ideally the reads should cover B without gaps, particularly if the syncmer CLT for L is to be applied. Otherwise, if g > 0 counts the gaps, the k-mer count L could differ noticeably from the covered length L + (g + 1; k − 1). In contrast, we expect the conserved syncmer CLT for the mutation probability θ from Eq (5) to be relatively robust against gapped coverage because it compares reference and mutated sequences with syncmer counts
The conserved syncmer CLT for the mutation probability θ from Eq (5) likely requires a conserved syncmer count
On the other hand, for complete k-mer sketches, which contain every k-mer within a sequence, indel restrictions in the simple mutation model can be relaxed by observing that (k − 1)-mers are nested inside of k-mers (Röhling et al., 2020). The nesting property permits edge effects to estimate indel counts. Like k-mers, mid-open syncmers also have a nesting property. For
Simulations in Section 3 suggest that some qualitative constraints must be satisfied before applying our CLTs. The syncmer CLT for the k-mer count L from Eq (3) requires a syncmer count
Our CLTs require that after postprocessing of raw sequencer output, the syncmer multiset
In Section 3, the inaccuracy of the length estimated for the C. porosus mitochondrion likely reflects simple repeats. The SI shows that for mid-open (k, s) = (13,7)-syncmers, only four taxa including C. porosus contained more than 20 replicate syncmers. Thus, the syncmer CLT for L can detect length discrepancies from syncmer counts alone, without assembling reads, and flag them for further investigation. Outside the four taxa, k-mers were typically long enough to provide syncmer uniqueness. The repeat program tantan (version 40) identified a repetitive simple sequence at the end of the anomalous C. porosus mitochondrion as a possible source of replicate syncmers.
Our analysis of overlapping syncmers neglects s-minimizer ties, so it implicitly assumes long s-mers (e.g., see for contrast s = 2 in Fig. 2). In addition, our CLTs provide continuous approximations to discrete distributions. Thus, they likely require s-minimizer offsets to vary almost continuously within k-mers, that is, they require each k-mer to contain many s-mers (e.g., see for contrast L = 105, k = 10, and s = 6 in Fig. 2).
In summary, by necessity our CLTs place restrictions on syncmers. The main article above states several of these restrictions qualitatively, but the SI sharpens some of them into quantitative restrictions.
The present article aimed to extend previous CLTs for the complete and MinHash sketches (Blanca et al., 2022) for use with other submer sketches (Edgar, 2021). It focused on mid-open syncmers, mostly because of their optimality properties (Shaw and Yu, 2022), but its results hold generally, for parametrized syncmers with downsampling. Some techniques here likely also extend to other submers and their short-range correlations.
The SI proves our CLTs by analyzing syncmer overlaps under a probability model for random hashes. Even without foundations from probability theory, the techniques could likely be extended to other concepts like universal hitting sets, polar sets, etc., by analyzing the empirical overlaps between submers. Regardless, submers based on random hashing functions confer an additional layer of randomness on probability models of DNA. Sequence probability models often cannot capture unknown correlations in DNA, so the extra layer of randomization from hashing functions may improve the accuracy of the probability models.
Footnotes
ACKNOWLEDGMENT
The authors thank Jim Shaw and Yun William Yu for useful conversations.
AUTHORS’ CONTRIBUTIONS
J.L.S.: Conceptualization, formal analysis, methodology, software, supervision, visualization, and writing–review and editing; P.D.: Software, validation, visualization, and writing–original draft; Y.C.: Investigation, methodology, software, and validation; M.F.: Methodology, supervision, and writing–review and editing.
DATA AND SOFTWARE SHARING
AUTHOR DISCLOSURE STATEMENT
The authors have received no assistance for their work from outside their academic institutions and have no patents or copyrights relevant to the work in the article.
FUNDING INFORMATION
This research was supported in part by the Intramural Research Program of the National Library of Medicine, National Institutes of Health.
References
Supplementary Material
Please find the following supplemental material available below.
For Open Access articles published under a Creative Commons License, all supplemental material carries the same license as the article it is associated with.
For non-Open Access articles published, all supplemental material carries a non-exclusive license, and permission requests for re-use of supplemental material or any part of supplemental material shall be sent directly to the copyright owner as specified in the copyright notice associated with the article.