
Abstract
INTRODUCTION
Phylogenetics is a field of study that investigates the evolutionary relationships between different entities such as genes or species. It involves inferring evolutionary trees or “phylogenies” using computational methods. These trees represent hypotheses about the relationships between different groups, and can be based on data from DNA sequences, protein amino acid sequences, or morphological characters (Yang and Rannala, 2012).
Different datasets and tree inference methods may lead to inconsistent hypotheses of evolutionary relationships. To resolve these inconsistencies, tree comparison costs are used to evaluate the fit between different trees and a given dataset (Allen and Steel, 2001; Estabrook et al., 1985; Robinson and Foulds, 1981; Waterman and Smith, 1978). If the true tree is known, it is possible to compare the different inferred trees and identify those that accurately describe the true tree topology or are close to it (Russo et al., 1996). If the true tree is unknown, which is generally the case in biological studies, cost measures can rank trees and identify areas of incongruence that were generated from different input datasets or tree inference methods (e.g., Shen et al., 2021). Objectively identifying these areas may have utility in phylogenomic studies (Prum et al., 2015; Wickett et al., 2014). Furthermore, one can evaluate the robustness of phylogenetic inference and identify areas of uncertainty by comparing the tree costs associated with different analyses and datasets (Lozano-Fernandez, 2022). Therefore, comparative phylogenetics applies such costs to facilitate phylogenomic studies and provide a metric for assessing tree errors and incongruence.
Tree comparison costs have distinct properties such as their distribution, sensitivity to small changes in the tree structure due to data errors or noise, and computability. Therefore, developing tree comparison costs with beneficial characteristics will enhance research in phylogenetics and other areas that rely upon tree-focused inference. For example, comparison costs are used in epidemiology for comparing transmission trees and virus genealogies (Giardina et al., 2017), to determine horizontal gene transfer events (Bogdanowicz and Giaro, 2017), and in natural language processing to compare and determine an aggregate parse tree (Kulkarni et al., 2022). Consequently, the development and improvement of tree comparison costs is a mature and highly active research area in computational and comparative phylogenetics (e.g., Robinson et al., 2016). The Robinson–Foulds (RF) distance is commonly used to compare the topology of two trees. It measures the cardinality of the symmetric difference of the cluster sets represented by each tree.
Although the RF distance can be computed efficiently, it is highly sensitive to differences in trees, and even small variations can result in a significant RF distance. This property of the RF distance makes it challenging to differentiate between meaningful and random differences, which can lead to incorrect conclusions about the similarity of the compared trees. These issues have been previously discussed by Steel and Penny (1993) and Lin et al. (2011). There have been various approaches proposed in the literature to generalize the RF distance measure. These include matching similar splits between trees (Bogdanowicz and Giaro, 2013; Bogdanowicz and Giaro, 2011), normalizing using the Jaccard Index (Nye et al., 2006), or normalizing through the use of an arbitrary exponent (Böcker et al., 2013). While these methods have improved the application of RF-like distance measures, they do not fully account for the inherent asymmetry in many phylogenetic comparison studies.
Phylogenomic studies often encounter asymmetry issues. For instance, when comparing a gene tree to a species tree, the gene tree may not be fully resolved due to low branch support or insufficient phylogenetic signal in the alignment. As a result, the clusters in the species tree may not be present in the gene tree, which leads to asymmetric comparison costs (Page, 2002; Swenson et al., 2011). Asymmetry in phylogenomics also appears due to gene duplications (i.e., paralogous genes) or horizontal gene transfer, and assessing trees objectively can strengthen phylogenomic studies (Lozano-Fernandez, 2022).
In this work, we introduce the asymmetric Cluster Affinity (CA) cost to address the problems of RF. This measure involves determining the minimum cost of a cluster in the source tree for each cluster in the target tree, thereby reducing the issues of RF. We also introduce a biologically interpretable cost related to CA, the Cluster Support (CS) cost that normalizes the individual cluster contributions to the cost by the respective cluster sizes in the source tree. Both costs can be efficiently computed in
Related work
The RF distance (Robinson and Foulds, 1981) is a standard distance for comparing phylogenies due to its low complexity and interpretability. However, since RF has a narrow distribution and is sensitive to tree errors, there have been many attempts to generalize RF and overcome its shortcomings. A few notable examples are (1) the information-theoretic generalized RF (Smith, 2020) and (2) Matching Split (MS) and Matching Cluster(MC) distances (Bogdanowicz and Giaro, 2013; Bogdanowicz and Giaro, 2011; Lin et al., 2011) that find a minimum perfect matching between the split representation or the cluster representation of two trees. The CA distance later relaxed the matching requirement in the MC distance, thus allowing a one-to-many mapping from one tree to another. This relaxation allowed for a considerably faster distance computation while preserving the robustness to tree error and the wide distribution range that the MC distance has. The CA distance assigns for a pair of clusters c1 and c2 a corresponding cost equal to the total number of changes required to change the cluster c1 into the cluster c2. The mapping cost for tree T1 to tree T2 is the sum of the minimum mapping of all the clusters in T1 to the clusters in T2. The CA distance for T1 and T2 is the arithmetic mean between the mapping costs from T1 to T2 and vice versa.
Another key property of tree comparison measures is the diameter, that is, the maximum distance between two trees over a fixed taxon set of size n. It is crucial to understand the diameter to make tree distances comparable for different pairs of trees through normalization using the diameter. Additionally, normalization enables comparison across different tree comparison measurements. For RF, the diameter is known, but the exact diameters of MS, MC, and CA remain an open problem (although Bogdanowicz and Giaro, 2013; Bogdanowicz and Giaro, 2011; Moon and Eulenstein, 2019 provide bounds).
Our contribution
In this study, we relax the CA cost, introduce an efficient algorithm for computing updates to the cost in response to Nearest Neighbor Interchange (NNI) tree edit operations, and establish an exact diameter for the cost. We adopt two approaches to relax the cost. First, we allow the cost to be asymmetric by only taking into account the cost of CA mapping from T1 to T2. This asymmetry appears naturally when comparing different tree types, such as a gene tree to a species tree in a phylogenomic analysis or an estimated tree to the ground truth in simulation/convergence studies. Second, we permit clusters in T1 to map to trivial clusters in T2 (i.e., leaves and the root cluster). This was not allowed in the original definition (Moon and Eulenstein, 2019).
Note that the CA cost sums up the raw cluster differences across all clusters. That way, a 5% difference in a bigger cluster with 500 taxa may dominate over a 40% difference in a small cluster with just 10 taxa. To overcome this, we define another measure, where CA is normalized by the respective cluster size, which we denote the CS cost. This way all clusters contribute the percentage of the distance rather than the raw numbers as in the original CA cost. A 5% overall CS cost means that clusters in T1 are, on average, 5% different from clusters in T2.
We developed an algorithm that efficiently conducts an NNI (Bordewich and Semple, 2005) search with the CA or CS cost. This algorithm requires a single preprocessing step that takes
Furthermore, we proved that the CA diameter for trees with n leaves is
2. ASYMMETRIC CA COST
A phylogenetic tree T over a taxon set M is a rooted binary tree where each leaf is bijectively labeled with the elements from M. The vertex set and edge set of T are denoted by
An edge
We define the height of a node v as the edge-length of the longest path i.e., the path containing the maximum number of edges from the node v to a leaf l such that
For two sets A and B, we define
A set of leaves
For convenience, we assume throughout the text that M is a taxon set, G, S, and T are trees over M, and
Tree edit operations
We define two classic tree edit operations for rooted trees, namely the SPR operation and the NNI operation (Bordewich and Semple, 2005).
Let T be a phylogenetic tree and let If w is the root of T, we create a new vertex Otherwise, we create a new vertex,
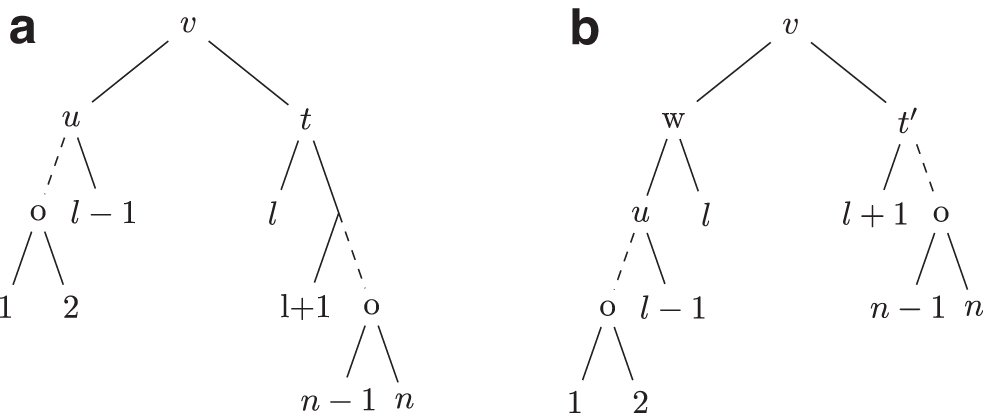
The NNI operations are SPR operations where the subtree is pruned close to its regrafting position as follows. For a nonroot node v from T, let
We present an algorithm for the efficient NNI tree space traversal.
Proof. In the previous section, we showed that computing
Now, we show how to compute
Updating dv in the binary heap by removing the old value and then replacing it with
Diameter of the CA cost
In this section, we derive the diameter for the asymmetric CA cost. However, first we require a few additional definitions to obtain the diameter of the CA cost.
A rooted caterpillar tree is a rooted tree T, where each internal node has at least one leaf child. We define a caterpillar Cn using the standard nested parenthesis notation as
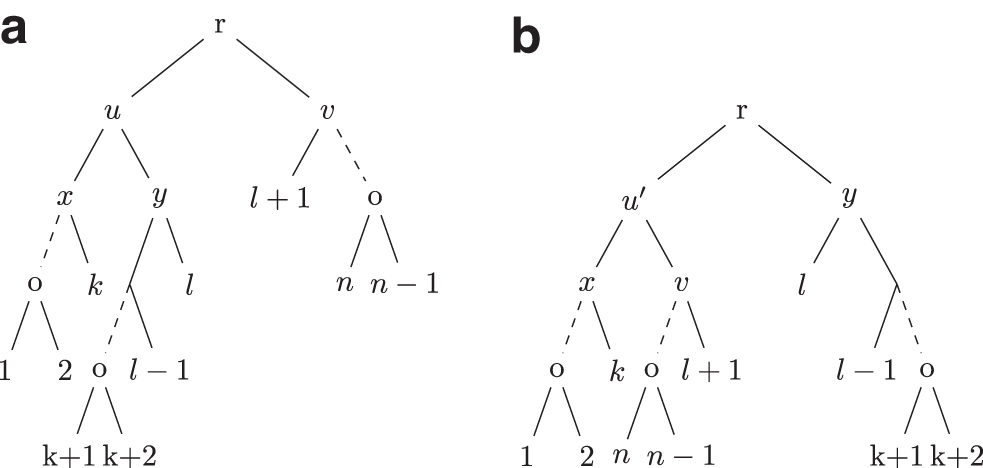
Proof. Let n be the size of S. Consider a leaf l on tree S such that
Proof. Let n be the size of T and
Let cw represent the new cluster that is formed in
Proof. Consider a cluster c from Cn. For any cluster r in
Note that
Hence,
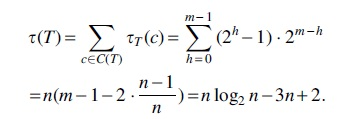
Proof. We show that the diameter is
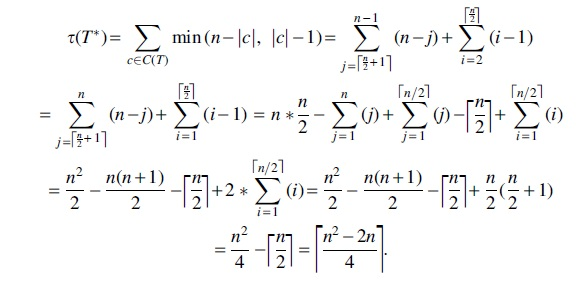
Hence, the diameter for the CA cost is
We define the separation cost for CA cost as the absolute difference between the CA costs between the two trees S and G. That is
Proof. It follows from Theorem 2.
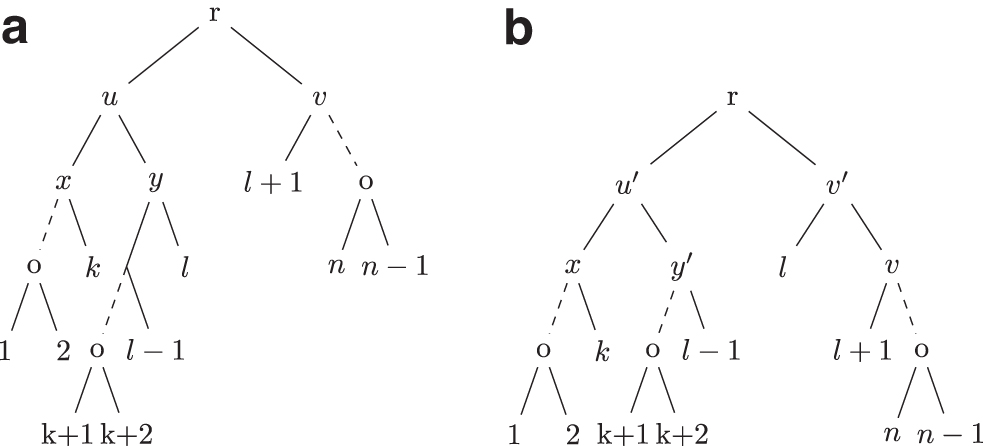
Proof. We construct a perfectly balanced tree Pn such that each nontrivial cluster in Pn is of the form
Consider a cluster
For all the other remaining cases, while
Proof. Let v be an internal node in
Thus
Proof. It follows from Lemma 6 and Lemma 1 that 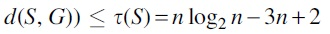 and hence,
For the remaining
Proof. From Lemma 7,
We define the CS cost and then derive the exact diameter for that cost.
For interpretability, in practice, we further divide
For a tree T with a leaf set M and a node
Proof. We know from Lemma 1 that
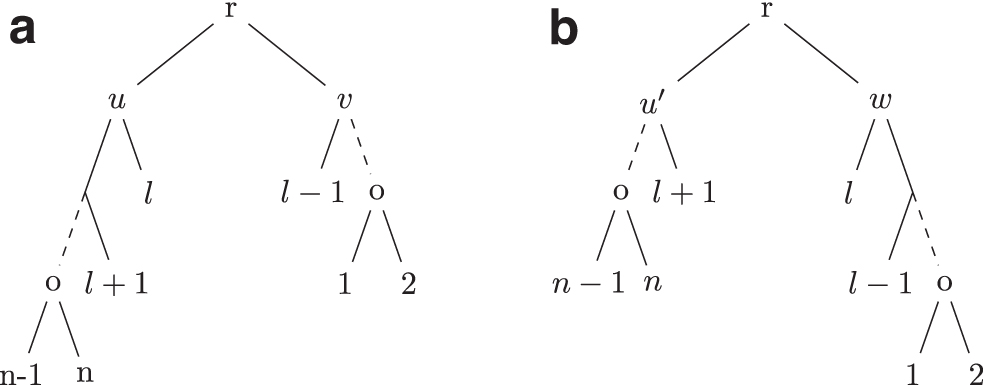
We define a 2-caterpillar tree Dn such that the two subtrees from the root are
Let T be a tree of the size n. Let
Rule 1. If
Rule 2. If
Rule 3. If
Rule 4. If
Rule 5. If u and v are children of the root such that
We show in the following lemma that applying these rules to a tree T to obtain a tree
Proof. Let n be the size of T and
Hence, if S is obtained by applying an operation to T,
Hence, for any tree
Proof. Let n be the size of T.
Hence, u must be a nonroot internal node. If
Hence, for any non 2-caterpillar tree T, there exists a rule that can be applied to T. Conversely, if T is a 2-caterpillar tree, there is no rule that can be applied to T. We showed by Lemma 9 that if we derive a tree
We say that a tree T is transformed into
Proof. By Lemma 10, for any tree T of size n, if T is not a 2-caterpillar tree then there exists a rule that can be applied to T. Moreover, by Lemma 9, for a tree
We proved that every rule application increases
Hence, we have for every tree T, a maximal finite sequence of transformations ST that can transform a tree T into a 2-caterpillar tree
Proof. Let
Hence, for any tree T we are able to convert it into a 2-caterpillar tree
Proof. We show that the diameter is
Hence the diameter for the CS cost is
We compare the distribution and the robustness of the CA and CS costs (defined in this work) with the classic RF distance. Since the CA and CS are asymmetric costs, we use the asymmetric (one-sided) version of RF for comparison, also known as the false negative rate. We define the one-sided RF between trees T1 and T2 as the number of clusters in T1 that are not present in T2.
CA and CS display a broad distribution range
Table 1 shows the descriptive statistics of the (asymmetric) CA, CS, and RF costs on pairs of random trees. We generated 10,000 pairs of trees each containing 100 taxa. We used the birth–death model to generate the trees with a birth rate of 1.0 and a death rate of 0.5. The birth–death process was terminated when the tree had the required number of extant taxa.
Asymmetric Robinson–Foulds, Cluster Affinity, and Cluster Support Distribution Statistics for Random Tree Pairs with
Leaves
Asymmetric Robinson–Foulds, Cluster Affinity, and Cluster Support Distribution Statistics for Random Tree Pairs with
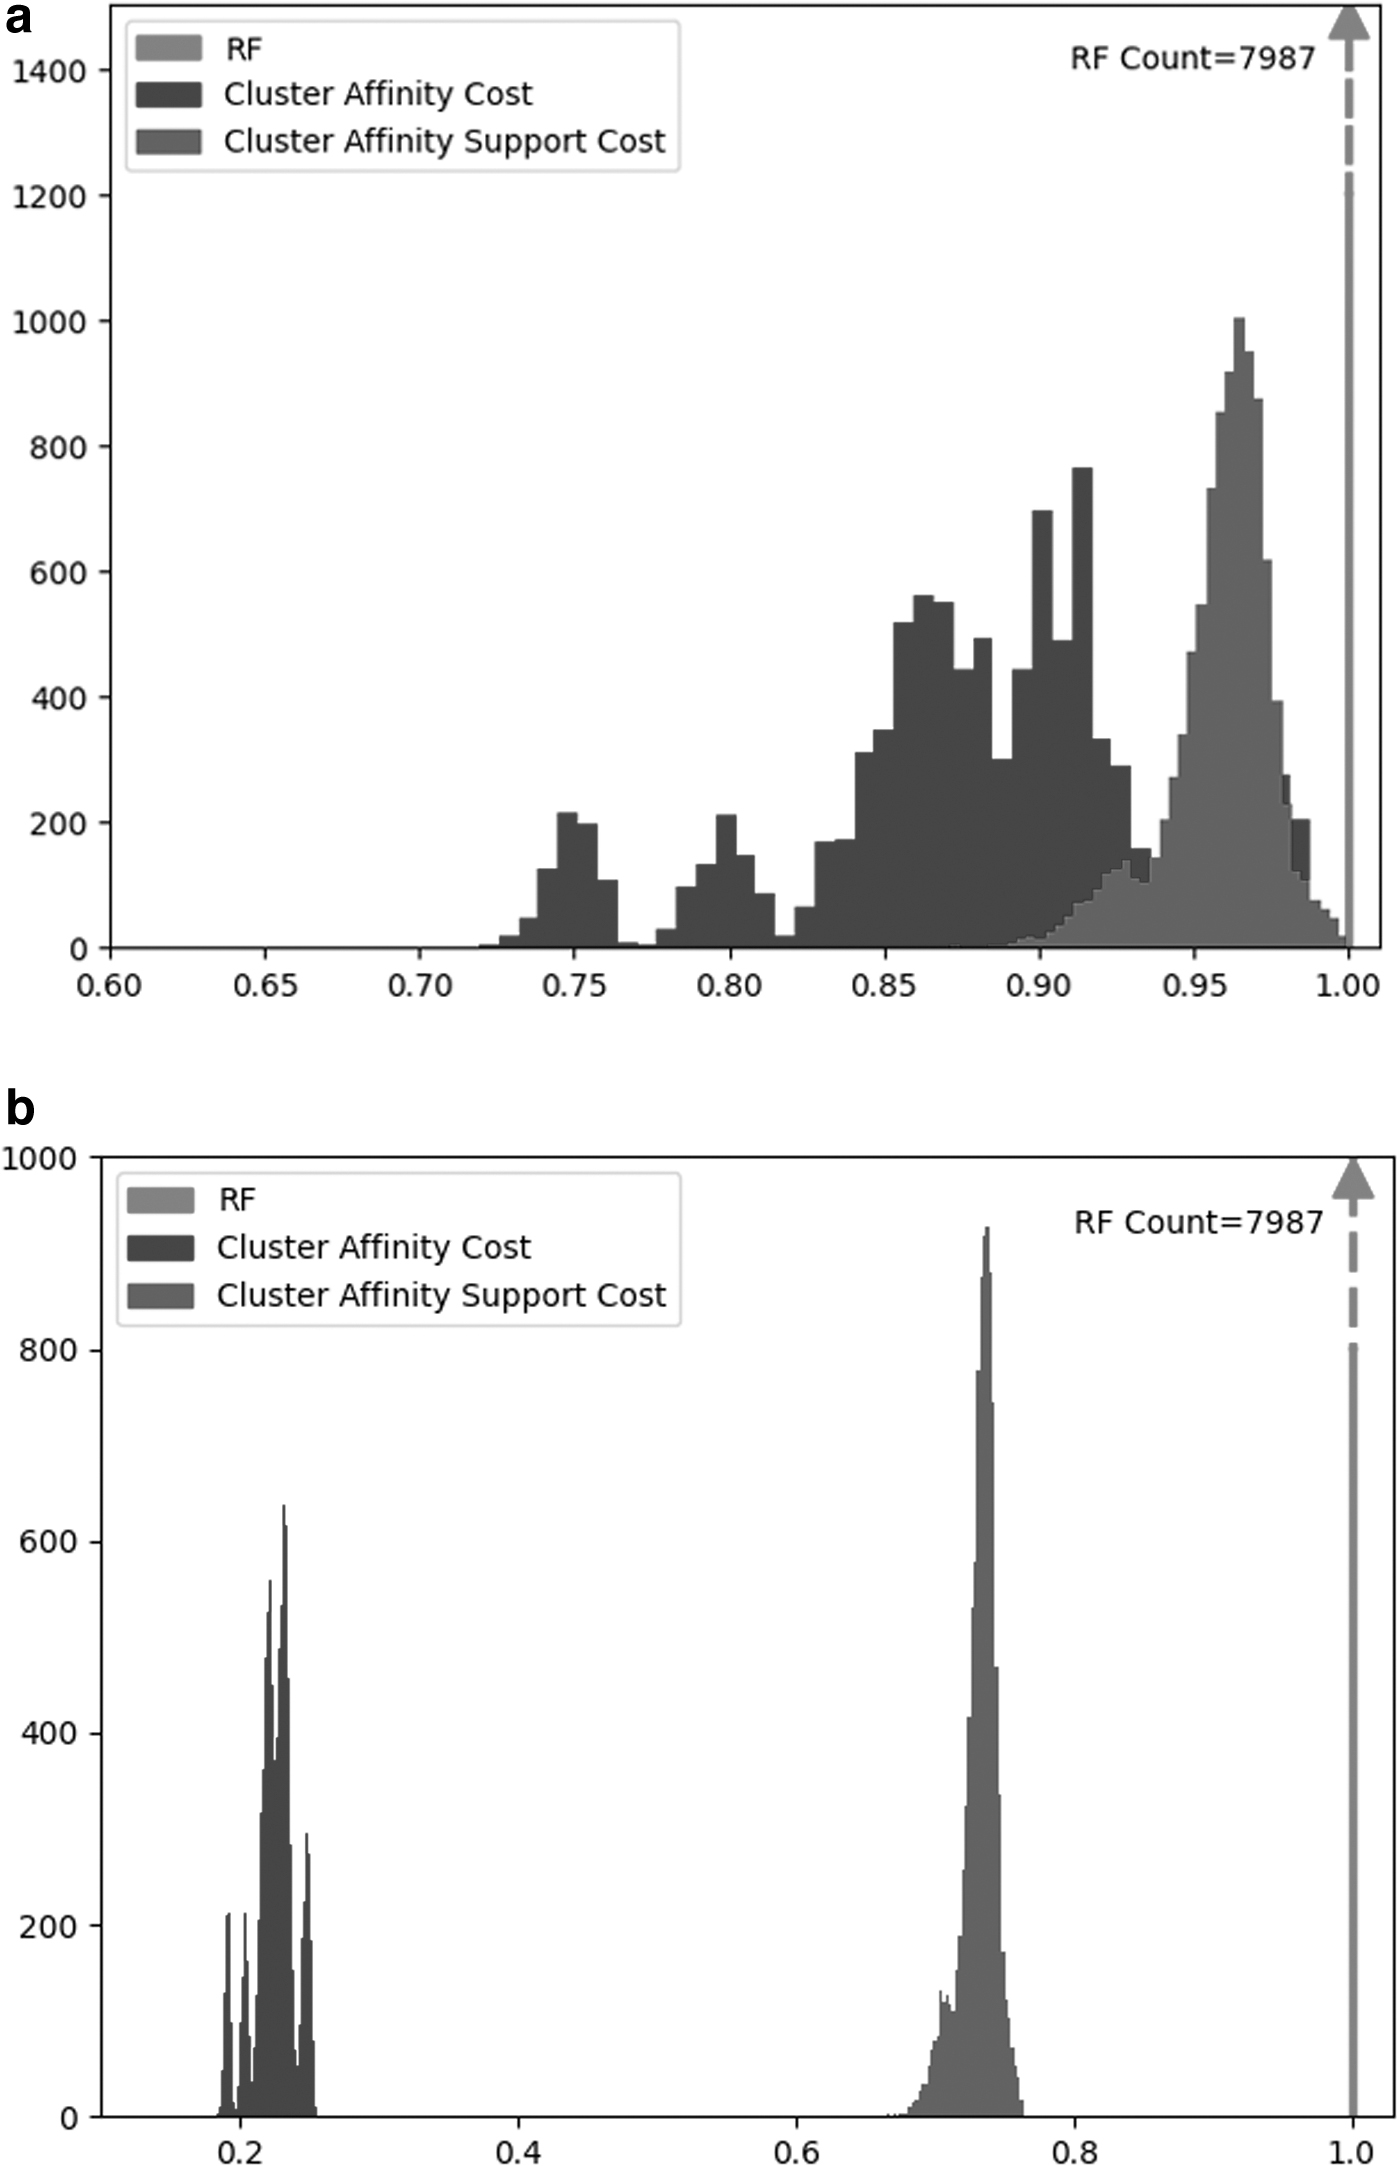
All values are normalized by the maximum observed cost, respectively. Note that both CA and CS display a broader distribution range than RF. Moreover, out of all the costs, CA is the least skewed toward the maximum while RF is the most skewed toward the maximum.
CA, Cluster Affinity; CS, Cluster Support; RF, Robinson–Foulds.
We observe that CA and CS both have a broader distribution range (standard deviation and the min–max range) than RF. Out of all three costs, CA has the broadest range and has the least skewed distribution, while RF is most skewed toward the maximum. These results are similar to the comparison between the original (symmetric) CA distance and RF (Moon and Eulenstein, 2019); thus, demonstrating that our cost relaxation maintained the key properties of the original CA distance. Figure 5 visually captures the distributions for CA and CS. Note that we truncate the data for RF to preserve the details of the histograms for CA and CS. Moreover, due to the large diameter of the CA cost, the discretization of the bins on the histogram results in multiple peaks being observed.
Additionally, we quantified the CA asymmetry between the tree pairs. For a pair of trees (
We observed that for a pair of trees with
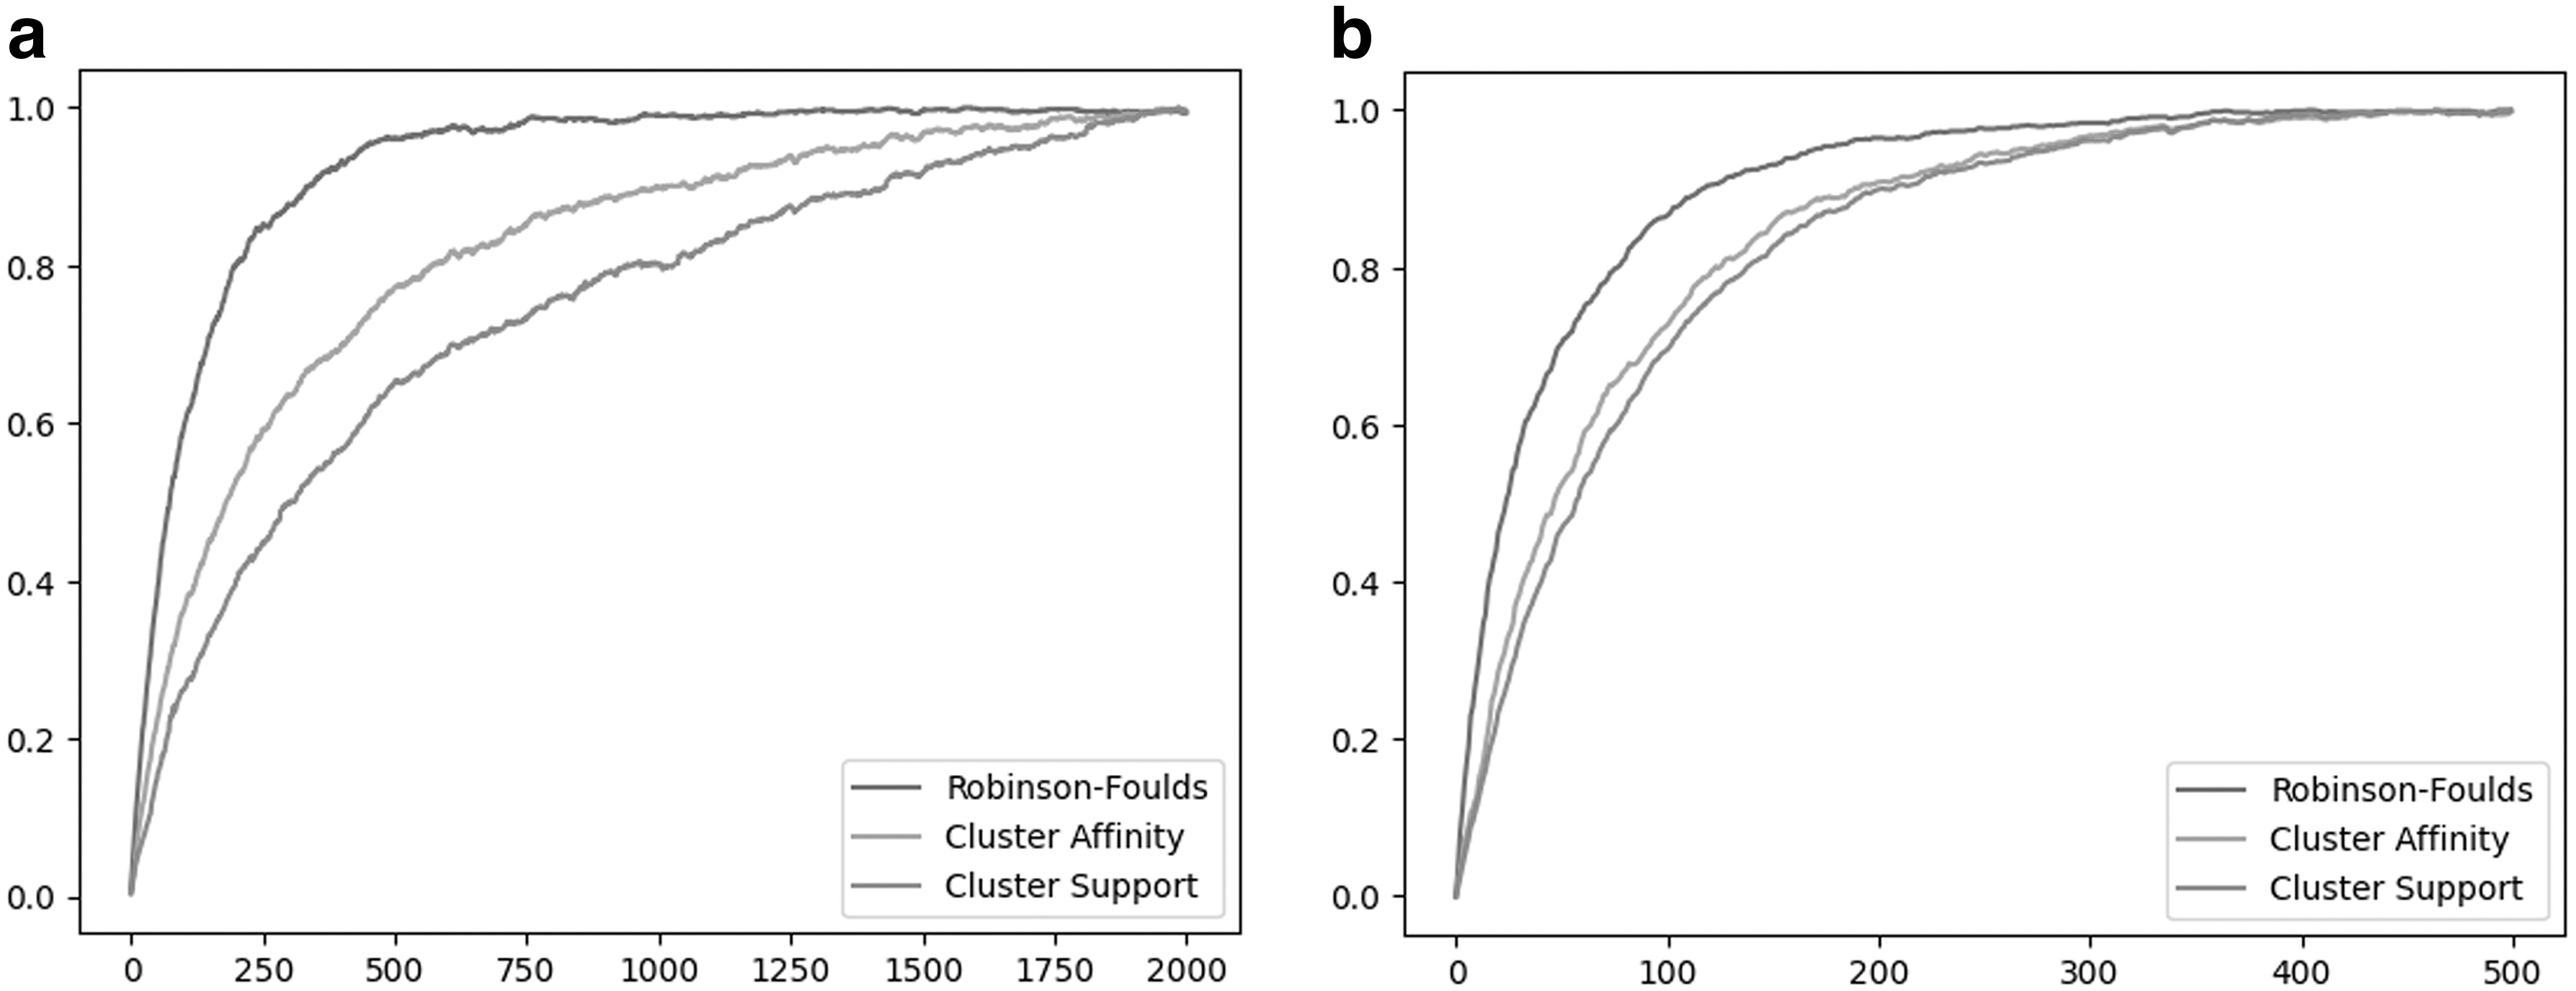
We demonstrate that CA and CS are significantly more robust to tree edit operations (and, hence, tree-error) than RF. Our experimental setup follows (Moon and Eulenstein, 2019) for comparison between the CA, CS, and RF distances.
Dataset
We generated a set of random trees  , where each
  was obtained by an NNI operation on
  and the edge for the NNI operation was chosen uniformly and independently at random. Similarly, for each tree Ti, we also generated a sequence of trees
  where each
  was obtained by an SPR operation on
  where the edges for the SPR operation were chosen uniformly and independently at random. Note that
Experimental setting
Distances were computed between tree pairs  and
and  for each j and averaged over all
Results
The respective RF, CA, and CS costs over consecutive NNI and SPR operations are shown in Figure 6. We observe that for both NNI and SPR edit operations, RF approaches the maximum value very rapidly. In contrast, CA and CS costs are significantly more robust to the tree edits and demonstrated better resolution than RF. The CS cost was most robust in terms of both NNI and SPR edit operations.
A key objective in phylogenetics is to construct a plausible hypothesis of the evolutionary history of an organism. Merging different datasets and gene trees into larger species trees and supertrees can improve the resolution of evolutionary inference. To achieve this, it is necessary to develop methods that can estimate uncertainty and identify conflicts in different gene trees and datasets. Our study introduces an asymmetric CA cost, which is based on determining the minimum cost for a cluster in the source tree for every cluster in the target tree. We have also developed efficient algorithms for calculating the CA cost and determining its diameter. To measure the asymmetry of CA cost, we define a separation diameter as the maximum difference between the two directions that CA cost can be computed. Furthermore, we present a more interpretable cost definition in which cluster differences are normalized by their respective cluster sizes. We have also derived a theoretical diameter for the CS cost and experimentally demonstrated its robustness to tree error.
A promising implication of developing this measure is its future use in the inference of phylogenetic networks (Huson and Bryant, 2006). Some approaches to phylogenetic network inference use tree distance measures to analyze a collection of input trees to seek a minimum reticulation network with the smallest number of reticulation vertices into which the input trees can be embedded (e.g., Markin et al., 2019). The use of RF distance in clustering algorithms often leads to many shallow reticulation events, as the algorithm tries to match clusters fully. To overcome this, we suggest applying CA/CS costs in phylogenetic network inference. This approach allows minor cluster mismatches in smaller clusters to be overlooked, enabling the algorithm to focus on identifying significant reticulation events higher up on the phylogeny (Kong et al., 2022).
The software for computing and visualizing the CA cost is being prepared for release and available upon request from the authors.
Footnotes
ACKNOWLEDGMENTS
This contribution is an extension of an article that appeared in RECOMB-CG (https://doi.org/10.1007/978-3-031-36911-7_9) (Wagle et al., 2023). The authors thank Dr. Swenson for referring them to Truszkowski et al., (![]() ) and discussions benefiting this work.
) and discussions benefiting this work.
AUTHOR DISCLOSURE STATEMENT
The authors declare they have no conflicting financial interests.
FUNDING INFORMATION
This work was supported in part by the U.S. Department of Agriculture (USDA) Agricultural Research Service (ARS) (project number 5030-32000-231-000-D, 5030-32000-231-095-S, and 5030-32000-231-103-A); the USDA-ARS Research Participation Program of the Oak Ridge Institute for Science and Education (ORISE) through an interagency agreement between the U.S. Department of Energy and USDA-ARS (contract number DE-AC05-06OR23100); and a grant from the National Science Center of Poland 2017/27/B/ST6/02720. The funders had no role in study design, data collection and interpretation, or the decision to submit the work for publication. USDA is an equal opportunity provider and employer.