
Abstract
Although many user-friendly workflows exist for identifications of peptides and proteins in mass-spectrometry-based proteomics, there is a need of easy to use, fast, and accurate workflows for identifications of microorganisms, antimicrobial resistant proteins, and biomass estimation. Identification of microorganisms is a computationally demanding task that requires querying thousands of MS/MS spectra in a database containing thousands to tens of thousands of microorganisms. Existing software can't handle such a task in a time efficient manner, taking hours to process a single MS/MS experiment. Another paramount factor to consider is the necessity of accurate statistical significance to properly control the proportion of false discoveries among the identified microorganisms, and antimicrobial-resistant proteins, and to provide robust biomass estimation. Recently, we have developed Microorganism Classification and Identification (MiCId) workflow that assigns accurate statistical significance to identified microorganisms, antimicrobial-resistant proteins, and biomass estimation. MiCId's workflow is also computationally efficient, taking about 6–17 minutes to process a tandem mass-spectrometry (MS/MS) experiment using computer resources that are available in most laptop and desktop computers, making it a portable workflow. To make data analysis accessible to a broader range of users, beyond users familiar with the Linux environment, we have developed a graphical user interface (GUI) for MiCId's workflow. The GUI brings to users all the functionality of MiCId's workflow in a friendly interface along with tools for data analysis, visualization, and to export results.
INTRODUCTION
Tandem mass-spectrometry-based proteomics is a useful tool for fast and accurate identifications of microorganisms and antibiotic resistant (AR) proteins, and estimation of sample's microorganismal-biomass composition. Fast and accurate identification/diagnosis of pathogenic bacteria along with the identification of AR proteins; hence, proper antibiotic treatment is among the most important to fight infections, to reduce the spread of antibiotic resistance, and to increase patients' survival rate (Tian et al., 2019). Obtaining trustworthy biomass estimates on the other hand are essential for microbial community structure analyses that arise in almost every microbiome study (Cani, 2018; Franzosa et al., 2015). Consequently, versatile tandem mass spectrometry-based proteomics data analysis software and pipelines that are easy to use, fast, accurate, and capable of performing identifications of microorganisms, AR proteins, and biomass estimation are welcome (Beyter et al., 2018). For this purpose, we have developed Microorganism Classification and Identification (MiCId)'s workflow.
MiCId's workflow can perform identifications of microorganisms, AR proteins, and biomass estimation in about 6–17 minutes using computer resources that are available in most laptop and desktop computers. MiCId's workflow has been extensively tested; it was shown to compute accurate microorganismal-biomass and statistical significance, E-values, to identified microorganisms and AR proteins. When employing the recommended E-value cutoff of 0.01, it has a recall of 95% at the species level identification with the proportion of false discoveries controlled below 5%. In terms of AR protein identification, MiCId's workflow has a sensitivity value around 85% (with a lower bound at about 72%) and a precision greater than 95% in identifying antibiotic resistance proteins (Alves and Yu, 2020; Alves et al., 2022; Alves et al., 2018; Kondori et al., 2021). The graphical user interface (GUI) brings to users all the functionality of MiCId's workflow in an easy-to-use interface along with several tools. Here we will briefly introduce MiCId's GUI and we provide detailed instructions on how to use it in the user's manual available with the GUI.
MICID'S GUI ARCHITECTURE
MiCId's workflow has three functional layers, as displayed in Figure 1. The interface layer includes executable files that create databases and process tandem mass-spectrometry (MS/MS) spectra files. The data processing layer includes MiCId (Alves et al., 2022), RAId (Alves et al., 2007), and BLAST (Altschul et al., 1990) programs that have been implemented using C++ 17 programming language to optimize execution time. The visualization layer includes C/C++ and Perl (version 5.16.3) servicing scripts. The interface and visualization layers of the GUI are coded using Eclipse (Eclipse Foundation) Java Integrated Development Environment (IDE). The Java libraries used are the standard java.awt and the javax.swing provided by Oracle (JavaTM Platform Standard Ed. 7), and three class libraries downloaded from the Git repository: JFreeChart (https://github.com/jfree/jfreechart) for generating charts, iText 5 (https://github.com/itext/itextpdf) for generating PDF files, and hierarchical-clustering-java (https://github.com/lbehnke/hierarchical-clustering-java repository) for generating dendrograms. MiCId's GUI was tested under (1) Windows 10 Enterprise, (2) CentOS Linux release 7.9.2009, (3) Red Hat Enterprise Linux Server release 7.9, and (4) Ubuntu release 18.04.3.
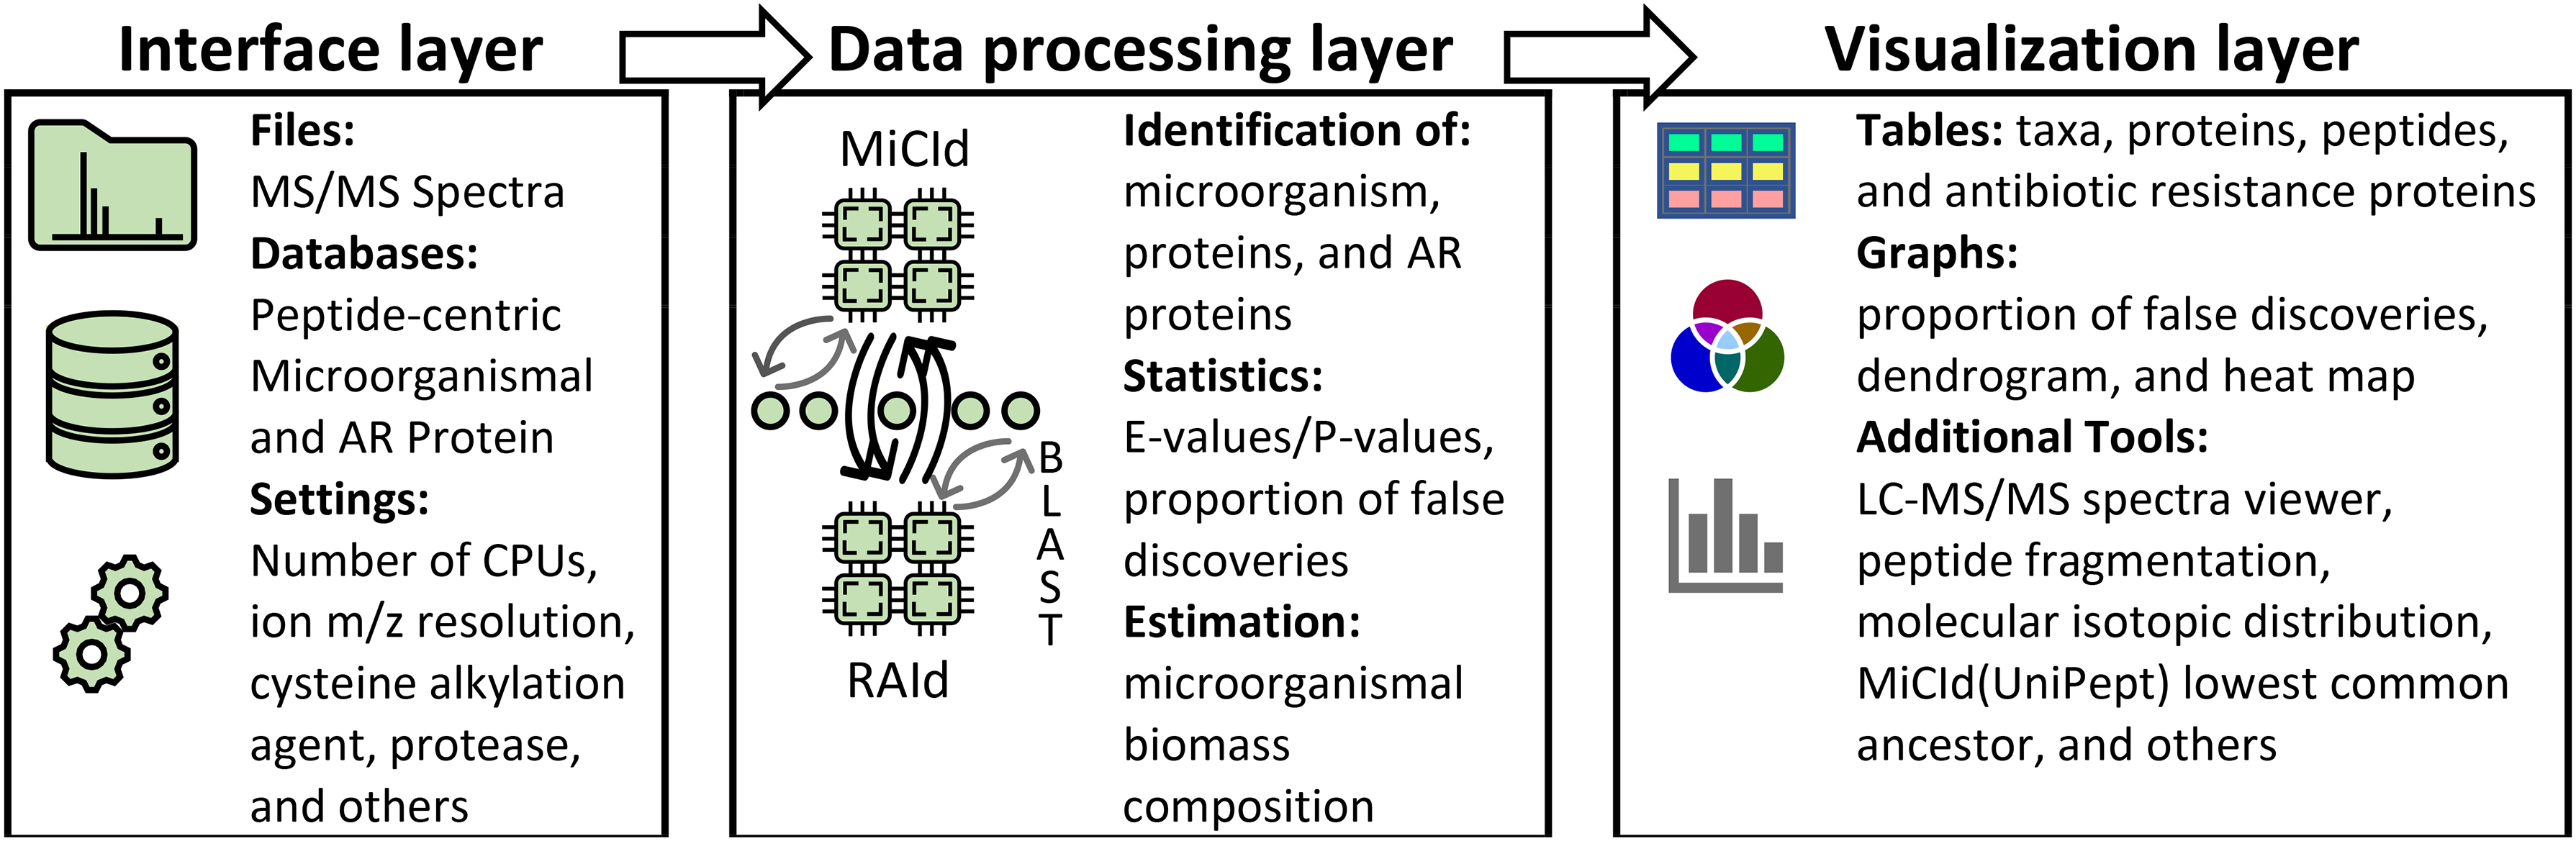
MiCId's GUI three function layers. The interface layer includes executable files that create databases, processes MS/MS spectra files, and initializes query parameters. The data processing layer is where all the work gets done; it includes the MiCId, RAId, BLAST programs, and a few scripts to process data and communicate between programs. The visualization layer provides tools for data analysis and visualization with the option of exporting figures and tables. GUI, graphical user interface; MiCId, Microorganism Classification and Identification; MS/MS, tandem mass-spectrometry.
Once the GUI is installed, it offers user the choice of testing MiCId's workflow via the Test tab; instructions on how to use the GUI is also available to users via the User Guide tab. Both tabs are located under the MiCId tab in the main interface.
The first step is to create a microorganismal database and an antibiotic resistance protein database. To create a microorganismal database, the user needs to specify the taxonomy identifier of taxa to be included in the database using the Create organismal database tab. Taxonomy identifier used are taken from the National Center for Biotechnology Information (NCBI) database. MiCId GUI will then automatically download the protein sequences of all the taxa specified from the NCBI database along with taxonomical information and construct a microorganismal database. For the AR protein database, users can select from the Create AMR database tab among three established AR databases: the Comprehensive Antibiotic Resistance Database (CARD), Resfinder, and the National Database of Antibiotic Resistant Organisms (NDARO), or using their own customized AR protein database in a FASTA file. The second step is to specify a single or multiple experimental MS/MS files. MiCId GUI accepts MS/MS files of the following types: mzML, mzXML, mgf, and Thermo Scientific RAW. The third step is to set up query parameters such as number of logical cores, protease, cysteine reducing agent, taxa selection, precursor-ion and product-ion resolutions, and so on. The final step is to press the Submit job button and the code within the GUI and MiCId's workflow will perform the identification of microorganisms, identification of proteins, identification of AR proteins, and estimation of sample microorganismal-biomass composition, all with a single command without further user interventions.
New submitted jobs can be monitored and controlled by the user using the submitted jobs monitoring queue viewer, which allows users to check the status of submitted jobs, cancel, remove, restart, view completed job results, and more. For reproducibility and record-keeping, the GUI offers a Save Settings tab that will save all the settings used to execute a specific job and it creates a log file containing detailed information for each submitted job.
The GUI has the functionality for data plotting, visualizing results, and exporting tables and figures for publications. It also includes MS/MS and MS spectra viewers and several tools for computing and studying peptide fragmentation, peptide/protein isotopic distributions (Alves et al., 2014), lowest common ancestor algorithm for proteotyping biomarker designing, etc.
SOFTWARE AVAILABILITY
MiCId's GUI version (v.11.11.2021) is freely available at https://www.ncbi.nlm.nih.gov/CBBresearch/Yu/downloads.html
Footnotes
AUTHOR DISCLOSURE STATEMENT
The authors declare they have no conflicting financial interests.
FUNDING INFORMATION
This work was supported by the Intramural Research Program of the National Library of Medicine. Funding for Open Access publication charges for this article was provided by the National Institutes of Health, grant no. ZIALM32404.