
Abstract
Gene expression evolution is typically modeled with the stochastic Ornstein-Uhlenbeck (OU) process. It has been suggested that the estimation of within-species variations using replicated data can increase the predictive power of such models, but this hypothesis has not been fully tested. We developed EvoGeneX, a computationally efficient implementation of the OU-based method that models within-species variation. Using extensive simulations, we show that modeling within-species variations and appropriate selection of species improve the performance of the model. Further, to facilitate a comparative analysis of expression evolution, we introduce a formal measure of evolutionary expression divergence for a group of genes using the rate and the asymptotic level of divergence. With these tools in hand, we performed the first-ever analysis of the evolution of gene expression across different body-parts, species, and sexes of the Drosophila genus. We observed that genes with adaptive expression evolution tend to be body-part specific, whereas the genes with constrained evolution tend to be shared across body-parts. Among the neutrally evolving gene expression patterns, gonads in both sexes have higher expression divergence relative to other tissues and the male gonads have even higher divergence than the female gonads. Among the evolutionarily constrained genes, the gonads show different divergence patterns, where the male gonads, and not the female gonads, show less constrained divergence than other body-parts. Finally, we show interesting examples of adaptive expression evolution, including adaptation of odor binding proteins.
INTRODUCTION
Studies of species evolution typically focus on the evolution of DNA sequence. However, in complex multi-cellular organisms, all cells utilize the same genetic information, yet they show remarkable phenotypic differences arising from distinct transcriptional programs executed in different organs, tissues, and cells. Although evolution ultimately acts at the level of the successful reproduction of individuals, divergent transcriptional programs within the individual are subject to evolutionary adaptation, constraint, and drift. Evolutionary analysis of gene expression can, thus, shed light on the evolutionary processes in ways that cannot be achieved by the analyses of sequence alone, and can provide a richer understanding of evolution.
Currently, our understanding of the interplay between species evolution and tissue-specific expression evolution is still limited. The results of initial analyses of gene expression evolution have not provided a clear picture of the dominant forces. For example, early studies of the evolution of primate gene expression suggested that expression evolution is largely consistent with the neutral theory of evolution (Khaitovich et al., 2004, 2005) whereas subsequent analyses uncovered signatures of positive selection in the brain (Khaitovich et al., 2006b) and testis (Khaitovich et al., 2006a).
In the past decade, several gene expression datasets encompassing a larger number of species have been collected and analyzed [mammals (Brawand et al., 2011; Romero et al., 2012; Chen et al., 2019), vertebrates (Chan et al., 2009), primates (Blekhman et al., 2008)]. Studies in mammals indicated that, when restricted to individual tissues or organs, gene expression evolution tends to follow the species tree fairly closely (Chen et al., 2019). However, multi-tissue samples generally clustered first by tissues rather than by species (or study) (Chan et al., 2009; Brawand et al., 2011; Breschi et al., 2016; Chen et al., 2019), suggesting strong evolutionary constraints on tissue-/organ-specific gene expression. However, a recent study identified sets of gene expression levels that cluster first by species (Breschi et al., 2016). Finally, sex-biased expression also imposes constraints on evolution (Meiklejohn et al., 2003). However, the nature of constraints imposed by combination of tissue and sex specificity is less clear. In addition, tissue- and sex-specific studies of gene expression adaptation are very limited.
Recently, we collected a large dataset of body-part and sex-specific gene expression focusing on the Drosophila phylogeny (Yang et al., 2018). We use these data along with new computational tools developed in this study, to examine modes of gene expression evolution of Drosophila genus in the context of body-parts, sex, and species groups.
Following the pioneering work of Felsenstein (1973), neutral evolution of continuous traits, such as gene expression, is formally modeled by Brownian Motion (BM). Along a similar line of thought, Lande (1976) pioneered the use of the Ornstein-Uhlenbeck (OU) process to model evolutionary constraint and adaptive evolution of continuous traits. The OU process is stochastic and extends the BM model by adding an “attraction force” toward an optimum value. Combining the OU process on gene expression with the information about the underlining evolutionary tree (obtained, e.g., from sequence analysis) allows modeling the differences in evolution along individual branches and, thus, helps uncover branch-specific adaptation (Hansen, 1997; Butler and King, 2004; Brawand et al., 2011; Chen et al., 2019).
Phylogenetically diverse gene expression datasets that span many organisms across the tree of life and include expression data on multiple tissues/organs have challenged us to put these theoretical models into practical use. For example, several recent works used stochastic models to study evolution of gene expression (Bedford and Hartl, 2009; Kalinka et al., 2010; Brawand et al., 2011; Nourmohammad et al., 2017; Chen et al., 2019). Unfortunately, these formal stochastic models for continuously varying phenotypic traits usually do not account for within-species variation. It has been long suggested that ignoring within-species variation might bias the results in comparative data analysis (Ives et al., 2007; Felsenstein, 2008; Rohlfs et al., 2014).
In line with this assumption, within-species variation was considered in the initial analysis of mammalian gene expression (Brawand et al., 2011). However, early simulations failed to confirm the expectation that within-species variations help in differentiating between neutral and constrained evolution (Rohlfs et al., 2014). Therefore, providing a better understanding of the benefits and limitation of both models is of paramount importance.
Our contributions here are threefold. First, given the earlier conflicting results and having in mind the need to facilitate future analyses of gene expression evolution, we developed EvoGeneX, a computationally efficient implementation of the OU process-based model of gene expression evolution for a given set of species under the assumption that for each species, expression data from several individual organisms are available. Using detailed simulations, we demonstrated the advantages and limitations of such an extended model.
Specifically, we show that by modeling the within-species diversity EvoGeneX improves over the model that averages replicates implemented by program OUCH (King and Butler, 2009) that is currently accepted as the basic framework for gene expression evolution (Chen et al., 2019). Further, previous studies suggested that the performance of the OU-based methods can depend on the size of the evolutionary tree (Rohlfs et al., 2014; Catalán et al., 2019), suggesting, in particular, that the OU model can require a tree of at least 50 nodes (Catalán et al., 2019).
However, these analyses have not separated the impact of the number of nodes from the influence of the evolutionary distances to the root. Our extensive simulations provide a window on this question clarifying previous misunderstandings. These results demonstrate that selecting the species with larger evolutionary distances is more important than the number of selected species. At the same time, thanks to our efficient Maximum Likelihood estimation, EvoGeneX is very efficient, despite the increased size of data and the number of parameters to be optimized.
Next, to facilitate comparative analysis of the dynamics of gene expression evolution between organs and sexes, we introduce a formal approach based on Michaelis-Menten kinetics (Michaelis and Menten, 1913) from the enzyme kinetics theory, to measure the dynamics of evolutionary divergence of a group of genes in terms of the group's asymptotic divergence level and rate to reach the asymptotic level.
Finally, we used EvoGeneX, along with other methods we developed in this study, to perform the first ever analysis of organ- and sex-specific gene expression evolution in Drosophila. Specifically, we applied EvoGeneX to provide a comparative analysis of gene expression evolution based on a dataset encompassing five different body-parts (head, gonads, thorax, viscera, and abdomen), from carefully selected representatives of the Drosophila genus (both male and female) collected for the purpose of this study.
For each of the 10 total sample types, gene expression was measured by RNA-seq in 4 biological replicates (Yang et al., 2018). The genus Drosophila is particularly well suited for studying gene expression evolution. The last common ancestor of the genus is assumed to date to the Cretaceous period about 112 ± 28 million years ago (Wheat and Wahlberg, 2013). The Drosophila species occupy diverse geographic locations and ecological niches (Morales-Hojas and Vieira, 2012). Compared with the previous studies in mammals (Brawand et al., 2011; Chen et al., 2019) and vertebrates (Chan et al., 2009), the morphology of the Drosophila species is similar while at the same time the evolutionary distances are significantly larger relative to mammals or even vertebrates typically included in such studies. This makes Drosophila an ideal phylogeny to study the interplay among different modes of gene expression evolution.
Our analysis demonstrated that, in Drosophila, constrained evolution of gene expression is more common than neutral evolution; however, neutral evolution of gene expression cannot be rejected in a very large fraction of the genes. We found that the expression of many genes is evolutionary constrained in multiple body-parts. However, not all genes follow this pattern and have different evolutionary trends depending on where they are expressed. To gain further understanding of variations in evolutionary dynamics between organs and sexes, our Michaelis-Menten kinetics-based approach revealed striking differences in evolutionary dynamics of gene expression in male and female gonads, for example.
We also provide analysis of adaptive expression evolution at the subgenus level. We show that although the property of constrained evolution of the expression of specific genes is often shared across many organs, in contrast, adaptive evolution tends to be body-part specific.
Previous studies in mammals (Chen et al., 2019) observed that gene expression evolution in testis is least constrained among the organs analyzed by these studies. However, no analysis of female gonads has been performed earlier. We found that, among the genes with neutrally evolving gene expression, gonads in general evolve the fastest, whereas male gonads evolve even faster than female gonads. In addition, we show that male and female gonads also have the largest sets of unique adaptive gene expression levels.
Finally, EvoGeneX revealed compelling and interesting examples of adaptive evolution of gene expression in the Sophophora/Drosophila branches of the phylogeny.
RESULTS AND DISCUSSION
Formal description of OU-based gene expression models and high-level overview of EvoGeneX
Given a gene with one-to-one orthology relation across a set of species, the species tree, and expression values of the gene measured in multiple biological replicates for each species, our goal is to uncover the most likely scenario for the gene expression evolution. The three basic modes of evolution considered in this study are: (i) neutral evolution, (ii) constrained evolution (purifying/stabilizing selection) where the evolution of gene expression is biased against divergence from some optimum value, and (iii) adaptive evolution where the expression in different groups of species is biased toward different optimum values.
In this study, we use biological replicates to model within-species variations (Supplementary Figs. S3, S4, and S6; Supplementary Table S1). Although the animals used in biological replicates are isogenic, even between genetically identical multi-cellular organisms, such as Drosophila, there are significant individual-to-individual expression variations (Lin et al., 2016; Lee et al., 2018) often comparable to the expression variation between different laboratory strains of the same species (Supplementary Fig. S5).
Following standard practice, we assume that the evolution of gene expression follows a stochastic process. In particular, we assume that neutral evolution follows BM—a special case of the more general mean-reverting OU process—the broadly accepted model for the evolution of continuous traits such as gene expression (Hansen, 1997; Butler and King, 2004; Bedford and Hartl, 2009; King and Butler, 2009; Brawand et al., 2011; Chen et al., 2019). This model assumes that gene expression follows a stochastic process that is “attracted” toward some optimum value. The strength of the bias is modeled as a constant α. The optimum value to which the process is attracted is allowed to change over the evolutionary time, reflecting changes in environmental or other constraints acting on the trait.
Assuming neutral evolution as a null model, our goal is to use a hypothesis testing framework to uncover alternative modes of gene expression evolution. Toward this end we developed EvoGeneX, a mathematical framework to estimate the parameters of the process given the data. To account for the within-species variability, we assume that for each species i, there are several observations reflecting the within-species variability of the trait of interest (here expression of a specific gene). Denoting the value of the kth observation of the trait for species i by
where Ti is the evolutionary time from the least common ancestor of all species in this tree to species i. Further, for
where
In Equation (6), the term
Finally,
Given this general framework, we use hypothesis testing (Fig. 1d) to differentiate among the following evolutionary models: (i) neutral evolution:
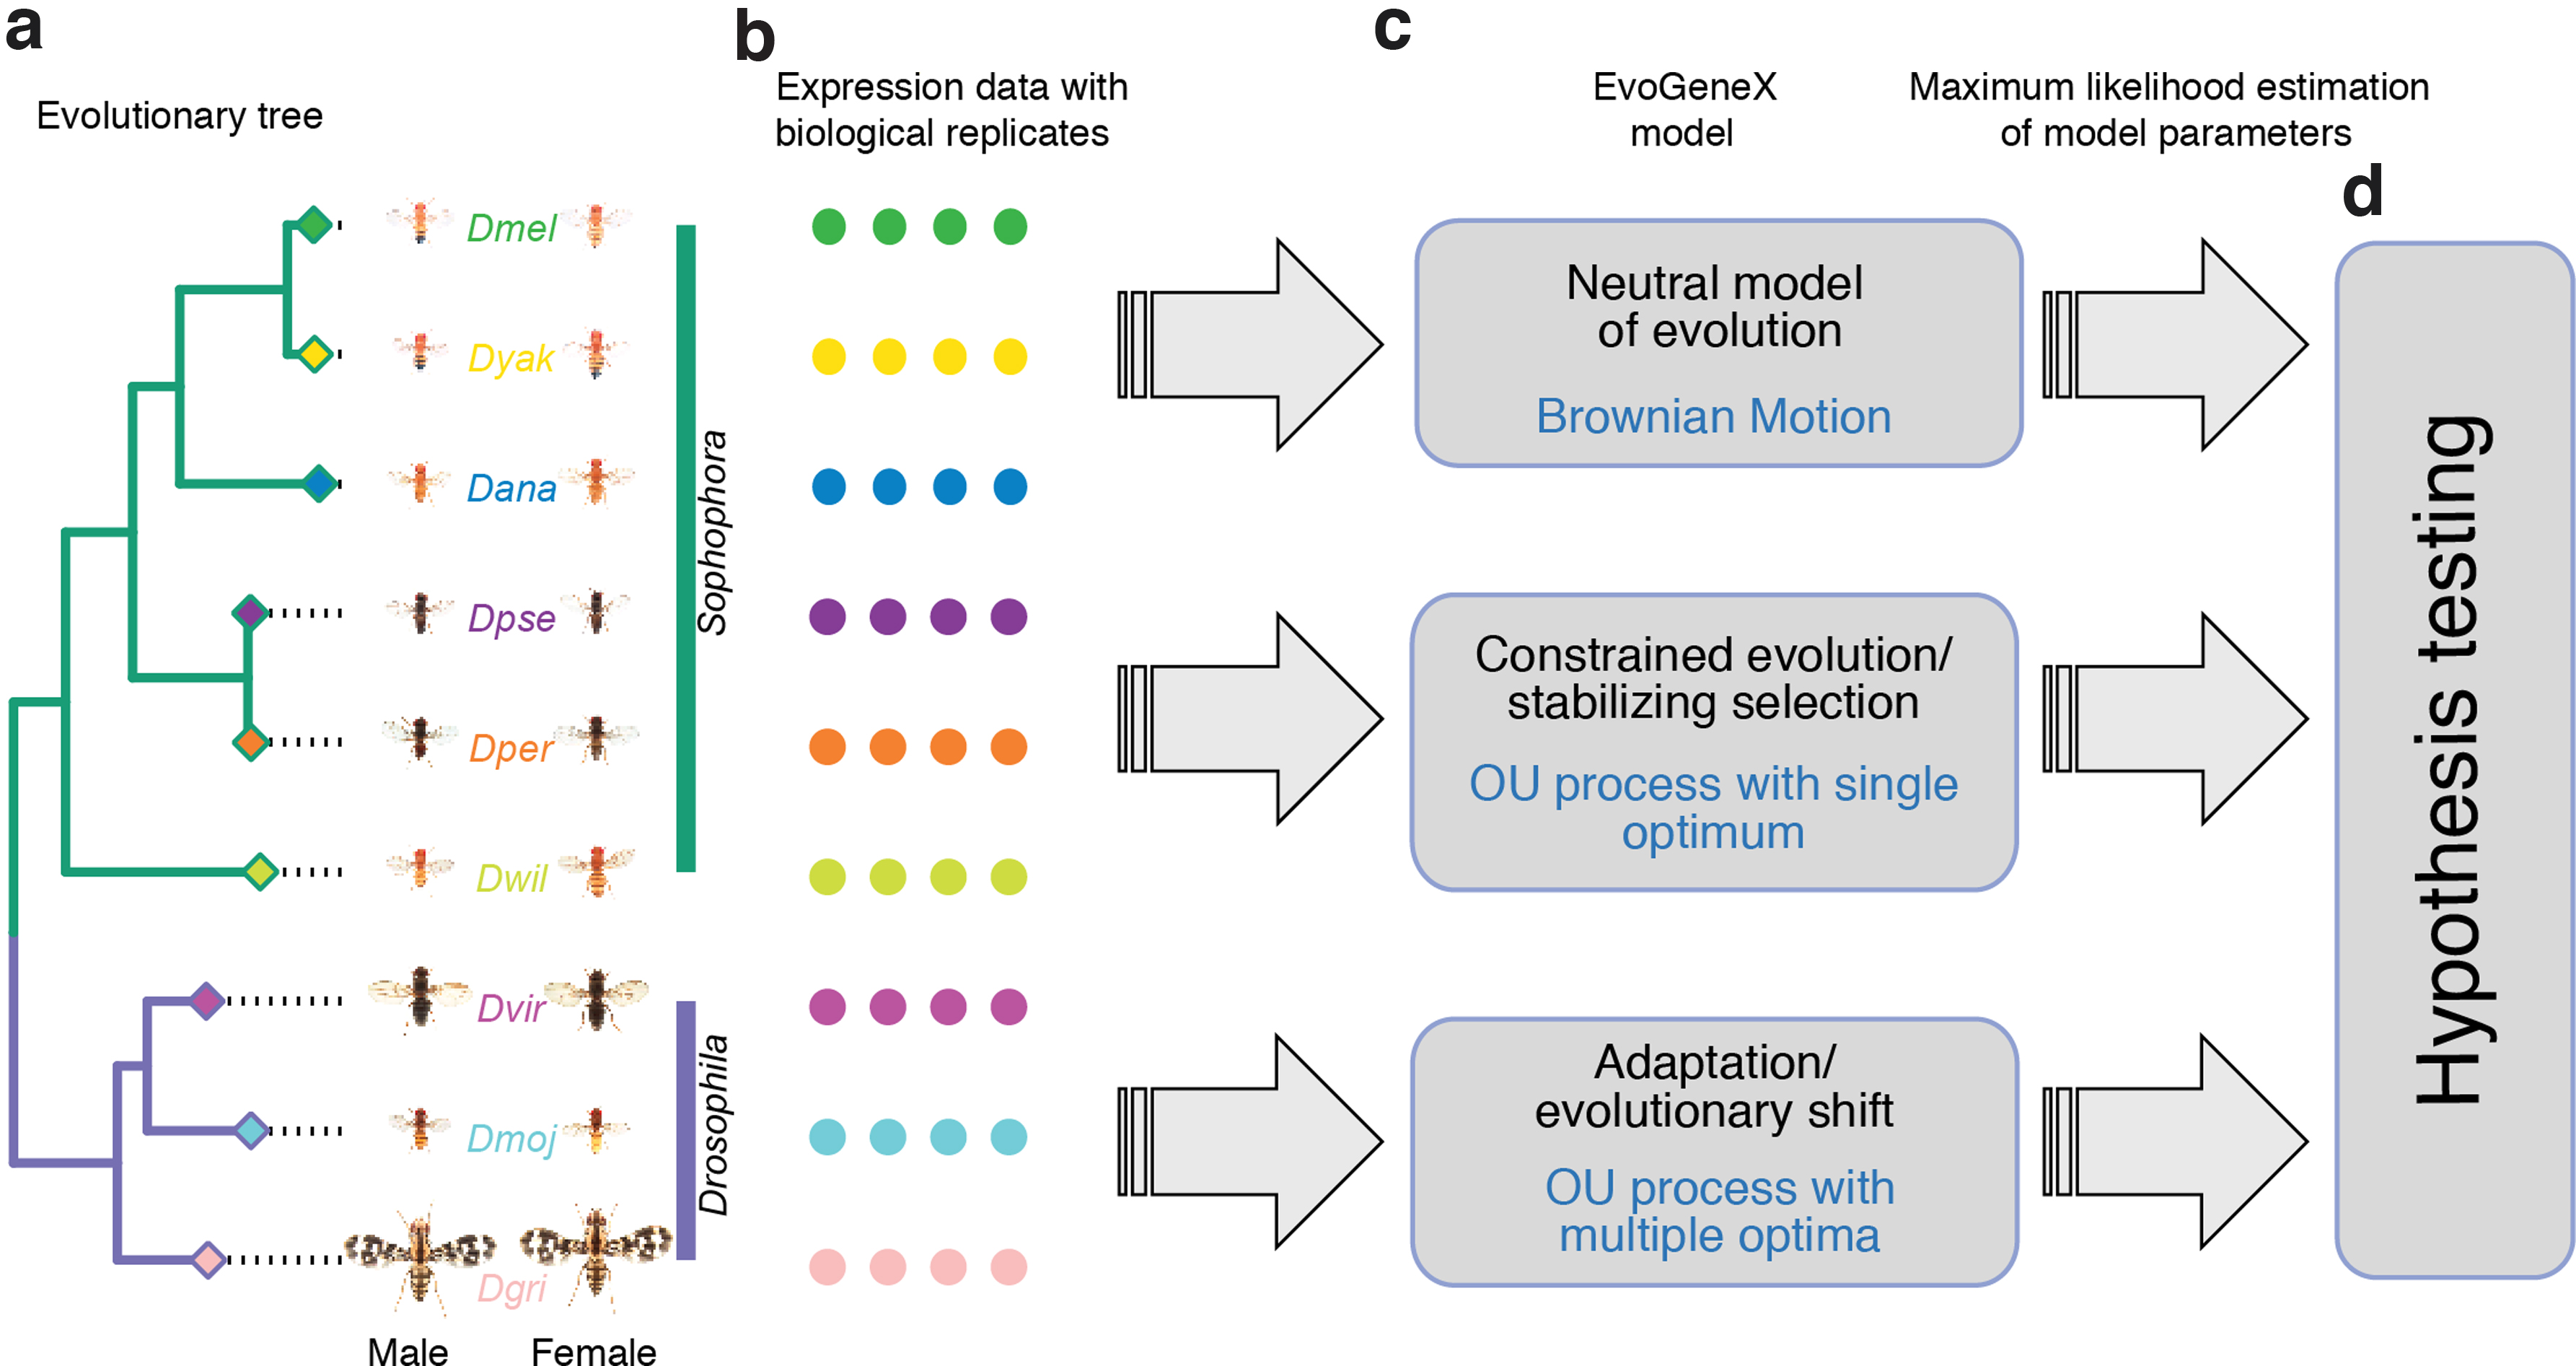
Workflow diagram. EvoGeneX takes as input an evolutionary tree (including evolutionary distances as branch lengths)
We use simulations to compare the performance of two competing models: a model that includes within-species expression variability versus a model that averages samples from the same species assuming that more than one sample is available. The former approach is implemented by our new EvoGeneX software, whereas the latter is implemented by OUCH (King and Butler, 2009)—currently the most popular software implementing an OU-based approach (Hansen, 1997; Butler and King, 2004; Bedford and Hartl, 2009; Chen et al., 2019).
We simulated expression values for 1000 genes using the stochastic differential Equations (2) and (3) governing our OU-based model of gene expression evolution on phylogenetic trees, for each setting of the parameters
In addition, we include simulation with varying tree sizes and number of replicates as described next. In all of our simulations we set the expression level at the root (the most recent common ancestor of all the species) at
In the neutral mode of evolution, the rate of attraction to the optimal value in the OU process,α, is set to 0 making the gene expression evolve as BM only. In the constrained mode of evolution, α of the OU process is positive and all nodes in the phylogenetic tree have the same optimum expression level. In our simulations, α is varied as
To ensure an optimal performance of OUCH (King and Butler, 2009) in our evaluation, we let OUCH use the mean expression of simulated replicates and we refer to this model as OUCH.AV. Both methods, EvoGeneX and OUCH.AV, are evaluated as classifiers distinguishing (i) genes with constrained expression evolution from the genes with neutrally evolving expression, and (ii) genes with adaptive expression evolution from the genes with nonadaptive expression evolution.
In both cases, we use a variant of the area under precision recall curve metric that we call auPRC R and is defined as the area under the part of auPRC curve for the recall value at most R, normalized so that maximum auPRC R value is 1. This allows us to summarize how the precision changes as recall increases. Note that auPRC1 is the standard auPRC. We note that OUCH software can also be used to test for simultaneous selection of multiple traits by modeling those traits as a multivariate trait.
We asked whether such a model can be used to account for multiple replicates by modeling the expression of the replicates for a given gene as a multivariate trait. However, we found that such an approach produced results hardly better than a random method in all of our test settings (Supplementary Section S4 and Supplementary Fig. S18).
Constrained evolution
Figure 2a shows the auPRC
R
of the two methods under the cutoff values
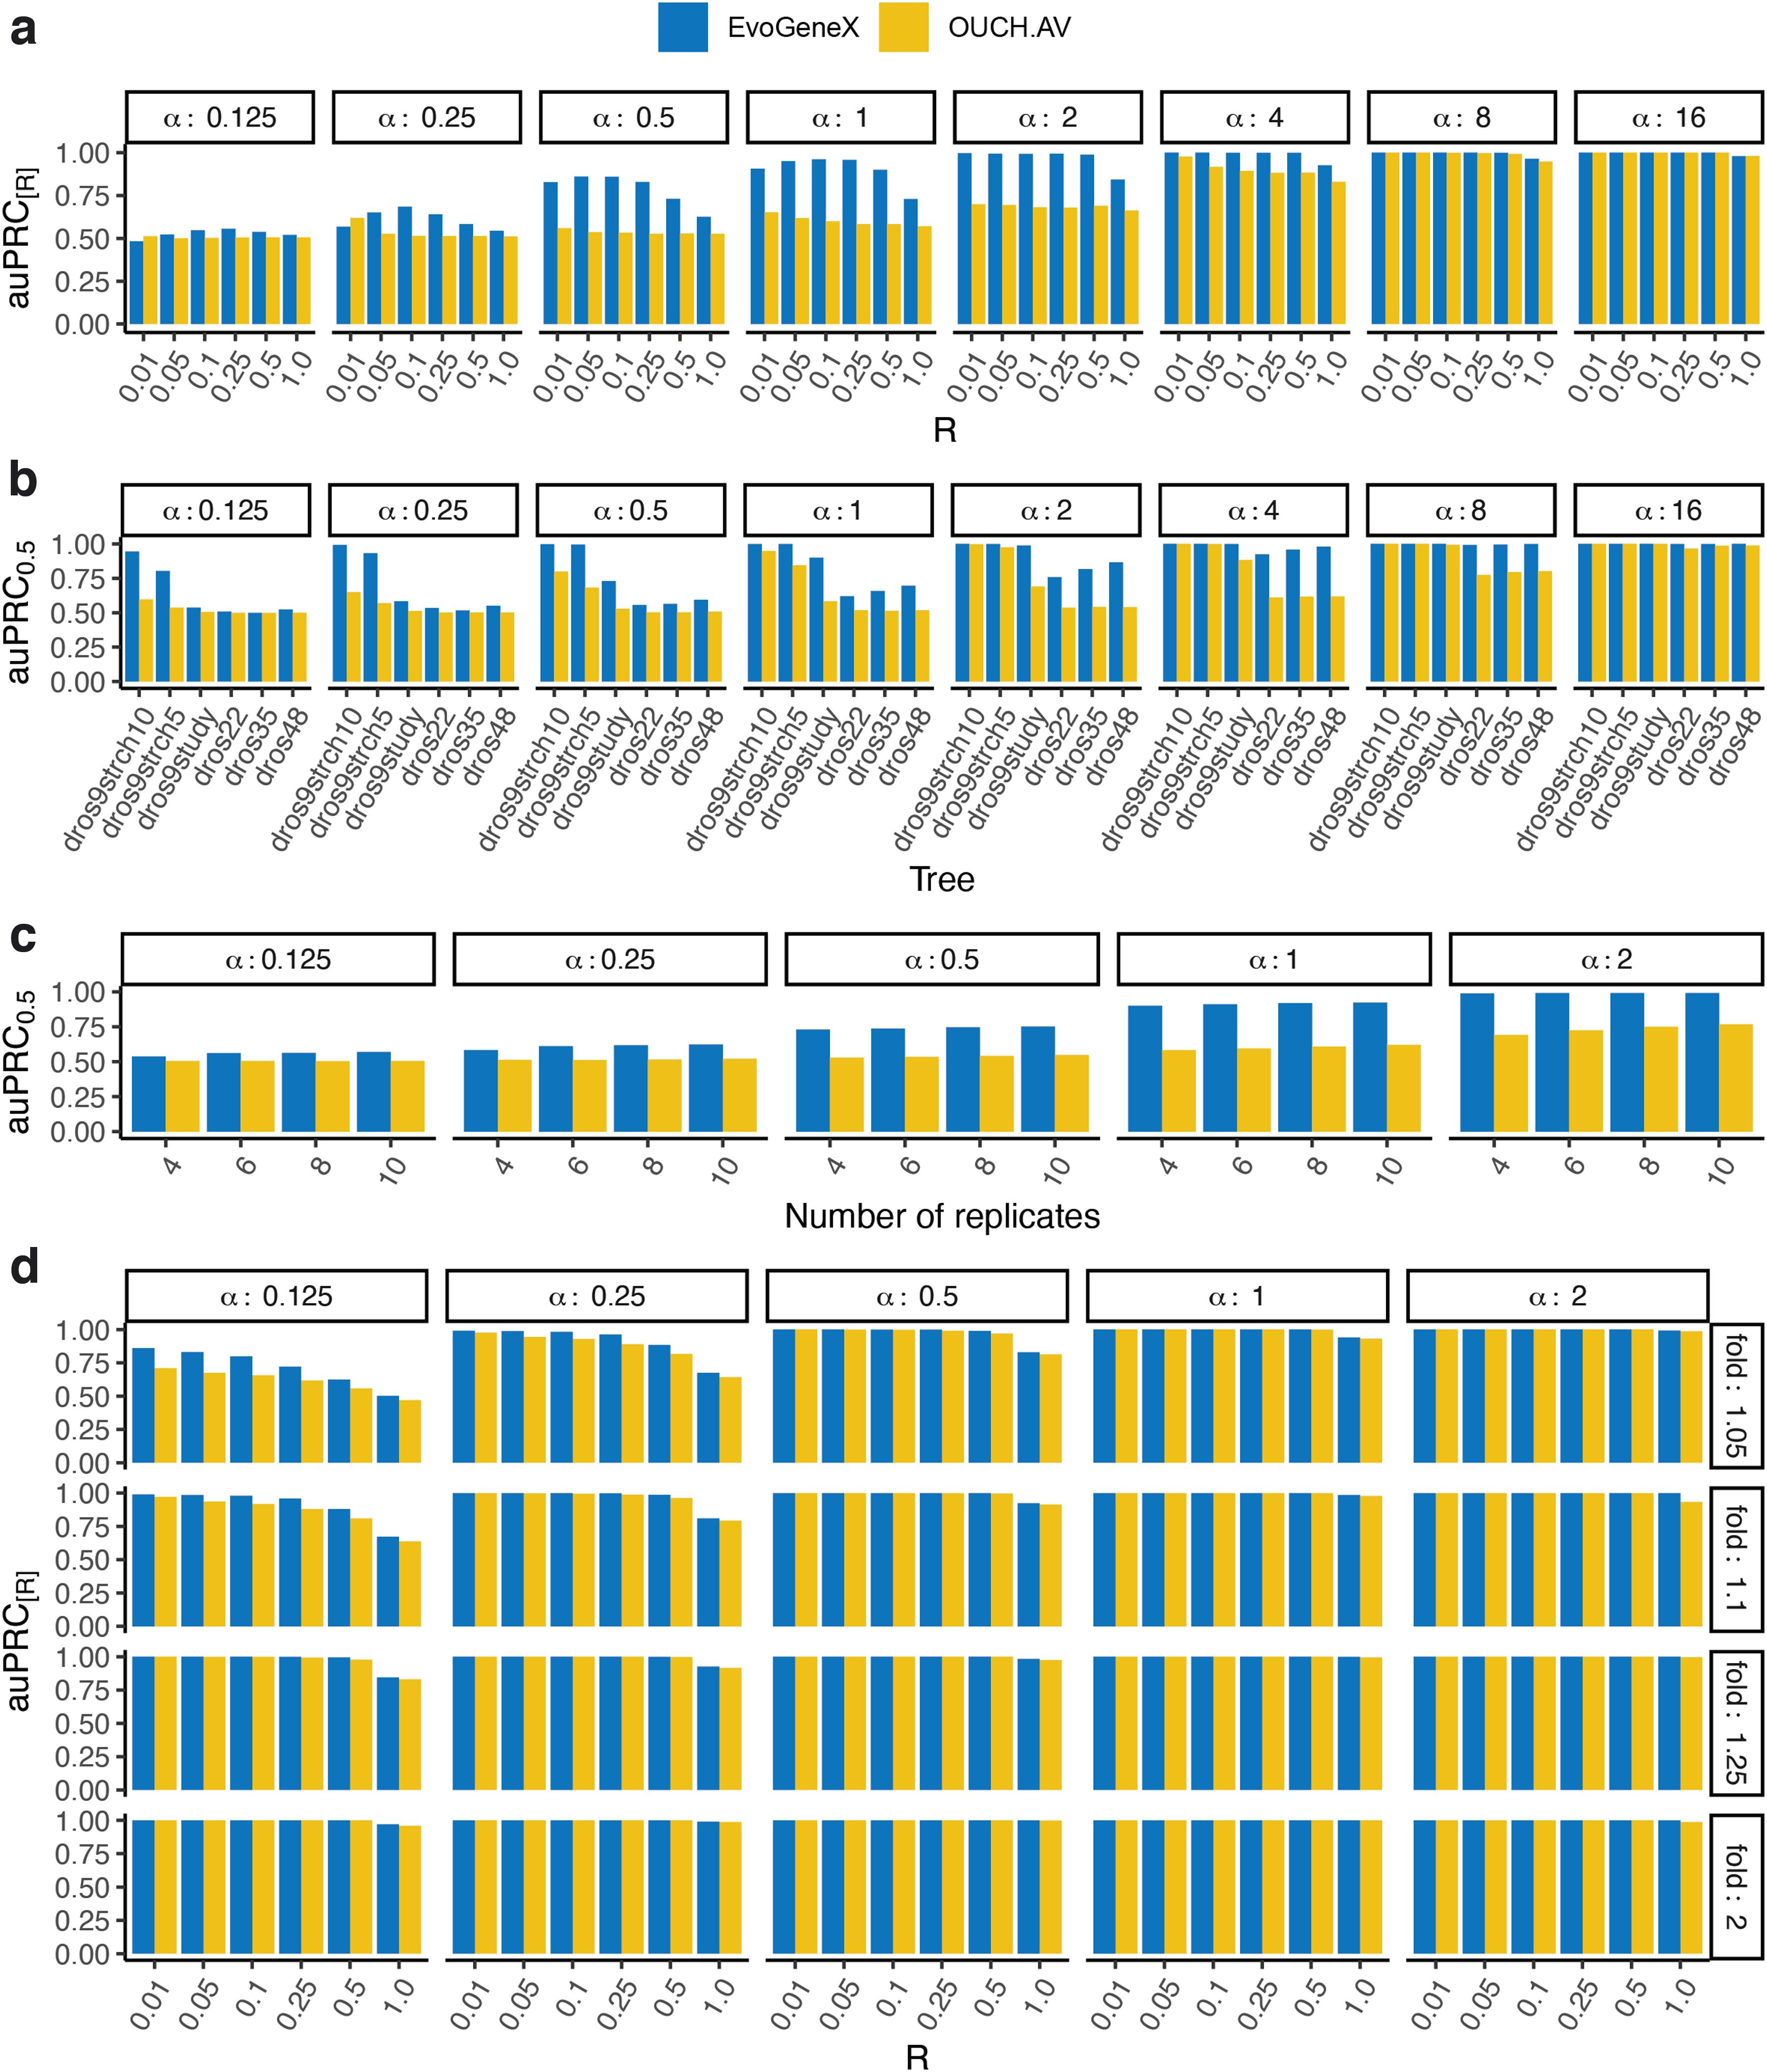
Performance of the methods on simulated data. Shown are values of auPRC at recall cut-off R. That is, auPRC
R
is the area under the auPRC curve for the recall value at most R, normalized so that maximum auPRC
R
value is 1. Each panel corresponds to different parameters of the simulation given within the white boxes.
Next, to understand the role of the number of species and evolutionary distances for the performance of the methods, we preformed simulations using trees with different number of species and evolutionary distances (branch lengths). First, starting from our initial nine-species tree dros9study, we obtained two trees by increasing the length of all edges by factors 5 and 10, respectively (trees: dros9strch5, dros9strch10). In addition, we included a large 48 species phylogeny (dros48) from Longdon et al. (2015). Despite a larger number of species in dros48, the evolutionary distances from the root to the leaves are smaller compared with dros9study.
We randomly extracted from it subtrees of 22 (dros22) and 35 (dros35) species. The methods had a better performance on the tree with larger distances even when the number of species was significantly smaller (Fig. 2b and Supplementary Figs. S18–S20). Adding more species while preserving the evolutionary distance to the root improves the performance of EvoGeneX but not OUCH (Fig. 2b and Supplementary Figs. S21–S23). These results demonstrate that the distribution of species on evolutionary tree is more important than the number of the species.
Surprisingly, including a larger number of biological replicates had a modest impact on EvoGeneX but benefits OUCH, suggesting that using EvoGeneX is particularly helpful when the number of biological replicates is small and estimated averages might be noisy (Fig. 2c and Supplementary Figs. S24 and S25).
Overall, our simulations demonstrate the advantage of a model that accounts for within-species variation. This outcome was expected and even assumed by some studies (Chen et al., 2019) but, surprisingly, it was not observed in previous simulations (Rohlfs et al., 2014). To understand the possible reason behind the discrepancy, we relaxed the constraints imposed by the assumption that within-species variation should be no bigger than between-species variation. We found that OUCH performs better in some settings where this assumption is strongly violated (Supplementary Figs. S12–S17). However, within-species variation is unlikely to be larger than between-species variation; thus, increased OUCH performance in those settings is not particularly useful.
In the adaptive mode of evolution, we first considered the two-regime scenario where the two sub-genera Sophophora and Drosophila are assumed to converge toward two different optimal expression levels. Previous studies indicate that OUCH-like models can detect adaptive evolution if the separation between optimal values for each regime is large (Cressler et al., 2015). Thus for the simulation of adaptive evolution, we also varied an extra parameter fold, the ratio of the optimum OU level in the Drosophila subgenus to that in Sophophora subgenus, as
The scenarios for the two fold values 0.5 and 2 are symmetric to each other, so for 0.8, 1.25, and so on. Figure 2d shows the auPRC R of the two methods for the fold values greater than 1. Both the methods are able to correctly detect the adaptive genes when the separation between two optima is larger due to a relatively large fold or α; however, EvoGeneX works better for the harder cases when both fold and α are low. Supplementary Figure S26 shows the same plots with similar trends for all fold values that we tested. Simulations using a larger tree form (Longdon et al., 2015) yielded similar results (Supplementary Figs. S9–S11 and S27–S31).
Overall, EvoGeneX achieves better auPRC in detecting constrained and adaptive genes, especially in the more difficult cases when selection/adaptation is not very strong. In addition, despite the need of estimating an additional parameter and considering larger input data, with more complex relations between them, EvoGeneX is only about twofold slower than OUCH to infer from four replicates (Supplementary Section S4.3 and Supplementary Fig. S32). Further, EvoGeneX scales well with the number of species in the tree and/or the number of replicates (Supplementary Figs. S33 and S34).
Stabilising selection and neutral gene expression evolution in Drosophila
In this study, we used expression data (Yang et al., 2018) from nine Drosophila species (Fig. 1a): Drosophila melanogaster, Drosophila yakuba, Drosophila ananassae, Drosophila pseudoobscura, Drosophila persimilis, Drosophila willistoni, Drosophila virilis, Drosophila mojavensis, and Drosophila grimshawi across both sexes and dissected into five body-parts: head, gonads, thorax, viscera, and abdomen (Supplementary Fig. S2 for an illustrative cartoon of the tissues) and a set of 8591 genes with one-to-one orthology in each species as determined in Yang et al. (2018) using multiple evidences.
Given the large evolutionary distances within the Drosophila genus, we first asked whether the main observations about tissue-specific gene expression in mammals, where the distances are smaller, also hold for Drosophila. In particular, it has been observed that when the expression data across different tissues are clustered together the samples cluster first by tissue (Brawand et al., 2011; Chan et al., 2009; Sudmant et al., 2015; Chen et al., 2019). We found that this observation also holds for Drosophila (Fig. 3a) with one interesting caveat.
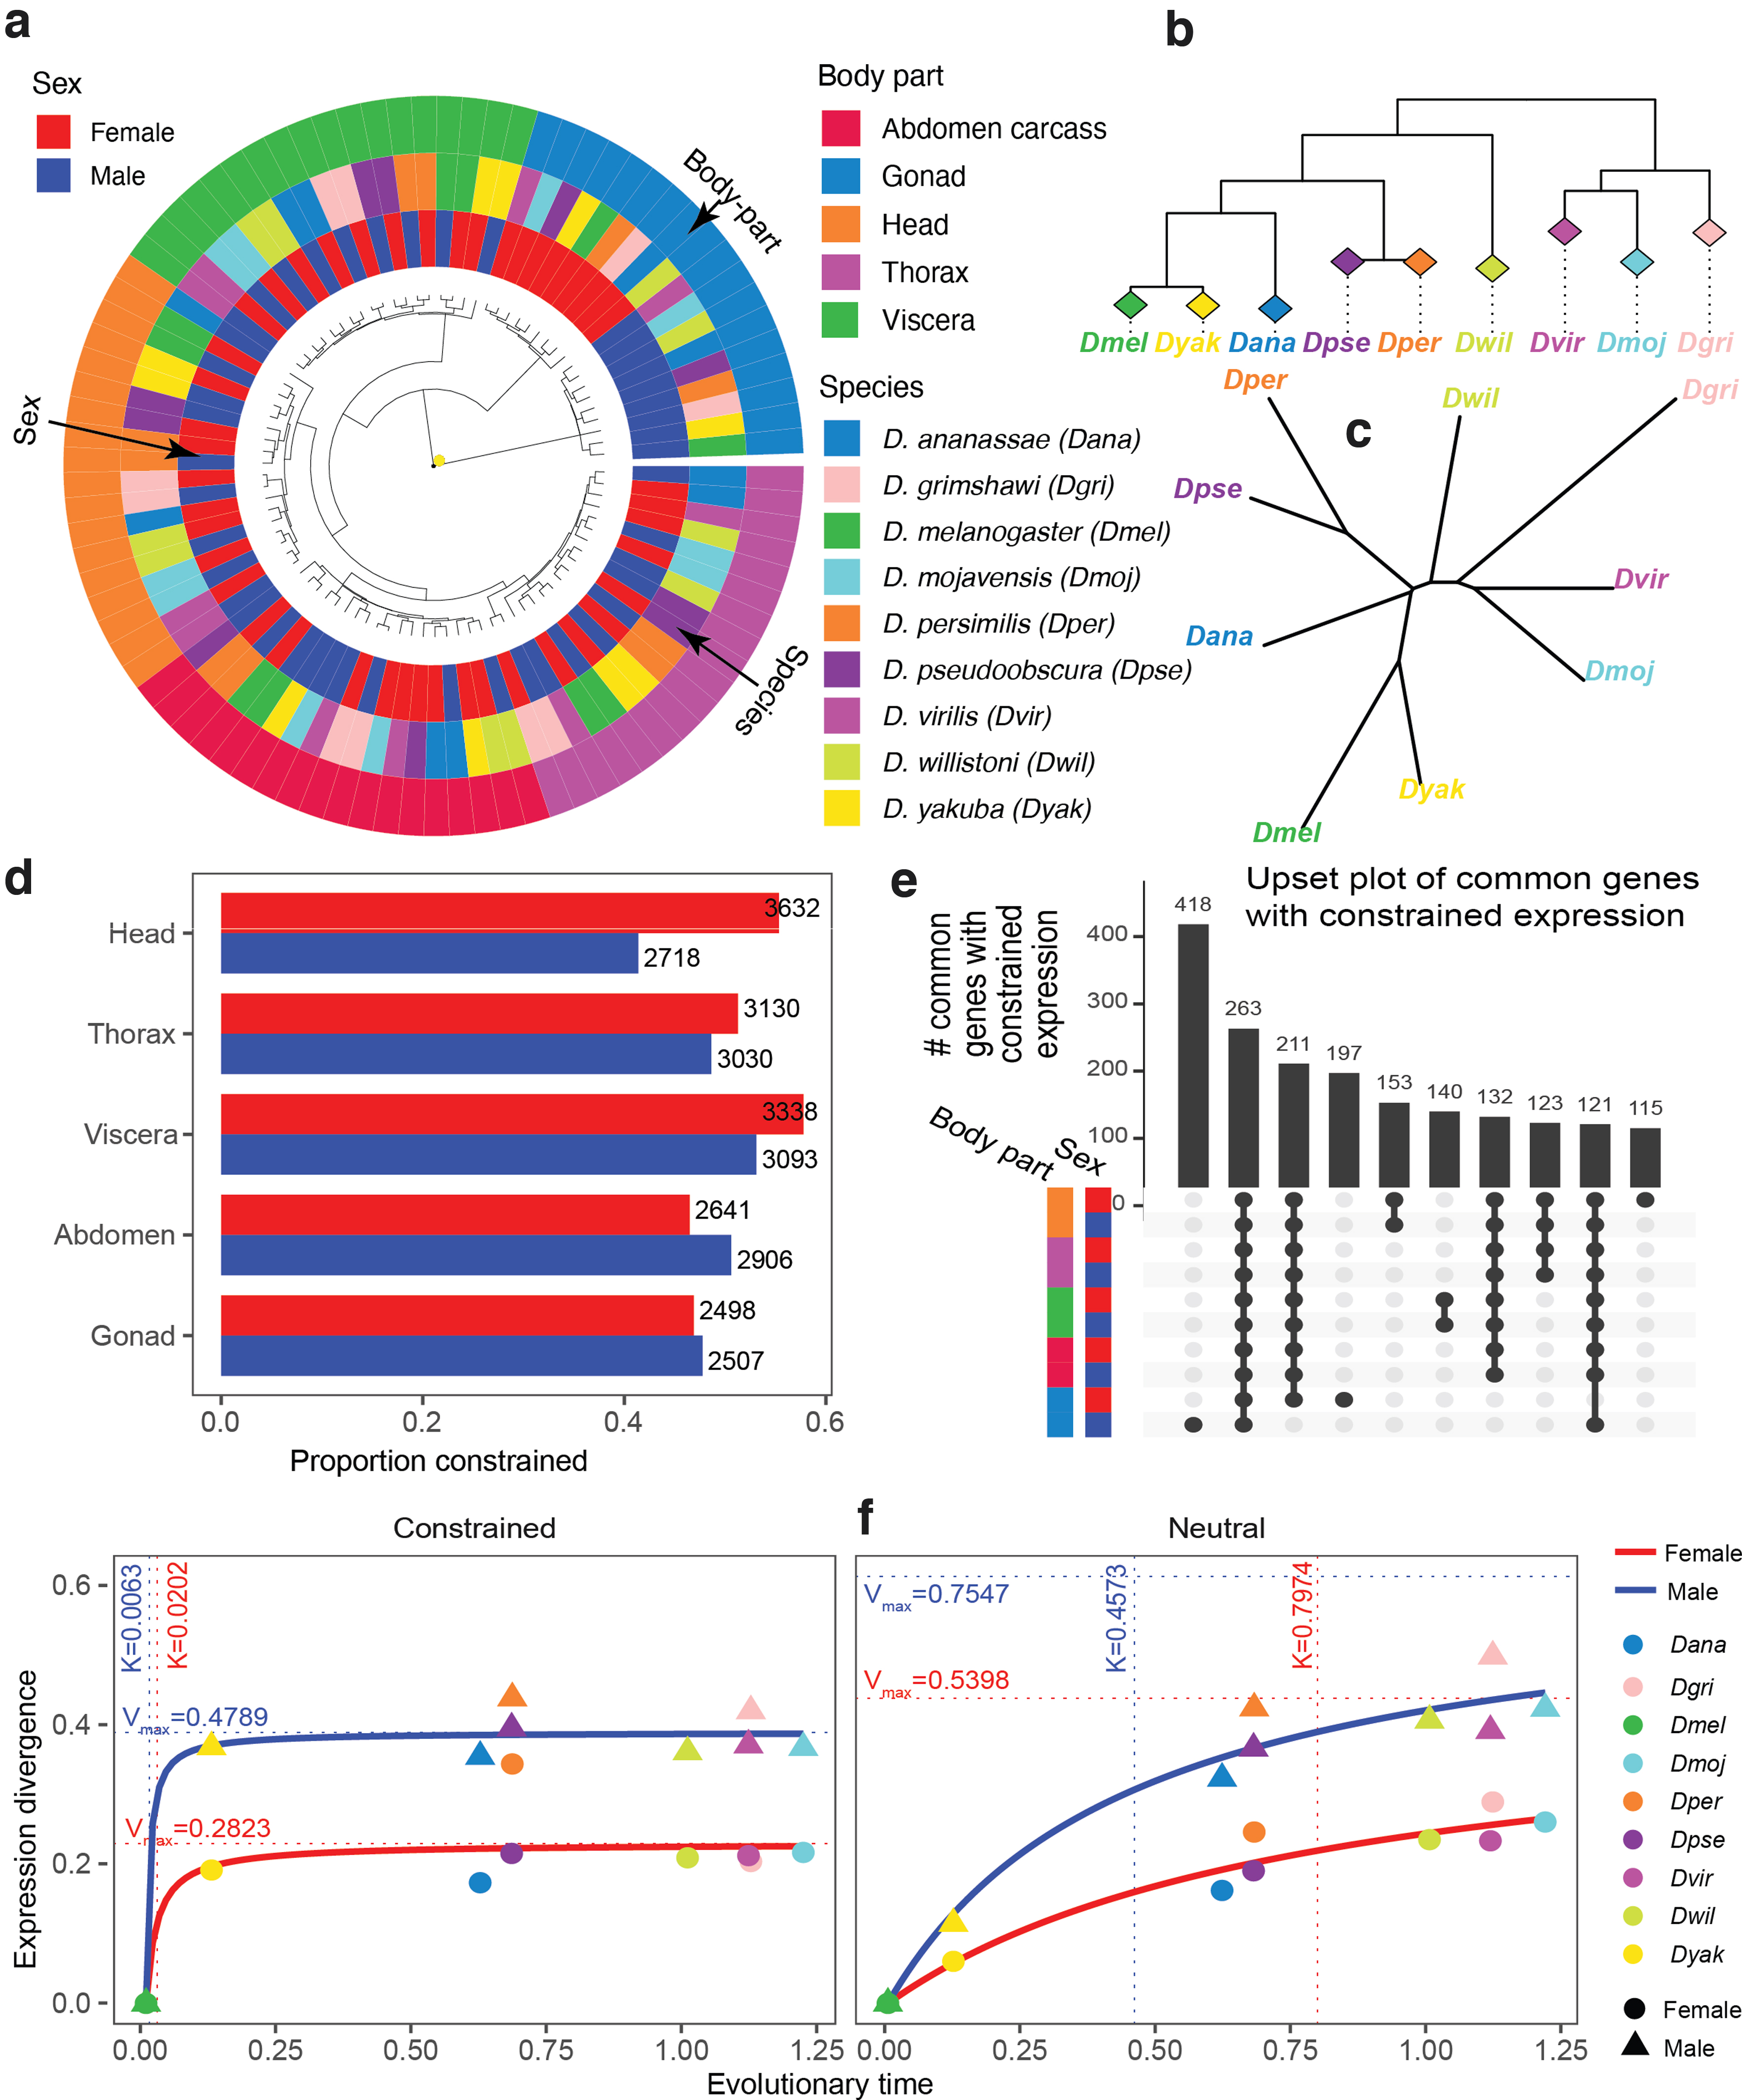
Constrained and neutral gene expression evolution in Drosophila genus.
Specifically, when we used log gene expression values and Euclidean distances then head and thorax of the same species often clustered together (Supplementary Fig. S7). This co-clustering may reflect the fact that in the fly these two anatomical regions have extensive central nervous system components (brain and thorasic ganglia). Thus, both tissue-specific and species-specific trends can be observed, depending on the weight given to genes in the tails of the expression distributions. In addition, studies in mammals (Chen et al., 2019) report that expression evolution within individual tissues generally follows species evolution. We confirmed that this is also the case for Drosophila (Fig. 3c and Supplementary Table S2).
In particular, we could reconstruct the phylogenetic tree (either perfectly or with small Robinson-Foulds distances from the known sequence-based tree) using gene expression values in any specific body-part in either sex. Thus, although the evolution of gene expression is consistent with species evolution, the fact that all samples cluster predominately by body-parts, and in some cases by sex, suggests that gene expression evolution is also subject to strong tissue and sex-specific constraints.
Next, we used EvoGeneX to identify genes that are subject to constrained expression evolution and those for which the null hypothesis of neutral expression evolution could not be rejected. To focus on the genes that are relevant for a given tissue and sex, we included in this analysis only those genes that have normalised read counts of more than one in all four replicates and all species. Independent of organ and sex, and despite the stringency of our model, the hypothesis of neutral evolution could be rejected for more than 40% of the expressed genes (Fig. 3d).
In the following, we refer to a gene as “constrained” if the null hypothesis was rejected for that gene, and “neutral” otherwise. Note that, technically, this neutral group of genes with drifting expression also contains genes with weakly constrained expression that could not be confidently distinguished from the neutrally evolving group (analogous to nearly neutral sequence evolution; Ohta, 1973). Interestingly we found that gene expression evolution in females was often more constrained than in males with the biggest differences in head and viscera.
As discussed in the previous section, gene expression evolution for individual body-parts and sexes follows the previously estimated sequence-based species tree (Chen et al., 2014) either perfectly or with small Robinson-Foulds distances. We asked whether the occasional small differences between the sequence-based tree and expression-based tree would be eliminated if we use only the genes with neutral (or nearly neutral) expression evolution in the give body-part and sex only. Indeed, we found this was the case, although some minor differences persisted (Supplementary Table S2).
It is widely accepted that genes performing essential cell functions show constrained sequence evolution (Fisher, 1930). Therefore, we asked whether genes with constrained expression in one body-part or sex show constrained expression in other body-parts or in the opposite sex. Interestingly, the largest set of genes with constrained expression in more than one body-part occurred in the intersection of all the body-parts independent of the sex (Fig. 3e for overlaps of more than 100 genes and Supplementary Fig. S35 for more overlaps).
Gene Ontology (GO) Enrichment Analysis (Table 1) revealed that the most significantly enriched GO term for biological process for this common gene-set is mRNA splicing, via spliceosome. Alternative splicing is a highly conserved mechanism common to eukaryotes acting to modify the expression of specific isoforms in specific spatiotemporal patterns. We also considered gene expression constrained in smaller subsets of body-parts and sexes. For example, genes with constrained expression only in the head of both male and female flies were enriched in the GO terms for visual perception. Vision is an important evolutionary trait, and thus, many associated genes are, indeed, expected to undergo purifying selection. Finally, consistent with the fact that fly head and thorax share extensive central nervous system components, the common genes with constrained expression exclusively in those two body-parts were found to have enriched GO terms for the nervous system process and dendrite development.
Gene Ontology Enrichment Analysis of the Common Constrained Genes
BP, biological process; GO, gene ontology; MF, molecular function; NS, name space.
Next, we wanted to compare the evolutionary dynamics of gene expression between the sexes and the body-parts. To do this, we considered the relationship between the evolutionary distance (as determined by sequence evolution) of a species with respect to a reference, say D. melanogaster, and the expression divergence measured as
Among closely related taxa, such expression divergence is expected to be a linear function of time, but on larger distances it becomes nonlinear and saturates on a level that depends on the selection strength (Whitehead and Crawford, 2006; Bedford and Hartl, 2009) and potentially other biological limitations. This type of kinetics is similar to classical enzymatic kinetics, and it can be well approximated by the Michaelis-Menten curve
Thus,
Table 2 shows the values of
Summary of
and
of Constrained and Neutral Genes for Different Tissues and Sexes
Summary of
Strikingly, male gonads show far less constrained expression evolution (larger
The high
Differences in habitat, reproductive strategy, and other factors can lead to adaptive evolution in specific branches of the tree. We first tested whether EvoGeneX can detect examples of such adaptive evolution and examined the biological relevance of these findings. Finally, we considered the adaptive expression evolution in the context of sequence evolution.
EvoGeneX reveals body-part specific adaptive expression evolution
Differences in habitat, reproductive strategy, and other factors should lead to evolutionary shifts of optimal expression values for some genes in a particular sex and/or organ system. As a result, the optimum value of a gene expression for a given sex and organ system might be different in different branches of the evolutionary tree.
Statistically, the detection of such evolutionary adaptation is very challenging and current methods have limited statistical power that has been attributed to the relatively small sizes of evolutionary trees for which tissue-specific gene expression data are available (Chen et al., 2019). We reasoned that by utilizing replicates for the estimation of within-species variability, EvoGeneX might have greater power to detect such adaptive evolution of gene expression. We used a hypothesis testing framework, and we tested whether both the neutral BM model and constrained model (OU with a single optimum expression) are rejected in favor of the adaptive evolution model (OU with multiple optima).
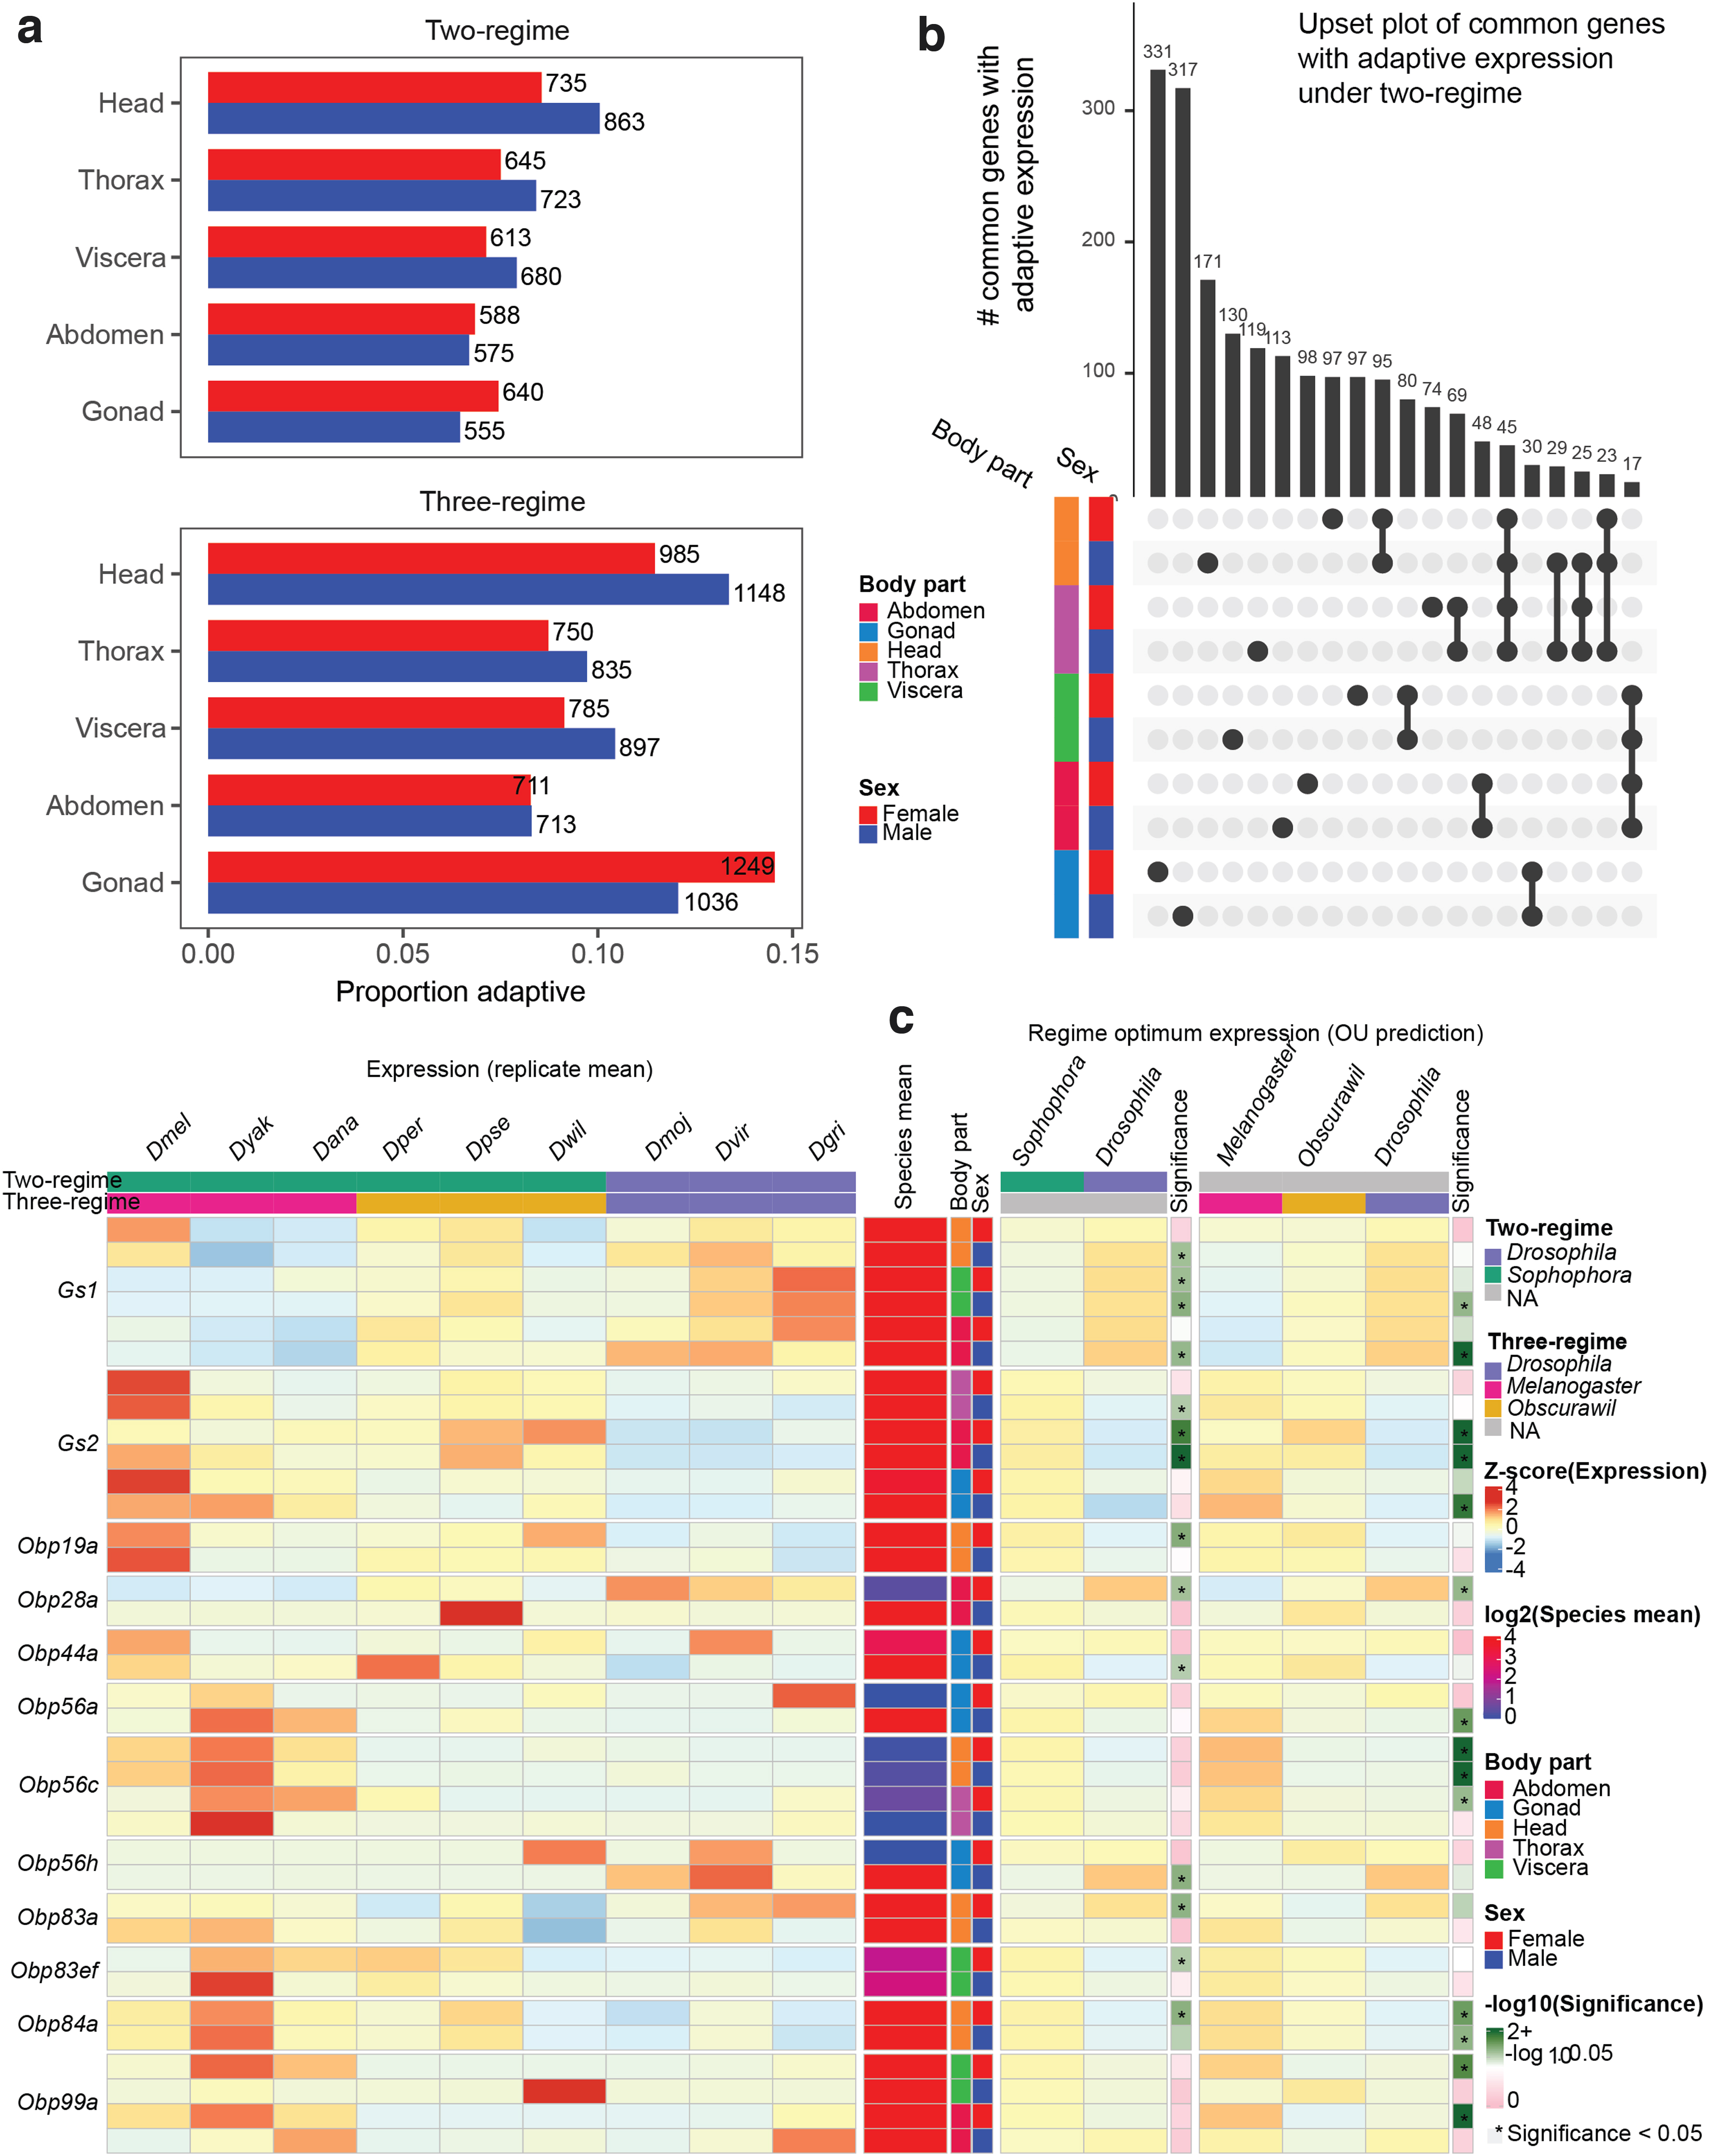
We tested for the evidence of adaptive evolution in two main settings. First, we used a two-regime setting where the regimes correspond to the two sub-genera: Sophophora and Drosophila (Fig. 1a). In addition, to capture potential adaptation in smaller subgroups of species, we also consider a three-regime setting where we partition the tree into three regimes of equal number of species (D. melanogaster, D. yakuba, D. ananassae), (D. pseudoobscura, D. persimilis, D. willistoni), (D. virilis, D. mojavensis, D. grimshawi). We call the first and the third group as Melanogaster and Drosophila, respectively, and the remaining species containing Obscura group and D. willistoni as Obscurawil due to the lack of standard nomenclature for such a group (Supplementary Fig. S1).
Interestingly, in the two-regime scenario, the highest number of genes with adaptive expression evolution was observed in the male head (Fig. 4a). For the three-regime scenario, in addition to the male head, high numbers of genes with adaptive expression evolution were observed in female gonads (Fig. 4a). Expression adaptation in male heads might be related to the fact that males have extensive sets of species-specific mating behaviors ranging from singing to displaying in mating arenas (Singh and Singh, 2014). We also note that there are differences in wiring and gross anatomy between male and female fly brains (Cachero et al., 2010). Drosophila ovaries also vary in morphology (Mahowald and Kambysellis, 1980). The set of adaptive genes uncovered by EvoGeneX can provide additional cues for sex-specific adaptation and warrants further investigation.
Adaptive gene expression evolution in Drosophila genus.
Interestingly, in contrast to the constrained expression evolution, where many genes with constrained expression were common to all the body-parts (Fig. 3e and Supplementary Figs. S38–S40), the adaptive evolution is largely body-part specific.
It has been suggested that one important mechanism facilitating adaptation is gene duplication. Gene duplication is usually followed by the degeneration of one copy, but sometimes each of the duplicates evolves a specialized function. There are two Glutamine Synthase encoding genes in the Drosophila genus (encoded by Gs1 and Gs2). These genes play an important role in nitrogen metabolism, amino acid synthesis, neurotransmitter recycling, and ammonia detoxification in the mitochondria (Gs1) and cytoplasm (Gs2) (Caizzi et al., 1990; Vernizzi et al., 2020). We found that Gs1 expression was elevated, whereas reciprocally Gs2 was depressed in the Drosophila subgenus, raising the possibility of compensatory expression evolution of these enzyme encoding genes (Fig. 4c).
One important element of adaptation is sensing the environment, including food sources, and mates. Therefore, we focused on the expression of odor binding proteins (Obps) as potential examples of adaptive change. Obp genes are members of a gene family evolved by duplication that has extensively diversified. Although the exact molecular role of a large number of Obps is not completely clear, they do play a role in pheromone-dependent species and sex recognition (Xiao et al., 2019). For example, D. grimshawi males paint attractive pheromones onto the substrate in mating arenas, known as leks, to attract competing males and female observers. In addition, both D. virilis and D. mojavensis use aggregation pheromones to mark resources for cooperative exploitation.
Expression could come under selection for higher expression in opposite sexes due to a switch in the role of a particular odor and/or hormone from intra-sexual to extra-sexual, or between females and males. Indeed, we found that the expression of many genes encoding Obps is subject to adaptive expression evolution, often in a sex-biased manner (Fig. 4c). As expected, such adaptive expression evolution of Obps is mostly found in the head (where olfactory organs are located) but sometimes in other body-parts as well (Fig. 4c). For example, the Obp28a protein binds floral odors (Gonzalez et al., 2020) and we found higher adaptive expression of Obp28a in Drosophila subgenus female abdomens.
In addition, although we have not detected statistically significant adaptation in males within the tested regimes, we saw a species-specific increase in D. pseudoobscura male abdomen. Next, we observed high adaptive expression of Obp56a in the melanogaster group testis. Expression of Obp56a is known to be downregulated in mated female D. melanogaster (McGraw et al., 2004). Obp56c expression showed adaptive increases in melanogaster group heads in the three-regime analysis. Knockdown of Obp56h results in rapid male remating and those males produce less 5-tricosene, an anti-aphrodisiac that inhibits male–male courtship (Shorter et al., 2016). Interestingly, we found Obp56h to be adaptive in testis. Very little is known about the Obp83 and Obp84 gene families or Obp19a, but these showed striking female-specific adaptation.
Adaptive evolution in the context of sequence evolution
Our analysis demonstrated that adaptive expression evolution is tissue dependant and thus cannot be fully explained by sequence evolution, which is tissue independent. Therefore, we examined another interesting aspect of sequence evolution, which is the presence of rapidly evolving genes (REGs). Previous sequence-based studies identified 28 such REGs (Jagadeeshan and Singh, 2005) out of which CG12901 is currently annotated as an lncRNA, and it was not considered in our analysis. We were interested to see whether these REGs tend to be the subjects of adaptive expression evolution.
Out of the 27 REGs, only 19 had one-to-one orthologs in all species, thus they were included in our analysis using EvoGeneX. Interestingly, 13 out of these 19 genes were found to be adaptive in at least one tissue. In fact, one of these REGs with adaptive gene expression evolution is OS9 (olfactory-specific 9). This gene is adaptive in the male and female thorax and is involved in the sensory perception of smell, similarly to the Obps discussed in the previous subsection. However, although the number of adaptive REGs is higher than expected, the total number of REGs identified based on sequence analysis was too small to achieve statistical power in our analysis.
MATERIALS AND METHODS
Data and data/software availability
The expression data (Yang et al., 2018) were obtained from the NCBI GEO database under accession numbers GSE99574 and GSE80124, and the phylogenetic tree was obtained from Chen et al. (2014) (Supplementary Section S1). The source code for EvoGeneX is available at the NCBI public Github repository: https://github.com/ncbi/EvoGeneX, which also packages the Drosophila gene expression data. A software pipeline to analyze the data using EvoGeneX was built using JUDI (Pal and Przytycka, 2020). More information about EvoGeneX, Drosophila data and results of EvoGeneX on Drosophila data are available at Przytycka Lab webpage at https://www.ncbi.nlm.nih.gov/CBBresearch/Przytycka/index.cgi#software
EvoGeneX model and its parameters
EvoGeneX takes as its input a rooted evolutionary tree and the values of quantitative characters
EvoGeneX further assumes that the optimum value
Let the binary variable
Thus, for a given tree,
Inference of EvoGeneX parameters using Maximum Likelihood estimates
In the following, it will be convenient to make use of matrix notation. Accordingly, we collect our random variables,

where  is a vector of all 1s, column vector
 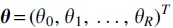 and the weight matrix W is dependent only on α among the parameters and has entries
for
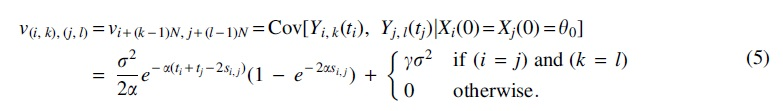
It is known that
As maximizing

However, it can be noted that

whose minimum can be estimated using any off-the-self nonlinear optimization solver.
However, we improve efficiency by utilizing Karush-Kuhn-Tucker conditions. By setting the partial derivatives of U with respect to
Thus, instead of minimizing function U of four parameters
give the values of the remaining two parameters
Maximum Likelihood estimates for BM model
To compare EvoGeneX model of evolution with the BM model, we need to compute maximum likelihood estimates for the BM model accounting for the within-species variation. The BM is a simplified model in comparison to EvoGeneX: There is no “attracting” optimal values and hence there is no α parameter and
Computing statistical significance
We use statistical hypothesis testing to decide which of the three different modes of evolution the trait has undergone: (i) neutral, (ii) constrained, and (iii) adaptive (Section 3.1). For this purpose, we use the likelihood ratio test (Supplementary Section S3).
CONCLUSIONS
Natural selection is a complex organism-level force that has well-studied effects on the sequence of genes, gene duplication and divergence, and de novo gene formation. However, because all cell types have the same genome, the genome sequence is always a compromise for the expression optimum in any given tissue. Sequence is selected based on the survival of a genotype, whereas genes are almost always expressed in multiple contexts within an organism and are thus free to optimize expression levels in different cell types through gene regulatory networks. Thus, studies of the evolution of gene expression are fundamental to understanding the molecular basis of phenotypic trait evolution.
Early in the genomic era, biological replication was not often a priority. The steadily decreasing cost of sequencing now motivates researchers to measure gene expression in multiple biological replicates. Our own data utilized in this study includes four replicates per each species, sex, and body-part. We started with the assumption that information about within-species variation should boost the performance of the OU-based method.
We then developed EvoGeneX, which implements an OU model that includes within-species variation estimated using biological replicates. Overall, our results demonstrate that, by taking full advantage of the existing gene expression data, EvoGeneX provides a new and more powerful tool to study gene expression evolution relative to the currently leading method.
We note that purposefully generated data are not always available, and that it would be useful to use data generated in a variety of studies with different initial objectives. Reusing data produced in different labs for different reasons should increase noise. As per our simulations, large variance is not a problem for our method. However, the assumption that the within-species variance is not to exceed asymptotic between-species variance is relevant for the good performance of the model. For a very noisy data that, for some reason, violates this assumption, averaging of the replicates might be preferred. However, one could argue that this might be better addressed by collecting new data.
Finally, it has been assumed that an OU model performs better on a tree with more species. However, our simulations indicate that it is more important to consider how the species are distributed over the evolutionary tree than how many species are used. Our simulations demonstrate, that despite the small number of species used in our study, the performance of either of the two methods was superior to the performance that could be achieved on a much larger tree but utilizing more closely related species. These analyses help to guide the data collection effort by balancing the number species, their evolutionary distances, and number biological replicates to achieve the best results.
There have been several studies of Drosophila expression evolution as it relates to sex, protein coding sequence, and expression breadth (Ellegren and Parsch, 2007; Meisel, 2011; Campos et al., 2018). Some of those studies have been contradictory or focused on a single prevalent pattern of divergence rather than distinct evolutionary mechanisms. We used EvoGeneX to provide a mathematical framework for an extensive analysis of sex and body-part specific gene expression evolution in the Drosophila genus. In agreement with some of the previous studies, we showed that neutral gene expression evolution can be confidently rejected in favor of constrained evolution (presumably due to purifying selection) in nearly half of the genes.
However, it also showed that for a comparable number of genes the neutral expression evolution could not be rejected, indicating either truly neutral expression evolution or expression evolution under very weak constraints.
Previous studies in mammals observed that gene expression evolution in testis is the least constrained among the organs analyzed (Chen et al., 2019). However, these studies did not include female gonads. Our results show that, among the neutrally (or nearly neutrally) evolving gene expression patterns, gonads evolve faster than other tissues, and male gonads evolve faster than female gonads. However, among the genes identified as constrained, only the testis showed relaxed constraints relative to any other tissue, whereas the constraints acting on female gonads were comparable to the constraints acting on other tissues. Thus, there are interesting differences in the evolutionary dynamics of male and female gonads.
Using EvoGeneX, we also detected interesting examples of adaptive evolution, including prominent examples of odor binding proteins as well as an example of adaptive evolution followed by gene duplication. Interestingly, in contrast to the constrained expression expression evolution where many genes with constrained expression were common to all the body-parts, we found that adaptive evolution tends to be body-part specific.
In summary, our tool performs well to analyze data and show that gene expression is an important trait under selection and subject to drift at the body-part level, to optimize the survival and reproduction of the individual—the unit of selection. This is likely also to be true at the cell-type level, and it is likely that data allowing testing of this hypotheses will soon be available. Although our study is focused on gene expression evolution, the model can be applied to the evolution of other quantitative traits, including protein abundance.
It is generally assumed that the constraints imposed on the gene expression evolution are related to the constraints imposed on protein abundance. Evolutionary models such as EvoGeneX hold the promise of providing a better understanding of this relation once protein abundance data across a large set of species, organs, and sexes become available.
Footnotes
AUTHORS' CONTRIBUTIONS
S.P. designed and implemented EvoGeneX, applied it to Drosophila and simulated data, and analyzed the results. T.P. conceptualized the project, analyzed the results, and wrote the initial draft of the article. B.O. generated Drosophila data and analyzed the results of EvoGeneX on Drosophila data. All authors edited and reviewed the article.
ACKNOWLEDGMENTS
The authors would like to thank Haiwang Yang and Justin Fear for their help and comments on the Drosophila data.
AUTHOR DISCLOSURE STATEMENT
The authors declare they have no conflicting financial interests.
FUNDING INFORMATION
This research was supported by the Intramural Research Program of the National Library of Medicine and the National Institute of Diabetes and Digestive and Kidney Diseases at the National Institutes of Health, USA. Funding nos: 1ZIADK015600-26 (O.B.) and LM200887 (T.M.P.).
References
Supplementary Material
Please find the following supplemental material available below.
For Open Access articles published under a Creative Commons License, all supplemental material carries the same license as the article it is associated with.
For non-Open Access articles published, all supplemental material carries a non-exclusive license, and permission requests for re-use of supplemental material or any part of supplemental material shall be sent directly to the copyright owner as specified in the copyright notice associated with the article.