
Abstract
Codon optimization of a DNA sequence can significantly increase efficiency of protein expression, reducing the cost to manufacture biologic pharmaceuticals. Although directed methods based on such factors as codon usage bias and GC nucleotide content are often used to optimize protein expression, undirected optimization using machine learning could further improve the process by capitalizing on undiscovered patterns that exist within real DNA sequences. To explore this hypothesis, Chinese hamster DNA sequences were used to train a recurrent neural network (RNN) model of codon optimization. The model was used to generate optimized DNA sequence based on an input amino acid sequence for the example receptor programmed death-ligand 1 and for an example monoclonal antibody. When RNN-optimized sequences were transfected transiently or stably into Chinese hamster ovary cells, the resulting protein expression was as high or higher than that produced by DNA sequences optimized by conventional algorithms.
INTRODUCTION
According to the central dogma of molecular biology, genomic DNA serves as a template for transcription into messenger RNA (mRNA) and subsequent translation into synthesized, functional polypeptide. In particular, a coding sequence of DNA is divided into functional triplets of nucleotides called codons, which each correspond to a specific amino acid. Inherent in this system is the degeneracy of the of the genetic code.
With four DNA bases, there are 43 = 64 possible codons, which only need to encode the 20 standard amino acids plus the stop signal. Although two amino acids (Met and Trp) are encoded by a single codon in the standard genetic code, the majority of amino acids are encoded by multiple codons, and the most redundancy is observed for three residues (Arg, Leu, Ser), which are each encoded by six codons. Thus, with an average of approximately three codons for each amino acid, even a small 100-residue protein could be encoded by 3100 = 5 × 1047 possible DNA sequences.
Despite the astronomical number of possibilities, it is clear that not all DNA sequences are created equal. All organisms have a codon bias in their genomes that roughly correlates with the abundance of tRNAs that deliver a specific amino acid to a growing polypeptide chain (Ikemura, 1985). Because the translating ribosome is more likely to encounter high-frequency tRNAs than rare tRNAs, it might be expected that sequences with more high-frequency codons would be translated faster (Dana and Tuller, 2014).
Although the rate of translation initiation also plays a role, there is, indeed, evidence that high-frequency codons can increase the rate of translation elongation, thus increasing the overall rate of protein expression (Quax et al, 2015). Recent studies have suggested that codon usage bias may impact transcription efficiency, in addition to its effects on mRNA translation (Zhoua et al, 2016). Besides codon usage bias, several other factors have been shown to influence transcription, translation, and overall protein expression efficiency (Gustafsson et al, 2012; Hanson and Coller, 2019; Singh, 2020). The argument has also been raised that codon optimization based on codon usage bias could negatively impact protein folding and functionality by bypassing important regulatory sequence motifs (Mauro, 2018; Mauro and Chappell, 2014).
With the increased use of biologicals as therapeutics, there is ever more incentive to find the best codon-optimized DNA sequence for a given amino acid sequence. In the context of bioreactors with volumes in thousands of liters, even small increases in expression efficiency can directly and significantly impact manufacturing costs. Several existing codon optimization algorithms work by combining the known factors influencing transcription/translation into a single multi-parameter algorithm. The GenScript algorithm, for example, considers more than 200 known factors influencing expression in its cutting-edge sequence optimizer.
Besides models that explicitly account for known sequence phenomena, machine-learning approaches to optimize DNA sequence have also been described. Several recent studies have applied sequence-based machine-learning approaches to the codon optimization of genes in Escherichia coli (Fu et al, 2020; Fujimoto et al, 2017; Jain et al, 2021; Tian et al, 2017).
Neural networks are a class of machine-learning model that relate an input to an output via one or more hidden layers (Emmert-Streib et al, 2020). For sequential data where the relationship between input and output is contained in the differences across time or index, recurrent neural networks (RNNs) offer an advantage in their ability to give these layers a definite directionality. For example, in the context of natural language processing, RNNs can translate accurately between languages to retain meaning (Tracey, 2019).
Likewise, RNNs are an appealing option for translation of an amino acid sequence to its optimized DNA sequence in a given expression host. In this work, an RNN was trained on a large set of Chinese hamster DNA sequences to allow for the prediction of optimized sequence for a given protein-encoding gene. The RNN output sequences were compared with conventionally optimized sequences in the context of transient and stable protein expression in Chinese hamster ovary (CHO) cells, demonstrating the competitive utility of this sequence optimization strategy.
METHODS
Data preparation
Coding regions of the Chinese hamster (Gricetulus griseus) genome were downloaded from the NCBI genome database on May 21, 2020 (https://ftp.ncbi.nlm.nih.gov/genomes/all/GCF/003/668/045/GCF_003668045.3_CriGri-PICRH-1.0/). The compressed file (Chinese_hamster_CDS.fna.gz) can also be accessed at https://github.com/drgoulet/Codon-optimization. Validation of sequences is described in the results, and the validation script can also be found on the Github repository (sequence_validate.py).
Training a RNNs
The training script can be found in the Github repository (rnn_train.py). The RNN model used Sequential model type with 128 embedding layers and 16 bidirectional layers. A dropout layer (0.3) was added to prevent overfitting. The loss function was sparse_categorical_crossentropy, and the optimizer was Adam (learning rate 0.005). The model was fitted using a 0.2 validation split and a batch size of 16 over 10 epochs.
Prediction of optimized DNA sequence
Prediction of an optimized DNA sequence from a given amino acid sequence can be performed using the rnn_predict.py script on the Github repository https://github.com/drgoulet/Codon-optimization. Prediction requires the trained model (rnn_model.h5), as well as the sequence tokenizers (aa_tokenizer.json, dna_tokenizer.json). The amino acid sequence to be optimized can be placed as a text file in the same repository as the other prediction files. The output is the optimized DNA sequence as a text file.
Transient transfection and protein analytics
The amino acid sequence of human programmed death-ligand 1 (PDL1, CD274) signal peptide, extracellular domain (1–238) plus a C-terminal 6 × His tag (“GSGHHHHHH”) was used as input for the RNN DNA sequence prediction algorithm, as well as other algorithms (IDT, https://www.idtdna.com/pages/tools/codon-optimization-tool; GeneArt, https://www.thermofisher.com/us/en/home/life-science/cloning/gene-synthesis/geneart-gene-synthesis/geneoptimizer.html; GenScript, https://www.genscript.com/gensmart-free-gene-codon-optimization.html; CHARMING, https://github.com/wrightgs/CHARMING).
For CHARMING, both %MinMax and geometric mean codon calculators were tested using human codon frequencies for the origin codon table, Chinese hamster codon frequencies for the destination codon table, numMutants = 1, and windowSize = 10 (as recommended). The native human sequence was from GenBank (AF177937.1). The “top codon” sequence used only the highest-abundance codon as defined in the GenScript codon usage frequency table for CHO (https://www.genscript.com/tools/codon-frequency-table).
Codon adaptation index (CAI) calculations were performed using a GenScript calculator for Cricetulus griseus (https://www.genscript.com/tools/rare-codon-analysis), and tRNA adaptation index (tAI) calculations were performed using the standalone version of stAIcalc (http://tau-tai.azurewebsites.net/DownloadStandAlone.aspx) with tRNA data from GtRNAdb (http://gtrnadb.ucsc.edu/GtRNAdb2/genomes/eukaryota/Cgris1/).
The DNA sequences were ordered as gene fragments, cloned into pTT5 vector (commercial license obtained), and miniprepped. Seven micrograms of plasmid DNA was transfected into 10 mL of ExpiCHO cells in duplicate for each plasmid, according to kit instructions (A29129; Thermo Fisher). After 9 days, cells were pelleted by centrifugation for 15 minutes at 4000 rpm and the supernatant was filtered through a 0.2 μm filter. PD-L1 titers were determined using HIS1K sensors on the Octet 384 system, using a standard curve generated from previously purified PD-L1 protein (1:2 serial dilutions starting from 200 μg/mL).
Proteins were purified in duplicate for each optimized version using cOmplete His-tag purification column (6781535001; Millipore Sigma) on the AKTA Avant system. After loading the filtered supernatant, the column was washed with phosphate-buffered saline (PBS) containing 10 mM imidazole pH 7.5, followed by elution and peak fractionation with PBS containing 250 mM imidazole pH 7.5. Protein was quantified using Nanodrop, and quality was assessed by injecting 30 μg onto an XBridge BEH analytical size-exclusion chromatography (SEC) column (186007637; Waters) using an Acquity Arc Waters HPLC system.
Binding to in-house anti-PD-L1 Fab was assessed by biolayer interferometry using an Octet 384 instrument. The Fab was generated by cleavage of the corresponding monoclonal antibody (mAb) with papain (20341; Thermo Fisher), and subsequent removal of Fc fragment and uncleaved IgG with a protein A column (17549851; Cytiva). Purified PD-L1 protein (duplicate purifications for each optimized version) was loaded onto HIS1K sensors for 180 seconds at 5 μg/mL. After a 60-second baseline step, the PD-L1 protein was associated with 20 nM anti-PD-L1 Fab for 180 seconds, and then dissociation was observed for 420 seconds. The assay buffer used for baseline, association, and dissociation steps was PBS containing 1% BSA and 0.05% Tween 20, pH 7.2. The KD of the interaction was quantified by fitting the association and dissociation data to a 1:1 model.
Stable transfection
Sequences for mAb heavy chain and light chain were optimized using the RNN algorithm by predicting the DNA sequence of the input amino acid sequences. Heavy chain and light chain amino acid sequences were each preceded by a signal peptide for secretion of the antibody. The original sequence was used as a baseline, and it was generated based on the nucleotide sequence disclosed in the original mAb patent. The DNA sequences were ordered as gene fragments, and heavy and light chains were cloned into the multicistronic CHO-K1-derived vector to create unoptimized and optimized plasmids. The CAI values for heavy chains were 0.82 (original) and 0.94 (RNN-optimized), and for light chains they were 0.78 (original) and 0.95 (RNN-optimized).
Two micrograms of plasmid DNA was transfected into 1 × 10⁶ CHO-K1-derived cells in duplicate for each plasmid, according to Lonza Amaxa 4D nucleofector protocol for CHO-K1 instructions. Transfected cells were cultured in selection medium, and stable minipool selection followed Sigma-Aldrich CHO-K1 platform technical bulletin. In summary, for unoptimized plasmid transfection, twenty 96-well plates were plated for stable minipool selection, whereas for optimized plasmid transfection, four 96-well plates were plated for stable minipool selection. After ∼3 weeks, top stable minipools were selected for further expansion and evaluation.
Top stable minipools were finally evaluated in a 15-day 30-mL shake flask fed-batch production run. At the end of the assay, cells were pelleted by centrifugation for 15 minutes at 1500 rpm and the supernatant was filtered through a 0.2 μm filter. mAb titers were determined using Protein A sensors on the Octet 96 system, using a standard curve generated from previously purified mAb protein (1:2 serial dilutions starting from 200 μg/mL).
Statistics
Statistical significance of titer differences was evaluated in Microsoft Excel using a two-tailed unpaired t-test. As the F-test revealed no significant difference in variance, no difference in variance was assumed.
RESULTS
Data preparation
Coding regions of the Chinese hamster (Gricetulus griseus) genome were downloaded from the NCBI genome database. Before training the model, the 47,351 basis DNA sequences were run through a series of validations. First, each coding sequence (CDS) region was tested to ensure that the sequence length was divisible by 3, indicating the presence of translatable codons. Sixty-seven sequences failed this test and were eliminated. If the sequence length was divisible by three, the translated amino acid sequence was calculated based on the standard genetic code, and the amino acid sequences could be used in subsequent steps.
Second, nine DNA sequences were removed due to containing non-standard DNA bases (A, C, G, or T) somewhere in the sequence. Third, the start of each sequence was analyzed to ensure that it begins with the “ATG” start codon encoding methionine, and 224 sequences were removed for failing this test. Fourth, 132 sequences were eliminated for not ending in one of the three stop codons (TAA, TAG, TGA). Fifth, 486 sequences were detected to have multiple stop codons in the reading frame, and they were thus removed. Sixth, seven sequences were detected that did not encode a standard amino acid.
These sequences aligned with the sequences containing non-standard DNA bases. Finally, after translation, 67 sequences were found to have inconsistent DNA and amino acid sequence lengths, where the amino acid sequence length was not exactly one-third of the DNA sequence length. Again, this resulted from any of the problems cited earlier.
In total, 637 sequences were removed from the basis DNA dataset for violating any of the 7 sequence anomalies to yield 46,714 valid sequences. Some of the sequences violated multiple rules, which is why the total number of sequences removed is less than the sum of sequences violating individual rules. Due to repeats of the same amino acid and/or DNA sequence, the final collection contained 38,558 sequences. The sequence order was randomized, and 38,000 sequences were used for training, validation, and testing.
Training of the RNNs
To develop a predictive model that could learn the best DNA sequence for an input amino acid sequence, a deep RNN was trained on the collection of 38,000 pairs of sequences. The “x” or “input” items were the translated amino acid sequences, whereas the “y” or “output” items were the original DNA sequences. Of the 38,000 basis sequence pairs, 30,000 were used for training whereas 8000 were set aside for subsequent testing of the trained model. Of the 30,000 training sequences, 24,000 were directly used for training whereas 6000 were used for validation to prevent over-fitting. Embedding and bidirectional layers were incorporated into the sequential Keras model to maximize the chances of learning complex sequence patterns.
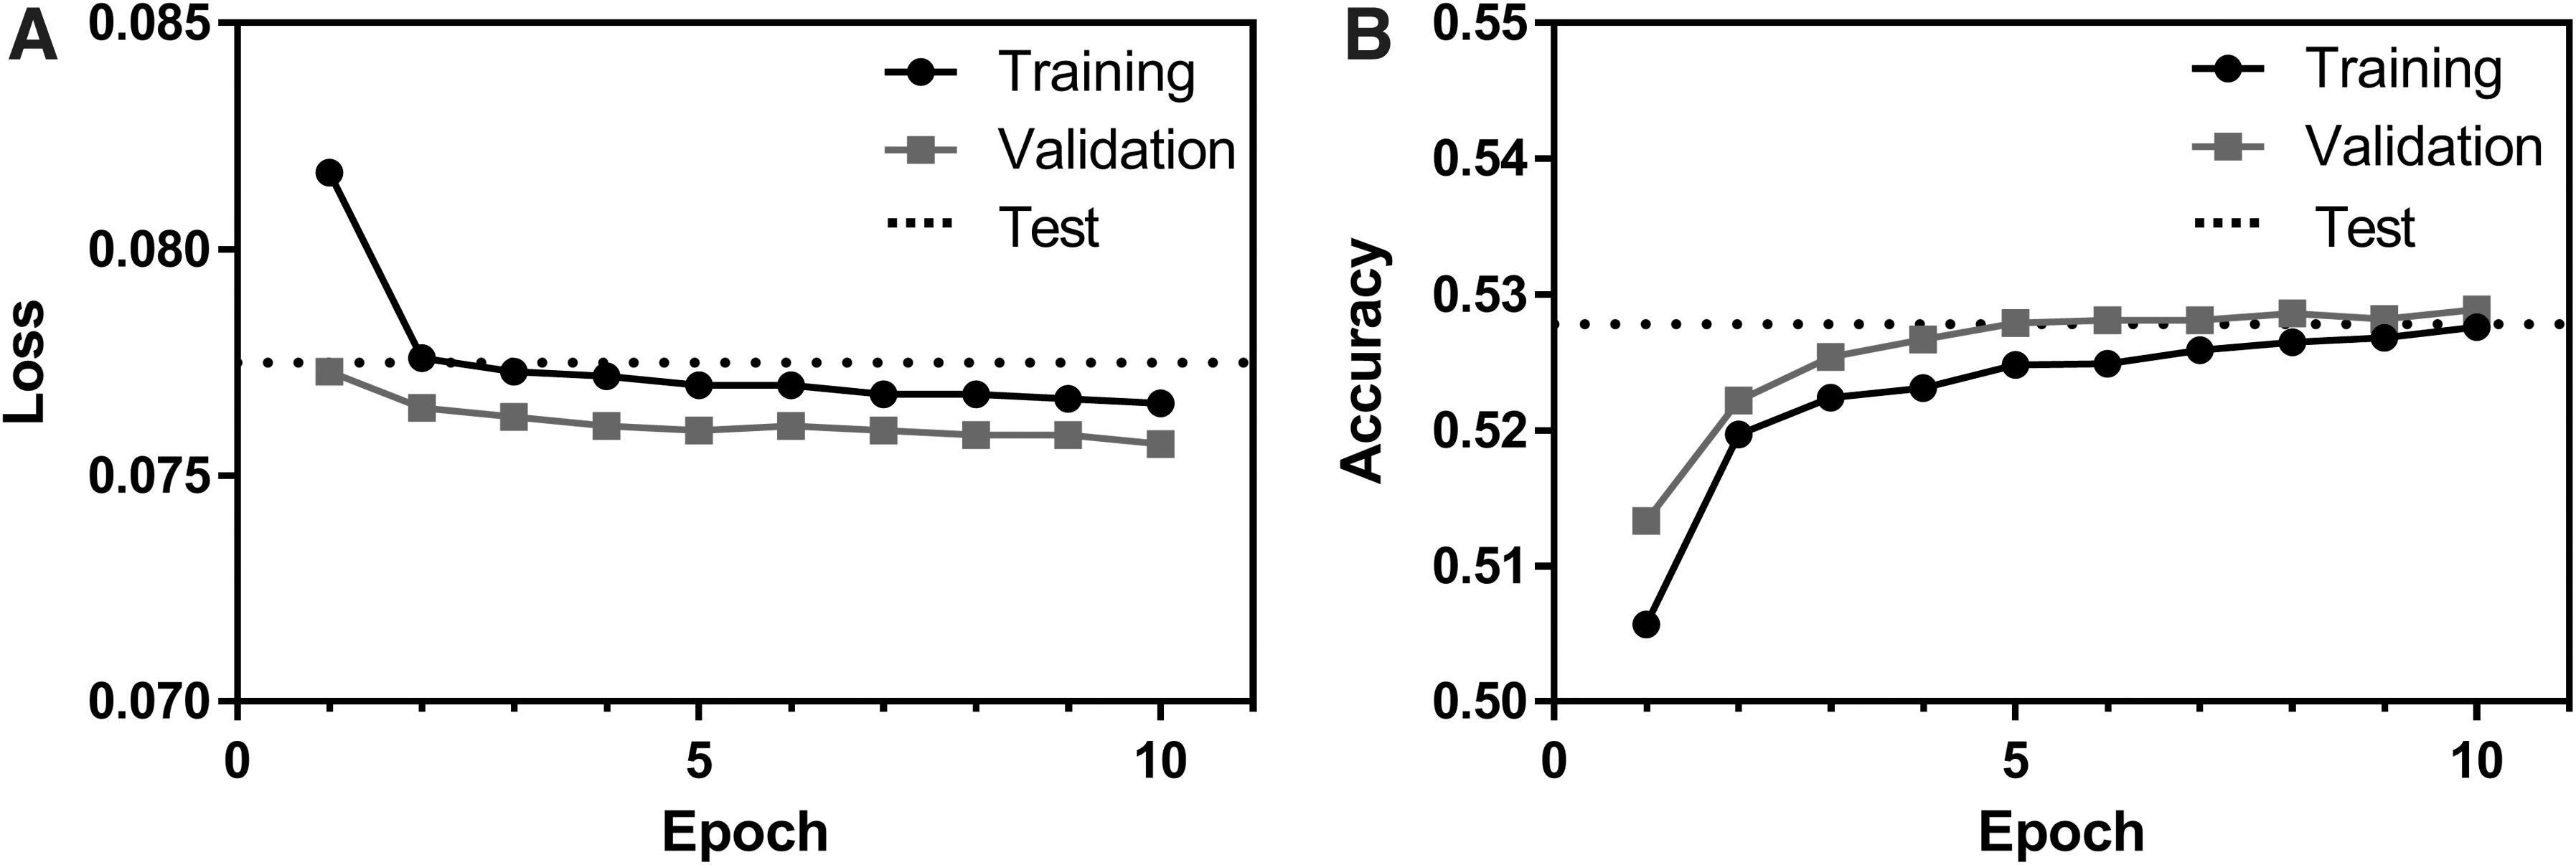
The changes in loss and accuracy as the model was trained for 10 epochs are shown in Figure 1. Due to the addition of a dropout layer, the validation dataset consistently achieved slightly lower loss and higher accuracy than the training set for a given epoch. Notably, accuracy after training only approached 0.53. This seemingly low accuracy occurs because a given amino acid can be encoded by one to six DNA codons. Thus, even if a “correct” codon is selected (one that encodes the input amino acid), it is considered incorrect unless it is the codon that occurred in the basis DNA sequence.
Loss
In fact, the theoretical maximum accuracy that could be attained by choosing only the highest frequency codons for a given amino acid is 0.4430. This value was calculated by multiplying the relative frequency of an amino acid's highest frequency codon by the frequency of that amino acid in all peptide sequences in the dataset, and by summing the values for each amino acid. Thus, the accuracy achieved by the model is ∼19% higher than would be achieved by simply choosing the highest frequency codons.
After training the RNN model, it was evaluated using the 8000 pairs of sequences that were set aside for testing. The average loss and accuracy achieved in the test set were 0.0775 and 0.5278, respectively, which are also plotted in Figure 1 for facile comparison to the training data. Thus, the test accuracy was very similar to the accuracy of the training and validation sets from the final epoch (0.5276 and 0.5289, respectively). Notably, all 8000 output DNA sequences translated to the identical amino acid sequence that was used as input.
Small-scale transfection
Although the RNN model was trained to generate sequences that are the most native-like, these same output sequences by extension could be hypothesized to be superior in terms of protein production levels and/or protein folding and activity (Horstick et al, 2015; Zrimec et al, 2020). To test the expression efficiency of an RNN-trained sequence, transient transfection of unoptimized and optimized sequences was performed in CHO (ExpiCHO) cells. The extracellular domain of human PD-L1 (CD274) was used as a model protein, since the protein is a large enough to test codon usage (220 amino acids, ∼25 kDa) and contains several of each type of amino acid, but it is small enough to allow for facile cloning of various optimized sequences.
Since the DNA sequence of human PD-L1 represents human codon usage, the native human DNA sequence was used as an unoptimized control sequence (termed “WT” for “wild-type” in figures). The amino acid sequence for human PD-L1 was input into the trained RNN model, and the best DNA sequence for Chinese hamster was predicted.
In addition to the RNN-optimized sequence, DNA sequences from other optimization algorithms (IDT, GenScript, GeneArt) were also used for comparison using Cricetulus griseus as the host organism. As another control, a sequence using only the most frequent codons for each amino acid (“Top codons”) was tested. Finally, the effect of codon harmonization between original human codons and Chinese hamster codons was assessed using two codon calculators from the CHARMING algorithm (Wright et al, 2022). The CAI, rRNA adaptation index (tAI), and %GC content for each sequence are shown in Supplementary Table S1.
Nine days after transfection, protein titers were quantitated using HIS1K tips and a titer standard prepared from previously purified PD-L1 protein (Fig. 2A). Based on duplicate transfections for each plasmid, the RNN-optimized sequence had significantly higher expression titers than the wild-type sequence (179.5 ± 12.4 and 104.5 ± 5.7 μg/mL, respectively; p < 0.05). Interestingly, the IDT-optimized sequence yielded consistently lower titers than the wild-type sequence (25.6 ± 3.1 μg/mL), whereas other optimized sequences had titers that were higher than that of the unoptimized sequence and similar to that of the RNN sequence (GeneArt, 172.6 ± 34.3 μg/mL; GenScript, 167.9 ± 28.8 μg/mL; Top codon, 165.3 ± 13.4 μg/mL).
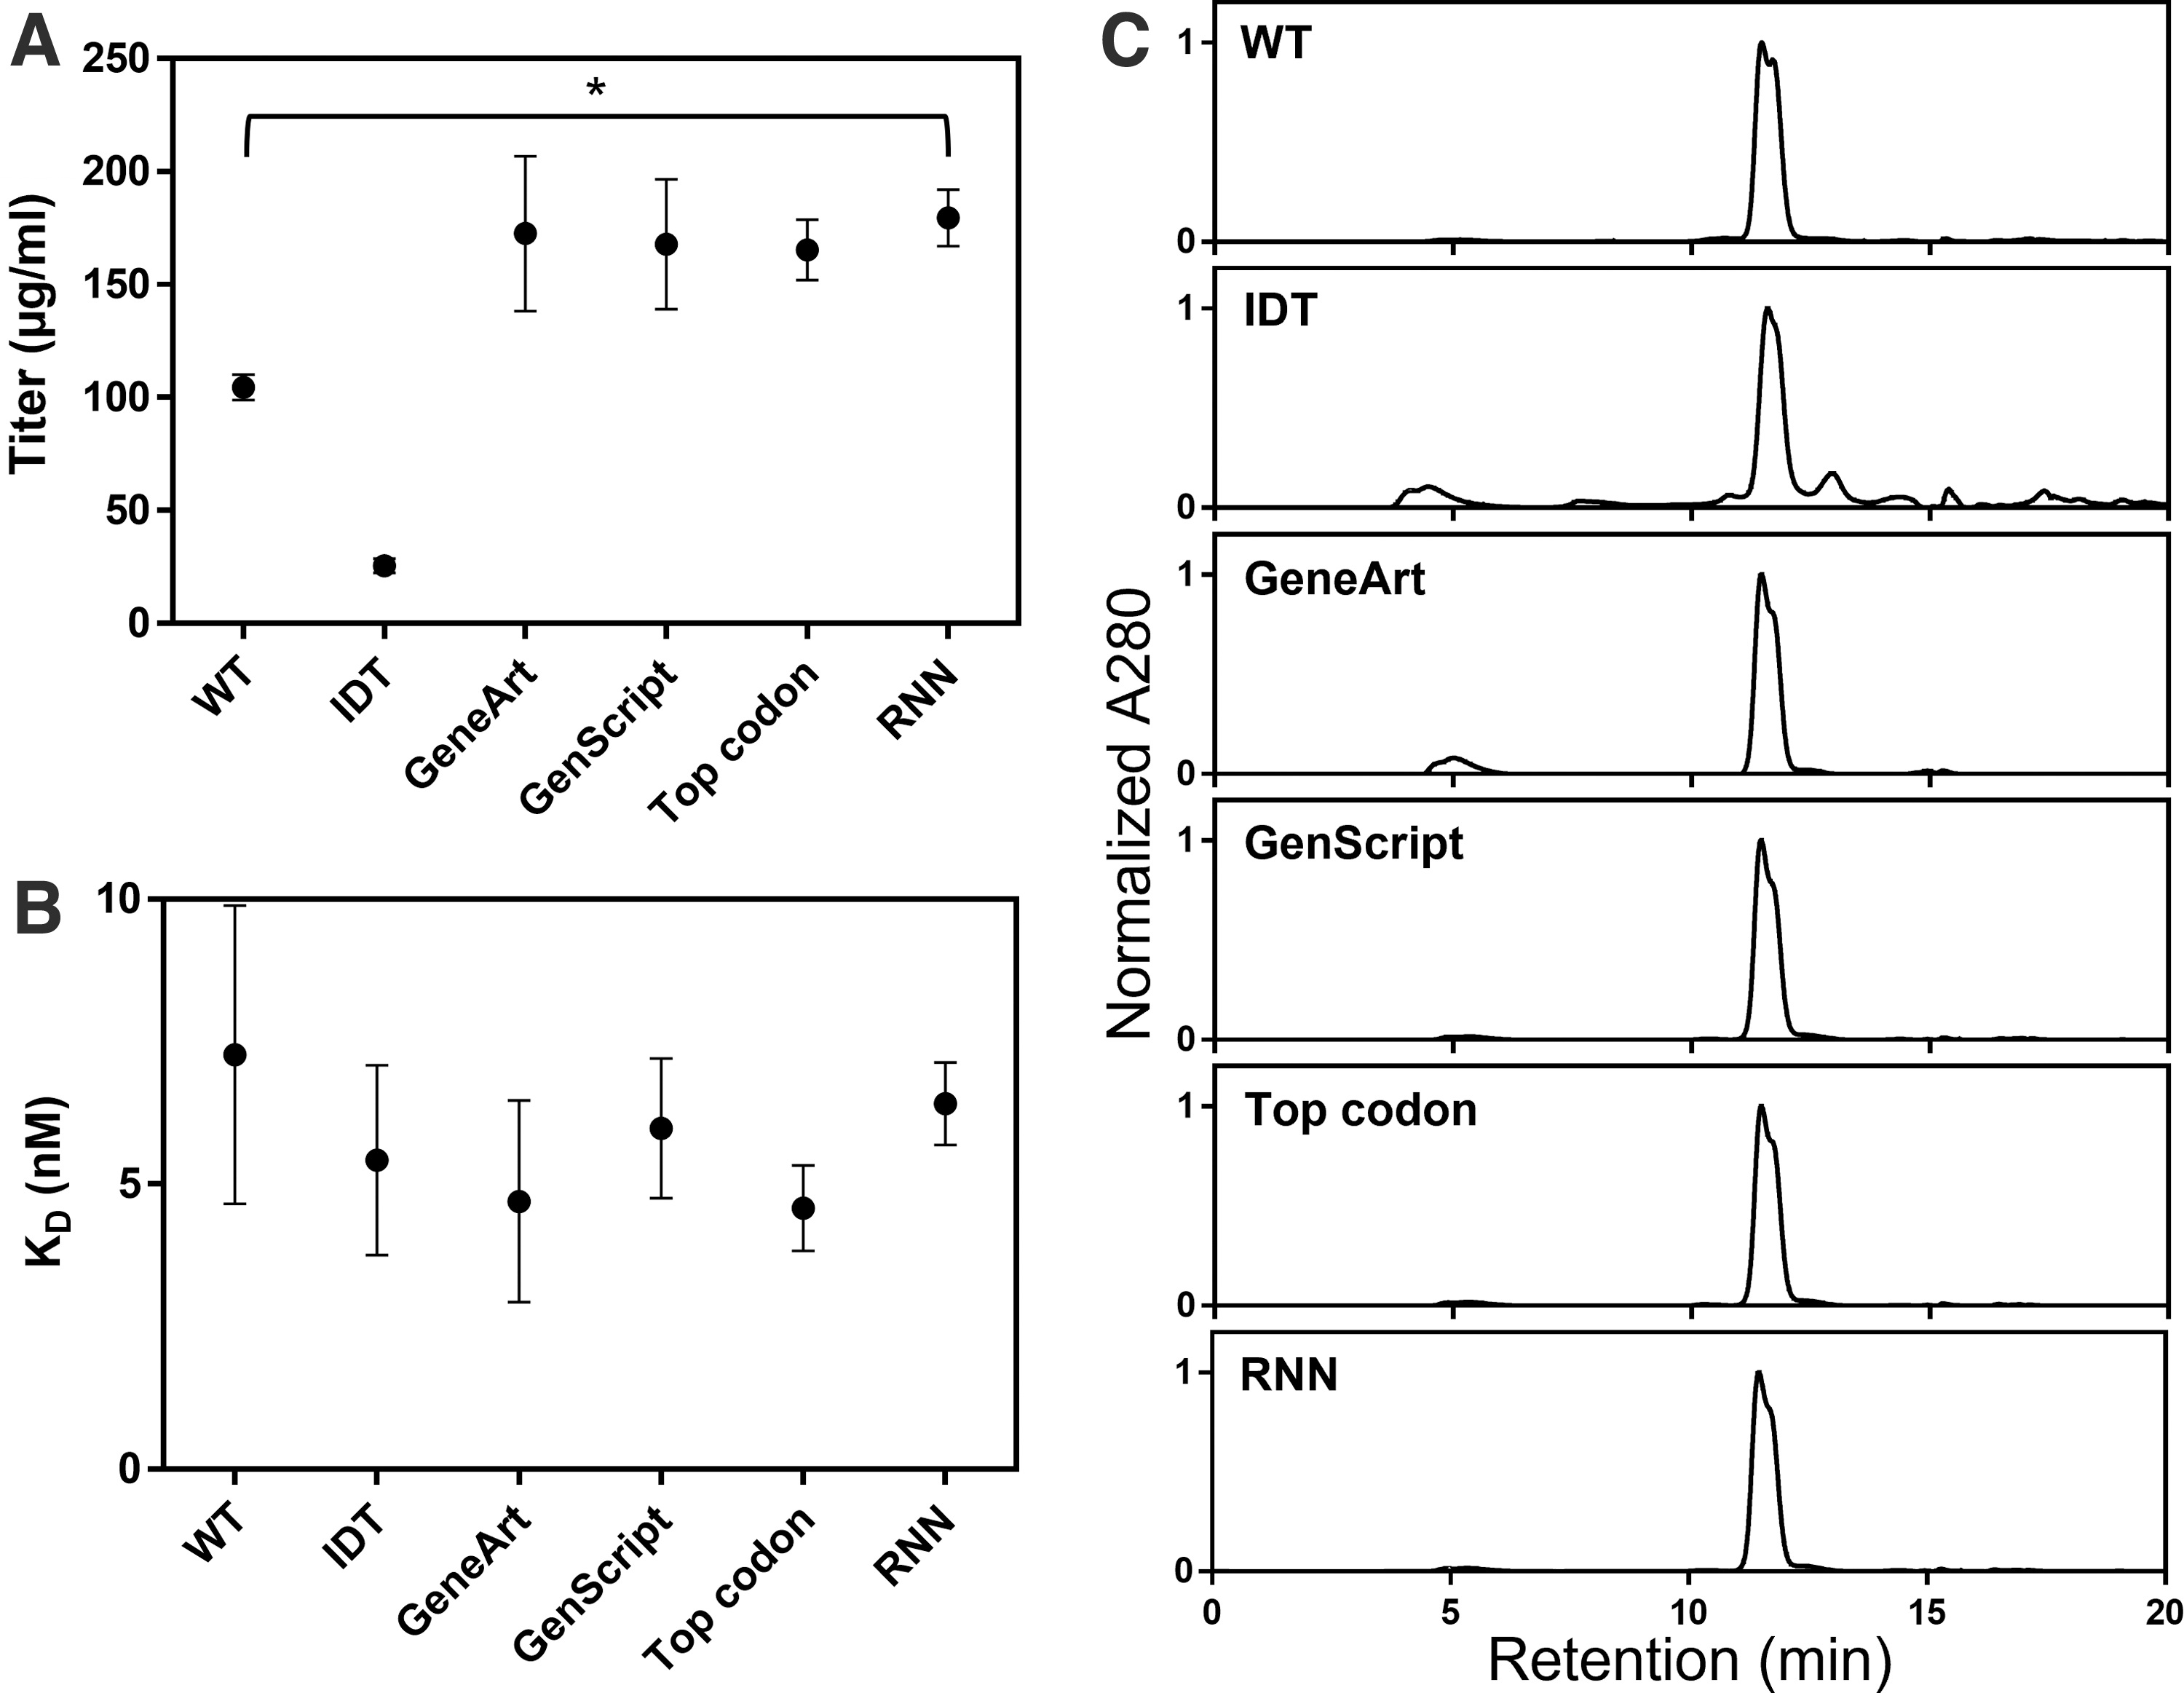
Results of transient transfection of six DNA sequences encoding the extracellular domain of human PD-L1. “WT” represents the original human sequence, “Top codon” sequence uses the highest frequency codons for each amino acid, “RNN” sequence was predicted by RNN, and the remaining sequences (“IDT,” “GeneArt,” “GenScript”) were created using the corresponding codon optimization algorithms.
The experiment was repeated with the original set of sequences plus two sequences generated by the CHARMING algorithm (Wright et al, 2022), showing that harmonization using ORFeome-wide codon usage frequencies caused similar protein expression as the wild-type sequence, whereas harmonization based on CAI values caused a decrease in expression titer (Supplementary Fig. S1). Thus, sequence optimization using RNNs allows for increased protein expression in specific host cell lines at a level comparable to other state-of-the-art algorithms.
Besides total protein yield, the quality of expressed protein is another important consideration, especially when the protein will be used therapeutically. It is reasonable that the DNA sequence, including the abundance and order of specific codons, could impact translation kinetics, and thereby affect protein folding and activity. Thus, even proteins containing the same peptide sequence could feasibly experience differences in folding based on the template DNA and subsequent mRNA sequences.
To assess any impact of DNA sequence on protein quality, proteins produced by small-scale ExpiCHO transfection were purified by immobilized metal affinity chromatography and subsequently analyzed by analytical SEC. Figure 2C shows the SEC profiles for the PD-L1 proteins generated by each tested sequence. Based on two separate purifications for each sequence, the unoptimized human sequence had good quality (94.0% ± 3.2% peak of interest) with a minor amount of high-molecular-weight and low-molecular-weight species.
The RNN sequence yielded protein of similar quality (92.6% ± 0.3% peak of interest). Due to the lower amount of desired PD-L1 protein present, the IDT-optimized sequence showed a higher proportion of large and small contaminants (62.3% ± 2.5% peak of interest). The GenScript and “Top codon” sequences yielded protein quality similar to that of the unoptimized and RNN sequences (91.9% ± 0.3% and 92.0% ± 0.9% peak of interest, respectively), whereas the GeneArt protein was of a slightly lower quality with some aggregate (80.8% ± 0.2% peak of interest). Overlays of the chromatograms are shown in Supplementary Figure S2.
Finally, to assess functionality of the proteins produced by the six different DNA sequences, biolayer interferometry was used to quantify binding kinetics to an in-house Fab targeting the PD-L1 extracellular domain (Fig. 2B and Supplementary Fig. S3). PD-L1 proteins were coupled to HIS1K sensors, followed by association with the targeting Fab. All proteins showed similar binding kinetics, with fitted KD values ranging from 4.6 to 7.3 nM. This result indicates that all the DNA sequences were transcribed and translated to produce protein in its native folded state.
Stable cell line generation
As a final validation of the utility of RNN sequence optimization, DNA sequences encoding a larger (∼150 kDa) mAb protein were stably integrated into the genome of CHO cells. Structurally, mAbs are an assembly of two distinct peptide chains (heavy chains, H; and light chains, L) arranged as H2L2 tetramers, making them more complex than the PD-L1 extracellular domain used to test transient transfection titer. In contrast to transient transfection, which is generally performed for one-time expression of protein, stably transfected cells are often needed for large-scale manufacture of therapeutic proteins that will be produced continually in bioreactors. Due to the more permanent nature of stable cell lines and the relatively high cost of their generation, selection of efficiently expressing sequences and clones is critical.
Unoptimized and RNN-optimized sequences for the example mAb were stably transfected into CHO-K1-derived cells and evaluated for minipool titer. Three transfections each were performed for the unoptimized or RNN-optimized sequences using the same signal peptides. More 96-well plates of cells were evaluated for the unoptimized sequence (20 plates) than for the RNN sequence (4 plates) to find an adequate number of high-expressing minipools.
Despite testing fewer plates, the RNN-optimized sequence yielded significantly higher titers than the unoptimized sequence at the minipool stage (Table 1). None of the unoptimized minipools yielded titers above 1 g/L, whereas two of the RNN-associated minipools had titers above this level. The top titer for the unoptimized sequence was 0.96 g/L, whereas the top titer for the RNN-optimized sequence was 2.03 g/L. Thus, optimization of DNA sequence based on host organism codon preference, in this case using the sequence generated from an RNN model, can yield sizable increases in expression efficiency.
Titer Values for the Top 3 Minipools of Stably Expressed Monoclonal Antibody
Titer Values for the Top 3 Minipools of Stably Expressed Monoclonal Antibody
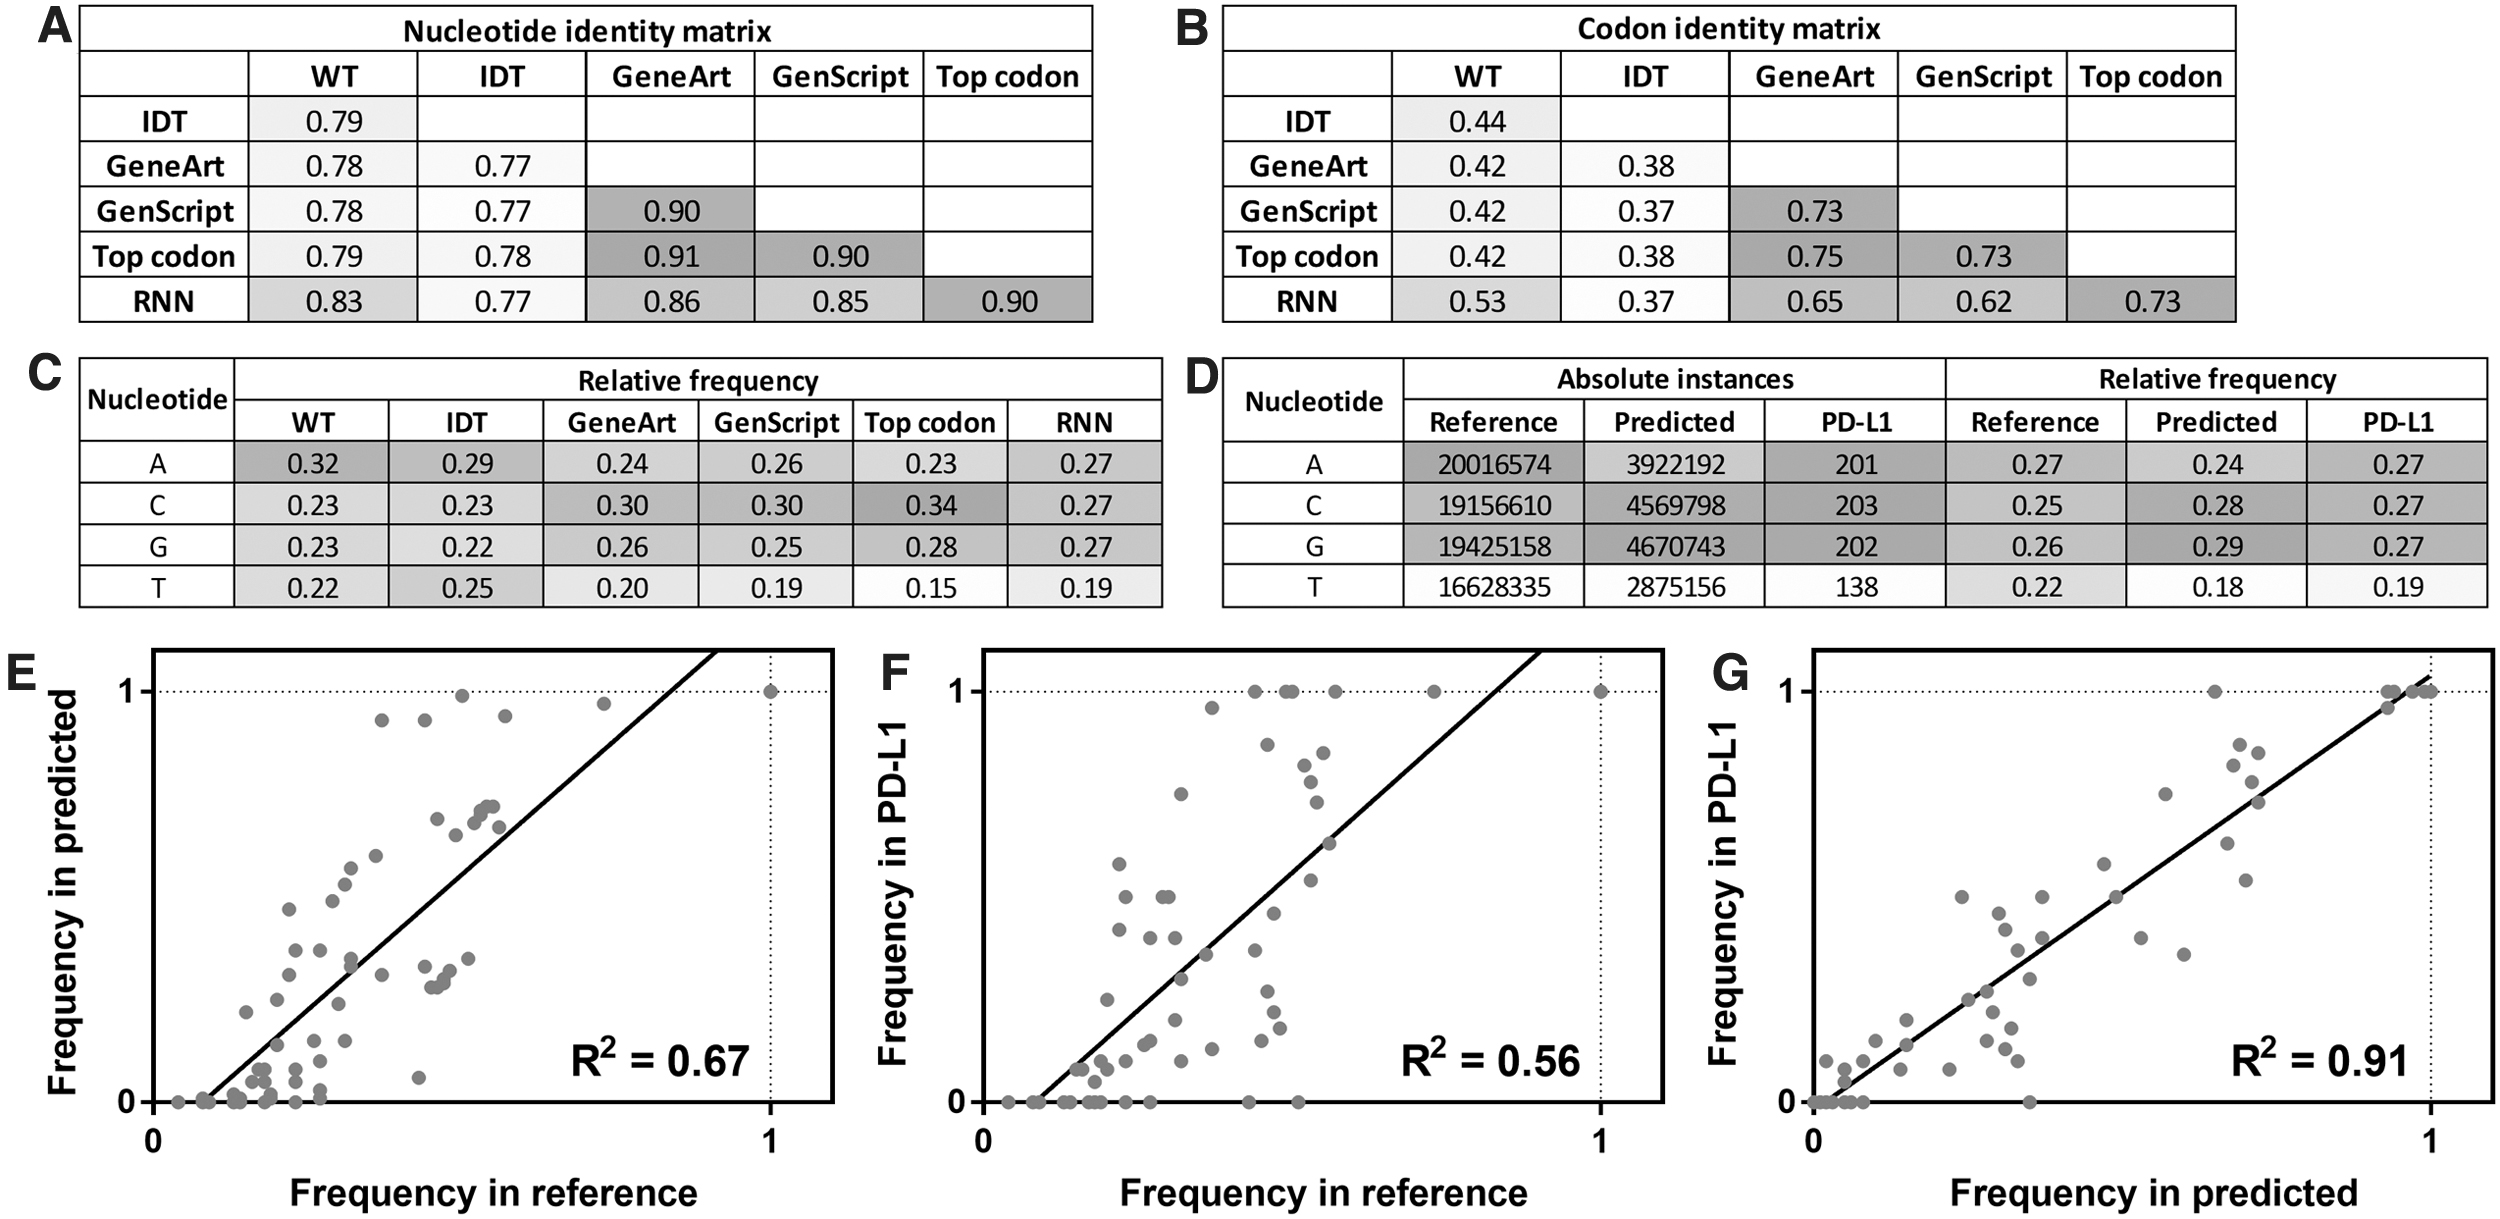
Properties of DNA sequences in the reference dataset, test set predictions, and PD-L1 case study were analyzed for trends in their use of nucleotides and codons. First, the RNN-optimized PD-L1 (CD274) DNA sequence was compared with PD-L1 sequences generated by other algorithms. Figure 3A and B show the nucleotide and codon identity matrices for the PD-L1 DNA sequences used in the small-scale transient transfection study (Supplementary Fig. S4 shows a comparison to CHARMING sequences). From this analysis, the wild-type human sequence and IDT-optimized sequence were most distinct from the other optimized sequences, having at most 83% and 79% nucleotide identity (53% and 44% codon identity), respectively, to other sequences.
Properties of RNN-predicted DNA sequences, compared with DNA sequences generated by other optimization algorithms or the native human sequence (WT).
The other optimized sequences (GeneArt, GenScript, Top codon, and RNN) had relatively high nucleotide identity (85%–92%) and codon identity (62%–73%). The RNN sequence was the most similar to the “Top codon” sequence, indicating that the model learned to use high-frequency codons often.
Next, the nucleotide frequencies of each PD-L1 DNA sequence were evaluated (Fig. 3C and Supplementary Fig. S4). The human sequence had a relatively high frequency of adenine (32%) compared with other nucleotides, which were more equally utilized (22%–23%). The most balanced nucleotide distribution was observed in the IDT-optimized sequence (22%–29% of each). The RNN-predicted sequence showed a depletion in thymine (19%), and equal distribution of the three other nucleotides (27% each). GeneArt and GenScript sequences were also low in thymine (19%–20%), but they showed high cytosine content (30%).
The most unbalanced nucleotide usage was, predictably, observed in the “Top codon” sequence, due to the highest-frequency codons containing increased GC content. This sequence contained only 15% thymine and a remarkable 34% cytosine. There was reasonable correlation between titer and %GC content, CAI, and tAI (R2 = 0.70, 0.84, and 0.75; Supplementary Fig. S5).
To examine the consistency of nucleotide usage between the reference dataset, collection of predicted sequences in the test set, and predicted PD-L1 sequence, the number of instances of each nucleotide was calculated for each dataset (Fig. 3D). In the reference dataset of 30,000 Chinese hamster DNA sequences, the nucleotides were used 20.0, 19.2, 19.4, and 16.6 million times for adenine, cytosine, guanine, and thymine, respectively, corresponding to relative frequencies of 27%, 25%, 26%, and 22%.
The set of 8000 predicted test sequences showed similar frequencies of 24%, 28%, 29%, and 18%. Thus, G/C content was somewhat increased in the test sequences. Finally, as previously mentioned, the PD-L1 sequence had low thymine content but equal A/C/G content, more consistent with the overall reference set.
Finally, the codon usage was compared between reference, test, and PD-L1 sequences. Comparison of reference and predicted codon frequencies showed good correlation (R2 = 0.67; Fig. 3E), indicating that the trained set captured the codon usage trends of the basis set. For amino acids encoded by multiple codons, codon usage ranged from 4.3% (TCG = Ser) to 72.7% (CAG = Gln) in the reference set, and from 0% (CTA = Leu) to 99.2% (TGA = stop) in the predicted set. Notably, only the CTA codon was used zero times in the predicted set, whereas the remaining 63 codons were all used multiple times.
The predicted PD-L1 sequence contained codons that were consistent with the distribution in the reference set (R2 = 0.56, Fig. 3F) and the predicted set as a whole (R2 = 91, Fig. 3G). For PD-L1, four amino acids that could be encoded by multiple codons always used the same codon (TGC used 4/4 times for Cys, AAG used 14/14 times for Lys, CAG used 10/10 times for Gln, and GTG used 20/20 times for Val), whereas the remaining 14 multiply-encoded amino acids used different codons throughout the sequence, and the single stop codon was TGA. Details of codon usage for the various PD-L1 sequences are shown in Supplementary Figure S6, and details of codon usage for the reference, predicted, and PD-L1 sequences are shown in Supplementary Figure S7.
An RNN model was trained on a dataset of 30,000 Chinese hamster DNA sequences to learn complex sequential patterns. The trained model was then used to predict the most appropriate DNA sequences for a test set of 8000 amino acid sequences, resulting in a test accuracy of 0.5278. Accuracy in this context is defined as choosing the codon that occurs in the native DNA sequence, such that an accuracy of 1.0 would represent a sequence fully matching the endogenous sequence.
Thus, accuracy does not necessarily reflect adaptation indices such as CAI or the actual expression level, but rather the agreement of the output sequence with the exact codons encountered in Chinese hamster genes. Although this accuracy is seemingly unimpressive, it is significantly higher than that achieved by using the most abundant codon for every instance of an amino acid (0.4430) and is a more stringent parameter than nucleotide identity. Importantly, the predicted DNA sequences always encoded the correct amino acid sequence. When used to transiently express the extracellular domain of PD-L1, or to stably express a mAb, the RNN sequences yielded significantly more protein than the unoptimized sequences, and similar levels of protein as conventionally optimized sequences.
These results suggest that the trained RNN model may be generally useful for the codon optimization of DNA sequences for heterologous expression of proteins in CHO cells, and that deep learning on the features of natural DNA sequences can help to design synthetic sequences that will efficiently express in a given host.
The RNN-optimized sequences shared important properties with sequences generated by other codon optimization algorithms. For example, the RNN sequence for PD-L1 had enriched GC content (54%), similar to that observed in other optimized sequences (GeneArt, 56%; and GenScript, 55%). In addition, RNN sequences tended to use higher frequency codons more than rare codons. Although sequence properties were similar for the different algorithms, the mechanisms of sequence optimization are quite distinct.
Most existing sequence optimization algorithms appear to score based on known phenomena such as codon usage, GC content, splice sites, and potentially hundreds of other well-understood factors. In contrast to this explicit parameterization, the RNN strategy learns implicitly from sequence patterns in the reference dataset. Thus, given enough data and efficient layering, the deep learning approach has the potential to capitalize on important biological phenomena, even if these mechanisms and their relation to protein expression are not currently understood and cannot be explicitly accounted for in more strictly parameterized algorithms.
It is worth clarifying the meaning of codon “harmonization” and “optimization,” since these two processes have distinct methods and goals. Sequence harmonization seeks to preserve codon preferences of the original gene (e.g., maintaining rare codons, which could be essential for proper folding), whereas sequence optimization seeks to maximize usage of high-frequency codons in the expression host without maintaining the sequential patterns in the original gene.
For simple proteins such as PD-L1, the optimization approach can clearly increase expression efficiency without detrimental effects on folding or function. However, for other proteins with complex folding pathways, the harmonization approach may be preferred to ensure proper folding kinetics and outcomes (Liu, 2020). Of these approaches, the RNN algorithm most closely resembles the “optimization” strategy, since it seeks to incorporate codon preferences of the expression host without regard to codon usage in the host of origin.
Other deep learning approaches have yielded models capturing the complex sequential patterns in DNA sequences. For example, several groups have used neural networks to learn and predict codon usage as it relates to protein expression or ribosome density distributions (Fu et al, 2020; Fujimoto et al, 2017; Jain et al, 2021; Tian et al, 2021; Tunney et al, 2018). One unique property of the RNN approach here is its unsupervised nature, learning implicitly on sequence patterns over entire genes rather than first encoding sequences into codon boxes (Fu et al, 2020) or defining a specific range over which to observe patterns (Tian et al, 2017; Tunney et al, 2018; Wright et al, 2022).
This unbiased learning approach makes the trained model somewhat of a black box that may be useful for generating optimized sequences, but which is not as mechanistically instructive. In contrast to previous algorithms, which analyzed the properties of bacterial or yeast coding regions, the RNN model presented here was trained and tested in the context of mammalian genes, increasing its utility for heterologous expression of proteins such as mAbs-containing complex post-translational modifications (Fu et al, 2020; Fujimoto et al, 2017; Jain et al, 2021; Tian et al, 2017, 2021; Tunney et al, 2018; Wright et al, 2022).
A major advantage of this work is its validation with biological experiments rather than only sequence metrics such as CAI. Two model genes were expressed transiently or stably in different Chinese hamster cell lines, where RNN-generated sequence was compared with the sequence of multiple competitor algorithms with regard to protein expression, protein stability, and protein function.
This study represents an additional application of deep learning to the prediction and optimization of DNA sequences. By training on human, bacteria, or yeast sequences, the RNN approach used here could be applied to other expression systems. The reference data could be narrowed to only the highest expressing proteins, with the hypothesis that these proteins express highly, in part, due to a DNA sequence that is efficiently transcribed and translated. By incorporating more and different layers, the complexity could be increased to yield better trained models that allow for further enhancement of protein expression.
Footnotes
AUTHORS' CONTRIBUTIONS
D.R.G.: Conceptualization, data curation, formal analysis, investigation, methodology, project administration, software, validation, visualization, writing—original draft, writing—review and editing. Y.Y.: Data curation, investigation, methodology, writing—review and editing. P.A.: Data curation, investigation, writing—review and editing. A.B.W.: Conceptualization, supervision, writing—review and editing. A.N.-S.M.: Project administration, supervision, writing—review and editing. Y.Z.: Funding acquisition, resources, supervision.
AUTHOR DISCLOSURE STATEMENT
All authors were employed by SystImmune, Inc., at the time of drafting the article. The authors declare there are no other competing interests.
FUNDING INFORMATION
No funding was received for this article.
References
Supplementary Material
Please find the following supplemental material available below.
For Open Access articles published under a Creative Commons License, all supplemental material carries the same license as the article it is associated with.
For non-Open Access articles published, all supplemental material carries a non-exclusive license, and permission requests for re-use of supplemental material or any part of supplemental material shall be sent directly to the copyright owner as specified in the copyright notice associated with the article.