
Abstract
Abstract
Recent advances in high-throughput omics techniques render it possible to decode the function of genes by using the “guilt-by-association” principle on biologically meaningful clusters of gene expression data. However, the existing frameworks for biological evaluation of gene clusters are hindered by two bottleneck issues: (1) the choice for the number of clusters, and (2) the external measures which do not take in consideration the structure of the analyzed data and the ontology of the existing biological knowledge. Here, we address the identified bottlenecks by developing a novel framework that allows not only for biological evaluation of gene expression clusters based on existing structured knowledge, but also for prediction of putative gene functions. The proposed framework facilitates propagation of statistical significance at each of the following steps: (1) estimating the number of clusters, (2) evaluating the clusters in terms of novel external structural measures, (3) selecting an optimal clustering algorithm, and (4) predicting gene functions. The framework also includes a method for evaluation of gene clusters based on the structure of the employed ontology. Moreover, our method for obtaining a probabilistic range for the number of clusters is demonstrated valid on synthetic data and available gene expression profiles from Saccharomyces cerevisiae. Finally, we propose a network-based approach for gene function prediction which relies on the clustering of optimal score and the employed ontology. Our approach effectively predicts gene function on the Saccharomyces cerevisiae data set and is also employed to obtain putative gene functions for an Arabidopsis thaliana data set.
1. Introduction
A
The sheer size and high dimension of the expression data dictates the search for an underlying structure in order to not only reduce the computational demand but also generate and test biologically meaningful hypothesis pertinent to gene functions. The process of identifying this structure in terms of grouping the data is called clustering, with the resulting groups as clusters (Kleinberg and Tardos, 2002). The grouping is usually based on some similarity measure defined on the gene expression data, (e.g., Euclidean distance and Pearson correlation (D'haeseleer, 2005)). Here, we adopt the abstraction of graph clustering which has as its goal the grouping of the nodes (representing the genes) of the graph into clusters. This abstraction takes into consideration the edge structure of the graph in such a way that there should be many edges within each cluster and relatively few between the clusters.
Despite the improvement of existing and development of novel graph clustering algorithms, there are three open problems that hinder applications in biology (Schaeffer, 2007): (1) parameter selection, i.e. developing methods to determine the parameter values provided as input to a clustering algorithm of choice, (2) scalability, i.e., determining the algorithm performance in terms of processing time and memory consumption for large data sets, and (3) evaluation, i.e., deciding which of several clusterings is optimal (for a chosen criterion).
With regard to parameter selection, the common pitfall of the existing clustering algorithms is their dependence on the number of clusters, which makes it possible to cluster data even in the absence of natural clusters. Determining the “correct” number of clusters—that which most likely reflects the underlying structure of the analyzed data—is a notoriously difficult problem for which no consensus has been reached due to the lack of a precise definition for a cluster (Jain and Dubes, 1988). The current practice for estimating the number of clusters involves using external measures (i.e., criteria by which a clustering is compared against a “gold standard,” if such exists) or internal measures (i.e., indices that estimate the compactness, connectedness, separation, or the predictive power of a clustering based on topological information computed from the data), which in turn imposes ineluctable biases (for comprehensive surveys), see Tibshirani et al., 2000; Halkidi et al., 2001; Jiang et al., 2004; Schaeffer, 2007. For a chosen measure and clustering algorithm one usually uses the “elbow” criterion by which a sudden change of the measure for different number of clusters is assumed as indicative of correctness (Xu et al., 2002; Tibshirani and Walther, 2005).
Therefore, to chose a clustering which best reflects the existing biological knowledge one is bound to perform a large number of comparison tests which should (1) use a wide range of values for the number of clusters, (2) employ a large set of clustering algorithms, each with its own set of parameters, and (3) depend on various external measures which must reflect the prior biological knowledge usually structured in form of an ontology. The first two points represent not only the main bottlenecks in the existing approach, as they directly affect its scalability (Giancarlo et al., 2008), but also contradicts the data-independent nature of clustering as an unsupervised learning method.
In addition, to evaluate clustering results, analyses based on external measures may have the strong benefit of providing an independent and hopefully unbiased assessment of cluster quality (Yeung et al., 2001). However, Handl et al. (2005) point out that these techniques suffer from biases with respect to the number of clusters and the distribution of cluster sizes. Recent attempts to incorporate ontologically structured knowledge for biological evaluation of a given clustering either do not explicitely take into consideration the innate structure of the ontology (Gibbons and Roth, 2002; Datta and Datta, 2006; Steuer et al., 2006; Bolshakova et al., 2006) or result in artificial measures ultimately hampered by the incompleteness of the present biological knowledge (Azuaje et al., 2005; Guo et al., 2006; Kustra and Zagdanski, 2006).
Here, we address the problem of developing a statistically sound framework for biological evaluation of clusterings obtained from a set of clustering algorithms to facilitate gene annotation of high quality. The aforementioned disadvantages of the existing, widely used approach, proposed by Gibbons and Roth (2002), stipulate development of a multilayer framework that can overcome the described bottlenecks, incorporate prior biological knowledge by using external structural measures (not impeded by the incompleteness of the ontologically structured knowledge), and can allow efficient annotation of gene functions.
As clustering algorithms can produce a result even when the analyzed data have no apparent structure, we point out that the aim of biological evaluation—that of determining a clustering which is closest, with respect to a chosen measure, to the existing biological knowledge—is an ill-posed task. Our framework addresses this issue by first determining whether there is some structure in the data, directly reflected in a probabilistic range for the number of clusters, and if so, which clustering algorithm yields a clustering which best describes the data with respect to the biological knowledge represented in terms of an ontology. The steps involved in the proposed framework are depicted in Figure 1. Given a set
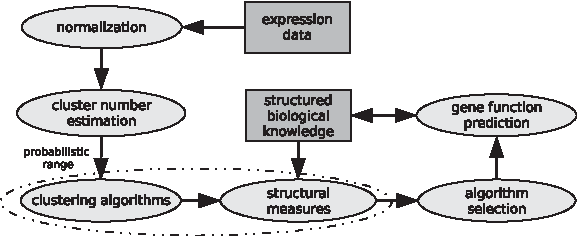
Framework for biological cluster evaluation and gene function prediction. The framework requires two types of input for external biologically meaningful evaluation of the obtained clusters and prediction of novel gene functions:gene expression data, on which clustering is performed, and structured biological knowledge in terms of an ontology. The dashed ellipse denotes a loop through the set of chosen clustering algorithms for the probabilistic range obtained by estimating the number of clusters. External structural scores are determined by combining the resulting clustering of gene expression data with the biological ontology by the proposed methods. Finally, the framework allows for gene function prediction which employs the clustering that reflects optimal biological information and a novel prediction algorithm presented here.
1. Estimating the number of clusters, which yields a probabilistic range for the number of clusters in
2. Determining a clustering from each clustering algorithm in
3. Evaluating the obtained clusterings in terms of external structural measures, resulting in a biologically meaningful score,
4. Selecting a clustering algorithm and a clustering of optimal score with respect to a chosen measure, and
5. Predicting putative functions of genes based solely on the selected clustering and the ontology by a novel network-based method.
Note that the bottleneck of the existing frameworks for biological cluster evaluation is overcome by Step 1, since the clustering algorithms from
With respect to the clustering algorithms employed in Step 2, our framework is not restricted to using only clustering algorithms that result in a partition of the genes in non-overlapping clusters. Fuzzy clustering algorithms (e.g., fuzzy c-means, fuzzy learning vector quantization [Baraldi and Blonda, 1999], or clique percolation [Palla et al., 2005]) yield a collection of overlapping clusters, which has been argued to better reflect the nature of gene expression data (Futschik and Carlisle, 2005). The external measures we develop and employ in Step 3 can also be used for evaluating fuzzy clusters. Here, we adopt the idea that internal cluster quality measures are employed to determine the underlying structure of the analyzed data, while external cluster quality measures, based on a given ontology, are used for biologically meaningful evaluation of a clustering.
Our contribution is threefold: (1) We propose a method for obtaining a small interval for the number of clusters which are most probable to exist due to the inherent structure of gene expression data, rendering this contribution independent of the data and internal cluster-quality measures; (2) our procedure for evaluation of clustering algorithms, resulting in non-overlapping or, alternatively, fuzzy clusters, relies on a mapping from a given ontology onto the graph clusters by using novel structural external measures; and (3) testing of the proposed framework on real gene expression data from existing studies with promising first results about prediction of gene functions. The proposed framework, methods, and measures have been implemented in R and available upon request.
2. Methods
The expression levels of a gene u from s (time-course) experiments yields, after standard normalization, an expression profile—a multidimensional vector from
2.1. Estimating the number of clusters
To estimate the number of clusters in a given data set, here we adopt the notion that clusters correspond to dense regions of the raw data (Wishart, 1969; Hartigan, 1975). Our approach relies on a random walk on the defined graph H in order to identify nodes from dense regions. Classical approaches for evaluating the intrinsic structure of the data—such as the internal measures, silhouette width index (Rousseeuw, 1987), Dunn index (Dunn, 1974), Davies-Bouldin (Davis and Bouldin, 1979), or SD-validity index (Halkidi et al., 2001)—rely on the entire data set and attempt at optimizing various internal topological properties for a given clustering. For instance, the silhouette width measures the average ratio of cluster compactness (intra-cluster distances) versus the spatial separation of different clusters (inter-cluster distances). For a given data set, the number of clusters with maximum overall silhouette width is then considered optimal.
Our approach, on the contrary, does not evaluate a given clustering and can be employed to obtain a small probabilistic interval for the number of clusters. This can later be used as input to different clustering algorithms. In the following, we detail three steps of our approach, illustrated in Figure 2.
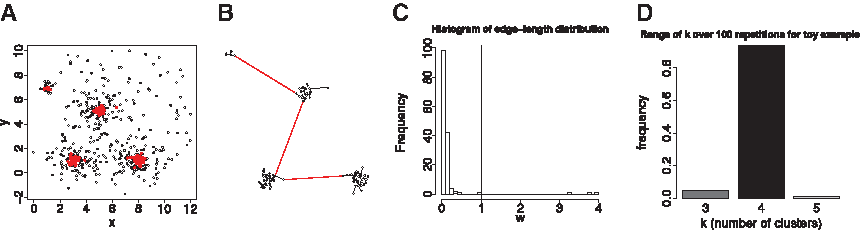
Estimating the number of clusters (one iteration). (
2.1.1. Step 1: Identifying dense regions by random walk
Based on the definition of graph H, the concept of a dense region directly relates to a subset of nodes from H, mutually connected via short edges. The weight of an edge is synonymous with its length. Let us define a random walk on the weighted graph H: starting on a randomly chosen node, at any given time step, an imaginary walker traverses an edge from a node u to v with a probability proportional to the degree of u and the edge-length μ(u,v). Such choice of edge traversal would prefer shorter to longer edges. Therefore, it is expected that our walker would most likely remain in the vicinity of a dense region in H.
Now, let P be a transformation of the weighted adjacency matrix of H, by which
It is easy to see that t(u) is given by the first eigenvector entry of the matrix M,
2.1.2. Step 2: Determining a minimum spanning tree
A subgraph induced by a subset of nodes S in a given graph H is the subgraph of H which contains all the nodes in S together with the edges of H incident only on nodes in S. Furthermore, a minimum spanning tree (MST) of a given graph H is a tree whose sum of edge-weights is minimum and contains all nodes of H. Let B be the graph induced by the nodes sampled from Hd according to f, and let T be MST of B. The MST-based approach for clustering employs the following idea (Zahn, 1971): The constructed MST T will contain many short edges (of small edge-length), connecting nodes from within a dense region, and some long edges (called inconsistent, of large edge-length), connecting nodes from disjoint dense regions. Therefore, it is reasonable to assume that edge-length distribution, fT, in T is bimodal with one mode corresponding to the typical short edges, and the other to the representative long edges. Therefore, determining and removing k − 1 inconsistent edges will result in k sub-trees in T, corresponding to k clusters in the underlying structure of the analyzed data (Fig. 2B).
2.1.3. Step 3: Detecting inconsistent edges
Previous studies based on the MST approach rely on detecting inconsistent edges locally, i.e., by analyzing certain node-neighborhoods and assuming a normal distribution of MST edge-lengths (Jain et al., 2002; Barzily et al., 2008). Our simulations showed that the overall edge-length distribution is highly skewed and thus the assumption of normality rarely holds. Furthermore, it becomes highly difficult to perform statistical outlier tests on a sparse neighborhood (i.e., with a small number of edges). Therefore, we employ a global detection approach based on the previous description of the bimodal distribution of edge-lengths in an obtained MST. Here, we adopt a method from the field of image processing used for binarization of gray-scale images based on a global threshold (Otsu, 1979) to separate the two modes—inconsistent (long) from short edges.
Given an edge-length distribution fT of an MST T and an arbitrary threshold value τ, let
where
An optimal threshold τOPT minimizes the variance within each mode, while maximizing the variance between the two modes, expressed as:
An inconsistent tree-edge can now be rigorously defined as an edge of length greater than or equal to τOPT derived from the edge-length distribution of a given T. Note that, in the toy example shown in Figure 2C, there are three inconsistent edges, whose lengths appear to the right of the vertical line added to the histogram.
2.1.4. Combining the steps
To arrive at a probabilistic estimate for the number of clusters in a small integer interval, we combine the described steps in Algorithm 1, shown below:
It is important to realize that traditional single linkage clustering (like the existing clustering methods based on MST) performs well on clearly separated clusters, and result in significantly long edges between the clusters. However, in situations where such spatial separation is not met or when noise (e.g., nodes between two clusters intercalate into long edges) obscures a clear separation, single linkage clustering tends to fail and thus has acquired a bad reputation. We eliminate this possible shortcoming by first applying the sampling step based on the defined random walk, thereby shrinking the original data set to highly dense regions and omitting outliers from regions of low density or the periphery of the data. In the fuzzy setting, such dense regions correspond to genes which most likely have a membership to only one cluster. The estimation of the number of clusters for the toy example results in the probabilistic range presented as a bar plot in Figure 2D.
2.2. Ontologies and semantic similarity
Let C = {ci ∣ 1 ≤ i ≤ t} be a finite partially ordered set of concepts (e.g., the terms of GO [Ashburner, 2000] and MapMan [Thimm et al., 2004]), modeled by a directed acyclic graph (DAG). Terms are related to each other through is a and part of relationships. The partial order on C is an ancestry relation ⪳, defined recursively as: (i) ci ⪳ cj if and only if ci is in is a/part of relationship with cj, denoted by ci → cj, (ii) there exists a
A semantic similarity measure ν : C × C →
One can show that any semantic similarity measure based on distance in the partially ordered set C (Pavan and Todeschini, 2004; Carlsen and Bruggemann, 2008; Raedt and Ramon, 2009) do not satisfy at least one of the four conditions (proof omitted). However, Pandey et al. (2008) demonstrate that measures based on information content meet the conditions for a semantic similarity estimation and account for the specificity of terms with identical common ancestors: Let Ci be the set of terms from C comparable with ci. The information content of the term ci is then I(ci) = − log2(∣Ci∣/∣C∣) (Resnik, 1995), and their semantic similarity can be defined as follows (Pandey et al., 2008; Lin, 1998; Jiang and Conrath, 1997):
1. 2. νL(ci,cj) = 2νI(ci,cj)/(I(ci) + I(cj)), and 3. νJC(ci,cj) = 1/(1 − 2νI(ci,cj) + I(ci) + I(cj)).
As genes are often annotated with more than one term from ontology C, there is a problem to identify an appropriate semantic similarity measure which allows for quantifying the similarity between sets of terms and, in addition, takes into account the incompleteness of the prior biological knowledge. The existing approaches based on the average (Lord et al., 2003), the maximum (Schlicker et al., 2007), and the average of maxima (Sevilla et al., 2005) of the pairwise similarities have been proven as inadequate due to redundancy issues. Pandey et al. (2008) have generalized the information content measures based on the concept of non-redundancy: A set of terms S ⊆ C is said to be non-redundant if ci ≁ cj, for all
We point out that the approach proposed in Pandey et al. (2008) performs well if and only if each term from the ontology appears in at least one gene annotation. In the following section, we resolve this problem by defining non-redundancy recursively, thus including the ancestors of a term, and proceed with the generalizations of the existing and definition of new external structural measures. For instance, the two genes with annotations S4 = {c6,c7,c3,c0,r} and S6 = {c5,c2,c0,r}, according to the ontology shown in Figure 3, have semantic similarity of 0.73, since Λ(S4,S6) = ϒ ({c0, r}) = {c0} (c0 is more specific than r, and appears as a term in the annotation of 9 genes); hence, ρ(Su,Sv) = − log 2(9/15) = 0.73.
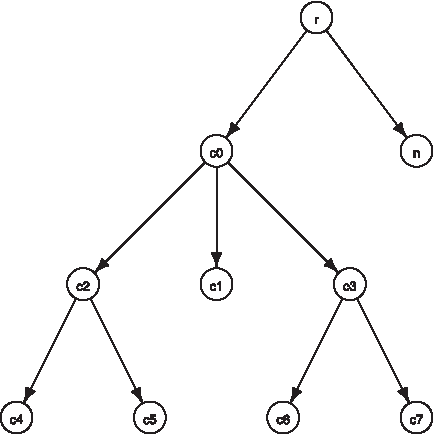
Sample ontology and annotations. Each node in the graph represents a GO term. The genes are annotated as follows: S1 = {c4, c6, c7, c2, c3, c0, r}, S2 = {c4, c2, c0, r}, S3 = {c4, c6, c2, c3, c0, r}, S4 = {c6, c7, c3, c0, r}, S5 = {c4, c3, c2, c0, r}, S6 = {c5, c2, c0, r}, S7 = {c6, c3, c0, r}, S8 = {c2, c0, r}, S9 = {c3, c0, r}, S10 = S11 = S12 = S13 = S14 = S15 = {n,r}.
2.3. External structural measures
With the “guilt-by-association” principle, one would expect that if two genes u and v appear in the same cluster, then their annotations should be highly similar. External measures lend themselves as a means for formalizing this principle by capturing the semantic similarity obtained from a given ontology of biological knowledge terms and a set of clusters resulting from the application of a chosen clustering algorithm. First, we review the advantages and disadvantages of two widely used external measures for biological validation and then propose a novel external structural measure which resolves the detected shortcomings.
The biological homogeneity index is a measure developed by Datta and Datta (2006) that is easy to interpret, as it captures the the clustering principle of homogeneous annotation. However, the current definition of the biological homogeneity index relies on an indicator function, assigning 0 or 1 depending on whether or not two genes share exactly the same set of annotation terms. Therefore, this measure cannot account for the similarity between sets of terms, i.e., it neglects a possible overlap between annotation terms and their structural dependencies imposed by a given ontology. Moreover, it has already been observed that this measure shows strong bias with respect to the number of clusters (Handl et al., 2005). We extend the definition of biological homogeneity index to include semantic similarity of terms and, furthermore, make it applicable to fuzzy clusterings (see online Supplementary Material at www.liebertonline.com).
Another external measure relying on mutual information was defined by Gibbons and Roth (2002). Their definition of mutual information assumes conditional independence of ontological terms, which is not the case for bioological ontologies. To arrive at this desired assumption, they break the dependencies by filtering for pairwise-dependent ontological terms. The major disadvantage of this approach is the reduction of the number of terms for a given data set, which reduces the available annotation and clearly limits the number of terms available for gene function prediction.
Contrary to the reviewed measures, ours relies on semantic similarity which reflects the dependence of ontological terms and is more suitable not only for biological evaluation but also for accurate gene function prediction.
Let Hw be the graph H whose edges are weighted with the semantic similarity of the respective end nodes (genes) by the measure ρ. Note that since some of the genes are not annotated,
Here, we propose a biological modularity index based on the idea of modularity as a measure of cluster quality (Brandes et al., 2007). Since modularity is independent of the number of clusters even on weighted networks (Fan et al., 2006), our biological modularity index also exhibits this property. Let
where Ew(Pi) is the sum of weights of intra-cluster edges for cluster Pi, degw(u) is the weighted degree of u in
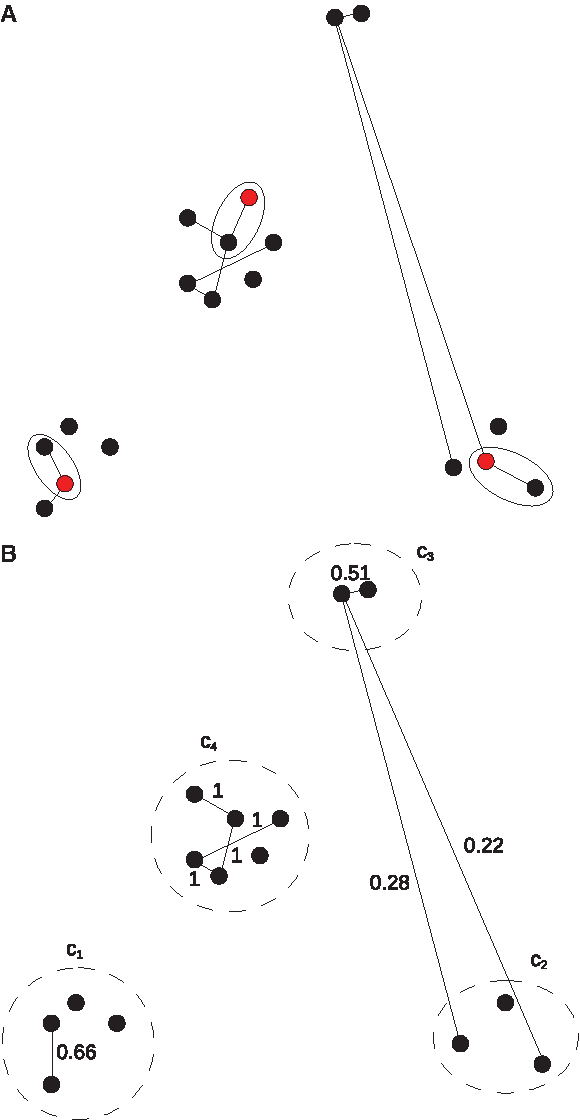
Graphs necessary for gene function prediction. (
2.4. Function prediction from biological modularity evaluation
We use the proposed measure ηBM to devise an efficient local greedy algorithm for gene function prediction which employs the graphs H, a clustering P, and the ordered list
In scenario (i), if all neighbors of x in Pu are annotated, then the annotation of gene x would be the one that minimizes degw(x), the weighted degree of x. Note that if scenario (ii) cannot be carried out, then either the existence of such x is guaranteed, or there are no nodes left for annotation. The problem of determining an annotation of x with the described properties is equivalent to that of determining the consensus set of terms, Sx, which maximizes the semantic similarity to the set S of annotations for the neighbors of x,
For scenario (ii), let us assume that x is in the boundary of clusters Pu separating it from cluster Pv. If all the neighbors of x in Pu and Pv are annotated, the annotation of gene x would be the one that minimizes the degree degw(x) with respect to Pu, while maximizing degw(x) with respect to Pv. As in scenario (i), the consensus set of terms for x can be determined by the following three-step procedure: (1) find ϒ(S), the trim of
The proposed procedures for (i) and (ii) are repeatedly executed until all nodes are annotated; in the case when either one of the scenarios apply, the tie is broken arbitrarily. Note that the only non-deterministic steps of the algorithm are result of the input list L of contracted edges and the way in which ties are broken in applying the scenarios. The latter issue can be resolved by enforcing that the first edge in the list L to which one of the scenarios applies is the one to the annotated. We address the first issue by repeatedly contracting edges between internal nodes, with respect to any cluster, followed by edge-contraction from the neighborhood of the internal nodes toward the boundary of a particular cluster; finally, the edges incident on the cut which yields the clustering are the last to be contracted.
2.5. Data sets
To validate our proposed method for estimation of the number of clusters, we used two approaches for generating synthetic data sets. In the first, we employed a subset of the 160 data sets synthetically generated with the help of Gaussian and Ellipsoid generators, published in Handl and Knowles (2007). We made use of these synthetic data sets, as the exact number of clusters is known and obscured by adding noise to the multidimensional data points. The added noise can account for the two “types” of noise present in microarray gene expression data: (1) biological noise due to the stochasticity of biochemical processes or variation of cells, depending on internal states of the population, which may contribute to phenotypic variability (Raser and O'Shea, 2005) and (2) technical noise by the experimental technique arising from differences in sample preparation and experiment variables which include nonspecific cross hybridization, differences in the efficiency of labeling reactions, and production differences between microarrays (Tu et al., 2002).
We then randomly created 700 data sets, produced with the R package clusterGeneration (Joe, 2006; Milligan, 1985), to compare our method of cluster number estimation with the silhouette width index. These clusters were then equally distributed among seven groups of noise (0–5%, 6–10%, 11–15%, 16–20%, 21–25%, 26–30%, 31–40%) arising from varying: degrees of spatial separation, cluster sizes, and data dimensionality (from 2 to 15 dimensions), and a correct number of clusters in the range
Moreover, to exemplify the cluster number estimation approach, we also made use of the Iris data set—a common data mining benchmark—which consists of 50 samples from each of three species of Iris flowers (Iris setosa, Iris virginica and Iris versicolor); therefore, this data set has three clusters. Four features are measured from each sample—the length and the width of sepal and petal.
We also used a publicly available gene expression data for yeast together with their functional annotation to test and validate the proposed multilayer framework. This data set, published by Cho et al. (1998), shows the fluctuation of ∼6000 genes in yeast over approximately 2 cell cycles (160 minutes) over 17 time points taken at 10 minutes intervals. In the study of Yeung et al. (2001), a subset of 384 genes is adopted, and used here for comparison. We first pre-processed this data set by removing two time points (90 and 100 minutes), as they were found to be unreliable as reported by Tavazoie et al. (1999). After this modification, there are 15 time points left for analysis. In addition, we analyzed an expression data set for Arabidopsis not only to test the proposed measure for biological evaluation of clustering, but also to draw hypothesis about putative gene functions of yet unannotated genes. Our proposed prediction method was validated on a transcriptome data set from 92 experiments performed on Arabidopsis thaliana accession C24 as well as ecotypes Col, Kas-1, Ler, and Mt-0 grown under 16-hour-long-day conditions. The experimental conditions involved varying light conditions and nutrient concentrations. Transcript profiling was performed using the Arabidopsis Affymetrix ATH1 array (Redman et al., 2004).
3. Results
First, we present the results pertaining to the estimation of the number of clusters. For the Iris data set, Figure 5A, over 100 repetitions, the frequency of estimating the true number of clusters (k = 3) is the highest (45%), while the second best estimation is k = 4 with frequency of 20%. The estimated number of clusters for the yeast data set is shown in Figure 5B. Note that five clusters occur with the highest frequency of 36%, which is in accordance with the biological expectation, as the data set comes from yeast cell cycle with five phases: early G1, late G1, S, G2, and M. For the Arabidopsis data set, which is less well characterized, our method produces four clusters with frequency of 42%, as show in Figure 5C.
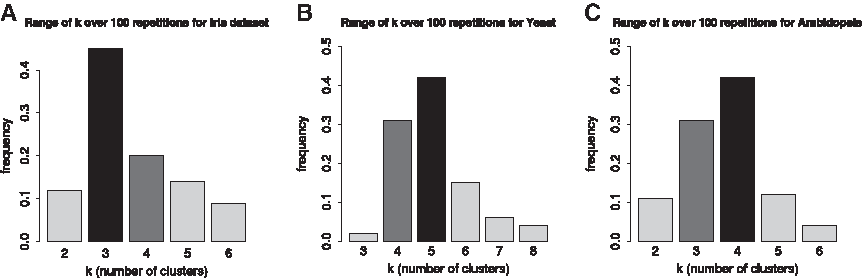
Cluster number estimation. (
The comparison of the results for the 700 synthetic data sets with our method for cluster number estimation and the silhouette width index is shown in Figure 6. It can be observed that with the increasing level of noise, our method performs consistently better in comparison to the silhouette index. The noise in the data sets represents the fraction of data points uniformly distributed across the data set. To test the hypothesis that our method performs better than the silhouette width index, we employed Wilcoxon rank sum test, with results as shown in Table 1: For the first three groups of noise, no statistical significant difference of means is observed; however, with increasing levels of noise, the improvement provided by our method becomes significant. This is precisely due to the fact that our method strongly relies on identifying and extracting nodes from dense regions in the graph-theoretic abstraction of the data. Moreover, the median of the difference between the number of clusters of highest frequency estimated with our method and the correct number of clusters is between 0 and 1 (except for the fist group with 0–5%, where the short probabilistic range included the correct number of clusters). We point out that even under such strict comparison method (where the most frequent value for the number of clusters is used), our method also produces smaller standard deviation as compared to the silhouette index.
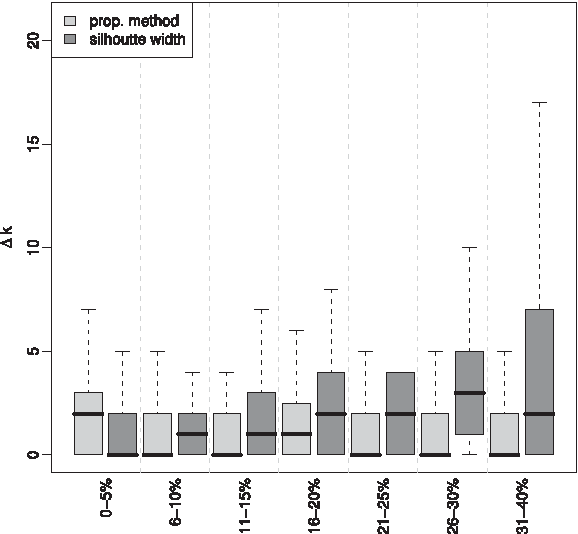
Cluster number and noise. Comparison of the proposed method for cluster number estimation and the Silhouette width index at different levels of noise in synthetic data sets.
The p-values from the Wilcoxon rank sum test for difference between the the means of the difference for the estimated and the correct number of clusters for the silhouette index (first column) and our method (second column) are shown in the third column. Our method provides better estimate at an increased level of noise. For the noise levels not included in this table, no significant difference between the two methods was found.
The biological modularity index, mutual information, and the biological homogeneity index for the yeast data set are shown in Figure 7A–C, respectively, for six clustering algorithms: N
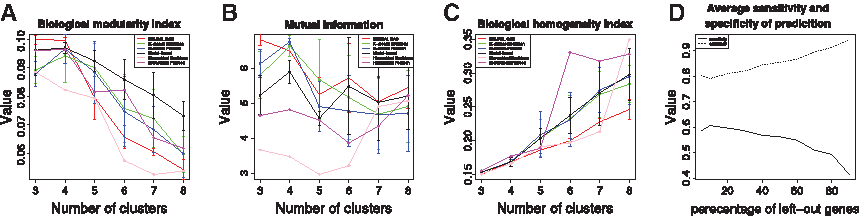
Yeast: external structural measures. (
The biological modularity index, mutual information, and the biological homogeneity index for the Arabidopsis data set are shown in Figure 8A–C, respectively, for the same clustering algorithms used in the analysis of the yeast data set. We note that the biological homogeneity index shows no clear indication of an optimal value, with the sole exception of N
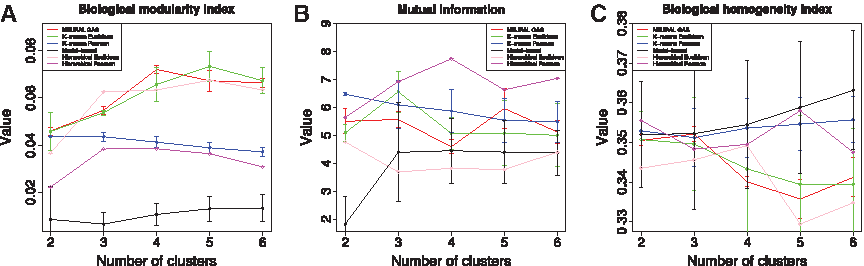
Arabidopsis: external structural measures. (
One can easily observe that these external structural indices can also be used for ranking and, therefore, a selection, of clustering algorithms. The ranking can be done in terms of consistently higher values for a chosen index and an interval for the number of clusters. For instance, for the biological modularity index, with the yeast data set, the algorithms are ranked from best- to worst- performing for k ≥ 4 as follows: Model-based, K-means with Euclidean distance, K-means with Pearson correlation, hierarchical clustering with Pearson correlation, N
We also use the Arabidopsis data set, Figure 8A, to point out another strength of our biological modularity index; namely, that the assumptions on the structure of the data and optimization criterion used in the design of a clustering algorithm as well as the employed similarity measure is clearly reflected in the value of the index. For instance, the consistently higher values for the index in the case of the clustering algorithms based on Euclidean distance as a similarity measure and the almost equal performance of the Pearson-correlation-based algorithms illustrate this point. Moreover, the worst performance of the Model-based clustering hints that the analyzed Arabidopsis data set does not support a Gaussian mixture model. The opposite effect can be seen on the yeast data set (Fig. 7A).
The tendency of the biological modularity index to reach its optimal value in the probabilistic range for the number of clusters is an indication that any gene function prediction method should employ such external structural index. The biological modularity index directly lends itself to devising such prediction method, while reinforcing the selection of an algorithm and the resulting clustering which can lead to optimal reflection of the biological knowledge present in an analyzed data set. The sensitivity and specificity of the prediction when a fraction of genes in the range of 5–90% is left out (i.e., they are considered as unannotated) at random is presented in Figure 7D for the yeast data set. Moreover, the sensitivity and specificity of the leave-one-out validation results in average sensitivity of 0.6212 and average specificity of 0.7927 for our prediction method. We observe that the decrease of sensitivity with the increase in the fraction of unannotated genes is coupled with equally large increase in the specificity. Such behavior is explained by the observation that the number of false-positive predictions decreases rapidly, while the number of true-positives decreases rather slightly—a desired property of any gene-function prediction algorithm.
From the Arabidopsis data set, we selected a subset of 1026 genes, with 911 annotated and 115 unannotated genes, i.e., roughly 10% of the genes have not been assigned a function. The selection was performed based on high variance of the gene expression profiles across experimental conditions. The choice for the number of genes coincides with the observation about sensitivity on the yeast data set, for which the aforementioned obtains the highest value. The analysis of the gene expression data yielded a probabilistic range for the number of clusters shown in Fig. 5 (C), from where one can conclude that the clustering algorithm of choice should capture k = 4 clusters. However, the inspection of the biological modularity index indicated that the optimal (maximum) value is obtained for the K-means algorithm with Euclidean distance at k = 5 clusters, as shown in Figure 8A (observe that this is also the highest value of the index over all algorithms in the entire probabilistic range for the number of clusters). Therefore, K-means with five clusters was used in the prediction of the unannotated genes (the cluster size distribution is highly skewed with one giant cluster, ∼76% genes, and four smaller clusters of almost equal size). Here, we do not consider the performance of the other two indices, since our proposed prediction method directly aims at maximizing the biological modularity index.
Our method was capable to predict specific annotations (other than the trivial “molecular function” term) for each of the 115 unannotated genes. To illustrate the power of our framework for predicting gene functions from biological evaluation, here, we present, as a showcase, the predictions for three genes:
(1) At3g22060, for which the Arabidopsis Information Resource (TAIR) classifies this gene as protein-coding and “receptor-like protein kinase-related.” Plant cells often use receptors at the cell surface to sense environmental changes, and then transduce this information via activated signaling pathways to trigger adaptive responses (Morris and Walker, 2003). In Arabidopsis, the members of the receptor-like protein kinase family most likely respond to external challenges. Our prediction for the function of At3g22060 includes: substrate-specific channel activity (GO:022838), substrate-specific transmembrane transporter activity (GO:0022891), calcium-ion transmembrane transporter activity (GO:0015085), ATPase activity, coupled to movement of substances (GO:0043492), ion and cation channel activity (GO:0005261 and GO:0008324). (2) At3g26470, for which TAIR claims to be similar to ADR1-L1 (ADR1-LIKE 1), ATP binding/protein binding. Our prediction for the function of At3g26470 includes: binding (GO:0005488), nucleotide binding (GO:0000166), transferase activity, transferring phosphorus-containing groups (GO:0016772). (3) At3g20430, for which TAIR claims to be similar to Mediator of U snRNA nuclear export PHAX (ISS) in Ostreococcus tauri, whose phosphorylation is essential for export complex assembly while its dephosphorylation causes export complex disassembly (Ohno et al., 2000). Our prediction for this example gene includes nucleotide binding (GO:0000166), RNA binding (GO:0003723), phosphoprotein phosphatase activity (GO:0004721), 5S rRNA binding (GO:0008097), and cytoskeletal protein binding (GO:0008092).
4. Discussion
We have proposed a comprehensive framework for gene function prediction from biological cluster evaluation which relies on availability of transcriptome data. Our framework overcomes the bottlenecks of the existing approaches and, in an innovative fashion, integrates biological knowledge, structured in terms of a given ontology, with clusters whose number falls in a short, well-determined probabilistic range. The probabilistic range for the number of clusters is estimated based on a novel minimum spanning tree method, while biologically meaningful evaluation of the clusters is performed in terms of a proposed external structural measure. Moreover, our approach allows for propagation of statistical significance across all steps of the framework, which in turn is used for selecting a clustering algorithm of optimal score, with respect to the proposed indices, and predicting putative gene functions.
While classical approaches for topological evaluation of clusters in order to find an optimal clustering rely on employing various internal structural indices on a clustering from a chosen clustering algorithm, our proposed method for obtaining a small probabilistic range for the number of clusters is independent of a clustering algorithm and indices. Therefore, by applying our method, one can overcome the first bottleneck in the current framework for biological evaluation of clusters, i.e., the parameter selection. Moreover, one can test more clustering algorithms as the computation time of the probabilistic interval is small compared to running the selected algorithm on blindly chosen values for the number of clusters (as one of the most important parameters in many widely used clustering algorithms), thus addressing the scalability of the framework in terms of selection of algorithms for testing.
In addition, the classical approaches rely on employing entire gene expression data sets, which often exhibit high degree of noise. As a result, the performance of the classical approaches can be hindered by the very nature of the gene expression data. On the other hand, our approach incorporates the presence of noise by identifying and extracting homogeneous dense regions from the data sets, later used in the estimation of the probabilistic range for the number of clusters.
In terms of the external structural measures, we compared and contrasted three indices: our biological modularity index, mutual information, and the biological homogeneity index. Of these three measures, the biological homogeneity index shows the worst performance both, in being biased towards fine-grained clustering despite of the used clustering algorithm and consistently high standard deviation which makes it impossible to identify a clear trend in its behavior. On the other hand, the index based on mutual information and our biological modularity index exhibit trends often in the vicinity of the most likely number of clusters identified by our previously described method. While the strength of the mutual information lies in its ability to capture non-linear dependencies of ontological terms and clustering results, it may be biased by the small number of used terms due to the preliminary filtering step to break the dependencies. For instance, the filtering reduced the number of originally present 457 GO molecular function terms for the yeast data set (with 363 genes) to merely 51 terms. For the Arabidopsis data set, the number reduces from 712 unique GO molecular function terms to only 52. While the dependencies between ontological terms may be overcome by reconsidering the definition of the index in terms of conditional mutual information, its computation would be time- and space-consuming. Therefore, its usage for gene function prediction remains questionable. However, for the purpose of cluster evaluation, a small number of dominant function seems to be sufficient (Steuer et al., 2006).
The proposed biological modularity index reaches a maximum value within the predicted range for the number of clusters. Moreover, the standard deviation for the biological modularity index remains stable over the probabilistic range and the set of employed clustering algorithms, while both, the biological homogeneity index and mutual information, show much higher standard deviation with more fine-grained clustering. As defined, our biological modularity index compensates for the need of having a prior null distribution for random clustering of genes with a given set of annotations and is, therefore, not affected by fine-grained clustering. The small standard deviation as well as the usage of the entire ontology render our index a better alternative for ranking and selection of clustering algorithms based on their ability to produce biologically meaningful clusters, as illustrated on the data sets from yeast and Arabidopsis. The ranking is done it terms of consistently higher values for a chosen index and an interval for the number of clusters. Therefore, all our findings warrant careful selection of clustering algorithms, since no general guidelines seem to be applicable to gene expression data from different organisms, tissues, conditions, and temporal resolution of the experiments.
The tendency of the biological modularity index to reach its optimal value in the probabilistic range for the number of clusters is an indication that any gene function prediction method should employ such external structural index. The completion of the whole genome sequences of model plants, such as Arabidopsis thaliana and rice, paves the way toward resolving the challenges of modern plant biology. In Arabidopsis thaliana, ∼27000 genes were predicted based on nucleotide sequence information; however, only half of these genes have been functionally annotated based on sequence similarity to known genes, while the function of mere 11% has been experimentally confirmed (MASC, 2007; Saito et al., 2008). On the other hand, from the ∼6000 genes of the well-studied model organism Saccharomyces cerevisiae, around 1000 remain to be functionally annotated (Pena-Castillo and Hughes, 2007; Tian et al., 2008). Our initial prediction from the Arabidopsis data set and the sensitivity and specificity of the method on the yeast data set provide first promising results of the strengths combined in the general framework proposed in this study.
The slight discrepancy between what is supported by data and what can be determined from the existing biological knowledge supports the data-driven nature of our approach and demonstrates that it can be used to extract novel biological knowledge by integrating data with ontologies.“Guilt-by-association” can only be understood as a general principle which does not necessarily provide a one-to-one mapping between the function of the gene and its expression pattern. Moreover, we point out that any method relying on ontologically-structured biological knowledge ultimately depends on the quality of the used ontology and the correctness of the term assignment (for gene annotation), an issue requiring further investigations. However, we believe that by combining the genes into clusters in terms of the similarity between their expression patterns and further imposing the structured biological knowledge about their function, one can arrive at novel predictions and optimal biologically-meaningful gene clusterings. We envision that the proposed general framework, overcoming the detected shortcomings of the existing approaches, can be effective in gleaning better understanding of other complex biological systems, such as cancers and higher organisms, which require a systems biology approach relying strongly on marrying off data and knowledge.
Footnotes
Acknowledgments
We would like to acknowledge Prof. Lothar Willmitzer and Dr. Matthew Hannah from Max-Planck Institute for Molecular Plant Physiology for kindly providing the Arabidopsis thaliana data set.
Disclosure Statement
No competing financial interests exist.
References
Supplementary Material
Please find the following supplemental material available below.
For Open Access articles published under a Creative Commons License, all supplemental material carries the same license as the article it is associated with.
For non-Open Access articles published, all supplemental material carries a non-exclusive license, and permission requests for re-use of supplemental material or any part of supplemental material shall be sent directly to the copyright owner as specified in the copyright notice associated with the article.