
Abstract
Background:
Although adolescents with obesity have an increased risk of cardiometabolic disease, a subset maintains a healthy cardiometabolic profile. Unhealthy lifestyle behaviors may determine cardiometabolic risk. We aimed to characterize the lifestyle behaviors of adolescents with obesity, compare differences between metabolically healthy obesity (MHO) and metabolically unhealthy obesity (MUO), and assess associations between lifestyle behaviors and cardiometabolic profiles.
Methods:
Participants aged 10–18 years with body mass index (BMI) ≥ 95th percentile were included. Dietary intake (DI) was estimated from 3-day food records, and diet quality (DQ) was assessed using the Healthy Eating Index-Canadian Adaptation. Physical activity (PA), body composition, anthropometrics, blood markers, and blood pressure (BP) were objectively measured. MUO was defined as having high triglycerides, BP, glucose, or low high-density lipoprotein. Regression analyses were performed between lifestyle behaviors and cardiometabolic markers.
Results:
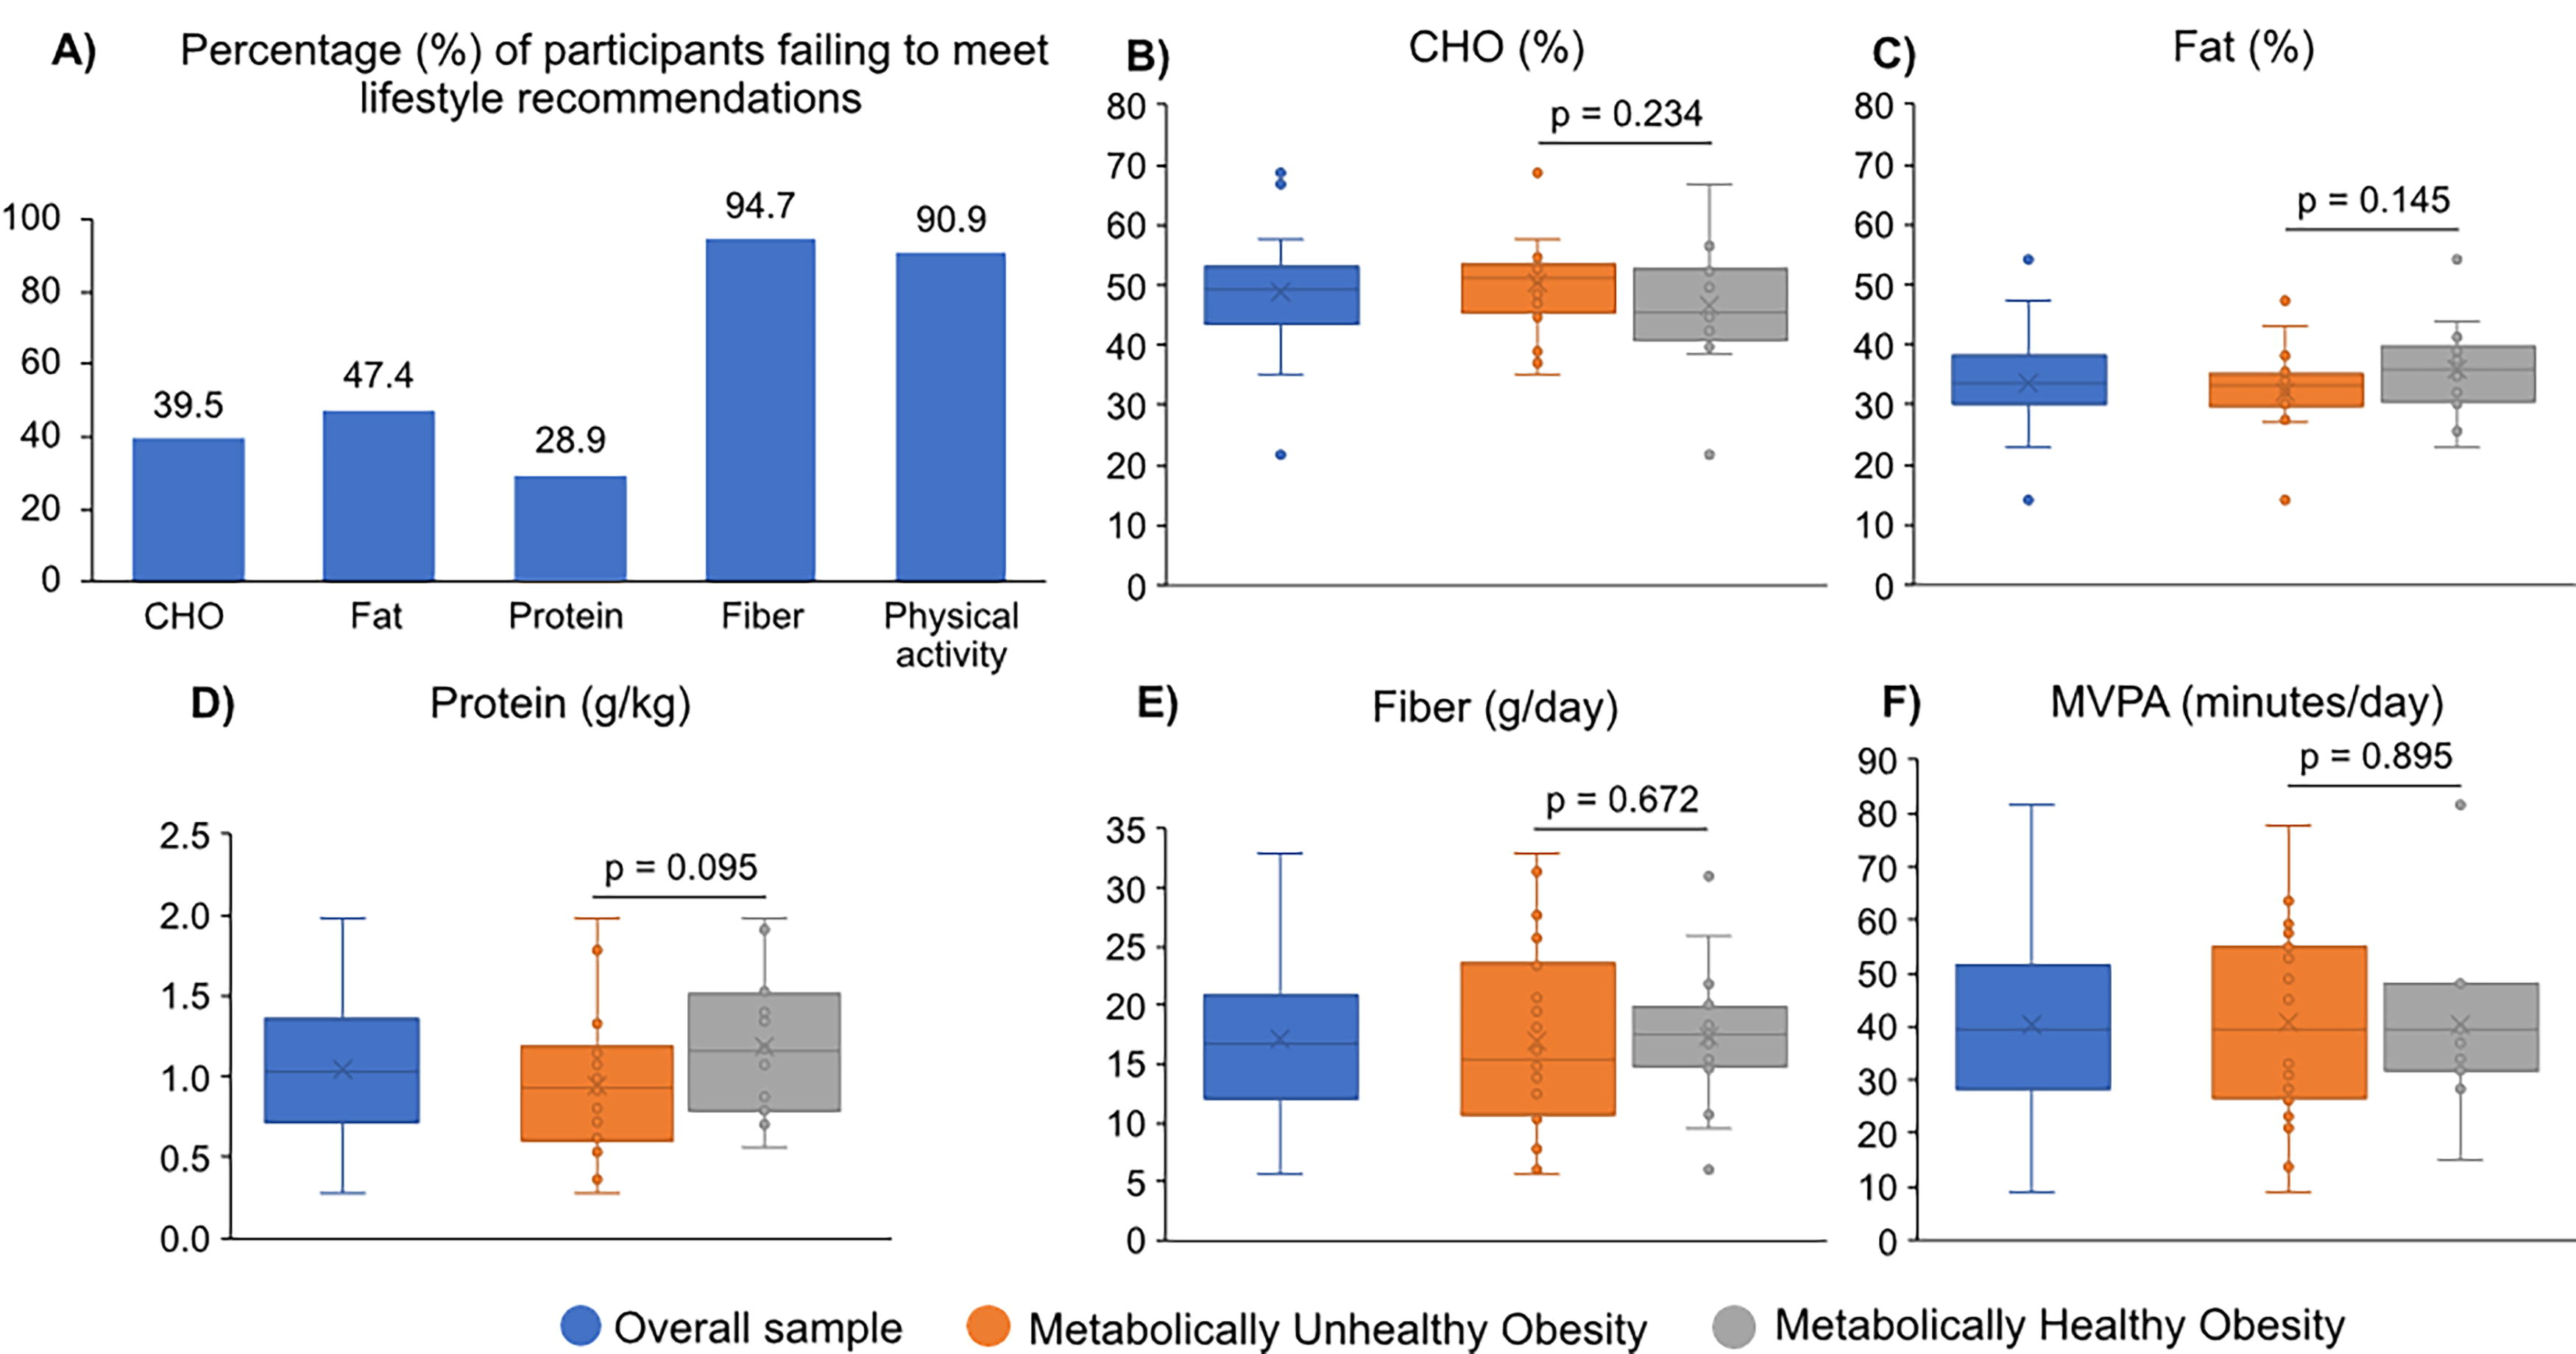
Thirty-nine participants (BMI z-score 2.8 [2.5–3.5], age 12.5 [10.9–13.5] years, 56.4% female) were included. A high proportion of participants failed to meet lifestyle recommendations, particularly for DQ (94.7%, n = 36), fiber (94.7%, n = 36), and PA (90.9%, n = 30). No differences in lifestyle behaviors were found between MUO (59.0%, n = 22) and MHO (41.0%, n = 16). Protein intake was negatively associated with BMI and waist circumference z-scores, fat mass index, insulin resistance, low-density lipoprotein, and C-reactive protein, whereas higher DQ was associated with lower C-reactive protein. Higher light PA levels were associated with lower total cholesterol and triglycerides.
Conclusion:
Adolescents with either MUO or MHO displayed low adherence to DQ, DI, and PA recommendations; no differences in lifestyle behaviors were found. Protein intake, DQ, and PA were associated with a healthier cardiometabolic profile.
Introduction
Adolescents with obesity are more likely to develop cardiometabolic diseases than those without obesity.1,2 A subset within this group exhibits a healthy cardiometabolic profile despite having obesity, known as metabolically healthy obesity (MHO). Individuals with MHO commonly have normal glucose tolerance, blood pressure (BP), lipids, hormonal profiles, liver enzymes, lower abdominal fat, and higher adiponectin concentrations.3,4 Differences in cardiometabolic health among adolescents with obesity may be attributed to several factors, with unhealthy lifestyle behaviors emerging as important determinants.5–7
Healthy dietary intake (DI) is a research focal point on MHO. Increased skim milk and fruit consumption have been associated with MHO in Canadians aged 2–17 years. 8 Similarly, Asian adolescents with MHO tend to consume more whole grains and polyunsaturated fat, whereas a high intake of deep-fried, fast food, and processed convenience food is associated with higher BP. 9 Furthermore, a high-quality diet (i.e., greater milk intake and less solid fats and added sugars) was observed in those with fewer cardiometabolic risk factors than in those with metabolically unhealthy obesity (MUO). 10 Longitudinal studies have reinforced the possible protective role of fruit and vegetable consumption against the transition from metabolically healthy to unhealthy states. 11 Notably, the evaluation of nutritional density in the diets of adolescents with MHO is underexplored. This presents an opportunity to explore potential protective nutritional strategies against the adverse health effects of obesity onset in adolescents.
Physical inactivity in adolescents is prevalent globally, with over 80% failing to meet current physical activity (PA) guidelines. 12 The Canadian Health Measures Survey included 975 adolescents aged 12–17 years and found an average of 49.7 minutes/day of moderate-to-vigorous PA (MVPA); only 23.1% met the minimum PA recommendations. Notably, PA self-reporting was poorly correlated with accelerometer measurements, highlighting the importance of objectively measuring PA. 13 Engaging in a minimum of 60 minutes of daily PA is associated with MHO in adolescents. 8 Thus, PA is highlighted as a strategy to reduce cardiometabolic abnormalities and disease risk in adolescents.14,15
Considering the adverse effects of unhealthy DI and low PA levels on the cardiometabolic health of adolescents with obesity, especially their interplay with MHO and MUO status, comprehensive research is essential to understand the complex dynamics among these factors. Thus, the objectives of this study were to characterize the lifestyle behaviors of adolescents with obesity and to compare differences between MHO and MUO status. In addition, we evaluated associations between lifestyle behaviors and the cardiometabolic profile.
Materials and Methods
Study Design and Participants
This is a secondary analysis of a cross-sectional study described elsewhere. 16 We employed a convenience sampling strategy; the initial sample size calculated for the primary outcome of the main study was not achieved due to the COVID-19 pandemic. The study included participants aged 10–18 years with obesity, defined as a body mass index (BMI) ≥95th percentile for age and sex. 17 Exclusion criteria included chronic diseases linked to obesity, use of medications known to affect body composition (e.g., metformin, corticosteroids, glucagon-like peptide 1 receptor agonists), impaired muscle mass (e.g., muscular dystrophy, neuromuscular diseases), acute infections, pregnancy, or lactation. The study was approved by the local Health Research Ethics Board (Pro00082135) in Edmonton, Alberta, Canada, and was completed following the Declaration of Helsinki, as revised in 2013. All participants and their parents signed an assent or informed consent, respectively.
Demographic and Clinical Variables
Demographic variables included age, sex, and race/ethnicity. Parents completed a medical history questionnaire, and participants self-reported their sexual maturation using a questionnaire. 18 Pubertal stages were categorized as pre-early (Tanner stages 1–2) or mid-late puberty (Tanner stages 3–5).
Dietary Intake (DI)
Participants completed a 3-day food record encompassing two weekdays and one weekend day. They were instructed on how to record DI and measure food proportions; food records were reviewed with participants and their parents upon receipt. Food records were entered into Food Processor SQL (v. 11.0.124, ESHA Research) to estimate average daily macronutrient and total energy intakes. The Canadian Nutrition File database was used as the main source for obtaining food nutrient content, whereas the United States Department of Agriculture Nutrient database or manufacturer’s food labels were used as alternatives.
Nutrient density was calculated as the average daily intake of macronutrients and fiber per 1,000 kcal. Total energy and protein intake were also adjusted for body weight. Participant data were compared to dietary reference intakes using age- and sex-appropriate references, including the acceptable macronutrient distribution range (AMDR; fat 25%–35%, carbohydrate 45%–65%), protein estimated average requirement (males 9–13 years, 0.76 g/kg; 14–18 years, 0.73 g/kg; females 9–13 years, 0.76 g/kg; 14–18 years, 0.71 g/kg), and fiber adequate intake (males 9–13 years, 31 g; 14–18 years, 38 g; females 9–18 years, 26 g). 19
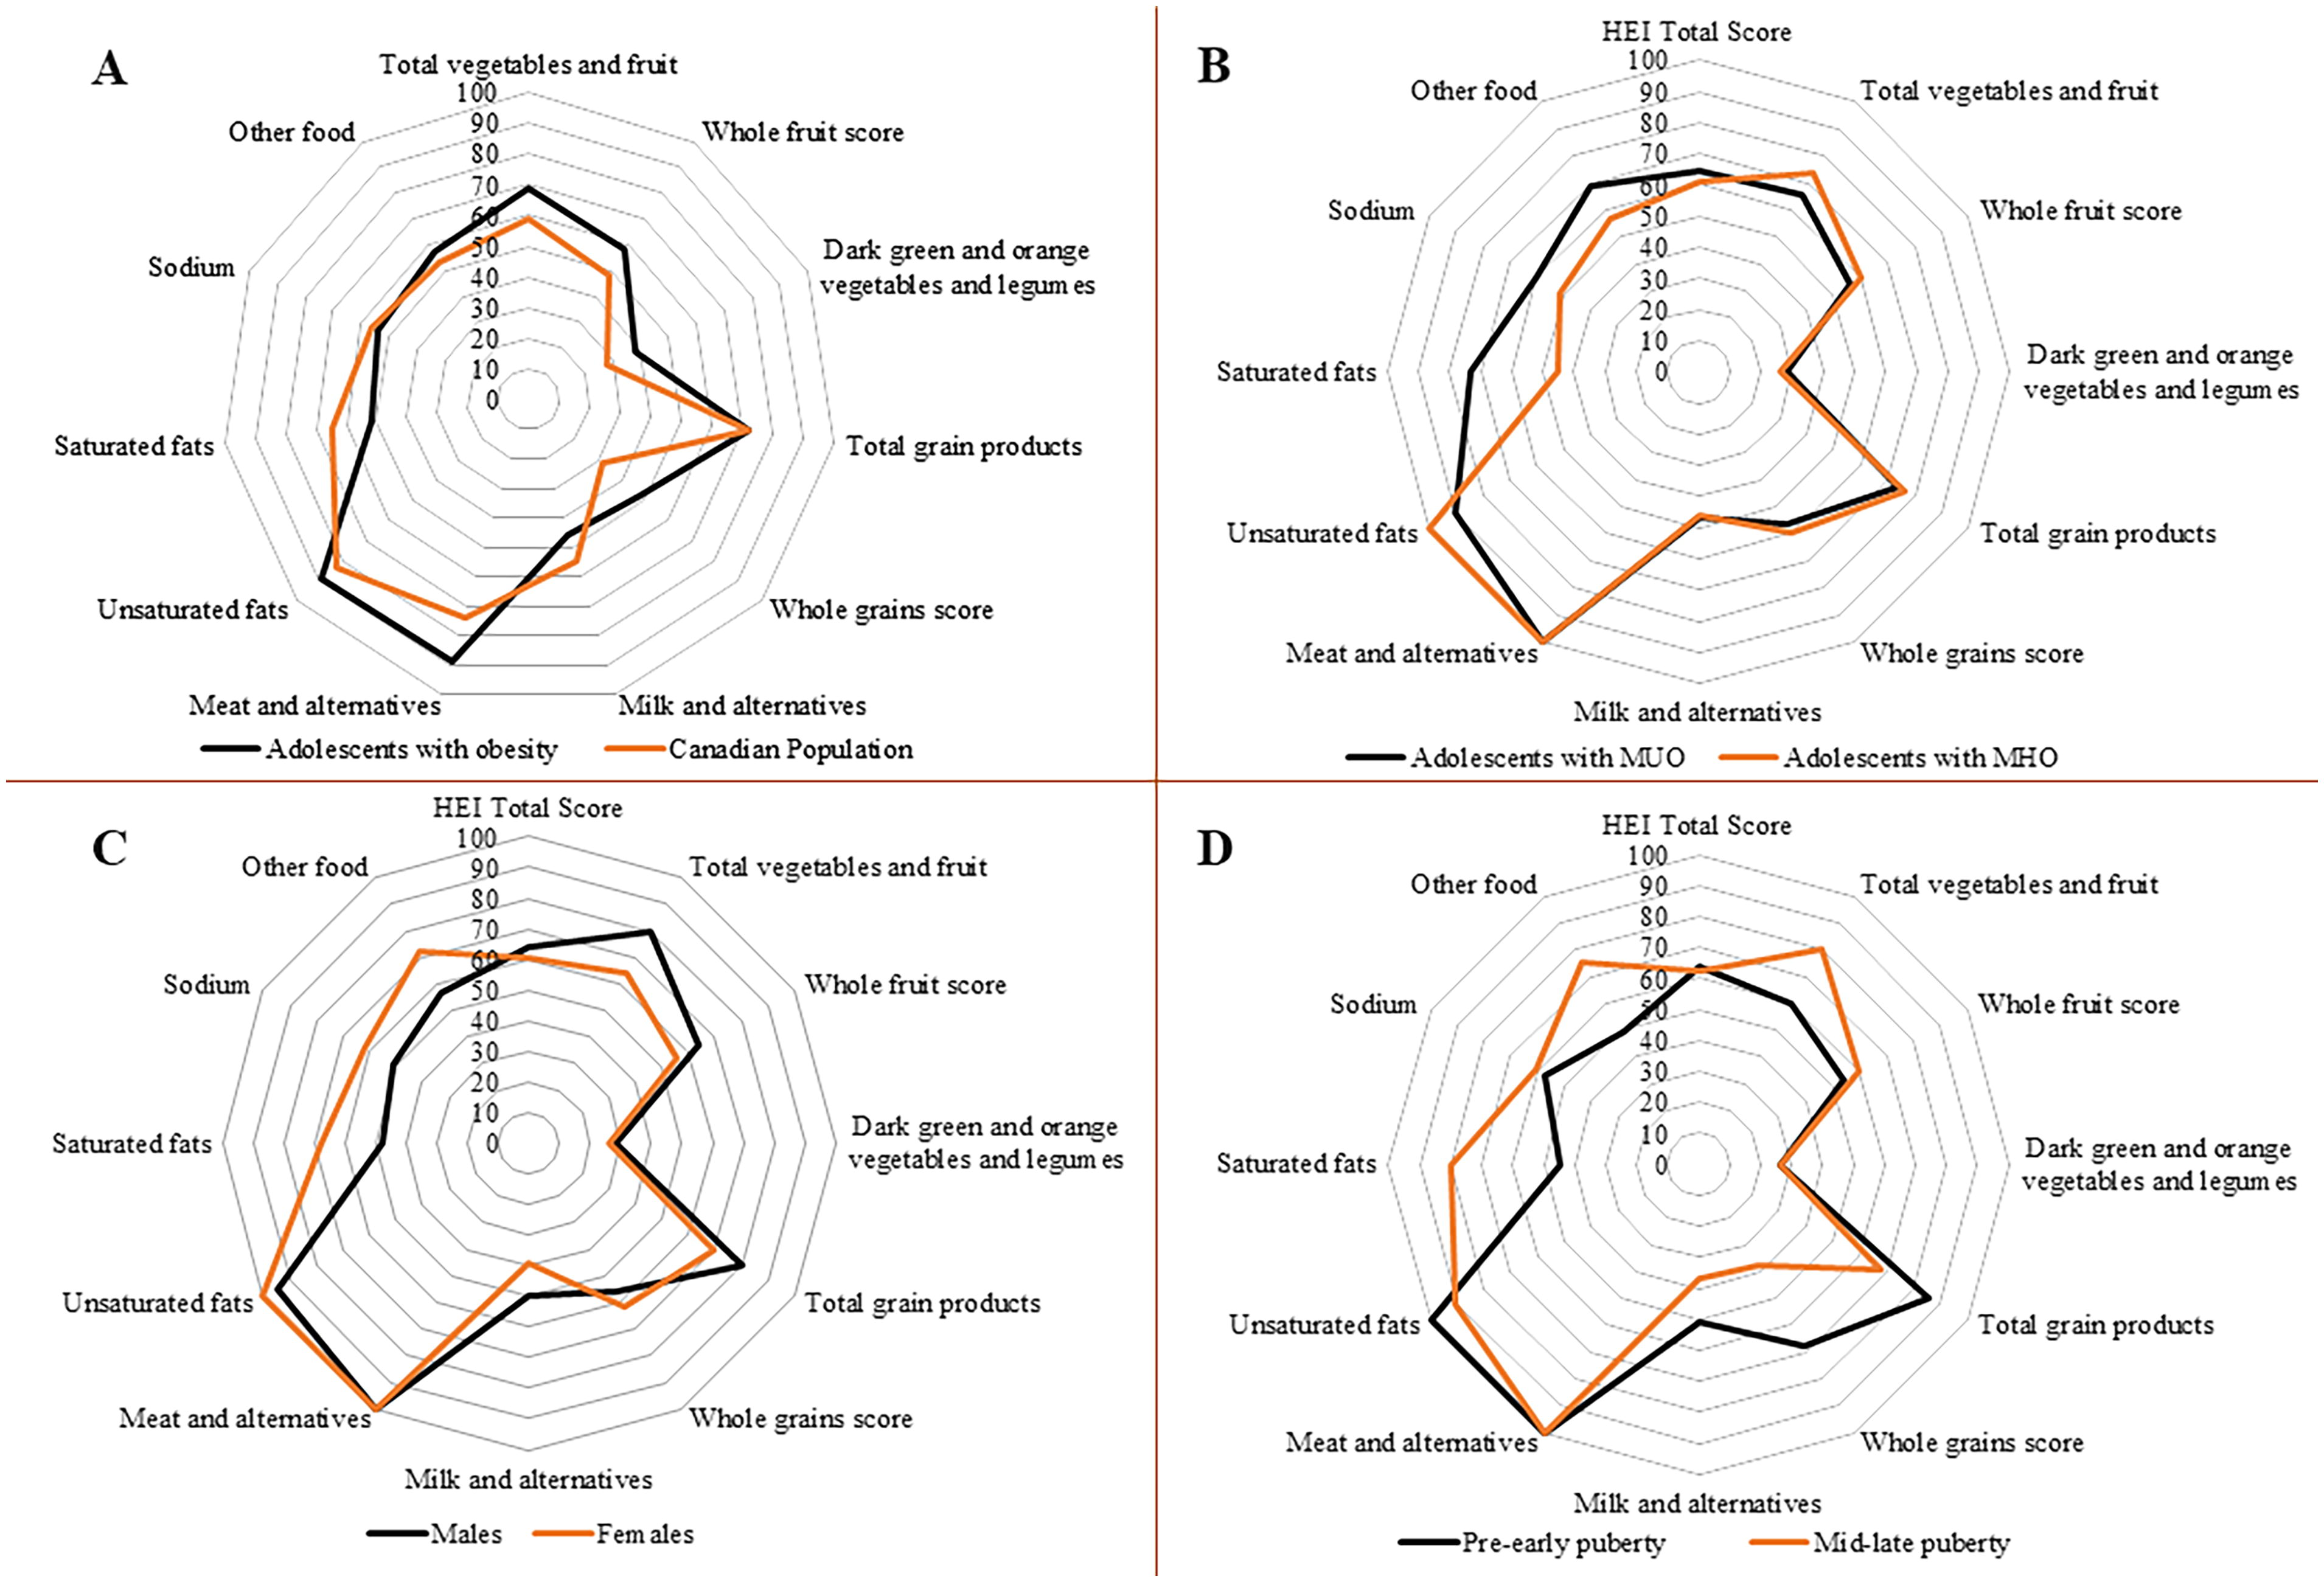
Diet quality (DQ) was calculated using the Health Eating Index (HEI) 2005-Canadian adaptation from the 2005 American Healthy Eating Index, and incorporated recommendations from the 2007 Canada’s Food Guide. 20 The final HEI score, ranging from 0–100 points, was calculated using eight adequacy and three moderation individual components. Adequacy components considered whether participants met recommendations for servings of 1) total vegetables and fruit, 2) whole fruit, 3) dark green and orange vegetables and legumes, 4) total grain products, 5) whole grains, 6) milk and alternatives (i.e., milk-derived products), 7) meat and alternatives, and 8) percentage of total energy from unsaturated fats. Meanwhile, the three moderation components were appraised in terms of restricting the intake of 1) saturated fats, 2) sodium, and 3) “other foods” (discretionary calories derived from foods not essential for health and not pertaining to the following groups: vegetables and fruit, milk products, meat and alternatives, and grain products). The proportional index scores for these components are graphically presented in a radar plot. Comparative analyses were conducted using reference data from the Canadian population. 20 The total HEI score was used to categorize DQ as good (>80 points) or needing improvement (≤80 points).
Physical Activity (PA)
PA was measured using a triaxial accelerometer (4MB GT3X; Actigraph, Pensacola, FL, USA) with an epoch length of 5 seconds. Participants were instructed to wear the device on their right hip attached to a belt over 7 consecutive days during all waking hours, excluding periods of bathing, showering, or swimming. After data acquisition, screening for valid days was conducted using ActiLife6 (v.6.13.4; ActiGraph, LLC, Pensacola, FL, USA). A valid day was defined as ≥10 hours of wear time, and ≥3 valid days were retained for analysis. Using average counts per minute as PA measure and the cut-off points proposed by Evenson et al., 21 accelerometry data were categorized into three intensity levels: sedentary behavior (<101), light intensity PA (101 to ≥2295), and MVPA (≥2296). Average time spent in each category during valid days was reported in minutes per day and as proportion of total wear time. Those who spent less than 60 minutes on MVPA/day were considered to not meet the recommended PA level. 22
Cardiometabolic Profile
Anthropometric and body composition measurements were obtained using standardized protocols. BMI z-scores were calculated using World Health Organization AnthroPlus (v.1.0.4; Geneva, Switzerland). Waist circumference (WC) was evaluated at the narrowest point between the xiphoid process and iliac crest, whereas hip circumference was measured at the widest part of the hips. WC z-score was computed using the Anthropometric Calculator for normal children aged 0–19 years (version: 2019/01/22). Waist-to-hip and waist-to-height ratios were determined by dividing WC by hip circumference and height, respectively. Body composition was assessed using air displacement plethysmography (Bod Pod® 1SB-060M, Life Measurement Instruments, Concord, CA, USA). Fat mass and fat-free mass were reported as both absolute and adjusted values (weight and/or height 2 ) 23 to account for body size variations.
Participants underwent a blood draw for fasting metabolic measurements, including high-density lipoprotein cholesterol (HDL-c), low-density lipoprotein cholesterol (LDL-c), total cholesterol, triglycerides, glucose, insulin, C-reactive protein (CRP), interleukin-6 (IL-6), and tumor necrosis factor-α (TNF-α). Detailed information regarding the collection and analysis of metabolic measures has been previously described. 16 Triplicate measurements of systolic and diastolic BP were obtained in a seated position, with cuff size adjustment and a 5-minute rest period, the data were converted to percentiles for age, sex, and height. 24
The following health conditions were assessed: insulin resistance (IR), dyslipidemia, hypertension, MUO, and metabolic syndrome. IR was defined as a homeostatic model assessment of insulin resistance (HOMA-IR) > 3.16. 25 Dyslipidemia was defined as having at least one of the following: LDL-c ≥ 130 mg/dL, triglycerides ≥ 130 mg/dL, HDL-c < 40 mg/dL, or taking medication(s) for dyslipidemia. 26 Hypertension was defined using age-specific cut-points for systolic and diastolic BP. 27 Using consensus-based criteria, MUO was defined as obesity in the presence of HDL-c ≤ 40 mg/dL, triglycerides > 150 mg/dL, systolic and diastolic BP ≥ 90th percentile, or glucose >100 mg/dL. MHO was defined as obesity in the absence of these abnormal metabolic markers for MUO. 3 Metabolic syndrome was defined by WC ≥ 90 percentile for age and sex and ≥ 2 of the following: glucose ≥ 100 mg/dL, HDL-c < 40 mg/dL, triglycerides ≥ 150 mg/dL, systolic/diastolic BP ≥ 130/85 mmHg. 28
Statistical Analysis
Data analyses were performed using Stata version 14.0 and SPSS version 29.0. Data are reported as median and interquartile range (25th–75th percentile) for continuous variables and frequency and percentage for categorical variables. A description of the sample has been presented previously. 16 Normality of the data was assessed using the Shapiro–Wilk test. Where appropriate, continuous variables were compared between participants with MUO and MHO using either Student’s t-test or Mann-Whitney U-test. Categorical variables were compared between groups using Chi-square or Fisher’s exact test. Associations between lifestyle behaviors and cardiometabolic profiles were investigated using linear or logistic regression analyses, as appropriate. Crude associations were reported (Model 1), and additional models were constructed with pubertal stage adjustment (pre-early vs. mid-late puberty; Model 2) as well as pubertal stages plus race/ethnicity adjustments (white vs. non-white; Model 3). Statistical significance was set at p < 0.05.
Results
Thirty-nine adolescents with obesity (BMI z-score 2.8 [2.5–3.5]) aged 12.5 (10.9–13.5) years, were included. Of note, one adolescent did not complete the food records, and six did not provide the minimum 3-day valid accelerometry data. The majority were white (55.3%), female (56.4%), and in mid-late puberty (59.0%); 23.7% were of Indigenous background. Cardiometabolic conditions were prevalent when analyzed in isolation: hypertension (28.2%), dyslipidemia (47.4%), and IR (63.2%), or in clusters (MUO, 59.0%). No differences were found between individuals with MUO and MHO regarding demographics, body composition, anthropometrics, and inflammatory markers (Table 1). Cardiometabolic parameters stratified by sex and pubertal stage are shown in Supplementary Tables S1 and S2.
Demographic, Family History, Health Status, and Cardiometabolic Parameters of Adolescents with Obesity, Overall Sample and Stratified by Metabolically Unhealthy (MUO) and Healthy Obesity (MHO)
Data are presented as median (interquartile range) or percentage (%).
Significant differences between MUO and MHO are highlighted in bold, p < 0.05.
p-values were obtained using the Student’s t-test.
p-values were obtained using the Chi-Square test.
p-values were obtained using the Chi-Square test comparing white and non-white.
p-values were obtained using the Fisher’s exact test.
p-values were obtained using the Mann–Witney U test.
No statistical difference between same-sex using Mann–Whitney U test.
CRP, C-reactive protein; HDL-c, high-density lipoprotein cholesterol; HOMA-IR, homeostatic model assessment for insulin resistance; IQR, interquartile range; LDL-c, low-density lipoprotein cholesterol; TNF-α, tumor necrosis factor-alpha.
A high proportion of participants did not meet nutrient recommendations for fat (AMDR, 47.4%) and carbohydrates (AMDR, 39.5%); majority of non-adherence was for excessive fat and low carbohydrate intake. Low protein (g/kg, 28.9%) and fiber (g/day, 94.7%) intakes were also observed (Table 2 and Fig. 1). Mid-late pubertal participants exhibited a higher failure rate in meeting protein intake recommendations than their pre-early counterparts (43.5% vs. 6.7%, p = 0.026, Supplementary Table S3).
Health Behaviors of Adolescents with Obesity, Overall Sample and Stratified by Metabolically Unhealthy (MUO) and Healthy Obesity (MHO)
Data is presented as median (interquartile range) or percentage (%).
p-values were obtained using the Student’s t-test.
p-values were obtained using the Mann–Witney U test.
p-values were obtained using the Fisher’s exact test.
p-values were obtained using the Chi-Square test.
Majority of non-adherence (15/18) was above fat recommendation range.
Majority of non-adherence (12/15) was below carbohydrate recommendation range.
AI, adequate intake fiber, males 9–13 years, 31 g; 14–18 years, 38 g; females 9–18 years, 26 g; AMDR, acceptable macronutrient distribution range fat 25%–35%, carbohydrate 45%–65%; EAR, estimated average requirement for protein males 9–13 years, 0.76 g/kg; 14–18 years, 0.73 g/kg; females 9–13 years, 0.76 g/kg; 14–18 years, 0.71 g/kg; MVPA, moderate-to-vigorous physical activity; PA, physical activity.
The DQ of the majority (94.7%) was classified as needing improvement, with an overall HEI score of 63.1 (53.7–69.4) (Fig. 2, Supplementary Table S4). HEI individual components with highest scores were “meat and alternatives” and “unsaturated fats,” whereas the lowest were “dark green and orange vegetables and legumes” and “milk and alternatives” (Fig. 2, Supplementary Table S4).
Most of our sample did not meet the minimal recommendations for PA (90.9%; Table 2, Fig. 1). Females presented with lower MVPA levels than males, whereas mid-late pubertal participants had lower light PA levels than pre-early pubertal participants (Supplementary Tables S3 and S5). No differences in DI, DQ, or PA were found between individuals with MUO and MHO (Table 2, Figs. 1 and 2).
Protein intake relative to weight was associated with a healthier cardiometabolic profile, even after adjustment for sexual maturation and race/ethnicity; for example, negative associations were found with anthropometric indices (BMI z-score, WC z-score, and waist-to-hip ratio), body fat (body fat percentage and fat mass index), and blood markers (insulin, HOMA-IR, LDL-c, and CRP) (Table 3). A higher proportion of carbohydrates in the diet relative to total energy intake was associated with a less favorable lipid profile (total cholesterol and LDL-c). In turn, a healthier carbohydrate intake (whole grain and total grain scores) was associated with a more favorable cardiometabolic profile (lower BMI z-score and glucose levels, respectively). Both saturated and polyunsaturated fat intake were associated with higher systolic BP (Table 3). After all adjustments, positive marginally significant associations (p = 0.05) were identified between saturated fat intake and hypertension diagnosis, and between polyunsaturated fat intake and dyslipidemia diagnosis (Table 4).
Linear Regression Analysis to Evaluate Associations between Lifestyle Behaviors (Independent Variables) and Cardiometabolic Risk Markers (Dependent Variables) in Adolescents with Obesity
CI, confidence interval; HEI, Healthy eating index; PA, physical activity.
Logistic Regression Analysis to Evaluate Associations between Lifestyle Behaviors (Independent Variables) and Metabolic Dysfunction Diagnosis (Dependent Variables) in Adolescents with Obesity
No significant findings were found for metabolically unhealthy obesity.
CI, confidence interval; OR, odds ratio.
A higher total DQ score was associated with lower concentrations of an inflammatory biomarker (CRP); however, this association was no longer significant when race/ethnicity was added to the model. Individual components of DQ, such as “milk and alternatives score” and “other food” score, were associated with lower waist-to-hip ratio and inflammation (IL-6, TNF-α), respectively. In contrast, higher “milk and alternatives” and “meat and alternatives” scores were associated with lower HDL-c (Table 3). Increased scores in “whole fruit” and “dark green and orange vegetables and legumes” components were positively associated with hypertension (Table 4).
Higher involvement in PA was associated with a more favorable lipid profile (total cholesterol and triglycerides) and lower waist-to-height ratio. Nonetheless, following adjustments for sexual maturation and race/ethnicity, the only remaining association was with total cholesterol (Table 3). Engaging in light PA was negatively associated with IR diagnosis. However, this association was no longer significant when sexual maturation and race/ethnicity were included in the model (Table 4).
Discussion
The purpose of our study was to characterize lifestyle behaviors of adolescents with obesity, compare differences between MHO and MUO status, and evaluate associations between lifestyle behaviors and the cardiometabolic profiles. In our sample, we found no differences between individuals with MUO and MHO regarding lifestyle behaviors, such as DI and quality, and PA. Independent of cardiometabolic conditions, a high proportion of adolescents with obesity did not meet recommended nutrient recommendations for macronutrients, and almost no one (>90%) for fiber intake, DQ, and PA recommendations. In general, estimated daily protein intake, DQ, and measured PA were associated with more optimal cardiometabolic profile related to blood markers, BP, body composition, and anthropometric indices.
It is well documented that DI and DQ are associated with cardiometabolic risk. MHO in adolescents has been positively associated with higher intakes of fruit, skim milk, whole grains, and polyunsaturated fat, while negatively associated with added sugar, solid fats, sugar-sweetened beverages, deep-fried foods, and processed convenience foods.8–10 Ultra-processed foods (UPFs), defined by the NOVA classification, 29 are commonly present in adolescent diets, making up as much as half of the total calories and contributing to low fiber ingestion. 30 UPFs are notable for their high added fructose content, which is associated with inflammation, lower adiponectin concentration, and leptin resistance; 31 the detrimental effects of UPFs persist regardless of overall DQ. 32 Accordingly, we found that a lower “other food” score, indicative of UPF consumption, was associated with a more pro-inflammatory state (i.e., higher IL-6 and TNF-α). Evaluating the overall DQ in a representative Canadian sample of adolescents (with and without obesity), Garriguet 20 found HEI average scores ranging from 54.3 to 60.0; less than 3% reached optimal scores of more than 80, comparable to our findings, which were close to 5%. Garriguet 20 found that females demonstrated higher DQ than males, 20 a finding not observed in our sample. In our sample the “dark green and orange vegetables and legumes” component reached the lowest individual score, which agreed with Garriguet. 20 Unexpectedly, the “dark green and orange vegetables and legumes” and “whole fruit” scores were positively associated with hypertension. These foods are important sources of vitamins, minerals, and fiber which promote health; 33 these adolescents are followed by a multidisciplinary clinic, and healthy eating advice is commonly provided which might have confounded these associations.
Unhealthy dietary habits are also prevalent in general adolescents regardless of their association with chronic diseases. Data derived from 20 different countries (n = 51,597, age 13–17 years) demonstrated that high consumption of fast foods, sugar-sweetened drinks, and low intake of fruits and vegetables ranged from 76.7% to 94.2%. 34 A 2-year cohort of 630 adolescents showed that every increase in portion ingestion of fruits/vegetables decreased the odds of converting MHO to MUO by 39%, which represents an important focus for targeted prevention and treatment of obesity during adolescence. In addition, a tendency for increased odds of converting MHO to MUO was observed for diets high in saturated fat and low in protein. 11
Among macronutrients, protein intake was associated with anthropometric indices, body composition, lipid and glucose control, and inflammation, suggesting a healthier cardiometabolic profile. Consumption of different proteins stimulates muscle protein synthesis and suppresses muscle protein breakdown, which may lead to improved body composition. 35 Lotfi et al. 36 evaluated 203 adolescents with overweight/obesity and found that the highest tertile of protein consumption presented lower odds of being classified with MUO, presenting improved BP, HOMA-IR, triglycerides, and HDL-c. Of note, higher protein intake in their study was compensated by a lower carbohydrate intake while maintaining similar values for fat. 36 Animal-derived proteins are a source of saturated fats; thus, healthier animal-protein choices, such as fish, eggs, and low-fat dairy might be indicated while treating obesity and obesity-related comorbidities in adolescents, alongside increasing plant-based protein sources. 37 Of note, the maximum protein intake within our sample was 2.0 g/kg, a value that falls within the recommended ranges for special populations. However, caution should be exercised regarding excessive protein intake. 38
Several reasons may explain why adolescents in our study did not meet nutrient and DQ recommendations; however, these were not collected in the current study. These include desirability, convenience, affordability, availability, sociodemographic factors, the built environment, media, and screen advertisements; all known to influence food choices and DI of adolescents.39,40 The inability to cook may affect the frequency of eating home-cooked meals with a more favorable DQ profile. 41 Lack of sleep may cause considerable increases in appetite and hunger, consequently increasing eating frequency, portion size, and snacking, which is a common habit in adolescence that can lead to weight gain.42,43
Adolescents who engage more in PA present lower cardiometabolic risk, such as improved insulin sensitivity, lipid profile, and weight control. 15 The Canadian guidelines for adolescents recommend at least 60 minutes/day of MVPA, a variety of light PA spread throughout the day, and a maximum of 2 hours/day of recreational screen time. 22 However, we found over 90% did not meet this recommendation, compared to 81.0% globally, 12 and 76.9% of Canadian general adolescents 13 ; with no stratification in terms of BMI or obesity status. Screen time is excessively present in the daily routine of adolescents, increasing the time spent on sedentary activities and hindering PA practice. 44 As observed in our study, females seem to be less engaged in PA than males. 12 A mix of psychosocial and biological factors may explain this, including weaker familial/school influences, less involvement in sports, higher body fat percentage, 45 and more exposure to weight bias/stigmatization. 46 In addition, similar to our findings, PA levels show a progressive decrease with age, and a whole systems approach involving shifts at the individual, environmental, social, and systems levels through cross-sectoral and multidisciplinary collaboration is needed to improve youth PA levels of all ages. 44
This study has some limitations. We used a convenience sampling strategy in a secondary analysis of data from a cross-sectional study; 16 thus, we might have been underpowered to answer some of the research questions. In addition, we found a high prevalence of adolescents failing to meet lifestyle recommendations, particularly for MVPA and fiber intake. Therefore, these associations should be interpreted with caution. DI is a subjective and patient-reported variable, and underreporting has been observed in adolescents with obesity. 47 Cardiometabolic risk and lifestyle behaviors are highly variable and impacted by social and ethnic backgrounds;48 however, we did not collect data regarding socioeconomic status. We did not include a group of participants with normal BMI, so we could not compare whether lifestyle factors differed according to obesity status.
On the other hand, this study has several strengths that are worth noting. We applied comprehensive assessment methods to minimize study bias, such as multiple dietary records on non-consecutive days; detailed nutrition education on how to report DI; and objective measures of PA, body composition, and cardiometabolic markers. We strived to include an ethnically diverse population, with similar distribution between sexes and a high number of Canadian Indigenous people; adjustment of the analyses for multiple confounding factors (i.e., sexual maturation and race/ethnicity) was also undertaken.
Conclusions
Adolescents with obesity with either healthy or unhealthy metabolic profiles showed low adherence to recommendations related to DI, DQ, and PA. No differences were found in lifestyle behaviors between MUO and MHO. Protein intake, DQ, and PA were positively associated with a healthier cardiometabolic profile in adolescents with obesity. Healthy nutrition and PA are essential foundations for cardiometabolic health during adolescence.
Impact Statement
Adolescents with either MHO or MUO showed low adherence to recommendations for DI (especially fiber), DQ (healthy eating index), and PA; no differences in lifestyle behaviors were found between groups. Protein intake, DQ, and PA were associated with a healthier cardiometabolic profile.
Footnotes
Acknowledgments
We thank Lucila Triador and Felicia Sim for their assistance with data collection, and Dr. Ming Ye for his statistical support.
Authors’ Contributions
C.E.O., C.M.P., and A.M.H. conceptualized the study and acquired funding. C.E.O., N.B., and R.D. collected the data. F.T.V. and C.E.O. co-led the formal analysis. F.T.V., C.E.O., C.M.P., and A.M.H. interpreted the data. F.T.V. and C.E.O. co-led the writing of the original draft. All authors were involved in reviewing and editing the article and provided final approval of the submitted and published versions.
Funding Information
This research has been funded by the generous support of the Stollery Children’s Hospital Foundation through the
Author Disclosure Statement
CEO has received honoraria from Abbott Nutrition. GDCB has served as a consultant for Novo Nordisk Canada. CJF serves on the Scientific Advisory Board for Dairy Farmers of Canada and By Heart and receives honoraria. CMP has previously received honoraria and/or paid consultancy from Abbott Nutrition, Nutricia, Nestlé Health Science, AMRA Medical, and Pfizer. AMH is on advisory boards for Rhythm Pharmaceuticals, Novo Nordisk Canada, and Pfizer Canada. She is a clinical trial investigator for Rhythm Pharmaceuticals, Levo Therapeutics, Acadia Pharmaceuticals, and Eli Lilly. The remaining authors declare that they have no conflicts of interest.
References
Supplementary Material
Please find the following supplemental material available below.
For Open Access articles published under a Creative Commons License, all supplemental material carries the same license as the article it is associated with.
For non-Open Access articles published, all supplemental material carries a non-exclusive license, and permission requests for re-use of supplemental material or any part of supplemental material shall be sent directly to the copyright owner as specified in the copyright notice associated with the article.