
Abstract
Abstract
Background:
This article describes the process and intermediate outcomes from a program implemented in 65 Early Care and Education (ECE) centers serving low-income families throughout Georgia during the 2014–2017 school years.
Methods:
The HealthMPowers' Empowering Healthy Choices in Schools, Homes, and Communities ECE program was based on the organization's previously successful elementary school program and aligns with current early childhood nutrition and physical activity recommendations. Participating centers worked with HealthMPowers for up to 3 years. A team from each center led changes by conducting annual self-assessments, creating and implementing improvement plans, and implementing nutrition and physical activity programs using educational resources and environmental cues. A monitoring and evaluation plan provided ongoing feedback to HealthMPowers and centers. Family and staff surveys provided insights into behaviors of children, families, and staff. Process measures included specific benchmarks (e.g., center leadership team formation, improvement plan implementation). Annual self-assessment results served as intermediate outcome measures.
Results:
As of 2017, 65 centers had enrolled in the program. All centers formed a health team and completed the baseline self-assessment and most implemented an improvement plan (88%). At the 1-year follow-up self-assessment, centers reported improvements from baseline including never offering food incentives for good behavior (75%–86%), conducting taste testing at least once a month (61%–79%), and rarely/never serving sugar-sweetened beverages (93%–96%).
Conclusions:
Initial process measures from a multicomponent health promotion program in ECE were promising. An integrated continuous improvement approach to working with child care settings is feasible and likely effective.
Purpose and Objectives
Childhood obesity has acute and long-term consequences, including increased risk of adult obesity, heart disease, and cancer.1,2 Rising incidence of childhood obesity has created demand for evidence-based child health promotion strategies. 3 As incidence of childhood obesity peaks in kindergarten, 4 the preschool years (ages 3–5 years) offer an early prevention opportunity. 5 Increasingly, government and nonprofit organizations are focusing on improving nutrition and physical activity in Early Care and Education (ECE) settings.3,6–10 Available evidence suggests that multicomponent multilevel interventions in ECE are most effective at preventing childhood obesity.11,12 However, to date, evidence is limited, particularly in settings targeting low-income populations, in which the burden of childhood obesity is highest.13,14
ECE settings include pre-kindergarten (pre-K) programs, Head Start programs, child care learning centers (CCLCs), and family child care learning homes (FCCLHs). 15 Each program type has a distinct structure, providing challenges and opportunities for implementing health programs. Head Start programs, for example, follow federal guidelines on physical activity and must include parent education. 16 In Georgia, early childhood settings have state-specific licensing requirements that include guidelines for nutrition and active play. 17 Qualified settings can receive funding to serve free or reduced lunch from the Child and Adult Care Food Program (CACFP) and then must follow federal menu requirements. 18 Pre-K programs may work within public school settings. Also, many CCLCs also include pre-K classrooms that work with the state education agency policies. CCLCs and FCCLHs may be private businesses with a need to address marketing and profit. The varying and overlapping policies, standards, and contexts should be considered when implementing health promotion programs in ECE settings.
Federal and state agencies have changed their policies in recent years to facilitate childhood obesity prevention in ECE settings.3,13,19–21 Many states have implemented Quality Rated Improvement Systems (QRIS) to address overall child care quality. 7 QRIS are voluntary programs that incentivize centers to comply with child care education and safety standards beyond the state licensing requirements through recognition and funding opportunities. 7 Many QRIS include a section for nutrition and physical activity policies and programs.6,7
In the past 5 years, childhood obesity incidence has plateaued nationally and even declined in some states.3,19,22–25 However, childhood obesity has remained stable or continues to rise in low-income, rural, and minority populations.14,26,27 More evidence is needed on how multicomponent interventions can be effectively implemented across diverse populations (low-income, urban/rural), and what support is needed for centers to make systems-level changes. The purpose of this article was to describe the monitoring and evaluation (M&E) plan, process measures, and intermediate outcomes from a HealthMPowers' ECE program funded by the Supplemental Nutrition Assistance Program-Education (SNAP-Ed) implemented throughout Georgia during the 2014–2017 school years.
Methods
Intervention Approach
The 3-year HealthMPowers' ECE program was based on recommendations for standards in ECE from the American Academy of Pediatrics, 28 Institute of Medicine, 29 Georgia QRIS, 6 SNAP-Ed Evaluation Framework, 8 and HealthMPowers' previous work in elementary schools. 30 The intervention used a continuous improvement approach to (1) provide support through training, resources, and annual program and policy assessments; (2) guide improvement in programs, policies, and environments; (3) measure impact in knowledge, behavior, and health; and (4) sustain programs and policies through partnerships and center health teams (Fig. 1). This model is based on a system approach to addressing behavior change at the organization, family, and individual levels.31–33 HealthMPowers staff focused on long-term institutionalized changes through improvements in center policies, systems, and environments. Throughout the program, HealthMPowers staff supplied resources, training, services, and evaluation to center teams. Annually, center teams conducted a self-assessment of center policies and practices in nutrition and physical activity and developed and implemented improvement plans. HealthMPowers provided direct services through classroom-based model lessons, educational resources, and family events. Resources included lesson plans, nutrition and physical activity educational resources, environmental cues such as posters and banners, and child and family incentives to promote healthy eating and physical activity. HealthMPowers offered year-long technical assistance and feedback to centers, with an annual center report highlighting improvement results. Ideally, the long-term impact of the program will be more children entering kindergarten at an ideal weight, more centers meeting Georgia Early Learning and Development (GELD) standards, and improved health of center staff, families, and children (Fig. 2).
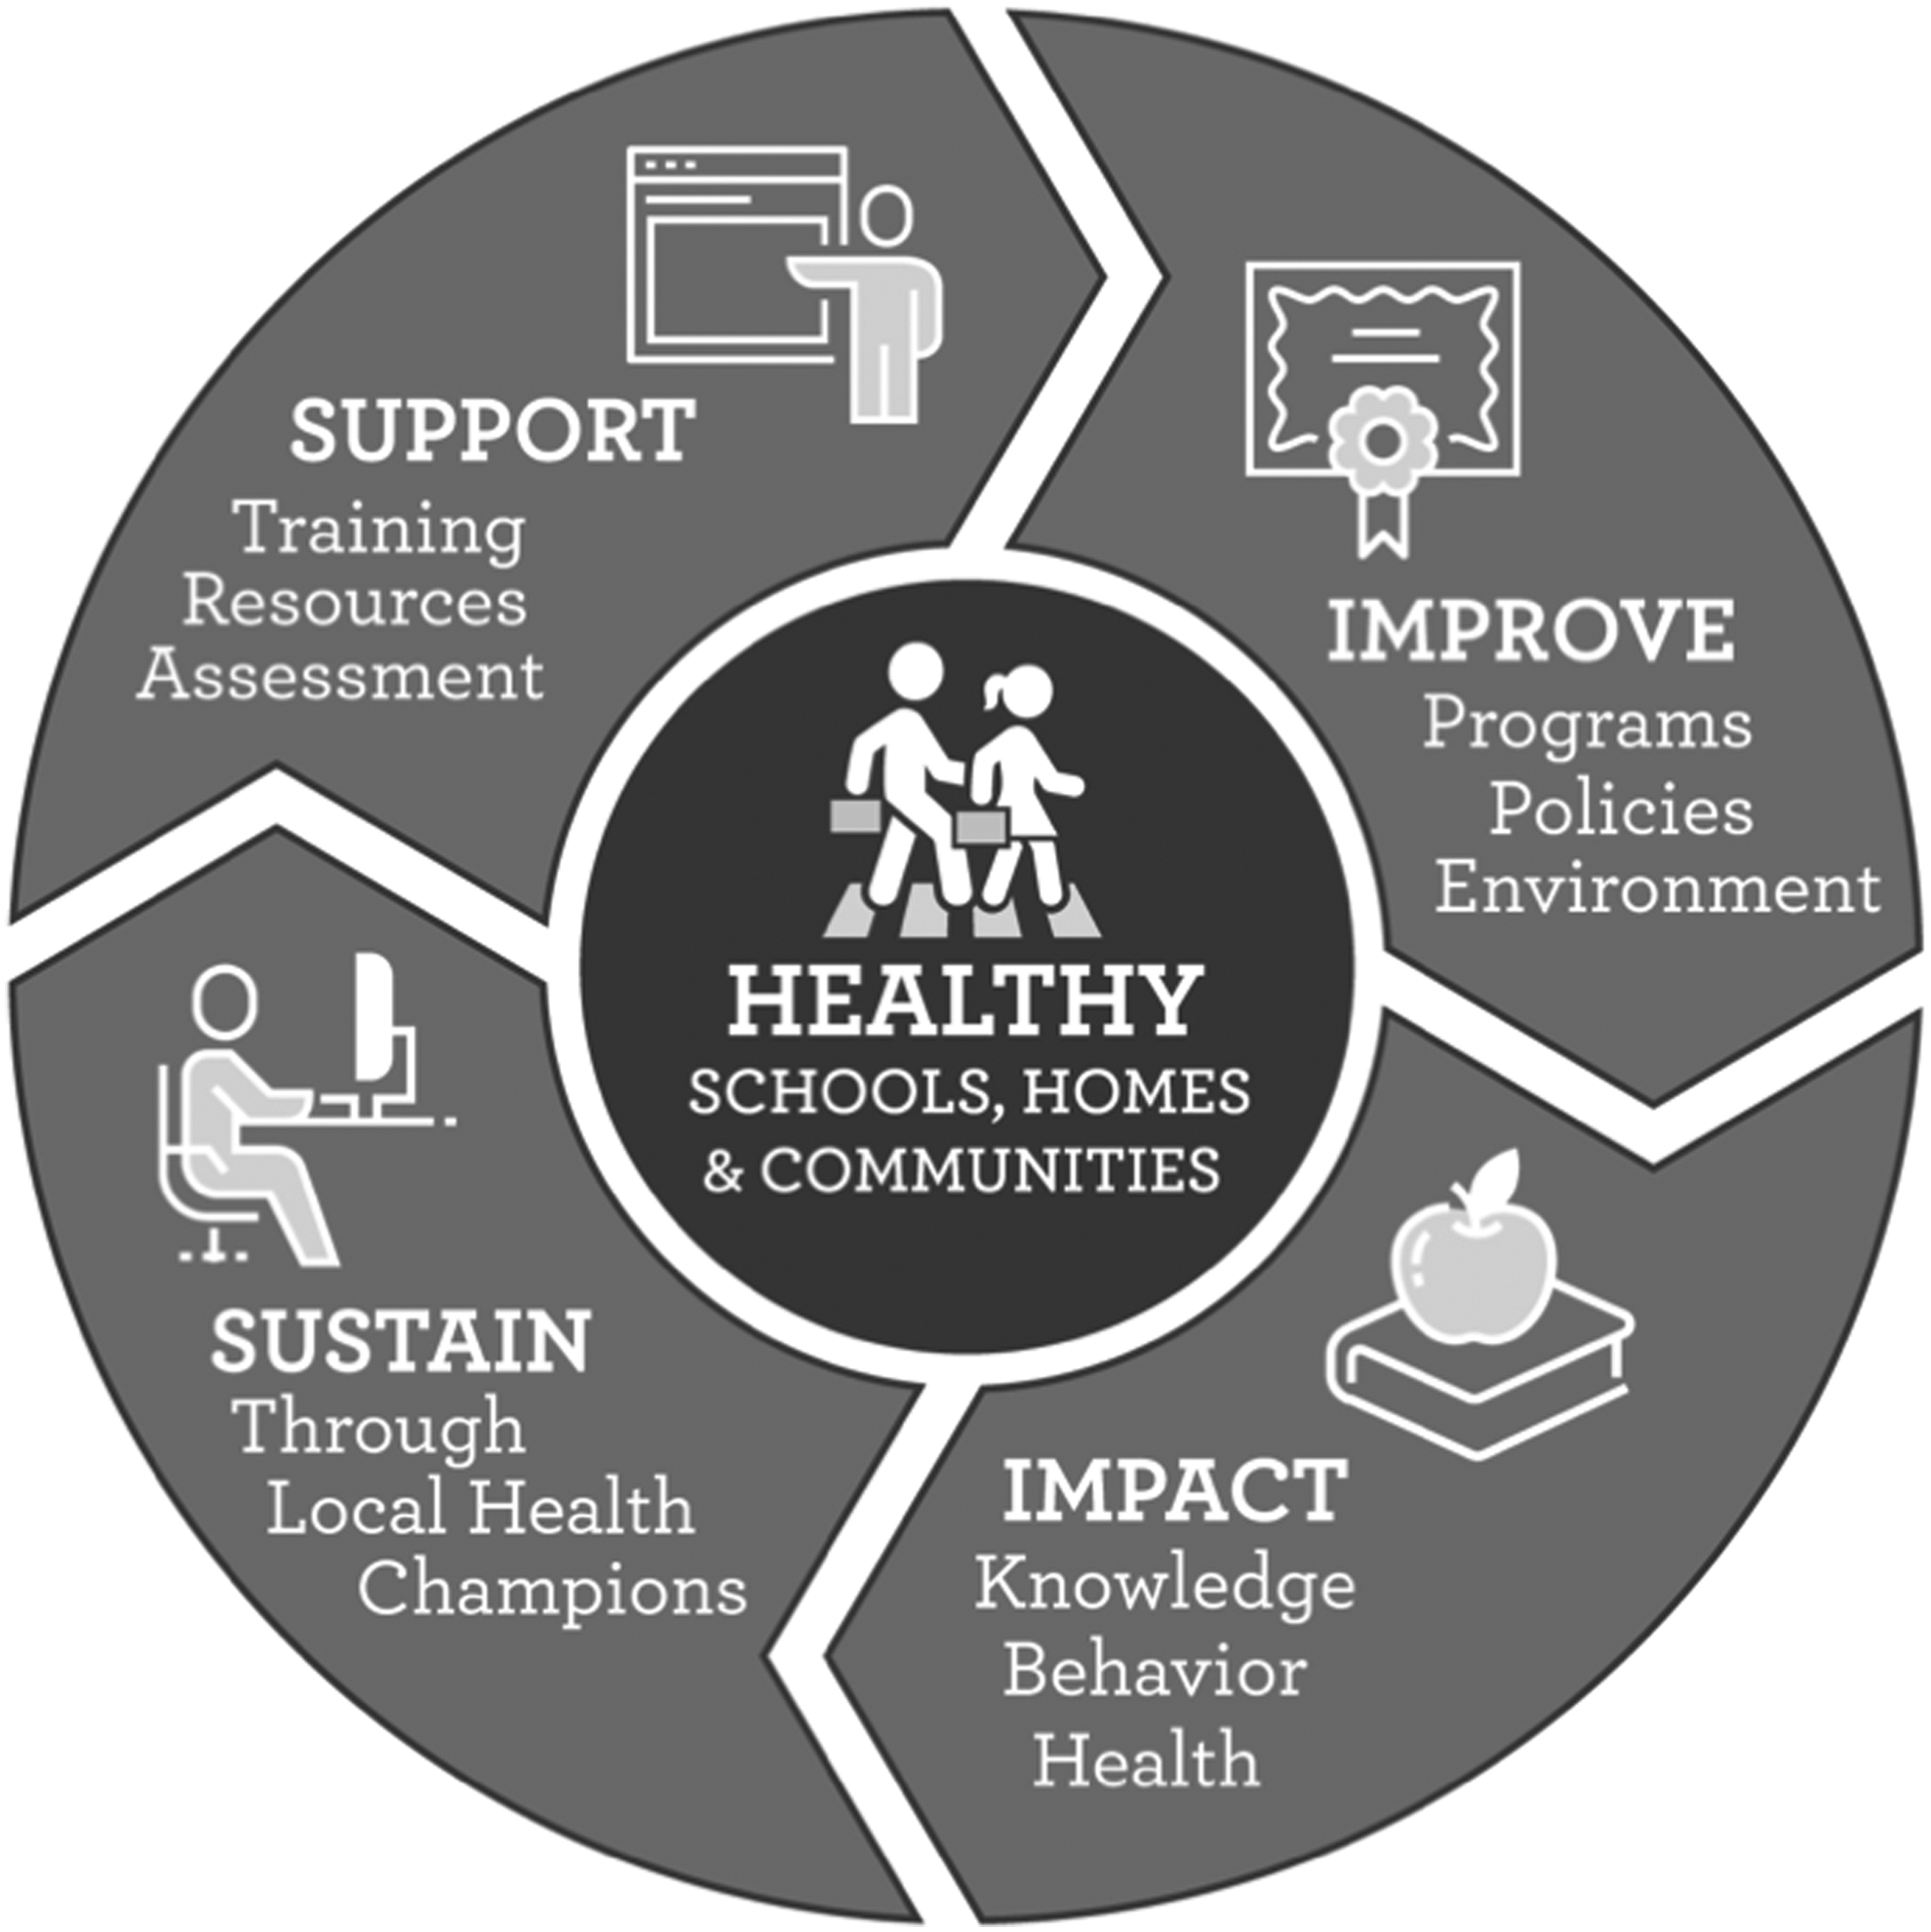
HealthMPowers program model used to guide health promotion programming in ECE, elementary, and middle schools in Georgia. ECE, Early Care and Education.
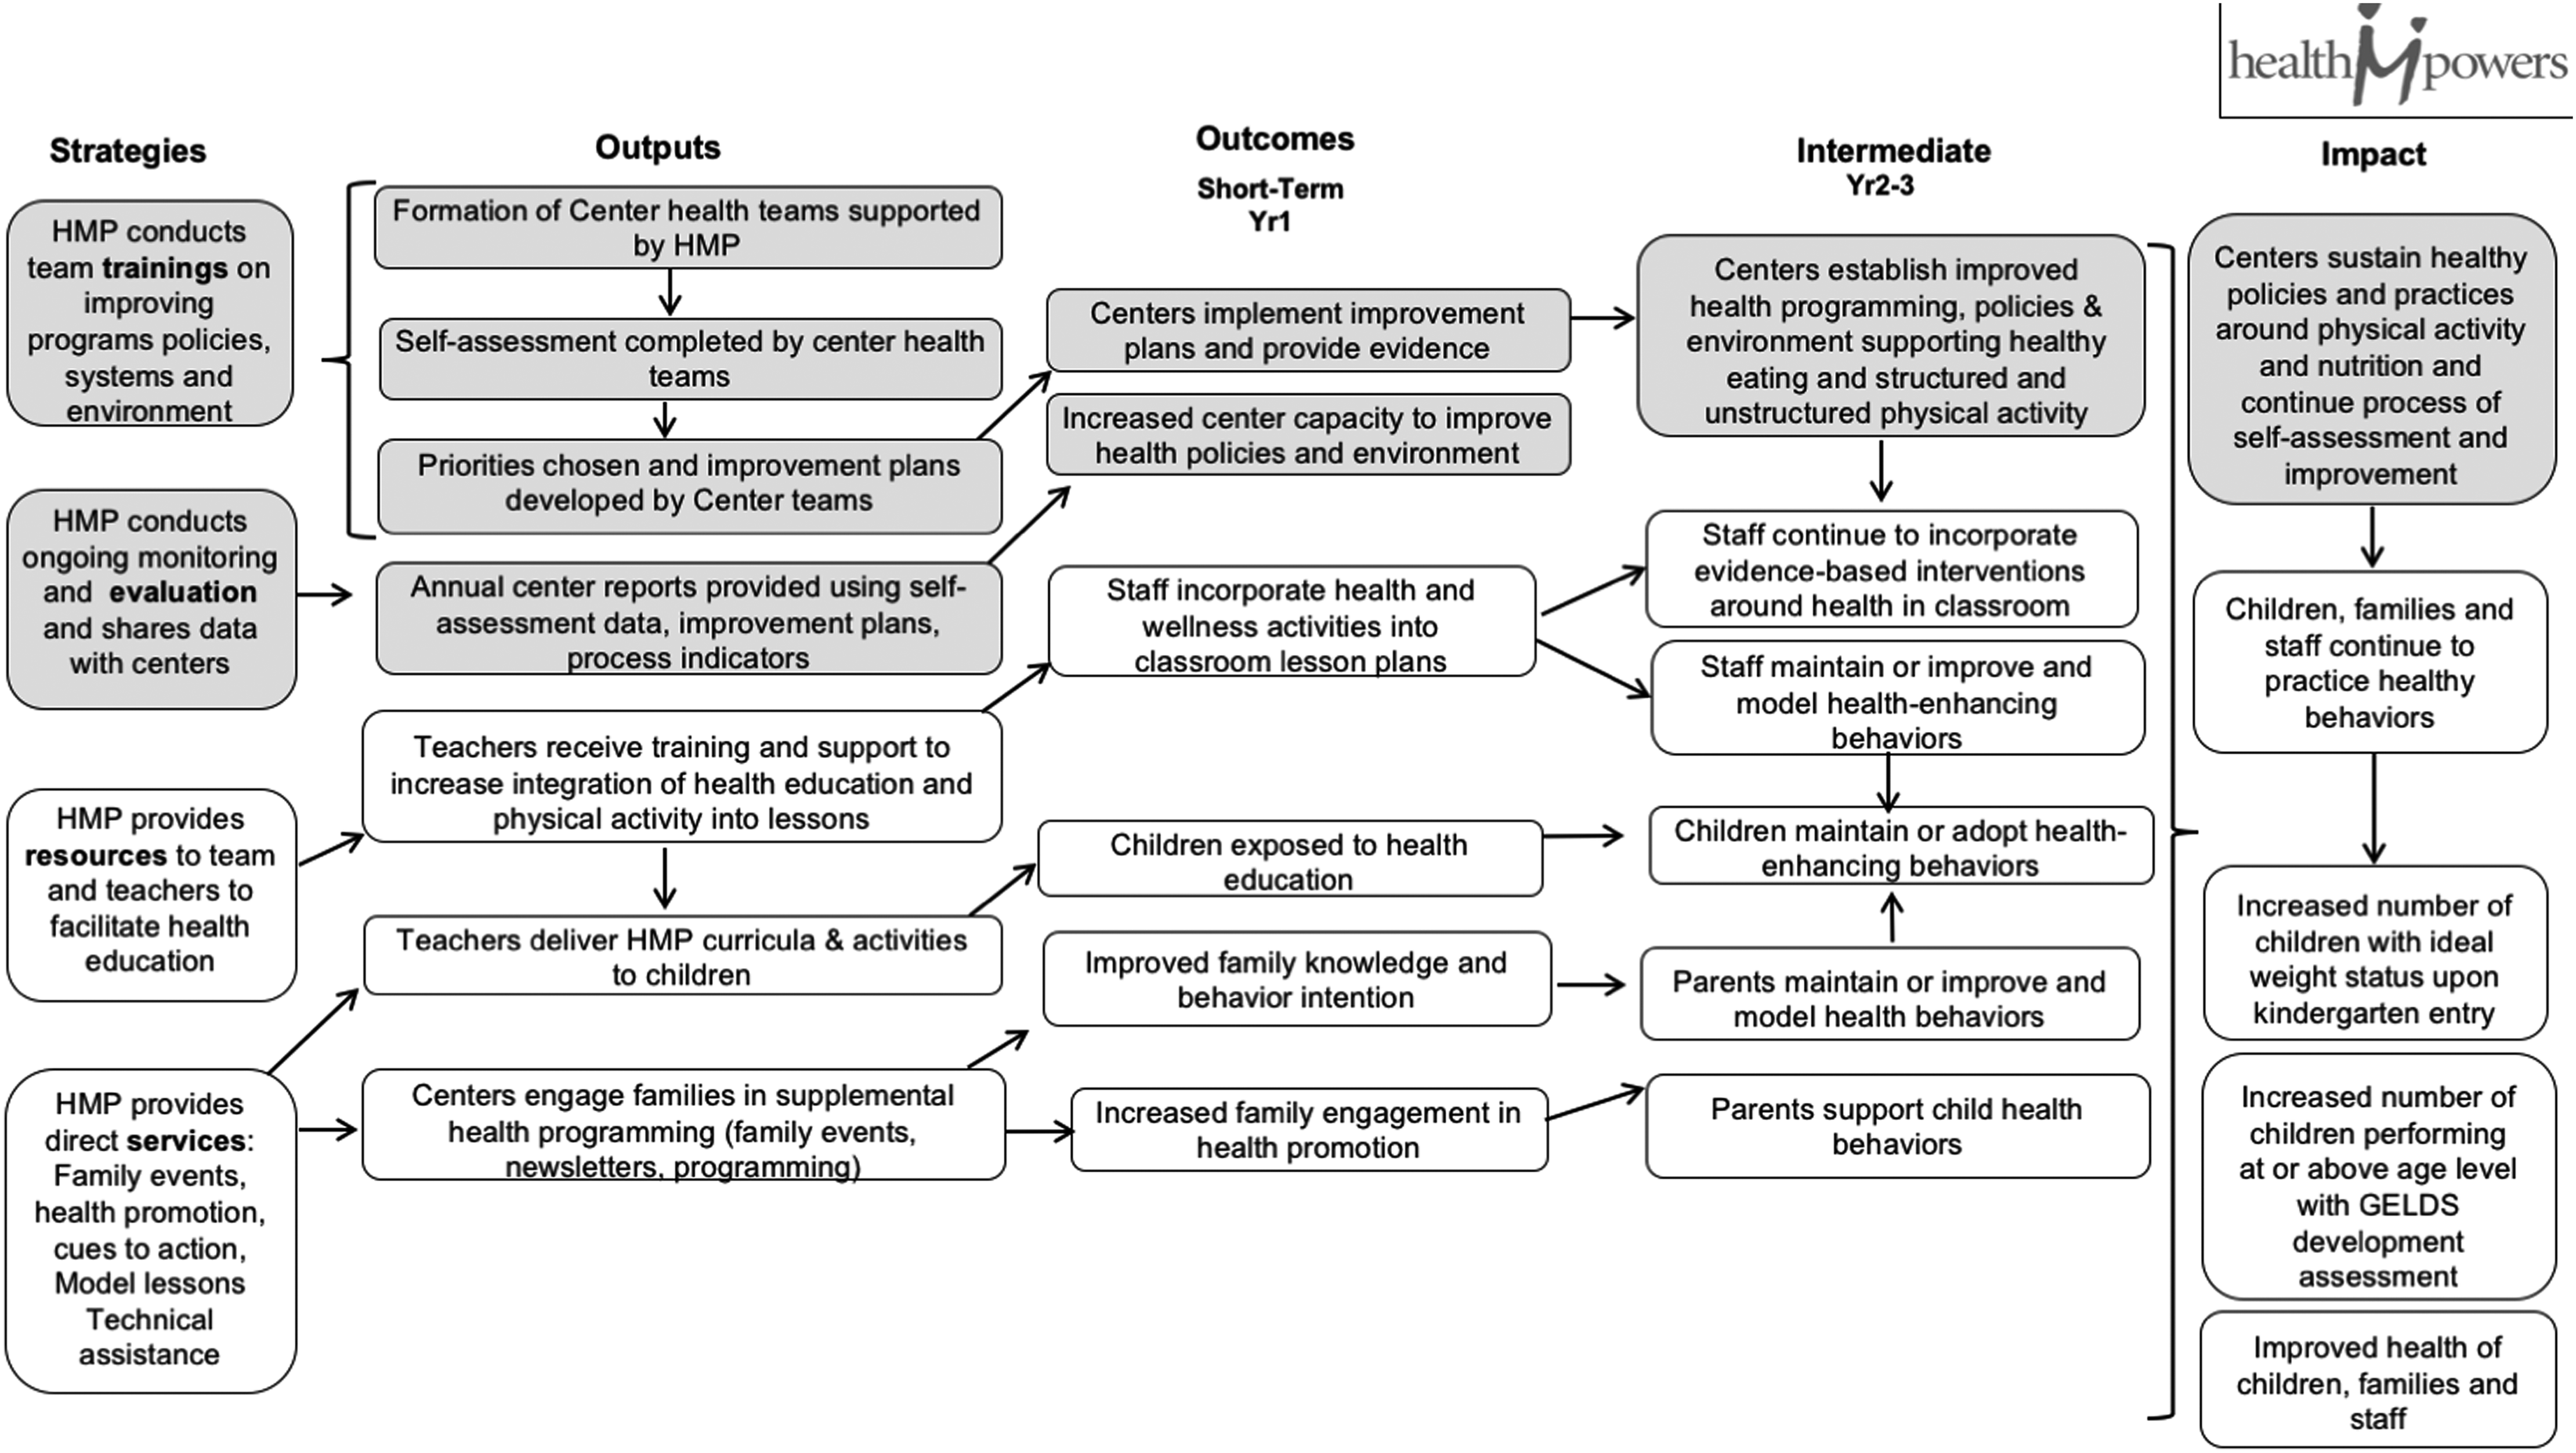
HealthMPowers ECE program logic model, 2015–2017.
Eligibility and Recruitment
HealthMPowers recruited centers using the publicly available database of child care centers from the Georgia Department of Early Care and Learning (DECAL). To be eligible under SNAP-Ed funding guidelines, centers had to demonstrate that 50% or more of enrolled students were eligible for free or reduced meals. Eligibility for free or reduced meals is based on family income. HealthMPowers worked with CCLCs, Head Start Programs, FCCLHs, and pre-K programs. For the purpose of this article, all types will be referred to as “centers.” Centers were required to sign a memorandum of agreement detailing their roles and responsibilities for participation in the multiyear program. This article describes three cohorts of centers currently participating in the program. Centers began participation in the program in the 2014–2015 school years (SY2015), the 2015–2016 school years (SY2016), or the 2016–2017 school years (SY2017).
Center Teams
The first step in a center's partnership with HealthMPowers was to form a center team, responsible for attending trainings and leading center improvements. For all centers except FCCLHs (single in-home providers), teams consisted of at least three people, who could be center directors, staff, dieticians, or parents. HealthMPowers provided a monetary stipend for eligible team members who achieved specific process objectives and worked outside of normal hours. Center staff attending trainings received continuing education credit hours from DECAL. The teams attended three trainings annually focused on self-assessment, strategies for improving nutrition and physical activity, creating improvement plans, planning and implementing programs, utilizing resources, and developing center capacity for policy and program changes (Fig. 2).
Data Sources
The M&E plan followed developmental evaluation concepts 33 and provided ongoing feedback to HealthMPowers staff and center teams. The M&E plan included process and outcome indicators based on the SNAP-Ed Evaluation Framework 8 and the program's logic model. The data sources for monitoring included program records, the self-assessment, and a family and staff survey. Additional details about each source are provided below (Table 1).
Overview of Data Sources Used in the HealthMPowers Early Child Care and Education Program Developmental Evaluation, 2014–2017
Program records
The HealthMPowers health educators maintained records of program participation, which were used to determine when centers met process objectives. Process objectives included development of center teams, training attendance, use of HealthMPowers educational resources, completion of services (family events and model lessons), completion of the self-assessment, and development of an improvement plan with evidence of implementation.
Self-assessment and planning tool
The Georgia Department of Public Health (DPH) and HealthMPowers developed the self-assessment, Georgia Growing Fit: Nutrition and Physical Activity Assessment, with input from DECAL. 6 The assessment is an enhanced version of the nutrition and physical activity self-assessment used with the Georgia QRIS and aligns with recommendations from the Institute of Medicine. 29 The assessment includes 12 nutrition indicators and 7 physical activity indicators, each with 1 or more subindicators. Each subindicator on the self-assessment has three response options. For example, one subindicator is “Sugar-sweetened beverages, like soda, juice drinks, sports drinks, sweet tea, and Kool-Aid are served,” and centers can respond “once per month or more,” “less than once a month,” or “rarely or never.” Selected subindicators are presented in this article to represent policies and practices most relevant to the program. For this article, subindicators were classified dichotomously, as meeting the highest, “best practice” level of the objective or not. At the first of three annual team trainings, each center team completed or updated a self-assessment. Centers then identified priority nutrition and physical activity indicators that served as the basis for developing annual improvement plans.
Family survey
Center families completed a survey including 18 questions on child physical activity and eating behaviors, family meals, and screen time. The survey was a one-time self-administered paper survey, completed by parents (or primary caretakers) throughout the school year. Questions for the survey were based on items from the University of California Davis Townsend Lab Healthy Kids and Food Behavior checklists34,35 and other published literature. 36 Surveys were piloted first with child care staff (for clarity and length) and then with parents. Surveys were available in Spanish and English. Centers were responsible for distributing and collecting surveys from families by sending surveys home with children and collecting them by a given date. All family surveys were performed in the 2016–2017 school years.
Staff survey
Classroom staff in 3- to 5-year-old classrooms completed a survey that included 12 questions about in-classroom modeling behaviors, leisure time physical activity, and nutrition. The staff survey was piloted with a group of child care center staff. Staff participating on center teams completed the staff survey at the first training and other staff completed the survey at work, all before the first model lesson. For SY2015 centers, the staff survey took place at the beginning of the second program year.
Annual Data Use
HealthMPowers staff provided ongoing feedback and support to centers in the form of a center-specific annual report. The report contained analysis and contextualization of program progress, survey data, and self-assessment results. This allowed HealthMPowers staff to target technical assistance and allowed centers to update their self-assessment and plan further improvements or course corrections for the following year.
Analysis
Frequencies for family survey data were calculated across all years of the program. Frequencies for staff survey data and process measures were stratified by the year of entry into the program (SY2015, SY2016, or SY2017). Self-assessment data were presented dichotomously for selected indicators at two time points (baseline and 1-year follow-up) for centers in SY2015 and SY2016. SY2017 centers only had baseline self-assessments at the time of analysis. For each self-assessment subindicator, the proportion of centers reporting the highest level of “best practice” response at the time of the self-assessment baseline or 1-year follow-up was calculated. All analyses were conducted using SAS (SAS v9.4, Cary, NC).
Results
The 65 participating centers were located across Georgia. SY2015 centers were recruited from metro Atlanta. SY2016 and SY2017 centers were enrolled from across Georgia (Fig. 3). In SY2016 and SY2017, larger centers joined, increasing the mean child enrollment from 28 (SY2015) to 53 three- to five-year-old children (SY2017) (Table 2). Centers also grew more ethnically diverse, with a larger average percent Hispanic (0% for SY2015 centers, 3.4% for SY2016 centers, and 16.3% for SY2017 centers). In SY2015, only FCCLHs or CCLCs were enrolled, whereas in SY2016 and SY2017, Head Start and pre-K programs joined.
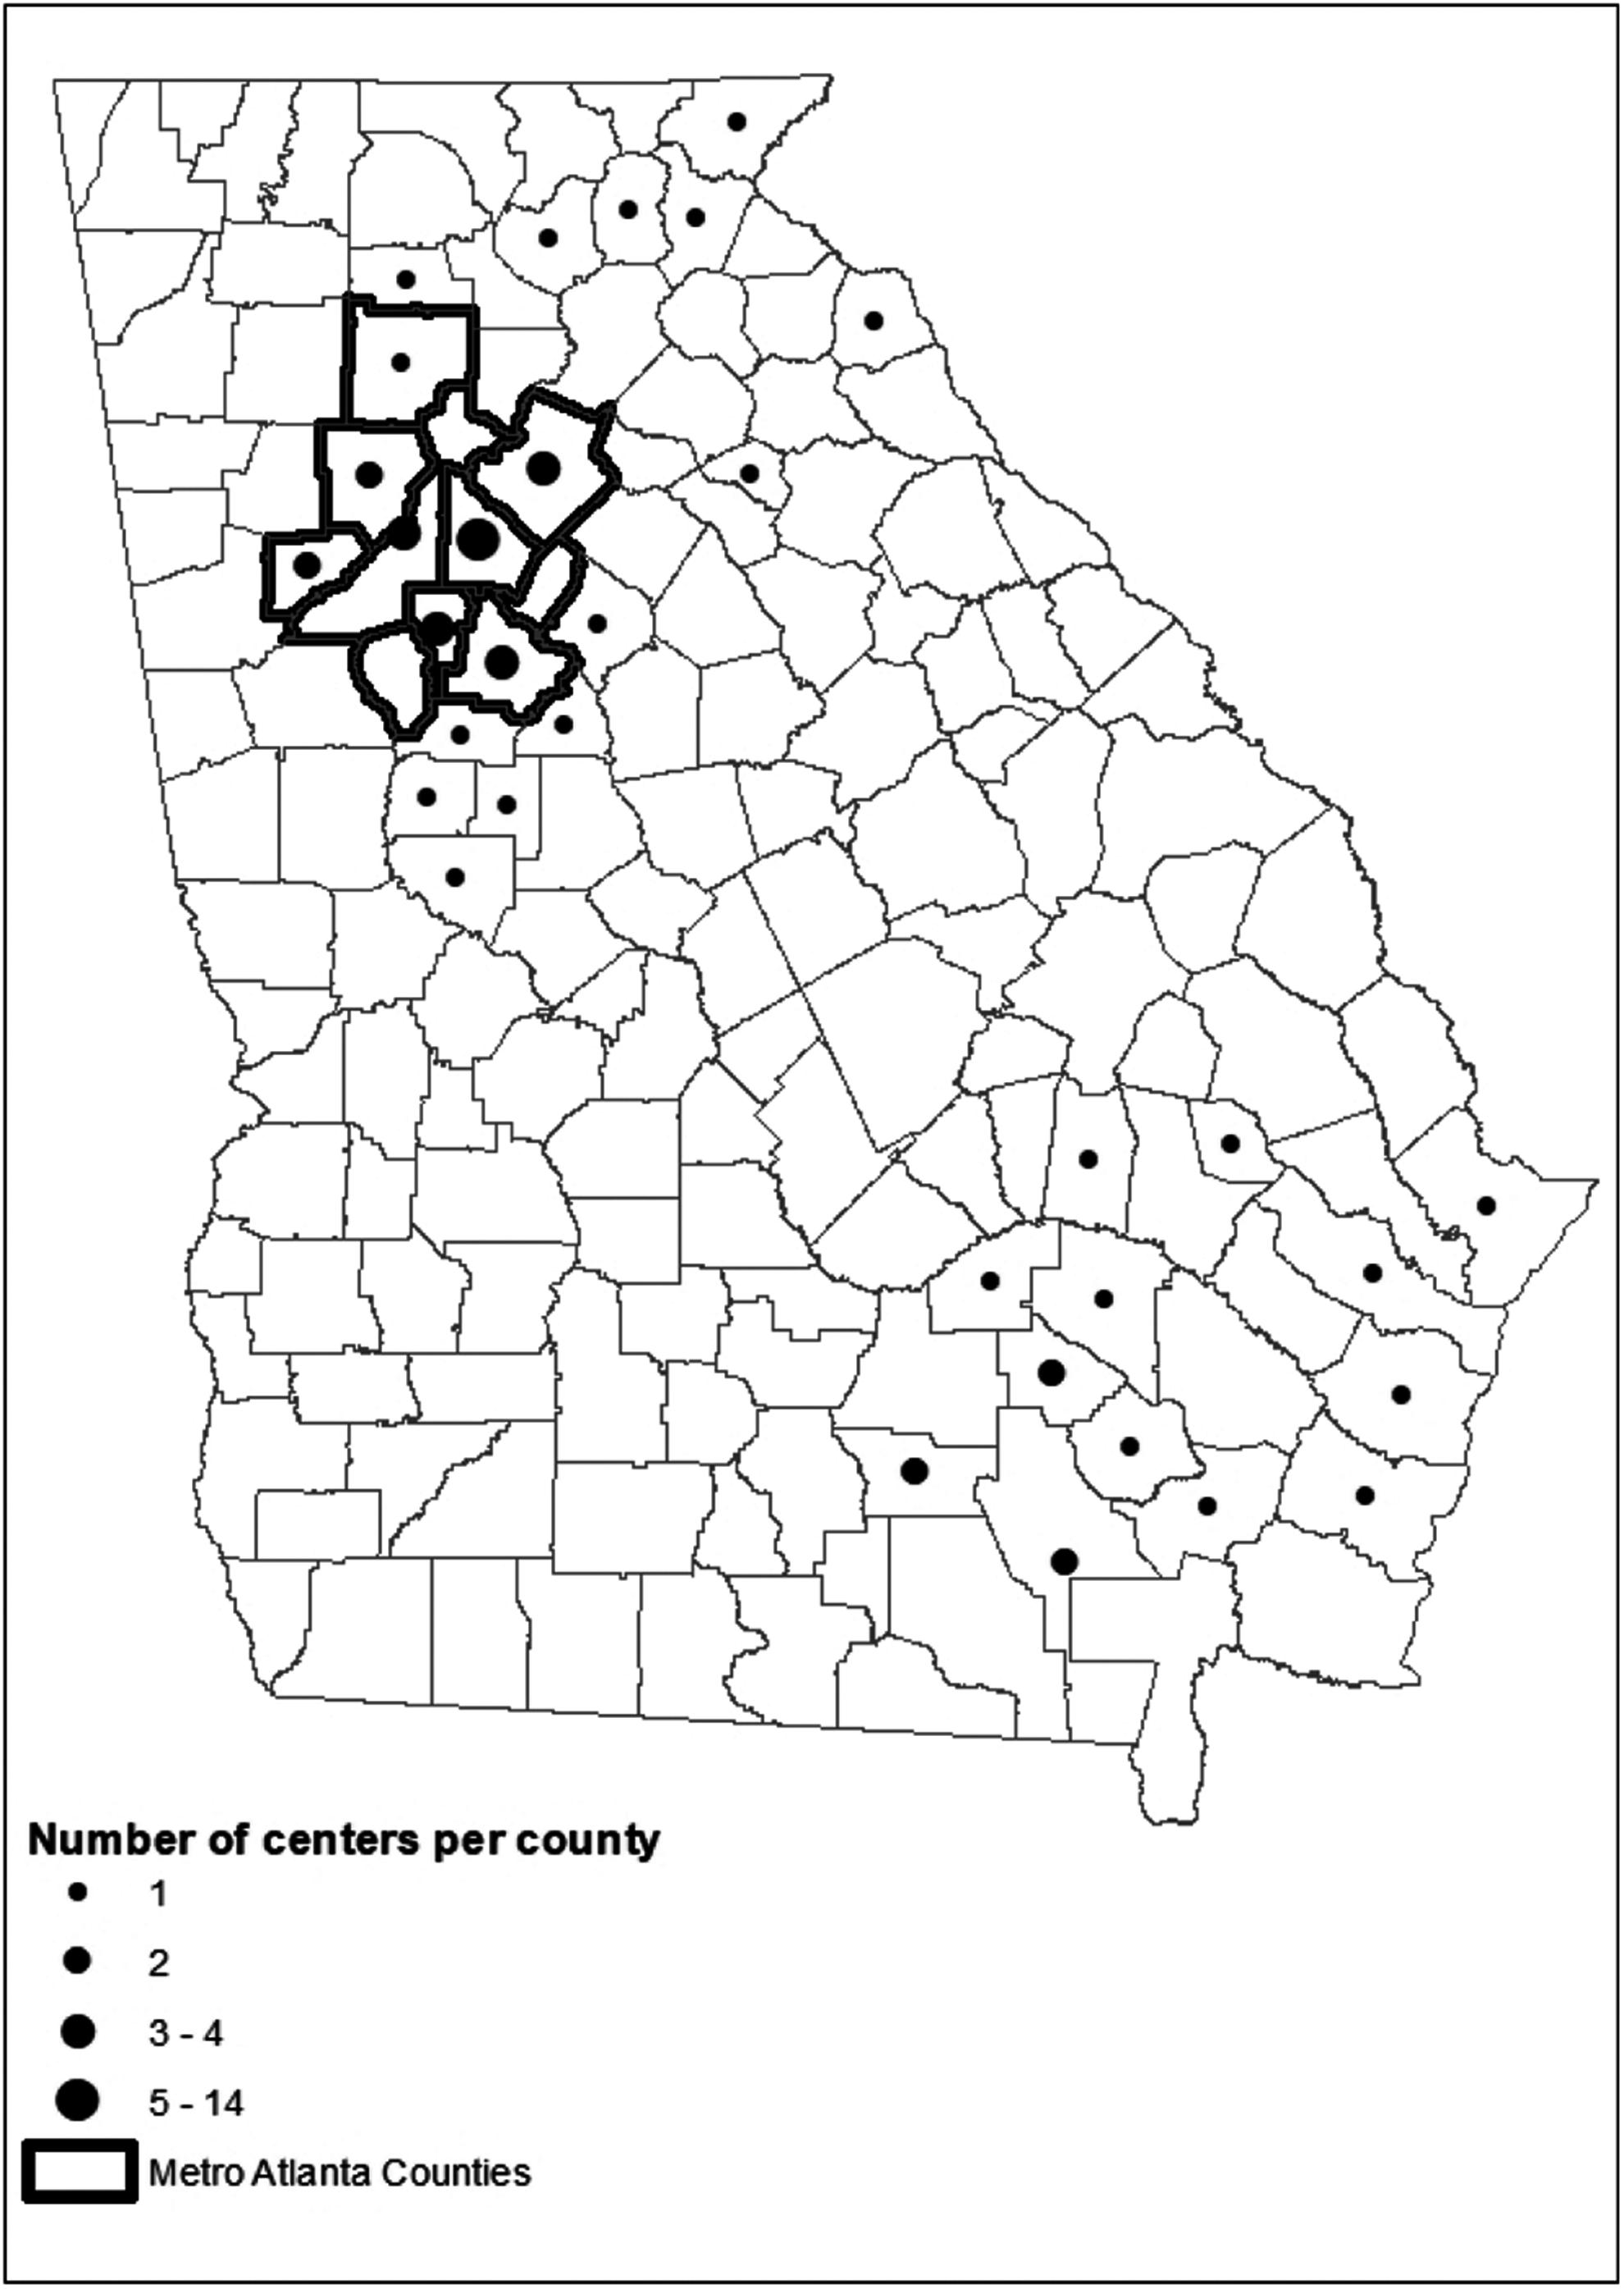
Distribution of participating child care centers by county (total n = 65), HealthMPowers ECE program, 2015–2017 school years.
Center Characteristics at Enrollment by Center Cohort, HealthMPowers, 2015–2017 School Years, by Year Enrolled in the Program, n = 65 Centers
SD, standard deviation; SY, school year.
The family survey provided behavior context for the self-assessment results and improvement plans (Table 3). Outside of child care, families reported children spending an average 3.5 hours [standard deviation (SD) 2.7] outside on a typical weekend day and an average 2.1 hours (SD 1.7) watching television. On average, children reportedly drank two glasses of milk (2.2, SD 1.2) and two sugary drinks (2.0, SD 1.7) at home daily. Most children (65.2%) had a TV, tablet, or computer in their bedroom, and most (62.2%) ate meals in front of a TV some days or more often. Roughly half of families reported their children ate fruit (50.0%) and vegetables (48.6%) outside of child care daily. The majority of families (67.7%) reported eating dinner or other meals together daily.
Family Behaviors Survey, HealthMPowers Early Care and Education Program, 2017 School Year, n = 2084 Parents or Primary Caretakers
The staff survey also provided context for the self-assessment results and improvement plans. The staff reported high levels of compliance with recommendations for joining children during physical activity and meal time (Table 4). The majority of staff reported always joining children during both structured (67.6%) and unstructured (53.6%) physical activity. Additionally, the majority of staff reported always sitting and eating meals with children (79.1%). Staff leisure-time behaviors varied widely. Over half of staff reported leisure-time physical activity at least three to five times per week (58.3%), and one quarter reported more than 2 hours of daily outside-of-work screen time (25.3%).
Baseline Staff Self-Reported Behaviors at Work and Outside of Work, HealthMPowers 2015–2017 School Years, n = 331 Early Care and Education Staff Members
Three to eight responses missing per year.
The majority of centers fulfilled most process objectives (Table 5). The objective least likely to be achieved was completion of two family events (10.8% of centers). While SY2015 centers had the highest completion percent on all objectives compared with SY2016 or SY2017 centers, they were also the centers who had been with the program for 3 years. The process objectives with the most variation between years were attending three required trainings, implementing improvement plans, and holding two family events. The majority of centers (88%) implemented an improvement plan and provided evidence of implementation. Centers reported high levels of resource use with the most frequently used being nutrition story books (average: 13.2 hours per center annually) and a DVD of classroom exercises (average: 17.5 hours per center annually).
Process Objectives, HealthMPowers Early Child Care Education Program, Georgia, as of 2016–2017 School Years, n = 65 Centers
Georgia Growing Fit: Nutrition and Physical Activity Assessment.
The 28 SY2015 and SY2016 centers had completed both a baseline and follow-up self-assessment by the end of SY2017 (Table 6), with SY2017 centers completing only the baseline self-assessment since they were in the first year of the program. Baseline self-assessment for nutrition subindicators ranged from 39.3% to 92.9% of centers reporting the highest level (best practice) response. At follow-up, there was improvement on 8 of the 11 nutrition indicators. Baseline self-assessment for physical activity indicators ranged from 21.4% to 89.3% of centers reporting the best practice response; a larger proportion of centers reported best practices at follow-up compared with baseline on four of the six physical activity subindicators. At baseline, few centers reported providing parent nutrition training (39.3%) or parent physical activity training (21.4%). About one third (35.7%) of centers reported scheduling at least 60 minutes daily of structured physical activity. The proportion of centers at best practice level for three indicators declined from baseline to follow-up (food is served family-style every day; fresh vegetables served four times or more times weekly; 2 hours of physical activity scheduled daily).
Percent of Centers at Highest Level “Best Practice” for Selected Subindicators from Georgia Growing Fit Physical Activity and Nutrition Self-Assessment, as of Spring 2017, n = 28 Centers in SY2015 and SY2016 with Baseline and Follow-Up Self-Assessments
Implications for Public Health
This article describes implementation for the first three cohorts of the HealthMPowers' ECE nutrition and physical activity multiyear program. Participating centers were diverse in terms of geographic location, families served, center type, and baseline level of nutrition and physical activity programming. Baseline data on families and staff and center-level process and outcome measures are presented. The developmental evaluation approach helped meet diverse needs of centers and allowed for timely changes in measurement, more targeted technical assistance, and continuous improvement related to the center implementation plans.
At least two previous obesity prevention interventions have been conducted in the Georgia ECE settings.37,38 Both focused on one or more staff trainings to create environmental change and neither included follow-up technical assistance. One program showed environmental improvement at follow-up and one did not. The current article adds to the literature by describing a complex multicomponent program, describing baseline characteristics of staff and families and by including process objectives of program participation, in addition to intermediate outcome measures.
The HealthMPowers program and developmental evaluation approach have several strengths, including the interplay between the partnership model and data collection, real-time use of data to change program implementation, and the multicomponent nature of the program. The data collection process strengthened the partnership model by promoting reflection and discussion among center teams during the completion and use of the self-assessment. Expectations for each center to develop, implement, and provide evidence of completion for improvement plans helped to structure technical assistance and focus program and policy changes on priority areas. Additionally, the structure of the developmental evaluation allowed HealthMPowers staff to use data to make timely changes in program implementation when process did not meet expectations. Finally, the program follows CDCs guidelines for high impact in 5 years (Hi-5) interventions by including multiple components and focusing on three interconnected audiences (families, children, and center staff). 39
Despite these strengths, the data presented have at least three limitations. First, the self-assessment data are self-reported and not supported by direct observation. Second, the self-assessment does not reflect the full scale of potential healthy actions, and high proportions (0%–91%) of centers were already at the highest performance level at baseline for some indicators. Finally, this article does not include follow-up data on individual children.
Through the developmental evaluation approach, HealthMPowers staff made changes to improve program implementation, efficiently leverage resources, and improve data quality. In the first year, FCCLHs worked as individual providers. In the SY2017 cohort, FCCLHs worked in centralized groups to benefit from group problem-solving and improved program efficiency. Changes were also made to take advantage of existing support systems, such as Head Start programs with in-house nutrition and parent liaison staff. HealthMPowers worked to identify ways to leverage existing centralized systems to strengthen work with multiple Head Start programs within a region. Finally, to address the problem of staff turnover, HealthMPowers made program changes to encourage larger center teams and to engage the center director. Engaging the director provided continuity and a larger team increased the likelihood that multiple team members would remain throughout the 3 years of the program.
As a result of lessons learned during SY2015–SY2017, several changes in evaluation are being implemented in SY2018. For evaluation, HealthMPowers will sample individual children and collect data from family and staff to measure child behaviors (fruit and vegetable consumption and physical activity) in and outside of child care. These observations will be performed as pre- and post-measures to observe child behavior change. Finally, because the self-assessment did not capture a full range of potential improvement and many baseline responses were at a best practice level, with the SY2018 cohort, the self-assessment will include a fourth level response to show higher levels of practice and policy implementation.
Further information on working in child care settings is essential to developing evidence-based practices. The partnership model of HealthMPowers leverages resources at centers for both program implementation and M&E. The structure of data collection is a balance between collecting rigorous data and respecting center staff's time and energy. HealthMPowers used a developmental approach and prioritized intermediate measures through the self-assessment, supplemented by contextual information on staff behaviors and the home environment provided by staff and family surveys. With future cohorts, improved data collection methods should allow for rigorous testing of questions about the effectiveness of this program implementation strategy on improving individual child eating and physical activity behaviors. The methods, preliminary data, and lessons learned presented in this article will serve organizations implementing health promotion programs in early child care and education settings.
Footnotes
Acknowledgments
We thank the United States Department of Agriculture Supplemental Nutrition Assistance Program-Education (SNAP-Ed) for funding the HealthMPowers' Early Care and Education program, and all participating child care learning centers, Head Start programs, pre-kindergartens, and family child care learning homes along with participating ECE staff and families.
Author Disclosure Statement
No competing financial interests exist.