
Abstract
Abstract
Background:
To understand whether the relationship between young children's autonomic nervous system (ANS) responses predicted their BMI, or vice versa, the association between standardized BMI (zBMI) at 2, 3.5, and 5 years of age and ANS reactivity at 3.5–5 years of age, and whether zBMI predicts later ANS reactivity or whether early ANS reactivity predicts later zBMI, was studied.
Methods:
Low-income, primarily Latino children (n=112) were part of a larger cohort study of mothers recruited during early pregnancy. Study measures included maternal prenatal weight, children's health behaviors (i.e., time watching television, fast food consumption, and time playing outdoors), children's height and weight at 2, 3.5, and 5 years, and children's ANS reactivity at 3.5 and 5 years. ANS measures of sympathetic nervous system (i.e., pre-ejection period) and parasympathetic nervous system (i.e., respiratory sinus arrhythmia) activity were monitored during rest and four challenges. Reactivity was calculated as the difference between mean challenge response and rest. Structural equation models analyzed the relationship between children's zBMI at 2, 3.5, and 5 years and ANS reactivity at 3.5 and 5 years, adjusting for mother's BMI, children's behaviors, and changes in height.
Results:
There was no association between zBMI and ANS cross-sectionally. Children with high zBMI at 2 or 3.5 years or large zBMI increases from 2 to 3.5 years of age had decreased sympathetic activity at 5 years. Neither sympathetic nor parasympathetic reactivity at 3.5 years predicted later zBMI.
Conclusions:
Increased zBMI early in childhood may dampen young children's SNS responses later in life.
Introduction
Childhood obesity is a serious public health problem globally. In the United States, 14.6% of children are overweight (85th–94th percentile) and 12.1% are obese (≥95th percentile). 1 Compared to children with normal weight, children who are overweight or obese as preschoolers are five times more likely to be overweight or obese in adolescence.2,3 Overweight and obese children are also more likely to develop diabetes, hypertension, dyslipidemia, asthma, and sleep apnea later in life. 4
There are numerous and complex social, developmental, psychological, and biologic factors that can lead to childhood obesity. Those children at greatest risk are Latino and American Indian,5,6 live below the poverty line, 7 and have mothers with high BMIs.2,8 Children's consumption of fast foods, 9 time watching television (TV),10,11 and lack of physical activity 12 are also related to high BMI.
Several studies show that children's BMI is associated with the regulation of their autonomic nervous system (ANS). The ANS, comprised of the sympathetic and parasympathetic branches, determines an individual's response to threatening situations and energy regulation and also plays a role in the modulation of glucose and fat metabolism.13,14 Different areas of the brain activate the sympathetic nervous system (SNS) or parasympathetic nervous system (PNS) branches of the ANS. Specifically, the rostral and caudal ventrolateral medulla are involved in SNS activity and the brainstem regulates PNS functions. 15 The SNS controls energy expenditure through innervation of smooth, cardiac, and skeletal muscle and inhibits insulin secretion by the pancreas to reduce energy storage.13,16 That is, decreased SNS activity will lead to lower levels of energy expenditure and a subsequent increase in food intake and weight gain. 17 Conversely, the vagus, the primary output of the PNS, promotes energy storage by slowing the heart rate to reduce myocardial oxygen consumption and increases peristalsis and energy absorption from the alimentary tract 14 and insulin secretion from the pancreas, resulting in energy deposition into body fat. 18 Thus, researchers have hypothesized that children with dampened or decreased SNS and/or PNS activity (i.e., rest or reactivity) are more likely to become obese at older ages than children with other ANS profiles,13,14,19 yet there are no longitudinal studies to support this directional relationship.
Other studies hypothesize that there is a directional relationship between children's BMI and later changes in ANS. In two intervention studies of school-age children, increased physical activity was associated with subsequent decreases in resting sympathetic states.13,20 In a study of 48 matched lean and obese school-age children 6–12 years of age, the obese children had decreased resting sympathetic and parasympathetic activity. 13 In a 4-month physical activity intervention study of obese children 7–11 years of age, increases in physical activity were accompanied by decreases in resting sympathetic activity (i.e., low heart-rate variability) and increases in resting parasympathetic activity. 20 In a cross-sectional study of 154 obese and normal children and adolescents, higher BMI was associated with decreased resting PNS and decreased SNS reactivity. 21 These researchers and others hypothesized that obesity may give rise to ANS dysfunction.
Although a few studies support directional relationships between BMI and ANS, there are methodologic limitations in these and other studies in the field. The majority of studies of BMI and ANS are cross-sectional, involve school-age versus younger children, and measure heart-rate variability (HRV) as the indicator of parasympathetic and sympathetic activity. Taken together, these studies report fairly consistent findings about the relations between obesity and the PNS and inconsistent relations between obesity and the SNS. Childhood obesity is shown to be associated with PNS withdrawal16,20,22 or decreased PNS activity.13,23,24 Childhood obesity has been found to be associated with SNS dominance,16,22 normal SNS activity, 24 and decreased SNS activity.13,21,23 Because these research studies are cross-sectional, it is not possible to know whether ANS dysregulation is a cause, consequence, or merely a marker of obesity. 19 In addition, there are no studies of ANS and BMI in children under 6 years of age including more direct cardiac measures of the SNS, such as pre-ejection period (PEP), and respiratory sinus arrhythmia as a measure of the PNS.
There were a few longitudinal studies of children and BMI showing that children who gain weight early in life are more likely to be overweight later in life.2,25,26 In a Canadian cohort study of children from 5 months to 8 years of age, children who rapidly gained weight after 2.5 years were more likely to be obese by 8 years of age, compared to children who moderately gained weight or had stable BMIs. 2 In a US cohort study of 2 to 12 year olds, those children who were overweight during their preschool years were five times more likely to be overweight at 12 years of age. 3 Studies of the duration of obesity showed that school-age children who were obese more than 3 years 13 or adolescents who were overweight or obese over 7 years 27 had dampened or decreased resting SNS responses, compared to children who were overweight or obese for a shorter duration.
Young children's ANS reactivity is not stable under 6 years of age 28 ; thus, children's stress responsivity may change depending on their exposure to environmental or physical stressors. This developmental plasticity of the ANS's response to challenge makes sense from an evolutionary perspective. Heightened stress reactivity may reflect a child's biological sensitivity to context (BSC) and, under conditions of environmental adversity, may promote negative health outcomes, such as obesity. 29 The conditional adaptation model extends the BSC theory and explores young children's stress responsivity further. 30 Children experiencing the most extreme adverse conditions have an associated decrease in ANS reactivity.
The stress response system coordinates a child's physiologic and behavioral response to environmental challenges, which can be highly responsive or unresponsive to various types of information. The process of achieving stability through physiologic or behavioral change in response to environmental challenge is called allostasis. 31 Humans continually respond to their environment and their responses are characterized as one of four types of responsivity: sensitive; buffered; vigilant; or unemotional. 30 Children with decreased PNS and SNS responsivity have an unemotional pattern, which emerges over the course of development. This responsivity pattern develops under the joint effects of environmental and genetic factors. In animal studies, there are different personality types (doves and hawks) who exhibit different stress responses. Doves have higher body weight, more exploratory behaviors, more responsivity under threat, and dominant PNSs, compared to hawks who have SNS dominance, more aggression, and higher injury rates. 15 Doves have decreased SNS reactivity and increased PNS reactivity, whereas hawks have increased SNS reactivity and decreased PNS reactivity. There are few empirical studies of young children that support the evolutionary theories associating stress responsivity of children's body weight and their ANS's stress reactivity.16,22–24
These theoretical and evolutionary studies support the need for future studies of ANS reactivity to understand how children physiologically respond to challenges in their environment. On the other hand, the majority of BMI studies include ANS resting and not reactivity measures. Because obesity is a complex, multi-dimensional problem and ANS dysregulation is an important, understudied phenomenon of the obesity disorder, this study explored the hypothesized directional relationship between BMI and ANS reactivity. The present study included a longitudinal birth cohort of California-born Latino children at high risk of overweight and obesity to determine whether BMI is cross-sectionally or longitudinally associated with ANS reactivity at 3.5 and 5 years of age. In addition, this study aims to shed light on the directionality of the relationship of ANS reactivity and overweight/obesity by determining whether early BMI predicts later ANS reactivity or early ANS reactivity predicts later BMI.
Methods
Study Design and Sample
The Center for the Health Assessment of Mothers and Children of Salinas (CHAMACOS) is a longitudinal birth cohort study of the effects of pesticide and other environmental exposures on the health of pregnant women and their children. Eligible women were 18 years or older, less than 20 weeks gestation, English or Spanish speaking, Medi-Cal eligible, and planning to deliver at the county hospital. Detailed methods for this study have been published previously. 32 The larger study's hypothesis that exposure to organophosphate pesticides would affect children's ANS regulation was shown not to be significant, 33 nor were organophosphates associated with standardized BMI (zBMI) at any age, therefore organophosphate exposure is not controlled for in these analyses.
Of the 526 families followed through delivery, interviews were conducted with all the mothers during early pregnancy, 409 when their child was 2 years of age, 365 at 3.5 years, and 350 at 5 years. BMI data were collected for all children at each age. Measures of ANS activity (see below) were collected for approximately 50% of the sample at 3.5 years as a result of funding restrictions (n=133) and 83% of the sample at 5 years (n=292). 28 For this analysis, children with known chronic medical conditions (n=6) were excluded and the 112 children with ANS data at 3.5 and 5 years of age were included in the analyses.
The study protocol and consent forms were approved by the institutional review boards at the University of California, Berkeley, University of California, San Francisco, and participating institutions. Consent forms were read and reviewed with the mothers before each phase of data collection, and then the mothers signed the consent form.
Measures
Autonomic nervous system measures
Respiratory sinus arrhythmia (RSA) is an index of parasympathetic influence on the periodic oscillation in sinus rhythm occurring at the frequency of respiration. RSA is calculated using the interbeat intervals recorded as the R-peaks on an electrocardiogram (ECG) and respiratory rates derived from the impedance (e.g., dZ/dt) wave at a bandwidth range of 0.15–0.80 Hz. 34 When the PNS withdraws, there is a decrease in the RSA index.
PEP is an indirect, noninvasive measure of the sympathetic influence on a specific interval of the cardiac cycle. PEP is the duration (measured in milliseconds) of the isovolumetric contraction in the left ventricle before the aortic valve opens. When the SNS is activated, the time interval of PEP shortens and PEP (in milliseconds) decreases. Heart rate can increase in response to decreasing RSA, decreasing PEP, or both.
A standardized protocol was administered to the children while continuous measures of RSA and PEP were collected.28,35 The social (interview), cognitive (number recall), physical (taste concentrated juice), and emotional challenges (scary video) were 2 minutes each and represented normative, common challenges for each developmental period. The challenges were preceded and followed by 3-minute resting intervals, during which stories were read aloud. The protocol was slightly modified to be developmentally appropriate and engaging at each age by changing the story read aloud, level of challenge for the number recall task, type of concentrated juice, and video at each age. Reactivity difference scores were calculated as the mean response across the challenges minus the first resting condition. 36
Protocols were administered by bilingual, bicultural staff in private rooms located in a research office next to the local hospital or a recreational vehicle redesigned as a research lab and parked in front of the participants' home. The protocol was administered at different times of the day in the child's language of choice, either Spanish or English. Inter-rater reliability was assessed at least four times each year qualitatively. The fidelity of the protocol was assessed by observing the protocol administration and electrode placement through on-site observations or video tapes of the protocol by two research staff. Impedance and ECG data were collected using spot electrodes, acquired using the Biopac MP150 (Biopac Systems, Inc., Goleta, CA), and filtered, extracted, and scored using Mindware software (Mindware Technologies, Gahanna, OH). The protocol was administered at least 5 minutes after the equipment was in place to reduce the potential stress of the placement of equipment and ensure optimal electrode conduction. Data cleaning procedures included checking summary scores for outliers (>3 standard deviations [SD]) and missing minute-by-minute data. 28 Details on the ANS data collection procedures, data cleaning, and missing data are presented elsewhere. 28
Anthropometrics
Weight and height were collected on the children at 2, 3.5, and 5 years of age using a calibrated digital scale (Mother-Baby Scale Model 1582; Tanita Corp., Arlington Heights, IL) and wall-mounted stadiometer, respectively.8,9 Height was measured three times consecutively and then averaged. BMI was calculated as weight in kilograms divided by mean height in meters squared and then standardized (zBMI) using the age- and sex-specific BMI percentile data issued by the 2000 CDC. 37 Continuous measures of zBMI were used in the structural equation modeling (SEM) to include the full range of zBMI and reduce measurement error. zBMIs were also categorized as normal weight (<85th percentile), overweight (≥85th and <95th percentile), or obese (≥95th percentile) to compare with other studies.
The mothers' prepregnancy BMIs were calculated from self-reported prepregnancy weight and measured height. If a self-reported prepregnancy weight was unavailable or invalid, the weight at the first prenatal visit or imputed weight, based on patterns of pregnancy weight gain, was used.
Child behaviors
Each child's sedentary behavior (i.e., number of hours spent watching TV per day), physical activity (i.e., hours playing outside per day), and eating habits (i.e., number of times child ate fast food per week) 8 was assessed during the maternal interview at each visit.
Statistical Analysis
One-way frequency analyses were conducted to describe proportions, and Pearson's correlations were conducted to assess bivariate relationships. Then, path analyses among the observed variables were conducted using SEM. The SEM models included the cross-sectional associations between ANS (i.e., PEP and RSA reactivity) at 3.5 and 5 years and zBMI at 3.5 and 5 years or change in zBMI from 2 to 3.5 years and from 3.5 to 5 years. In addition, the unidirectional predictive relationships between zBMI or zBMI change at time t and ANS at time t+1, and ANS at time t and zBMI or zBMI change at time t+1, were conducted using SEM (Figs. 1 and 2). Initial models controlled for anthropometric characteristics: mother's prepregnancy BMI and change in child's height between 2 and 3.5 and 3.5 and 5 years of age. Mother's BMI is consistently associated with their children's BMI, especially for overweight and obese children.2,38 Changes in child's height at young ages is associated with a higher risk of obesity. 26 Subsequent models also controlled for children's behaviors at 3.5 and 5 years of age, including hours watching TV, hours playing outside, and weekly fast food consumption. In other studies, these behaviors were associated with BMI,11,39,40 not ANS. Last, effect sizes were calculated within the SEM models as the standardized beta coefficients and overall R-square.
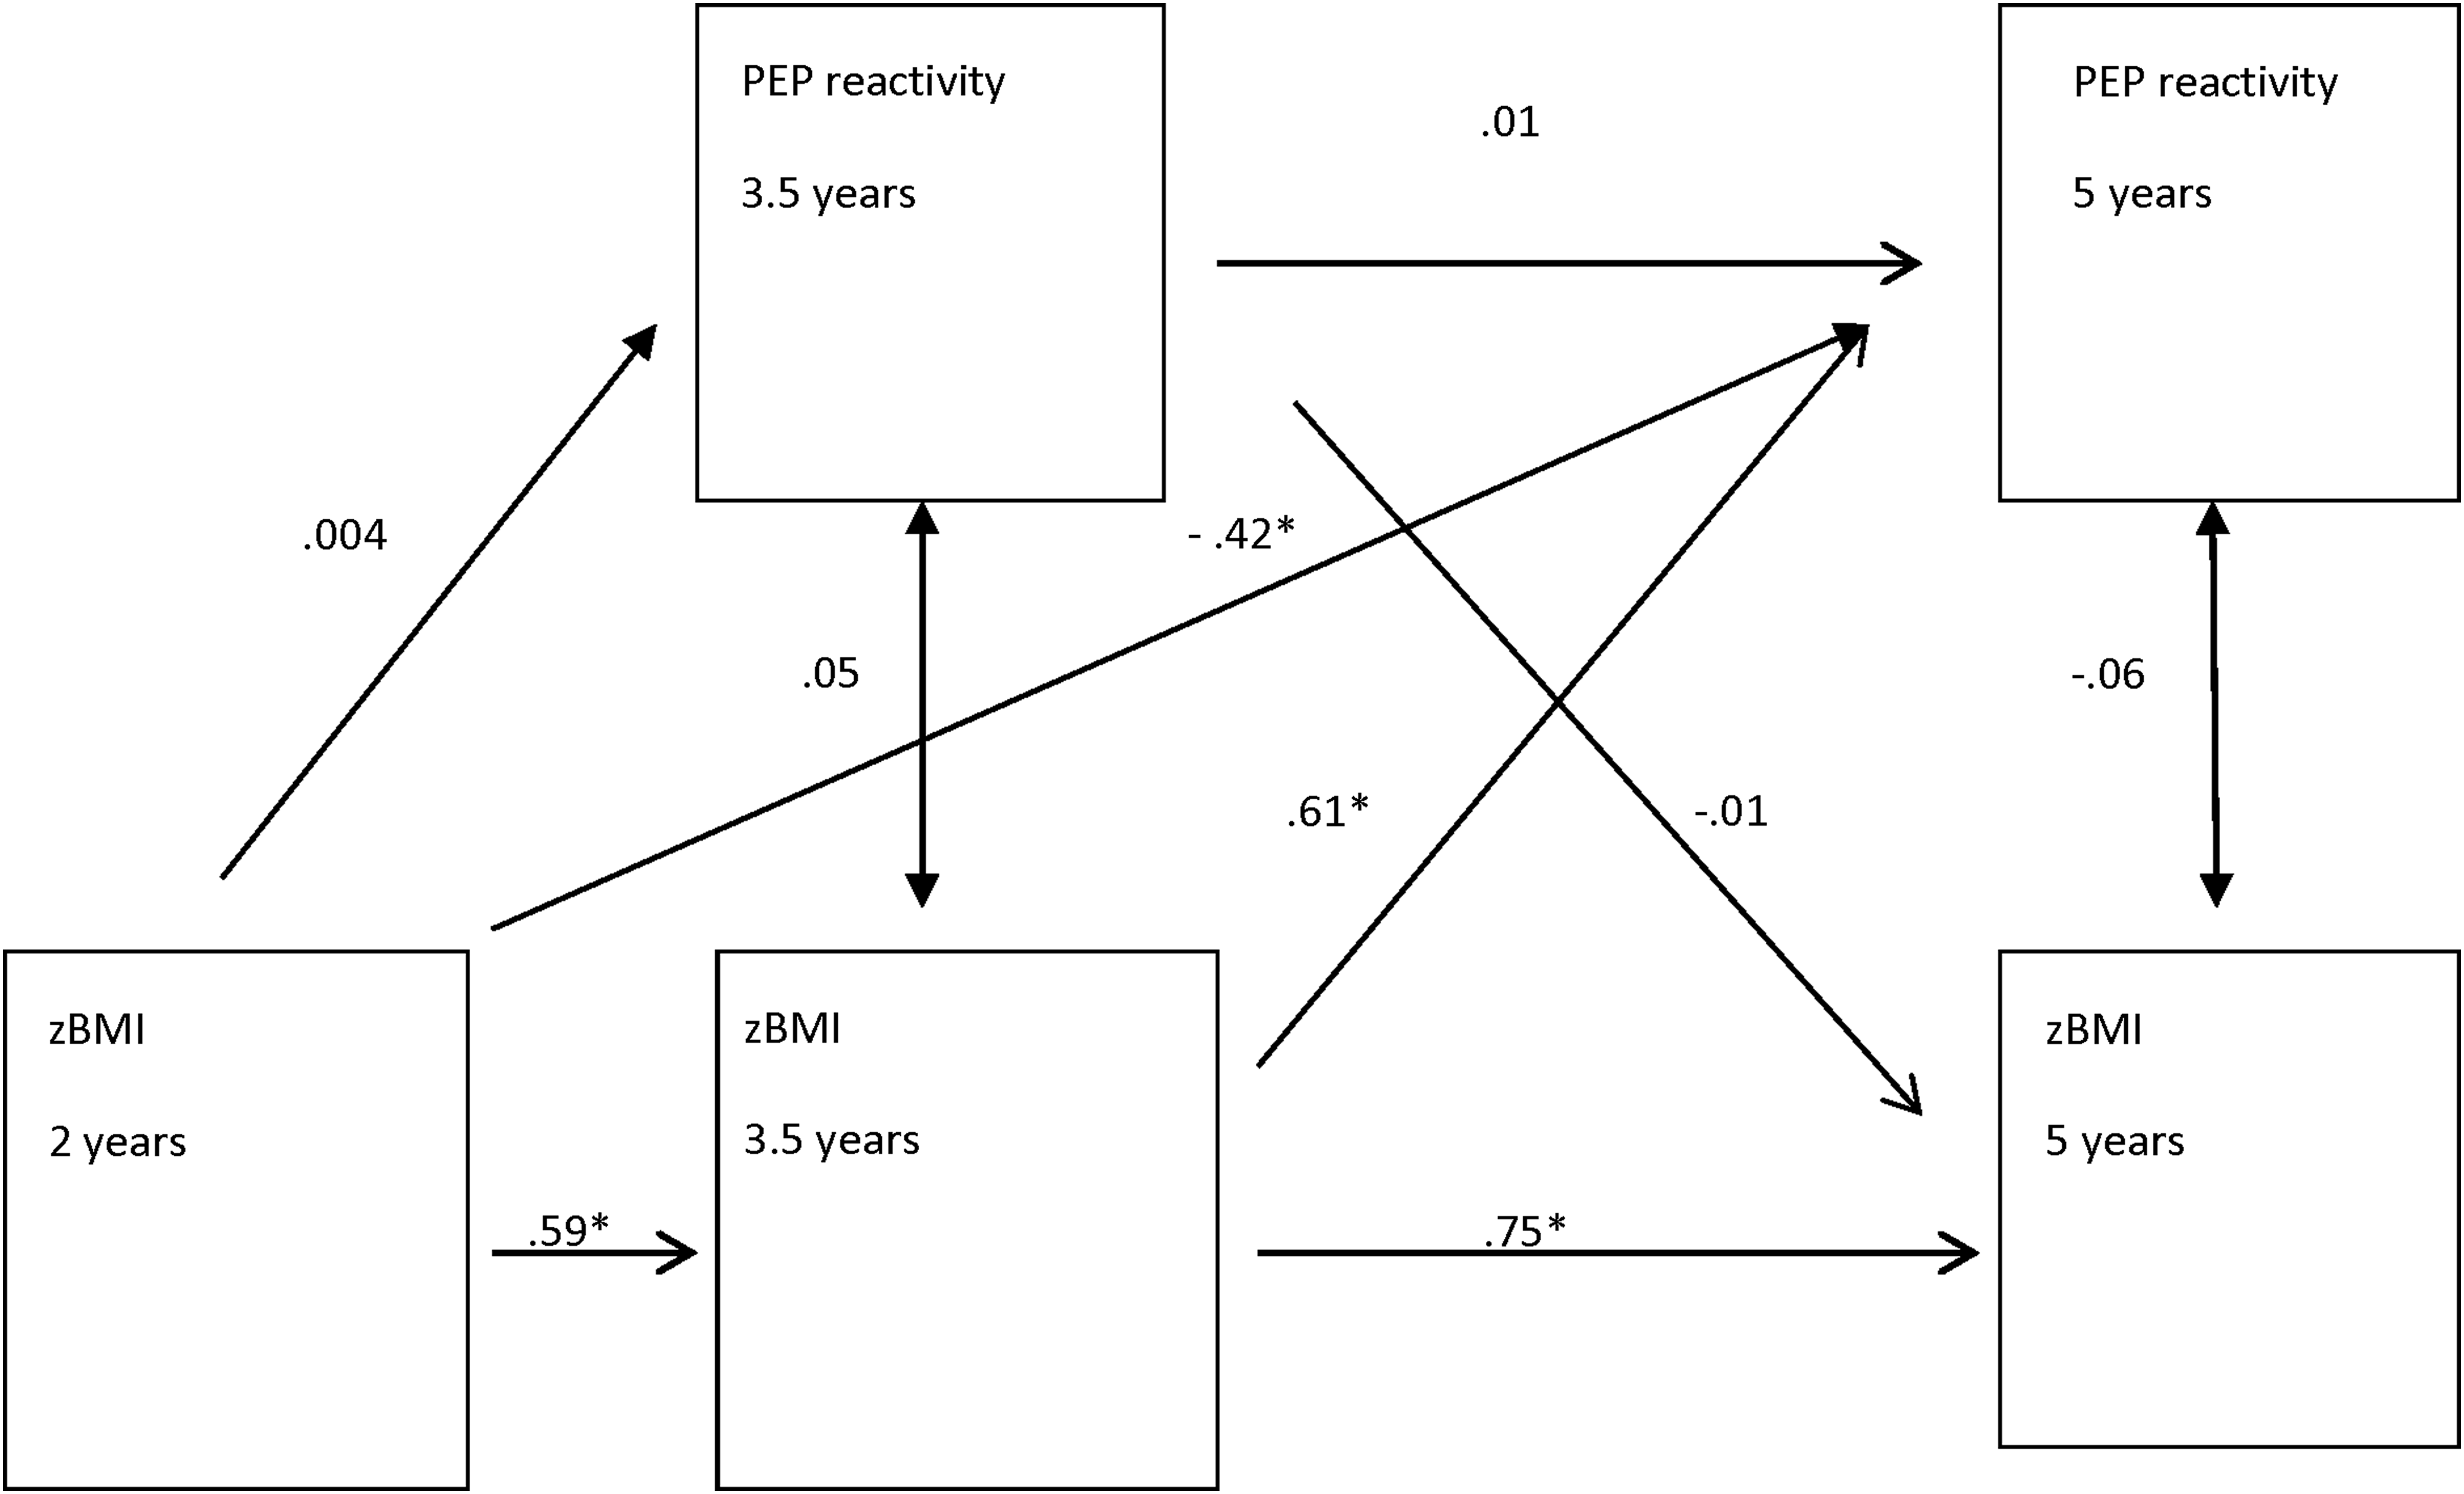
Relationship between zBMI and PEP reactivity (difference scores) with anthropometric covariates (n=112). Unstandardized coefficients and corresponding significant p values. *p<0.05. Model controls for mother's prenatal weight and child's change in height from 2 to 3.5 and from 3.5 to 5 years of age. Global model fit results: χ2 (df)=23.04 (11); p=0.02; comparative fit index (CFI)=0.95; root mean square error of approximation (RMSEA)=0.10; standardized root mean square residual (SRMR)=0.07. See Supplementary Table 1A for details (see online supplementary material at www.liebertpub.com/chi). zBMI, standardized BMI; PEP, pre-ejection period.
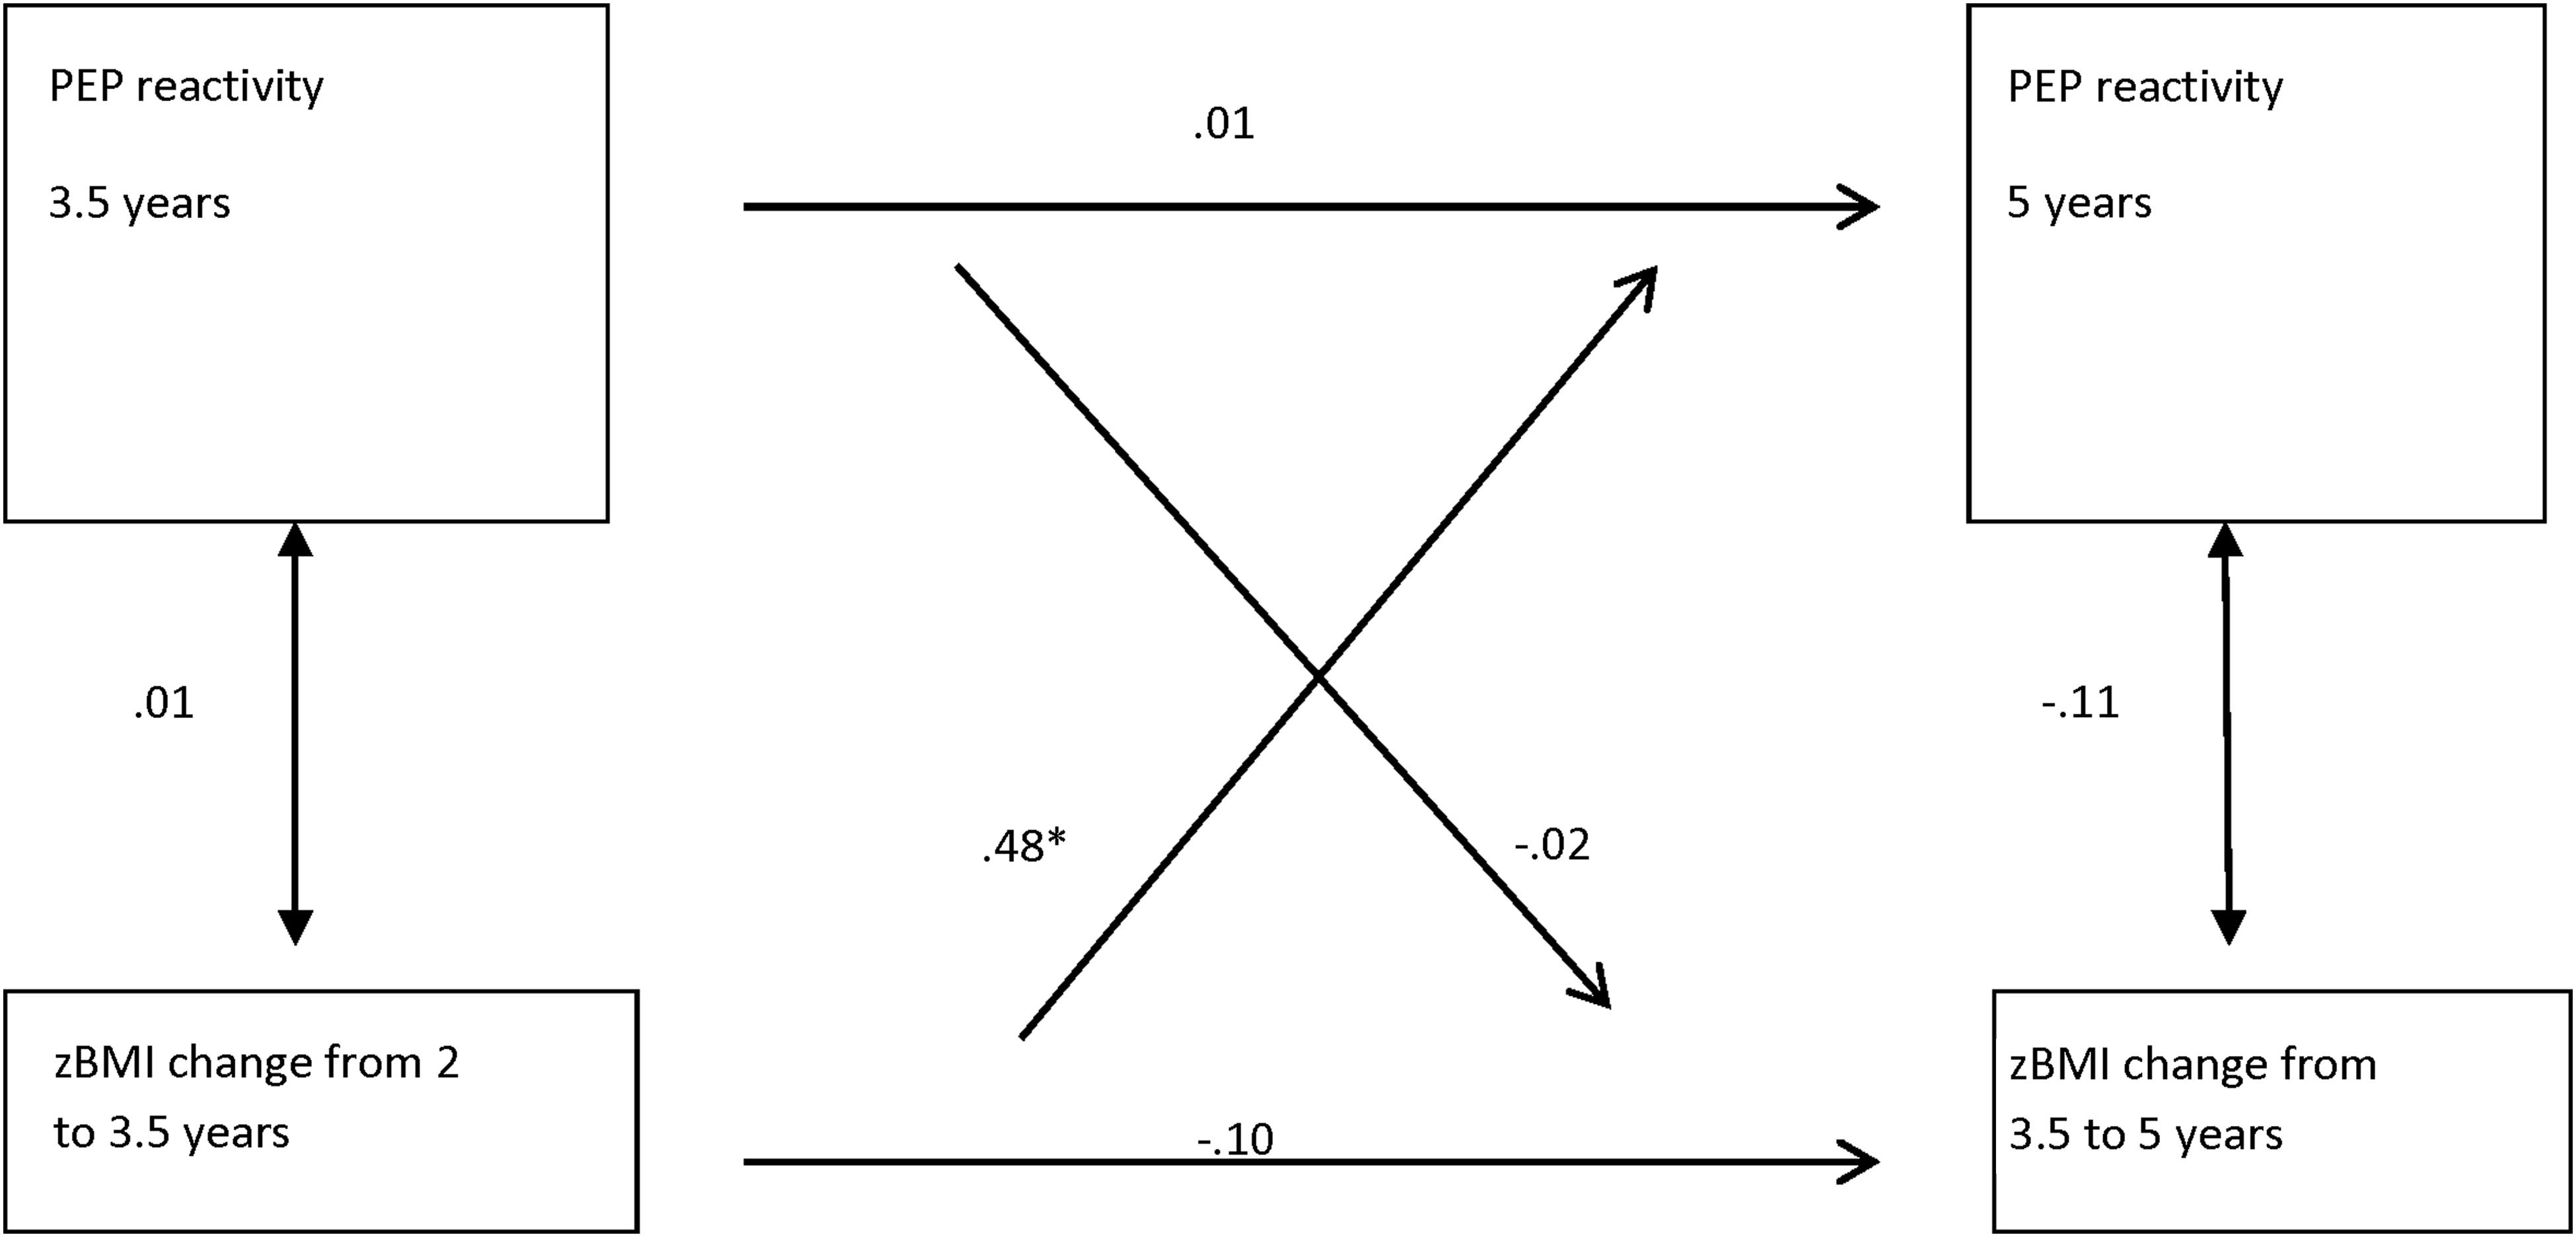
Relationship between zBMI change and PEP reactivity (difference scores) with anthropometric covariates (n=112). Unstandardized coefficients and corresponding significant p values. *p<0.05. Model controls for mother's prenatal weight and child's change in height from 2 to 3.5 and from 3.5 to 5 years of age. Global model fit statistics: χ2 (df)=8.10 (5); p=0.15; comparative fit index (CFI)=0.62; root mean square error of approximation (RMSEA)=0.07; standardized root mean square residual (SRMR)=0.04. See Supplementary Table 1B for details (see online supplementary material at www.liebertpub.com/chi). zBMI, standardized BMI; PEP, pre-ejection period.
Post-hoc analyses included t-tests to determine whether the duration of being overweight or obese differed by mean RSA or PEP reactivity at 3.5 or 5 years of age.
Frequencies and correlations were generated using Stata 11 statistical software (StataCorp LP, College Station, TX). SEMs were estimated using Mplus 6.12 with maximum likelihood, robust standard errors, and test statistics (Mplus estimator MLR). 41 Global model fit was evaluated by the chi-square test of exact model fit and the following descriptive fit indices: Bentler's comparative fit index (CFI) 42 ; the root mean square error of approximation (RMSEA) 43 ; and the standardized root mean square residual (SRMR). 44 Simulation studies suggest that if the chi-square test is nonsignificant or if two of the following criteria are met, model-data fit can be considered satisfactory: CFI ≥0.95; RMSEA ≤0.06; and SRMR ≤0.08. 45
Results
Demographic Characteristics
The majority of the 112 families lived in two-parent, low-income, Spanish-speaking families of Mexican origin (Table 1). The majority of the mothers were overweight or obese before they were pregnant. The outcome variables, zBMI, RSA reactivity, and PEP reactivity, did not differ by sex; thus, sex was not controlled for in the analyses.
Demographic Characteristics a
n=112.
SD, standard deviation.
Body Mass Index
The children's zBMI increased with age and was strongly, positively correlated across the ages (Table 2). There was a weak-to-moderate, positive association between a mother's prenatal BMI and her child's zBMI.
Descriptive Statistics and Correlations of BMI, ANS, and Other Anthropometric Variables *
p<0.05.
ANS, autonomic nervous system; zBMI, standardized BMI; RSA, respiratory sinus arrhythmia; PEP, pre-ejection period; SD, standard deviation.
Using the CDC's categories of BMI, the percent of children with normal weight declined from 75% at 2 years of age to 44% at 5 years and the percent of children overweight and obese more than doubled between 2 and 5 years of age (Table 3).
Frequency of Children's BMI Category by Age
Based on the CDC's BMI categories.
Child Behaviors
The majority of 3.5-year-old children watched TV 3 or more hours a day (79%) and ate fast food more than once a week (59%), whereas 27% spent less than 1 hour per day outside playing. Approximately 50% of the 5 year olds watched TV 3 or more hours per day, 56% of the children ate fast food more than once a week, and 16% spent less than 1 hour per day playing outside.
Autonomic Nervous System Measures
Table 2 shows the mean (SD) of the RSA and PEP resting and reactivity measures at 3.5 and 5 years. The ANS measures were normally distributed at each age. As children got older, their resting RSA and PEP increased and reactivity measures remained close to zero. There was a moderate, negative relationship between RSA resting and reactivity measures. Therefore, children with high RSA resting states had lower RSA reactivity indices, which supports the “law of initial values.”46,47 There was a very weak, negative relationship between PEP resting and reactivity measures.
Autonomic Nervous System and Standardized Body Mass Index
There were weak associations between zBMI and RSA and PEP resting and reactivity at each age (Table 2). In the SEMs, there were very weak and nonsignificant cross-sectional associations between zBMI and PEP reactivity at 3.5 and 5 years of age, respectively (Fig. 1). There were no significant cross-sectional associations between zBMI and RSA reactivity at 3.5 or 5 years of age.
There was moderate-to-strong stability in zBMI from 2, 3.5, and 5 years of age, but there was no stability in PEP reactivity (Fig. 1) or RSA reactivity from 3.5 to 5 years. Therefore, the children in the sample who had high zBMIs at 2 years of age were likely to have high zBMIs at 3.5 and 5 years of age.
The longitudinal, directional SEM models showed no significant predictive association of earlier zBMI and later RSA reactivity or vice versa. However, zBMI at both 2 and 3.5 years significantly predicted later PEP reactivity at 5 years of age, controlling for anthropometric factors (i.e., mother's BMI and child's change in height; Fig. 1; Supplementary Table 1A; see online supplementary material at www.liebertpub.com/chi), but not vice versa. There was no significant predictive association of PEP reactivity at 3.5 years predicting later zBMI at 5 years. The direction of the relationship of zBMI and later PEP reactivity changed from being negative at 2 years (–0.42) to positive at 3.5 years of age (0.61). This shows that children with high zBMIs at 2 years of age had increased sympathetic activation during challenging conditions, compared to their resting state (i.e., negative PEP reactivity), at 5 years, but children with high zBMIs at 3.5 years had a decreased or dampened sympathetic response during challenging conditions, compared to their resting state at 5 years (i.e., positive PEP reactivity). The SEM statistics showed that this model was a good fit (Fig. 1; Supplementary Table 1A; see online supplementary material at www.liebertpub.com/chi). The subsequent model controlling for both anthropometric and behavioral variables had similar substantive results for the significant estimates as the initial models with unchanged signs and significance, but the model fit statistics were not as strong.
Autonomic Nervous System and Changes in Standardized Body Mass Index
There were no significant cross-sectional associations between the children's changes in zBMI from 2 to 3.5 years or from 3.5 to 5 years and PEP and RSA reactivity at 3.5 and 5 years, respectively (Fig. 2). Additionally, there was no stability in the children's changes in zBMI nor PEP or RSA reactivity from 3.5 to 5 years of age. There were no significant longitudinal, directional associations between changes in zBMI and RSA reactivity.
On the other hand, the longitudinal, directional SEM models showed that children's changes in zBMI from 2 to 3.5 years significantly predicted later PEP reactivity at 5 years of age, controlling for anthropometric variables (i.e., mother's prenatal weight and child's change in height), but not vice versa. PEP reactivity at 3.5 years did not predict changes in zBMI from 3.5 to 5 years (Fig. 2; Supplementary Table 1B; see online supplementary material at www.liebertpub.com/chi). The positive, directional association between changes in zBMI from 2 to 3.5 years and PEP reactivity at 5 years (0.48) shows that some children who increased their zBMI also increased their PEP reactivity. These children had decreased or dampened sympathetic activation during the challenging conditions, compared to their resting state. The SEM statistics showed that this model was a good fit. The subsequent model, controlling for both anthropometric and behavioral variables, had similar substantive results for the significant estimates as the initial models with unchanged signs and significance, but the model fit statistics were not as strong.
Effect-size estimates of the significant models are shown as the standardized beta coefficients (see Supplementary Tables 1A and 1B; see online supplementary material at www.liebertpub.com/chi) and overall model R-squares. The standardized coefficients represent the standard deviation change in the dependent variable per standard deviate change in the independent variable. The overall R-square for a given dependent variable represents the proportion of variance in the dependent variable accounted for by the combination of independent variables. The overall R-square for the model with zBMI at 2, 3.5, and 5 years and PEP reactivity at 3.5 and 5 years was 0.11 and the overall R-square for the model with zBMI change and PEP reactivity was 0.02.
Post-hoc analyses showed that there was a significant relationship between being overweight and obese from 3.5 to 5 years and a decreased or dampened PEP reactivity at 5 years of age (mean [SD], −0.10 [0.2]; n=43), compared to children who were not consistently overweight or obese or healthy weight at both time points (mean [SD], −0.82 [0.2]; n=69; t (df), −2.53 [110]; p=0.01). There was no significant relationship between being overweight or obese, compared to not being overweight or obese, from 2, 3.5, to 5 years of age and RSA reactivity. There was no significant relationship between being overweight or obese, compared to not being overweight or obese, from 2 to 5 years (n=25) and PEP reactivity.
Discussion
This study is one of the first cohort studies to investigate the direction of the relationship between zBMI and ANS reactivity in early childhood. zBMI at 2 and 3.5 years predicted PEP reactivity at 5 years. Specifically, children with high zBMI at 2 years had increased SNS reactivity (i.e., negative PEP reactivity) at 5 years, but this relationship changed by 3.5 years of age. Children with high zBMI at 3.5 years or large increases in zBMI from 2 to 3.5 years of age had decreased or dampened SNS reactivity (i.e., positive PEP reactivity) at 5 years of age, compared to children with more stable zBMIs. There was no significant relationship between zBMIs and PNS (i.e., RSA) reactivity.
Early ANS activity did not predict later obesity. This finding is counter to the hypothesis that young children with decreased SNS and increased PNS activation will have high BMIs when they get older.13,14 Two previous cohort studies investigated ANS and obesity in children. African American children who had decreased PNS (i.e., RSA reactivity) at 5.5 years had high BMIs at 10.5 years of age. 48 The other cohort study of African American and European American 8 to 10 year olds found a relationship between early BMI and later ANS in the opposite direction of our study. Children with increased BMIs at 8 years had increased, not decreased, PEP reactivity at 10 years of age. 49 This study also found no relationship between BMI and later RSA reactivity at 10 years of age, which is supported by our null findings for early BMI increase and later RSA reactivity at 5 years of age. These two cohort studies also found differences in ANS and BMI findings by African American and European American school-age children. Racial and ethnic differences need to be explored further in future studies.
Although other studies have found significant relations between social and behavioral factors and children's BMI, our study's findings did not differ when hours watching TV, hours playing outside, and eating fast food were included in the model.2,8,9,11
Several cross-sectional studies of school-age children who were overweight or obese showed that they had decreased SNS and PNS activity, compared to same-age healthy weight children.13,23 Our findings also found that children who were overweight or obese had decreased or dampened SNS activity, but there was no relationship between BMI and PNS activity. The relationship between BMI and ANS may differ for school-age versus preschool-age children. Additionally, PEP and RSA were measured to assess SNS and PNS activity, respectively, whereas the majority of other studies measured HRV and one study measured pupillography 21 as their ANS measure. PEP is a more direct measure of SNS activity than the ratio of low- to high-frequency HRV or pupillography. Although these ANS measures are similar, they are not the same and thus may explain some inconsistencies across studies' findings.
This study's findings that children with high zBMIs at 2 years had increased SNS reactivity and children with large increases in zBMIs from 2 to 3.5 years of age had decreased SNS reactivity at 5 years is supported by other studies. In a study of adolescents, children who were recently obese (<4 years) had sympathetic activation, but the children with a longer duration of obesity (>7 years) showed a decrease in sympathetic activation or dampened response. 27 In a study of school-age children in Japan, duration of obesity was associated with decreased SNS and PNS under resting conditions. 50 Decreased SNS responses have also been associated with the metabolic syndrome of obesity, 19 as well as disordered eating behaviors in adults 51 and an increase in food intake in animals. 17
It is interesting that the children in this study with high zBMI at 2 years of age had increased SNS reactivity yet the children who gained weight rapidly from 2 to 3.5 years had decreased SNS reactivity. The importance of understanding the physiologic effect of large increases in weight at early ages is underscored by cohort studies that show that rapid increases in BMI between 2 and 5 years of age predict obesity at 82 and 12 years of age. 52 These studies and our findings together suggest that there may be a sensitive period early in childhood when rapid increases in BMI affect children's metabolic status and neurobiologic development and, subsequently, ANS regulation.
Understanding the pathophysiologic mechanisms may help explain the sensitive periods of development. The PNS is related to the development of obesity when there are deficits in self-regulation or decreases in PNS activation. 48 The vagus nerve, which activates the PNS, innervates the stomach and has a role in satiety and short-term regulation of food intake. In addition, the SNS is related to obesity when there is decreased or dampened activity.19,51 Decreased SNS activity may affect the amount of fat mass in humans. 13 Sensitive periods of development are marked by stressful experiences, which are embedded in a child's biologic programming. 53 Children who experience multiple adversities early in life may initially have increased SNS reactivity, but, over time, there is wear and tear on bodily systems known as allostatic load and there are decreases specifically in the SNS response system. 31 For example, children with metabolic syndrome initially exhibit PNS and SNS activation, but with subsequent weight gain may have decreased SNS activation over time. 18 As children's weight gain becomes a physiologic stressor, they may show signs of allostasis by decreasing or dampening their ANS responses to stressful conditions. The body attempts to restore balance after acute stressors, but if there are repeated triggers on their metabolic systems, dysregulation across multiple systems occurs. Subsequently, there are declines in physical health and premature mortality later in life. 54
The evolutionary explanations of our study's findings are supported by animal studies of doves with decreased sympathetic reactivity, increased parasympathetic reactivity, and higher body fat. One of the activation patterns in the brain is the stimulation ventrolaterally within the periaqueductal gray matter, which evokes immobility or conservation as a type of response. This is a type of reactive coping style that is associated with doves' orienting reflex and freezing-hide responses. 15 Although our study found that children with high BMI early in life developed decreased sympathetic reactivity at 5 years of age, they did not have an associated increased parasympathetic reactivity response.
Although this study reports novel findings, there are limitations in the design and measures. Mother's self-report of their prepregnancy weight was subject to bias, although the majority of the reports were validated with later BMI measures. Although the height and weight measures for each child were collected on 1 day, day-to-day variations within child may lead to inconsistencies in the measures. The SEMs did not include other factors associated with high BMI, such as consumption of sweetened beverages or stressful life events, because of power and sample-size restrictions. Children's medication use, which could augment or suppress ANS, was not known and thus could not be controlled for in the analyses. Finally, these results come from a relatively small sample of low-income, primarily Latino children and thus the findings can only be generalized to similar populations. Such findings must be replicated in a larger, more diverse racial/ethnic and socioeconomic sample.
Conclusion
Despite these limitations, the findings provide valuable insight into early weight gain and its effect on the responsivity of the ANS in a Latino population at high risk for obesity-related diseases. This population is decidedly underrepresented in current health research. ANS dysregulation is related to future disease risks for metabolic syndrome, reduced satiety cues, and behavior problems. Health policies and primary care interventions are needed that provide both targeted and universal strategies to reduce the rapid rise in the number of young children who are overweight and obese.
Footnotes
Acknowledgments
This study was funded by the National Institute of Environmental Health Sciences (ES009605), the US Environmental Protection Agency (R826709011 and RD-83171001), and the National Institute of Child Health and Human Development (ARRA 445211-33252-01 HD058091).
The authors thank the parents and children who participated in the study. The authors also thank the CHAMACOS staff who helped facilitate and collect the data: William Brockett, Norma Calderon, Ellie Gladstone, Selene Jaramillo, Katie Kogut, Amy Marks, Cristina Santana, Gloria Vargas, Nicole Vujan Davis, Erin Weltzien, and Edith Nava.
Author Disclosure Statement
No competing financial interests exist.
References
Supplementary Material
Please find the following supplemental material available below.
For Open Access articles published under a Creative Commons License, all supplemental material carries the same license as the article it is associated with.
For non-Open Access articles published, all supplemental material carries a non-exclusive license, and permission requests for re-use of supplemental material or any part of supplemental material shall be sent directly to the copyright owner as specified in the copyright notice associated with the article.