
Abstract
Background:
Generalized anxiety disorder (GAD) and social anxiety disorder (SAD) are distinguished by whether anxiety is limited to social situations. However, reports on the differences in brain functional networks between GAD and SAD are few. Our objective is to understand the pathogenesis of GAD and SAD by examining the differences in resting brain function between patients with GAD and SAD and healthy controls (HCs).
Methods:
This study included 21 patients with SAD, 17 patients with GAD, and 30 HCs. Participants underwent psychological assessments and resting-state functional magnetic resonance imaging. Whole-brain analyses were performed to compare resting-state functional connectivity (rsFC) among the groups. In addition, logistic regression analysis was conducted on the rsFC to identify significant differences between GAD and SAD.
Results:
Patients with SAD and GAD had significantly higher rsFC between the bilateral postcentral gyri and bilateral amygdalae/thalami than HCs. Compared with patients with SAD, those with GAD had significantly higher rsFC between the right nucleus accumbens and bilateral thalami and between the left nucleus accumbens and right thalamus. rsFC between the left nucleus accumbens and right thalamus positively correlated with state anxiety in patients with SAD and GAD, respectively. In addition, logistic regression analysis revealed that the right nucleus accumbens and the right thalamus connectivity could distinguish SAD from GAD.
Conclusions:
GAD and SAD were distinguished by the right nucleus accumbens and the right thalamus connectivity. Our findings offer insights into the disease-specific neural basis of SAD and GAD.
Clinical Trial Registration Number: UMIN000024087.
Impact Statement
This study is the first to identify a resting state functional connectivity that distinguishes social anxiety disorder (SAD) from generalized anxiety disorder (GAD) and to clarify a common connectivity in both disorders. We found that the connectivity between the right nucleus accumbens and the right thalamus differentiated SAD from GAD. Furthermore, these rsFC differences suggest an underlying basis for fear overgeneralization. Our findings shed light on the pathophysiology of these conditions and could be used as a basis for further studies to improve outcomes for such patients.
Introduction
Social anxiety disorder (SAD) and generalized anxiety disorder (GAD) are psychiatric disorders that often coexist and are associated with anxiety and phobic symptoms (Craske et al., 2009). SAD is characterized by anxiety and avoidance of social situations, whereas GAD is characterized by worry about a wide range of everyday situations (Blair et al., 2012). Both GAD and SAD are included in the anxiety group in the Diagnostic and Statistical Manual of Mental Disorders (DSM)-5, but they stand alone as separate diagnoses (APA, 2013). However, recent evidence suggests that neurobiological similarities exist between GAD and SAD and that reliance on current diagnostic criteria is insufficient (Martin et al., 2009; Rabany et al., 2017). Therefore, studies using brain magnetic resonance imaging (MRI) are underway to elucidate the pathophysiology of GAD and SAD and to identify biomarkers for use as objective indicators.
In brain imaging studies of mental disorders, structural and functional abnormalities in regions such as the cortex and subcortical areas (limbic system, basal ganglia) have been reported (Langhammer et al., 2024; Marchand, 2010; Matsumoto et al., 2023; Opel et al., 2020). The cortex and subcortical areas function as large-scale networks. Analyzing these networks is a powerful tool for understanding the pathophysiology of mental disorders (Menon, 2011). Notably, the large networks formed by the cortex and subcortical areas are known as the CSTC circuit. In addition, abnormalities in this circuit cause various maladaptive behaviors in psychiatric disorders (van den Heuvel et al., 2016).
Brain MRI studies in patients with GAD and SAD were focused on the activation of fear circuits in association with “fear conditioning,” which is considered the fear-learning process in anxiety, in addition to focusing on brain regions associated with CSTC circuits in both disorders. The center of the fear circuit is the amygdala, which is the center of emotion; other constituent regions, such as the prefrontal cortex, hippocampus, insula, and thalamus, have been identified (Davis and Whalen, 2001; Quirk and Mueller, 2008). Structural abnormalities and overactivation of the prefrontal cortex, hippocampus, and amygdala have been reported in both patients with SAD and those with GAD (Brühl et al., 2014; Kolesar et al., 2019). GAD has been associated with “fear overgeneralization” as an anxiety-generating fear-learning process (Carlson et al., 2014; Lissek et al., 2014). Fear overgeneralization is particularly relevant in the hippocampus, striatum, and ventromedial prefrontal cortex (Lissek, 2012).
However, there are a limited number of studies that directly compared GAD and SAD, and only 13 used functional MRI (fMRI). Specifically, task fMRI has been reported the most (10 studies), whereas resting-state fMRI (rsfMRI) has been reported in only two studies.
The following were the findings of some of the 10 task-based fMRI studies. A common feature between patients with GAD and SAD compared with those of healthy controls (HCs) was reduced activity in the amygdala and ventrolateral prefrontal cortex during a fear conditioning task (Blair et al., 2012; Fitzgerald et al., 2019). In addition, amygdala activation increases during fearful facial expression judgment, particularly in the right amygdala, which is associated with trait anxiety (Park et al., 2020). In a comparison of the two disorders, patients with SAD exhibited increased amygdala activation in a fearful facial expression task compared with that in HCs. In contrast, patients with GAD exhibited significantly less activity (Blair et al., 2008). In addition, in a threat stimulus task, patients with GAD overreacted to threats, exhibiting increased activity in the dorsolateral prefrontal cortex (Buff et al., 2016). In a reward prediction task, the SAD group showed higher levels of caudate and putamen activation than the HCs and GAD groups while anticipating greater rewards.
Furthermore, patients with GAD exhibited nucleus accumbens activation in response to smaller rewards than did those with SAD (Guyer et al., 2012). The results of these task-based fMRI studies suggest that GAD and SAD function differently in terms of neural circuits (Blair et al., 2008). In summary, the clinical distinction between GAD and SAD is clear, and differences in striatal regions and amygdala function have been reported using task-based fMRI.
RsfMRI is a widely used method for characterizing the functional organization of the brain at rest (Liu and Falahpour, 2020). Resting-state functional connectivity (rsFC) measures the temporal correlation of spontaneous blood oxygenation level-dependent (BOLD) signals between spatially distant brain regions when no explicit tasks are being performed (Kim and Yoon, 2018). The advantages of rsFC include its high reliability and reproducibility. It is also task-independent, making it relatively easy to measure and applicable to young children and older people (Peterson et al., 2014).
The findings of two rsfMRI studies that compared GAD and SAD were as follows. The first study found that the rsFC of the amygdala with the default mode network (DMN) and salience network (SN) in patients with GAD and SAD is associated with reduced emotion regulation capacity (Rabany et al., 2017). The second study also suggested that DMN dysfunction underlies the stronger thinking characteristic in patients with GAD than in those with other anxiety disorders (Yuan et al., 2023). Both studies focused on ROIs related to the DMN rather than using a whole-brain analysis, allowing for statistical comparison of all voxels, and both showed reduced rsFC in the DMN. However, findings regarding the role of the SN and other networks, as well as the specific networks that are common to both disorders, are inconsistent and unclear. Moreover, the network that distinguishes the two disorders has not been reported and remains unknown.
Since there are only two rsfMRI studies that compared GAD and SAD, it is worthwhile to investigate further the differences in the resting-state brain networks between these disorders. We hypothesized that patients with GAD and SAD would share differences in the network of brain regions associated with anxiety and fear circuits compared with HCs and that there would be differences in the network associated with fear overgeneralization in both disorders. This is the first study to compare GAD and SAD using whole-brain analysis. Therefore, the purpose of this study was to understand the pathogenesis of GAD and SAD by examining the differences in whole brain-based resting brain function between patients with GAD and SAD and HCs.
Methods
Participants
Patients with SAD and GAD were recruited from the Chiba University Hospital. Healthy participants were recruited from the Research Center for Child Mental Development at Chiba University. This study was approved by the Research Ethics Committee of the Graduate School of Medicine, Chiba University (approval no. M10545), and all participants provided written informed consent. The inclusion criteria for this study were providing informed consent to participate in the study and age between 18 and 60 years of age. The exclusion criteria were organic brain damage, dementia, psychotic disorders, serious drug dependence, recurrent suicidal and antisocial behaviors, severe somatic conditions, and possible pregnancy.
The diagnosis of patients with SAD and GAD was made by experienced psychiatrists based on the fifth edition of the Clinical Manual of Mental Disorders (DSM-5). The total number of patients with SAD was 29; 4 refused to participate, 1 refused MRI, and 3 withdrew from the study before completion. The total number of patients with GAD was 23, of whom 5 refused to participate and 1 refused MRI. Seventeen patients with GAD were included in the analysis. Healthy participants were controlled for age and sex using propensity score matching.
Psychological scales
Social anxiety was assessed using the Liebowitz Social Anxiety Scale (LSAS) (Liebowitz, 1987), which is commonly used to measure the severity of social anxiety and treatment effectiveness (Baker et al., 2002). It differs from many other social anxiety scales in that it assesses anxiety and avoidance in specific social situations rather than assessing specific symptoms (Beard et al., 2011).
Anxiety was assessed using the State-Trait Anxiety Inventory (STAI) (Spielberger et al., 1983), the most widely used measure of anxiety states and traits. It has demonstrated excellent reliability (Barnes et al., 2002) and validity (Kabacoff et al., 1997) and can measure anxiety in both healthy and clinical populations (Oei et al., 1990).
Screening and severity assessment for generalized anxiety were conducted using the 7-item Generalized Anxiety Disorder Module (GAD-7), which is one of the most widely used anxiety scales in clinical practice and is quick and easy to score and is applicable to the screening, diagnosis, and severity assessment of other anxiety disorders in addition to GAD (Spitzer et al., 2006).
Depressive symptoms were assessed using the Beck Depression Inventory-II (BDI-II) proposed by Beck (Beck et al., 1961). The BDI-II is one of the most widely used measures of depressive symptoms and has demonstrated high reliability and validity (McDowell, 2006; Wang and Gorenstein, 2013).
Imaging data acquisition
MRI images of all participants were acquired using a Discovery MR 750 3.0-T MRI system at Chiba University Hospital with a 32-channel head coil (GE Healthcare, Waukesha, WI, USA), and T1-weighted images were acquired using a three-dimensional (3D) magnetization preloaded fast acquisition gradient echo sequence (slices = 196, echo time = 3.18 ms, repetition time = 8.168 ms, flip angle = 11°, invention time = 400 ms, matrix = 256 × 256, thickness = 1.2 mm, voxel size = 1.0 × 1.0 × 1.2 mm3). During rsfMRI scanning (610 s), participants were instructed to lie still, keep their eyes open, and focus on a cross on the screen. RsfMRI was also performed using a gradient-echo echo planar imaging sequence (slices = 40, repetition time = 2500 ms, echo time = 30 ms, flip angle = 80°, matrix = 64 × 64, thickness = 3.2 mm, voxel size = 3.3 × 3.3 × 3.2 mm3, and volumes = 244).
MRI data preprocessing
Functional connectivity preprocessing performed using the CONN toolbox (Whitfield-Gabrieli and Nieto-Castanon, 2012) of SPM12 software (Wellcome Trust Centre for Neuroimaging, London, www.fil.ion.ucl.ac.uk/spm/), a MATLAB function (The MathWorks, Inc.), involved several steps. First, 10 volumes (400 images) were omitted from the initial data to minimize the influence of achieving steady-state magnetization when acquiring functional data. Subsequently, subject motion estimation and correction were performed using the default functional realignment and unwarp routines. The identification of outlier scans relied on the observed global BOLD signal and level of subject motion during scanning. Scans with framewise displacement surpassing 0.9 mm or global BOLD signal changes exceeding five standard deviations were marked as outliers (Nieto-Castanon, 2020) and were subsequently excluded from the analysis. Functional slice-timing correction and functional outlier detection (percentile = 95%, global signal = 3, motion = 0.5) were also implemented. Further processing involved direct simultaneous segmentation of the gray matter, white matter, and cerebrospinal fluid, along with normalization to the Montreal Neurological Institute space. The coregistered images were smoothed using an 8-mm full-width at half-maximum Gaussian kernel. In addition, the functional data underwent denoising through a standard pipeline (Nieto-Castanon, 2020). This process included the regression of potential confounding effects characterized by white matter time series (5 CompCor noise components), CSF time series (5 CompCor noise components), motion parameters and their first-order derivatives (12 factors) (Friston et al., 1996), outlier scans (fewer than 11 factors) (Power et al., 2014), session effects and their first-order derivatives (2 factors), and linear trends (2 factors) within each functional run. Following this, bandpass frequency filtering was applied to the BOLD time series (Hallquist et al., 2013), covering a range between 0.008 Hz and 0.09 Hz. Noise components within white matter and CSF were estimated using CompCor (Behzadi et al., 2007; Chai et al., 2012) by calculating the average BOLD signal and the largest principal components orthogonal to the BOLD average, motion parameters, and outlier scans within each participant’s eroded segmentation masks. Considering the number of noise terms in this denoising strategy, the effective degrees of freedom of the BOLD signal postdenoising were estimated to range from 42.6 to 85.3 (average 84.3) across all participants (Ashburner, 2016).
Region of interest definition
Following the preprocessing procedures, our analysis focused on examining the region-to-region (ROI-to-ROI) connections using the CONN toolbox. We used the default atlas of the CONN toolbox to define the ROIs. Specifically, we segmented the cerebral cortex into 91 regions and the subcortex into 15 regions based on the FSL Harvard-Oxford atlas (Smith et al., 2004). In addition, the cerebellum was partitioned into 26 regions using the Automated Anatomical Labeling atlas (Tzourio-Mazoyer et al., 2002).
Statistical analyses
After the preprocessing steps, rsFC analysis was performed in the CONN toolbox. At the individual level, our analysis using the CONN toolbox involved conducting ROI-to-ROI computations and calculating the functional connectivity of all 132 pairwise ROI combinations. Functional connectivity strength was represented by Fisher-transformed bivariate correlation coefficients from a weighted general linear model [weighted-GLM (Nieto-Castanon, 2020)] that models the association between their BOLD signal time series. Subsequently, group-level univariate analysis of covariance was performed within the CONN toolbox, incorporating age and sex as covariates. Our threshold for identifying significant correlations among the ROIs was set at a familywise corrected p-FDR <0.05 cluster-size threshold (Chumbley et al., 2010) and cluster-forming p < 0.001 voxel-level threshold.
Statistical analyses were conducted using SPSS software (version 29; IBM Corp., Armonk, NY, USA). Age and sex of demographic characteristics were compared using analysis of variance (ANOVA) and chi-square test. The normality of the psychological scales was assessed using the Shapiro–Wilk test, and based on the normality, ANOVA or Kruskal–Wallis tests were conducted. A post hoc analysis was performed on the significant rsFC values among the three groups extracted by the CONN toolbox. In addition, post hoc analysis was conducted using Bonferroni correction. We adopted Bonferroni correction because we performed whole-brain analysis without specifying the ROI (Armstrong, 2014). These post hoc tests were implemented to investigate the group effect and perform specific comparisons (HCs-GAD, HCs-SAD, GAD-SAD) that contributed to the significance of the results. Thus, we conducted a sensitivity analysis by excluding outliers on the rsFC that showed significant differences in the comparison between GAD and SAD (see detailed in Supplementary Data S1).
A post hoc power analysis was performed using G*Power 3.1.9.7 (Faul et al., 2007) to calculate the minimum detectable effect size given an α error probability of 0.05, a power of 0.80, and the sample sizes.
Graph theory was conducted on the brain regions comprising the rsFC, and significant differences were observed between the groups. An edge threshold of 0.15 correlation coefficient was applied to define network edges. Network measures, including global efficiency and clustering coefficient, were calculated for each participant using the CONN toolbox. Details of the two parameters computed using graph theory (Bassett et al., 2018) are as follows: Global Efficiency: Defined as the average inverse shortest path length in the network, representing the efficiency of information transfer across the entire network. Clustering Coefficient: Measures the degree to which nodes in a network tend to cluster together, indicating the presence of densely connected subnetworks. Multiple comparisons were corrected using the Bonferroni corrected.
Furthermore, following the group comparison between GAD and SAD, multiple logistic regression analysis (step-wise) was performed to assess whether the rsFC showing significant differences could distinguish between the two. Receiver operating characteristic (ROC) curves were then generated to evaluate the discriminatory accuracy of GAD and SAD based on rsFC, with the calculation of the area under the curve (AUC). Sensitivity and specificity in this rsFC were also computed.
Pearson’s correlation coefficients were determined to examine the association between psychological scores and rsFC values extracted from the significant clusters after correction during the comparisons. All the above statistical tests were two-tailed, and a Bonferroni-adjusted p value <0.05 was considered statistically significant.
Results
Demographic and clinical characteristics
We included 21 patients with SAD, 17 patients with GAD, and 30 age- and sex-matched HCs. Table 1 presents the age and sex of the BDI-II, LSAS, STAI, and GAD-7 scores of the HCs and patients with GAD and SAD. No significant differences were observed among the three groups in terms of age or sex. However, significant differences were observed between the HC and patient groups in each psychological measure, including the BDI-II, LSAS, STAI, and GAD-7 scores. No significant differences in these measures were observed between the SAD and GAD groups.
Demographic and Clinical Characteristics
Analysis of variance.
Chi-square test.
Kruskal–Wallis.
Bold text indicates p values that show stastical significance.
HCs, healthy controls; GAD, generalized anxiety disorder; SAD, social anxiety disorder; CI, confidence interval; STAI, state-trait anxiety inventory-state and trait version; BDI-II, Beck Depression Inventory-II; GAD-7, generalized anxiety disorder-7; LSAS (total), (fear), and (avoid), the Liebowitz Social Anxiety Scale-fear and avoidance subscale, and total score.
Statistical power results
Post hoc power analysis indicated that the minimum detectable Cohen’s f was 0.3853 to detect a difference between the three groups. When comparing rsFC among the three groups, Cohen’s f values were 0.5604 for between the right thalamus and right nucleus accumbens (Fig. 2a), 0.4413 for between the right thalamus and left nucleus accumbens (Fig. 2b), and 0.4201 for between the left thalamus and right nucleus accumbens (Fig. 2c), yielding powers of 0.9867, 0.8997, and 0.8673, respectively. Estimating the sample sizes required to replicate the effects observed in this study, total sample sizes of 36, 54, and 60 were required to detect an effect in each analysis, given an α error probability of 0.05 and a power of 0.80. When comparing the SAD and GAD groups, the post hoc power analysis resulted in a minimum detectable Cohen’s d of 0.9393. When comparing rsFC between groups, Cohen’s d values were 1.402, 1.143, and 1.096, respectively (Fig. 2a-2c), yielding powers of 0.9868, 0.9263, and 0.9046, respectively. Estimating the sample sizes required to replicate the effects observed in this study, total sample sizes of 20, 28, and 30 were required to detect an effect in each analysis, given an α error probability of 0.05 and a power of 0.80.
Difference in rsFC among the HC, GAD, and SAD groups
Whole-brain analysis revealed significant differences among the three groups for a total of 90 rsFC (Supplementary Table S1). The post hoc analysis revealed that rsFC data were mainly extracted from the postcentral and precentral gyrus in the SAD group compared with the HC group. In particular, high rsFC was found in the right postcentral gyrus and left thalamus. Contrarily, lower rsFC was found in the caudate nucleus, putamen, thalamus, and amygdala. In particular, the right caudate nucleus and left amygdala had fewer connections (Fig. 1a and Supplementary Table S2).
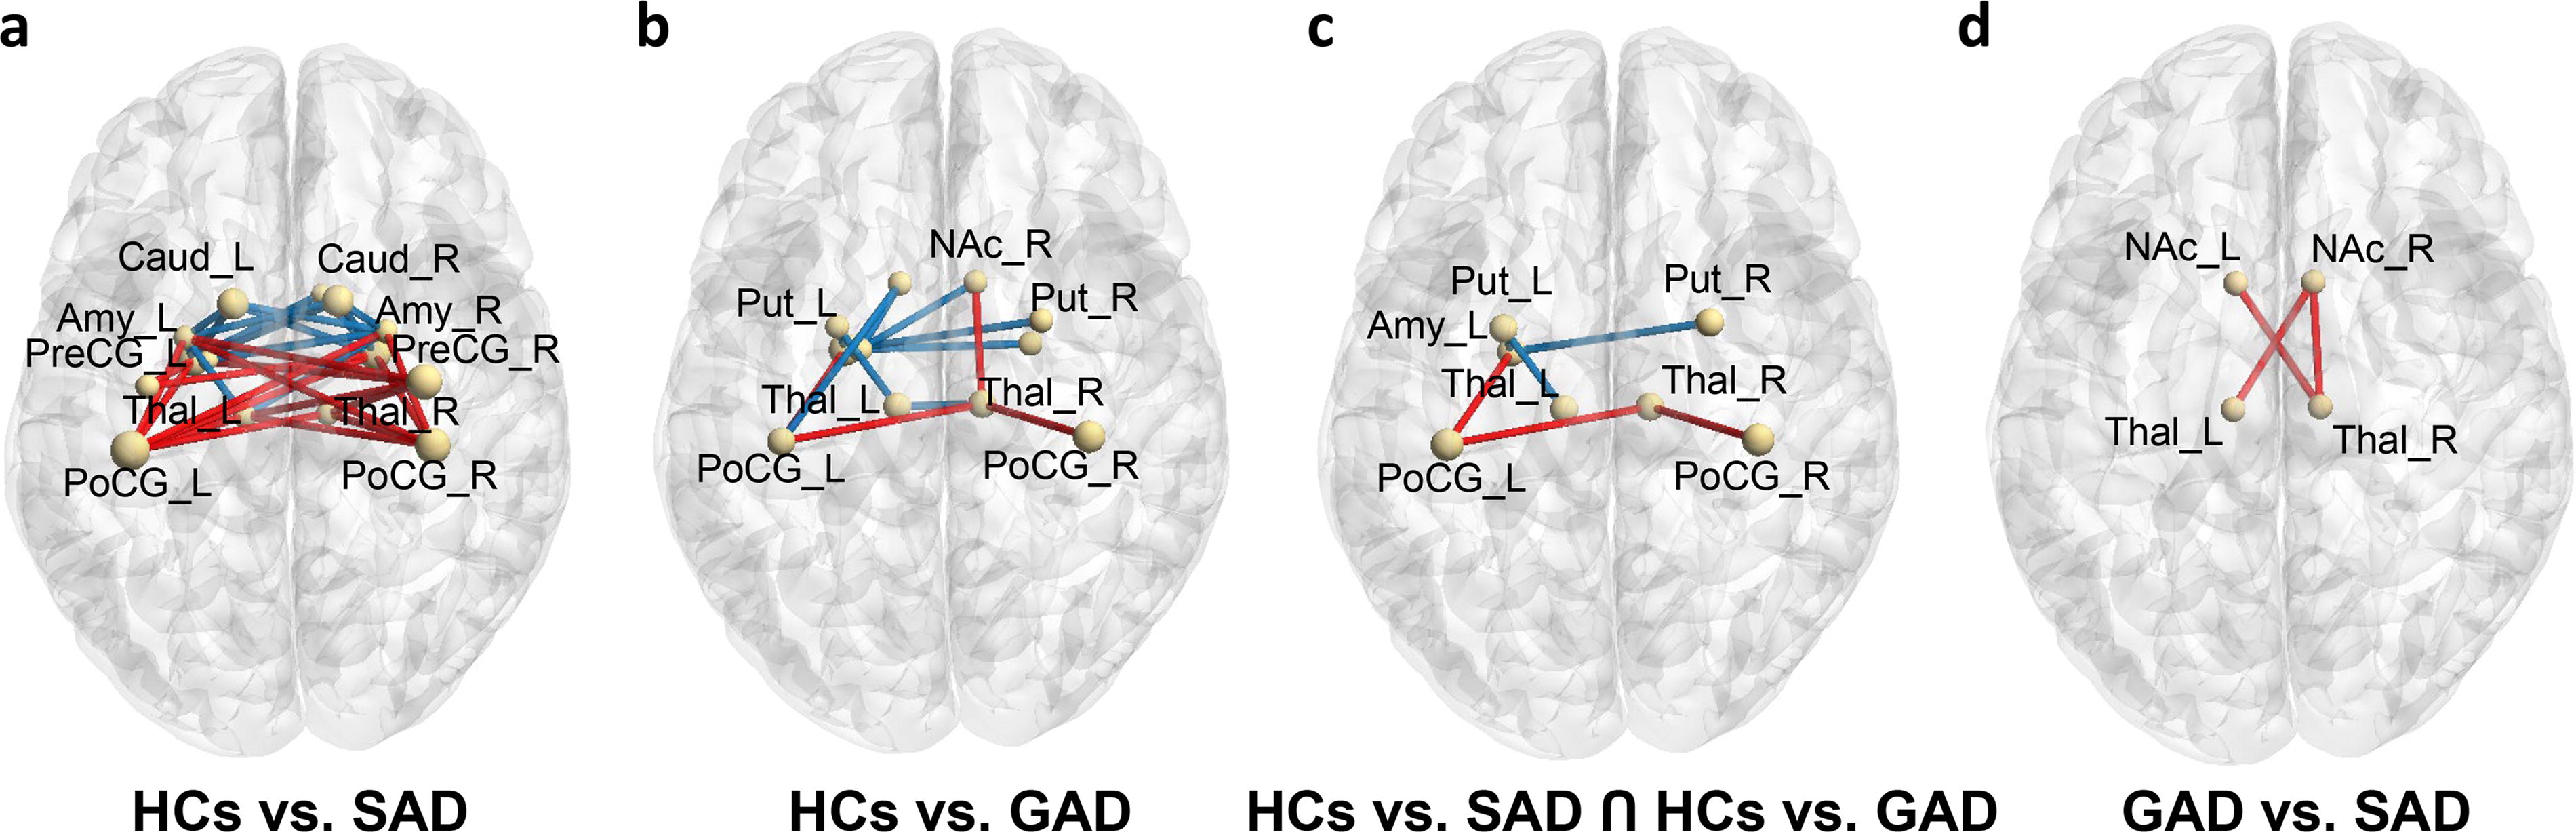
rsFC alterations in the SAD, GAD, and HC groups.
The GAD group had higher postcentral gyrus and thalamus connections than the HC group. Furthermore, the rsFC between the right nucleus accumbens and thalamus was higher. In addition to the thalamus, the putamen and amygdala have been identified as brain regions with lower rsFC (Fig. 1b and Supplementary Table S3).
The rsFC between the postcentral gyrus and amygdala/thalamus was significantly higher in the GAD and SAD groups than in the HC group. By contrast, the rsFC between the putamen and amygdala/thalamus was significantly lower (Fig. 1c and Supplementary Table S2 and Supplementary Table S3).
Finally, the GAD group had significantly higher rsFC between the bilateral nucleus accumbens and right thalamus and the right nucleus accumbens and left thalamus than the SAD group (Fig. 1d and Fig. 2). In addition, we conducted a sensitivity analysis of excluding outliers in the rsFC between the right nucleus accumbens and the left thalamus and between the left nucleus accumbens and the right thalamus. These rsFCs still showed significant differences between GAD and SAD (Supplementary Table S4 and Supplementary Data S2).
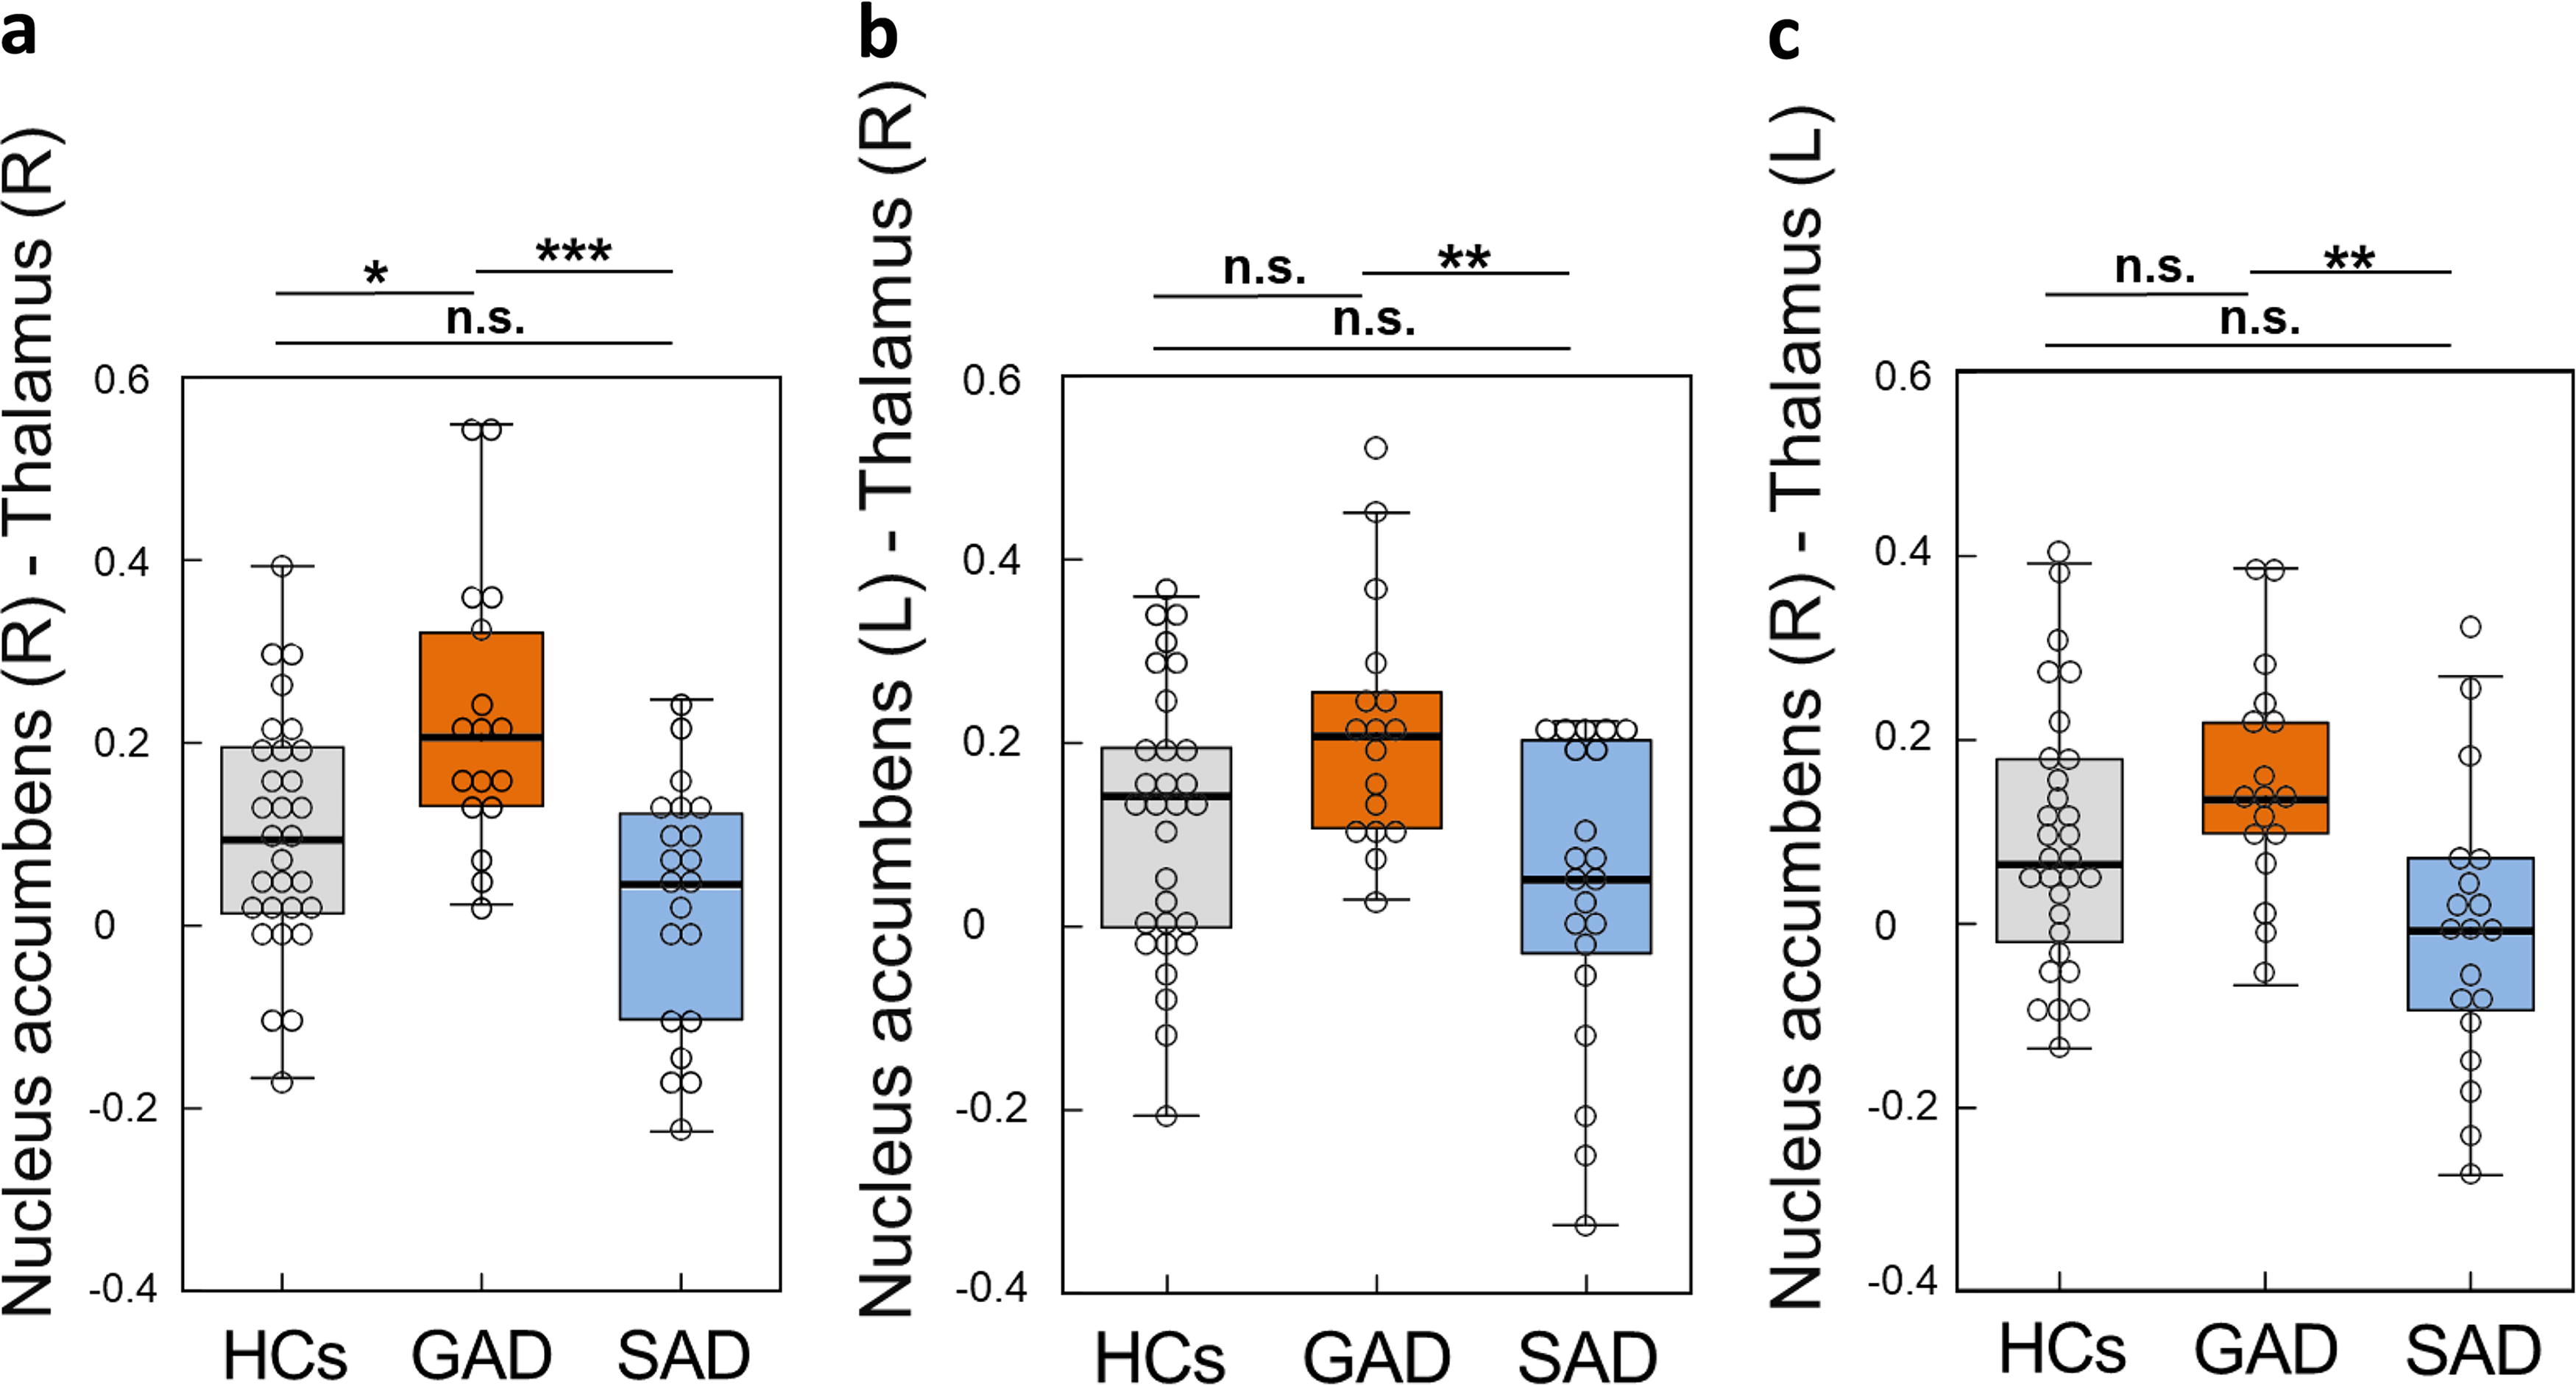
Box plots of the rsFC in the HC, GAD, and SAD groups.
Graph theory analysis
Graph theory analysis revealed significant group differences in global efficiency measures at a correlation coefficient level of 0.15: the global efficiency of the left postcentral gyrus was lower in the SAD group than in the HC group (Supplementary Table S5). There was no significant difference in global efficiency between the GAD group and the HC group (Supplementary Table S6). The global efficiency of the right thalamus was higher in the GAD group than in the SAD group (Supplementary Table S7). Differences in clustering coefficients were not statistically significant (Supplementary Tables S8–S10).
Correlation of rsFC with psychological scale scores
The rsFC in the SAD group was lower than that in the HC group. The correlation analysis showed that the rsFC between the right caudate nucleus and left amygdala was positively correlated with the LSAS fear (r = 0.57, p = 0.004) and BDI-II (r = 0.52, p = 0.02) scores and negatively correlated with the GAD-7 (r = −0.55, p = 0.007), STAI-Trait (r = −0.55, p = 0.01), and total LSAS (r = −0.52, p = 0.03) scores. The rsFC in the GAD group was higher than that in the HC group, and the correlation analysis showed that the rsFC between the right nucleus accumbens and right thalamus was positively correlated (r = 0.49, p = 0.03) with the GAD-7 score (Table 2). Finally, the rsFC in the GAD group was higher than that in the SAD group. The correlation analysis showed that the rsFC between the left nucleus accumbens and the right thalamus was positively correlated with the STAI-State score (r = 0.51, p = 0.02) (Fig. 3a,b,c). On comparing this correlation between the disorders, the correlation was positive in GAD (r = 0.52, p = < 0.01) and weakly positive in SAD (r = 0.41, p = 0.01) (Fig. 3c).
Correlation between rsFC and Psychological Scale Scores in the HCs, GAD, and SAD Groups
rsFC, resting-state functional connectivity; HCs, healthy controls; GAD, generalized anxiety disorder; SAD, social anxiety disorder; GAD-7, Generalized Anxiety Disorder-7; LSAS (total), (fear), and (avoid), the Liebowitz Social Anxiety Scale-fear and avoidance subscale, and total score; BDI-II, Beck Depression Inventory-II; STAI, state-trait anxiety inventory-state and trait version.
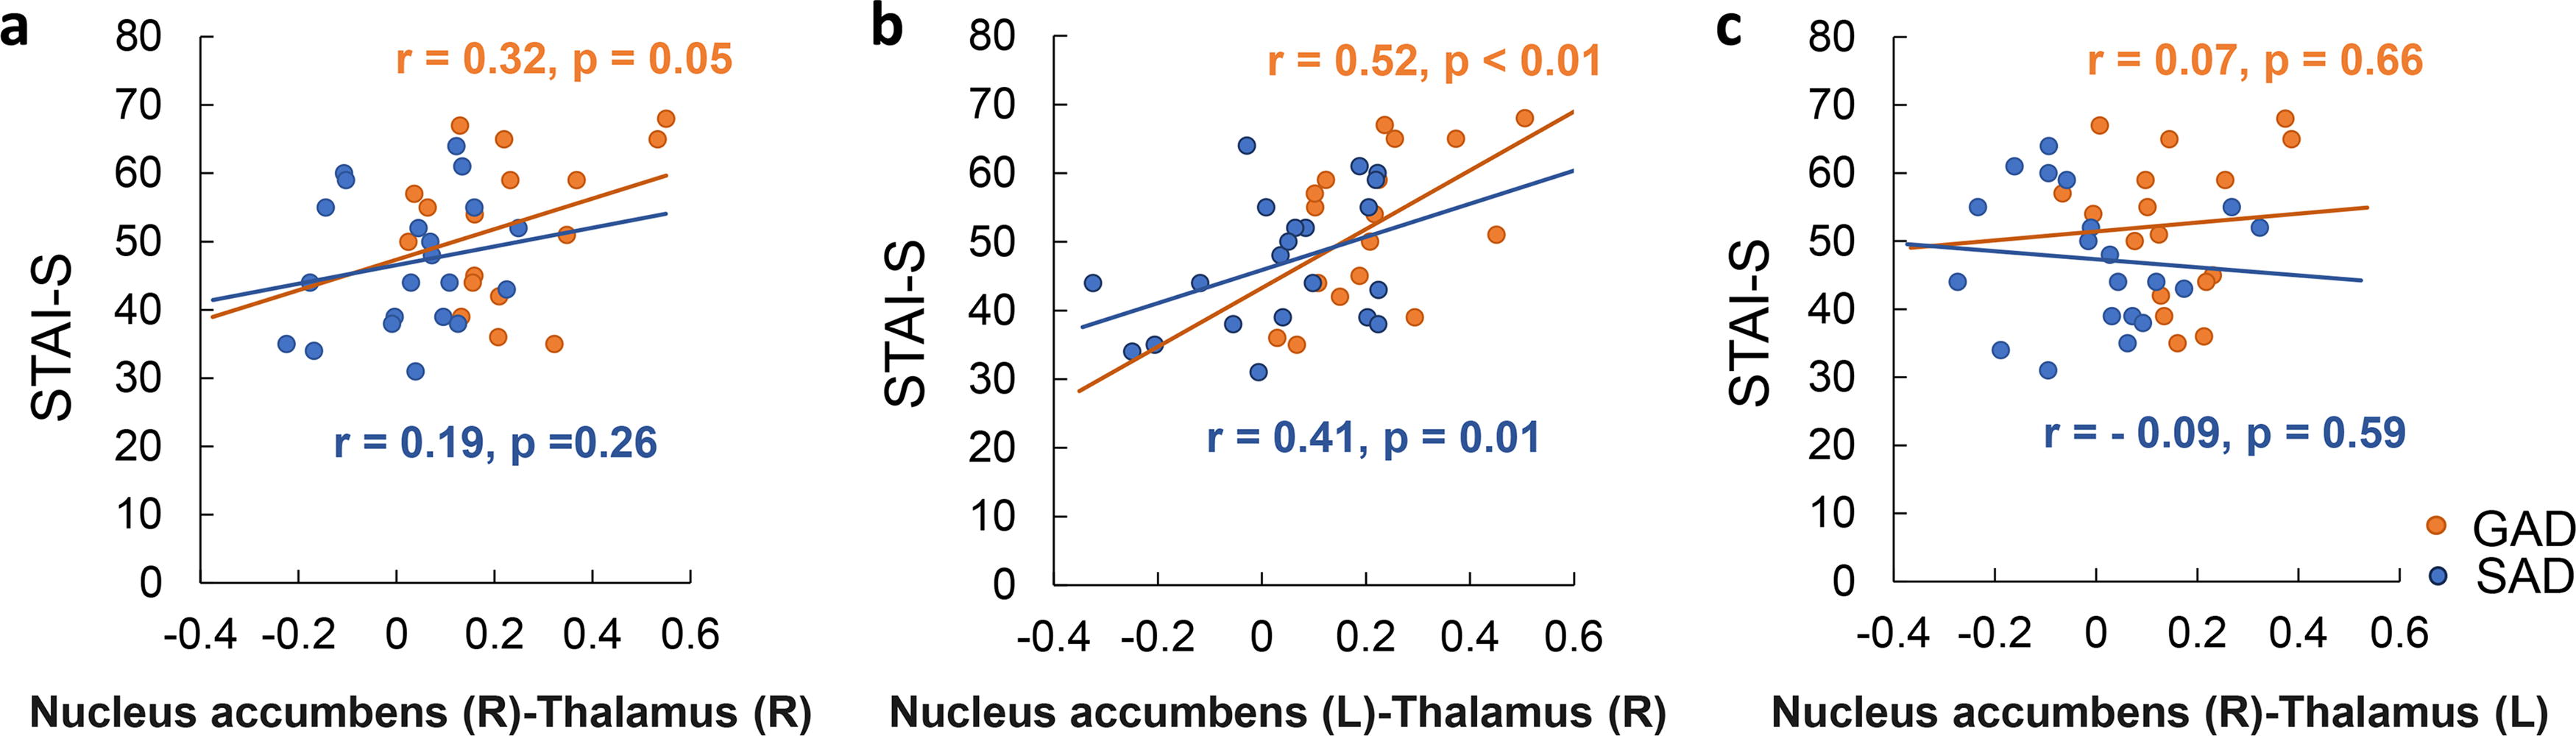
Plot of the correlation of rsFC with the STAI-state score.
Regression logistic model
The logistic regression analysis showed that the rsFC between right nucleus accumbens and right thalamus is able to distinguish GAD and SAD (Table 3 and Table 4). There were no significant differences in rsFC between the right nucleus accumbens and the left thalamus, as well as between the left nucleus accumbens and the right thalamus (Table 3). We performed ROC analysis to evaluate the diagnostic performance of rsFC between the right nucleus accumbens and the right thalamus (Fig. 4 and Table 4). The AUC of rsFC between the right nucleus accumbens and the right thalamus was 0.902 (95% CI = 0.805–0.999). RsFC between the nucleus accumbens and the right thalamus had a sensitivity of 88.2% and a specificity of 81.0%.
Differences in rsFC between SAD and GAD
rsFC, resting-state functional connectivity; SAD, social anxiety disorder; GAD, generalized anxiety disorder; CI, confidence interval; (R), right; (L), left.
Multiple Logistic Regression Analysis
SE, standard error; CI, confidence interval; (R), right; (L), left.
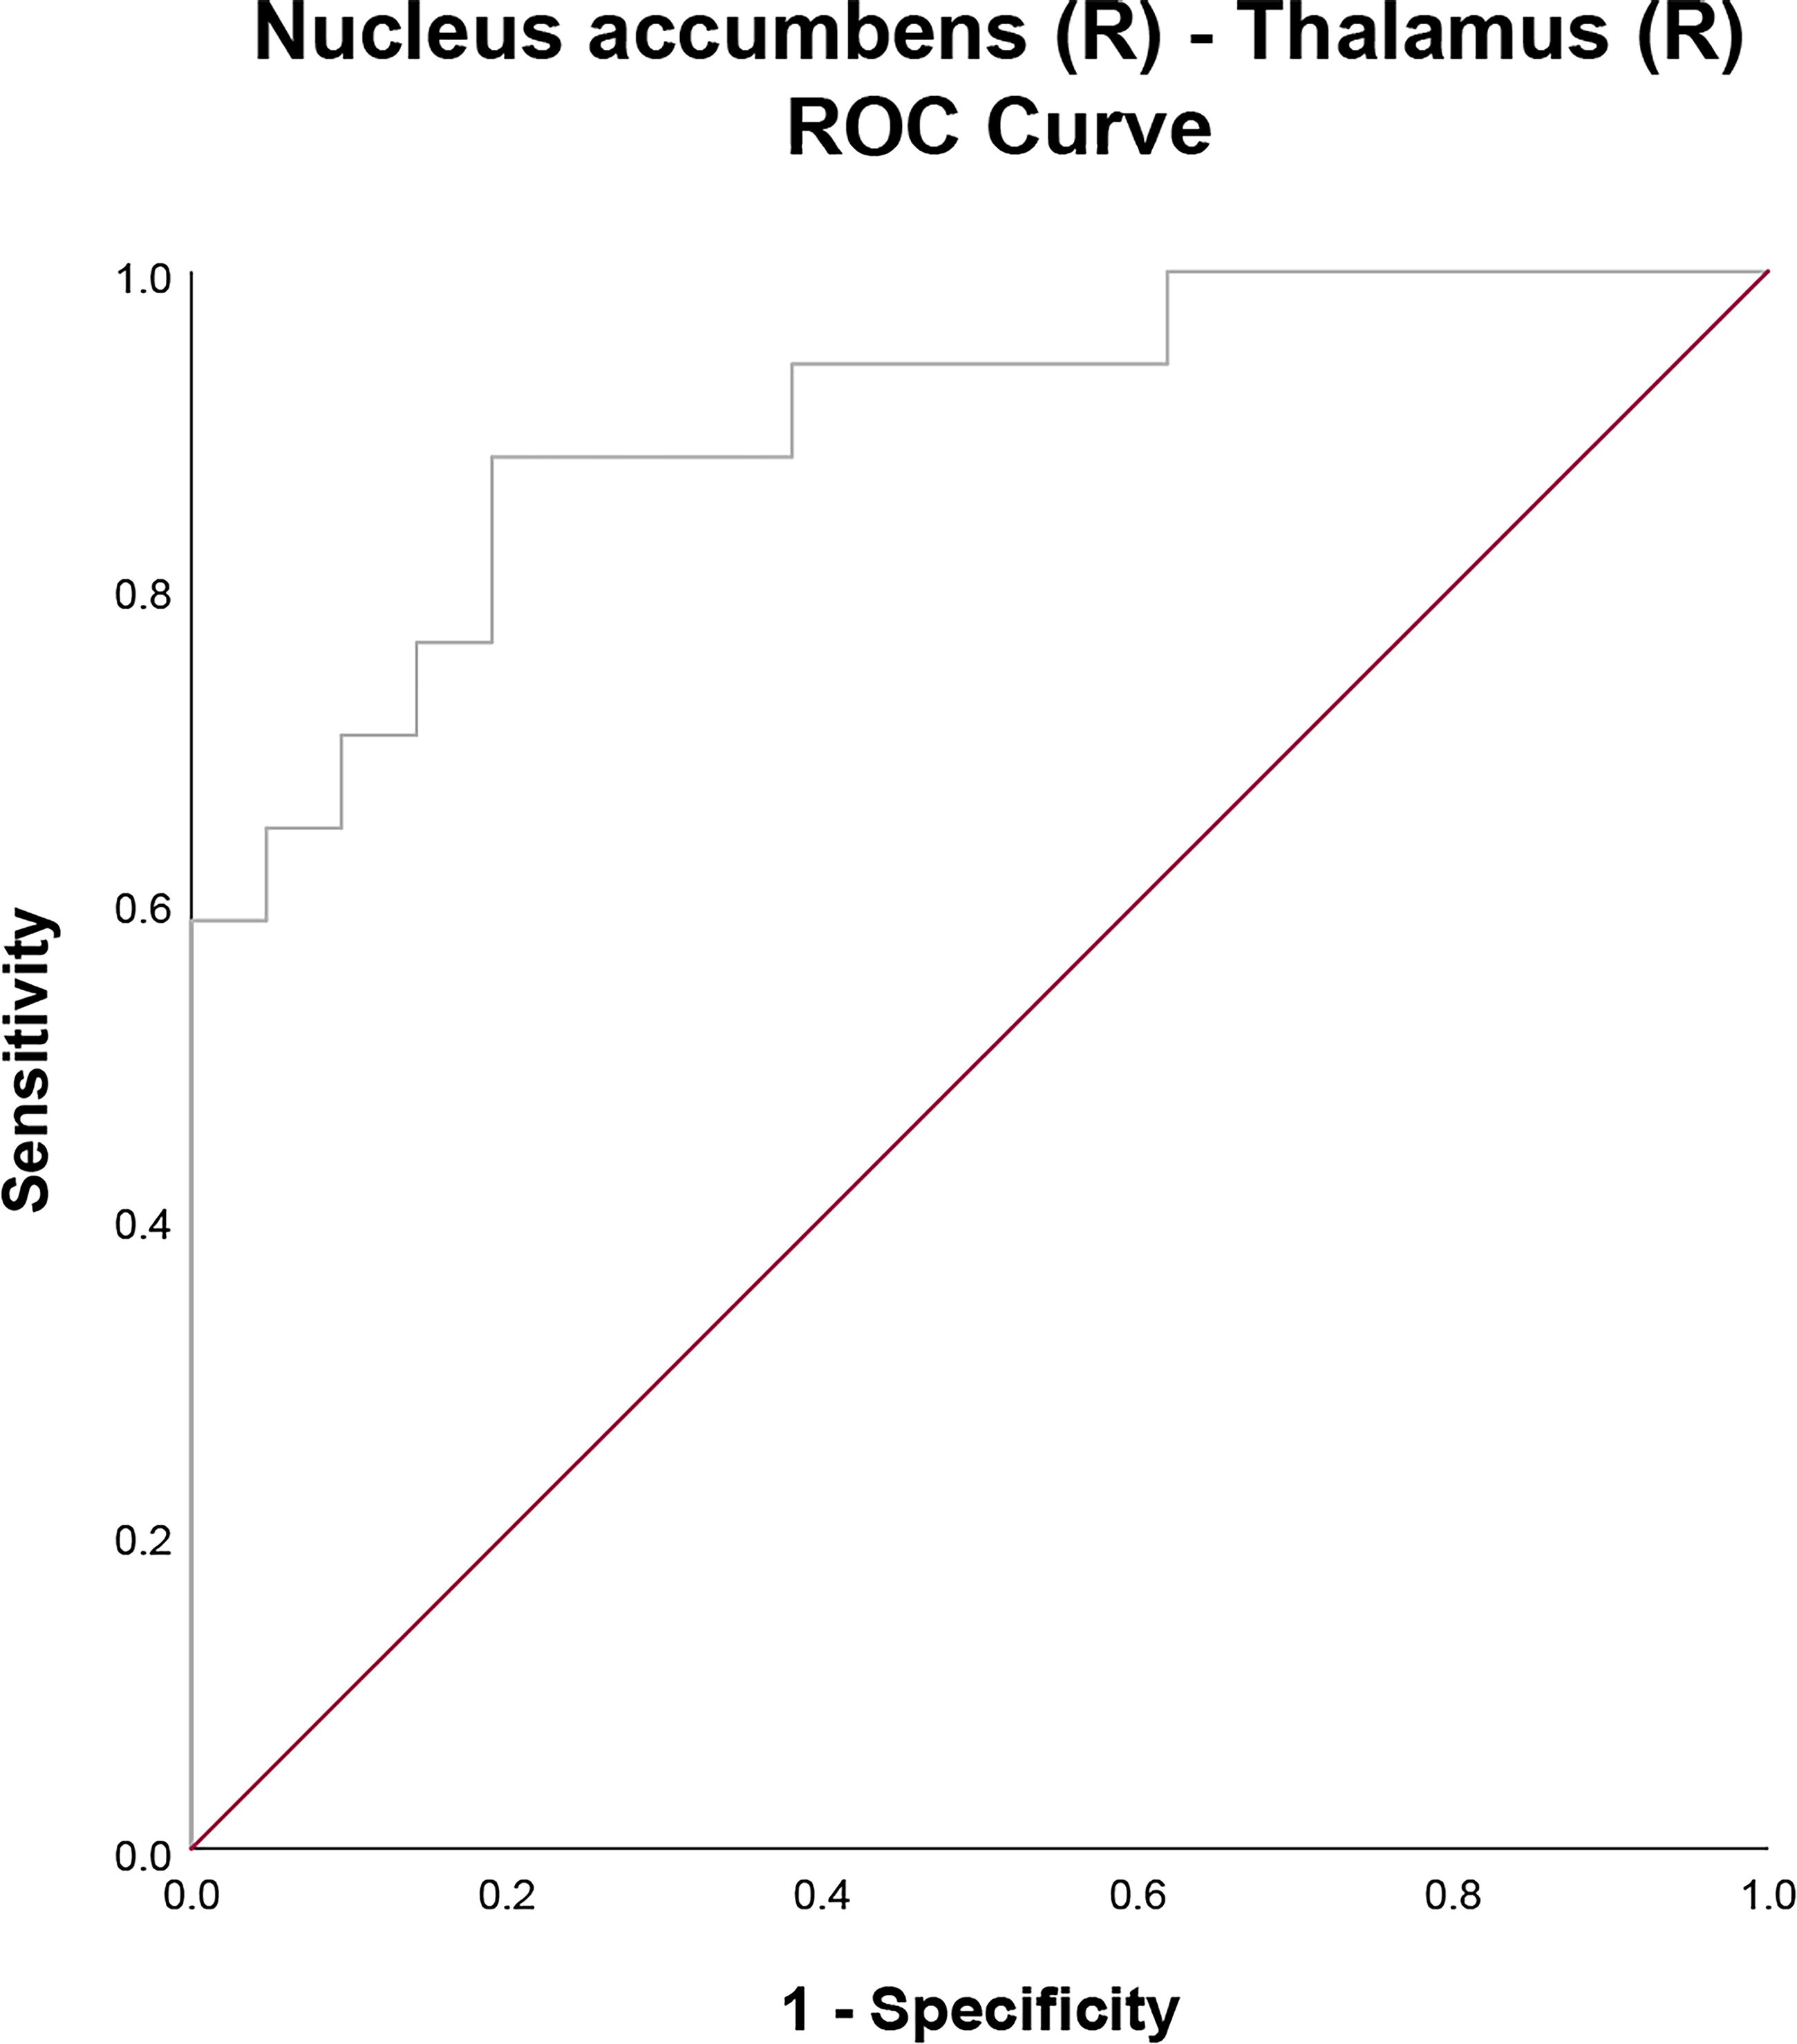
Receiver operating characteristic (ROC) curves for evaluating the diagnostic performance of rsFC between the right nucleus accumbens and right thalamus.
Discussion
This study has revealed a new common resting-state network between SAD and GAD and is the first to identify a network that distinguishes the two disorders. We investigated the association between psychological measures and rsFC in HCs and patients with SAD and GAD using whole-brain analysis. We found that patients with SAD and GAD had higher rsFC in the somatosensory networks between the postcentral gyrus and thalamus than HCs. Patients with GAD had higher rsFC between the right nucleus accumbens and right thalamus than HCs. This rsFC between the right nucleus accumbens and right thalamus was also identified as a network that differentiated SAD from GAD.
Difference in networks in the SAD and GAD groups than in the HC group
In this study, SAD and GAD commonly share a low rsFC between the putamen and the thalamus and a high rsFC between the postcentral gyrus and the thalamus, which constitute the CSTC circuit. The CSTC circuit suggests that excitatory or inhibitory feedback modulates cortical activity as a result of information flow through one of two subcircuits as follows: the direct or indirect pathway (Marchand et al., 2009). In addition, the putamen is involved in the direct pathway. The involvement of the putamen in the direct pathway suggests that the connectivity within the CSTC circuit may not be maintained properly in both disorders. Patients with SAD and GAD had significantly higher rsFC between the bilateral postcentral gyri and right thalamus than HCs. The postcentral gyrus is a somatosensory cortex that plays an important role in each stage of emotional processing (Kropf et al., 2019). In addition, the somatosensory cortex and thalamus interact to generate and control emotional states and are involved in interceptive attention (Saalmann and Kastner, 2011). In addition, the somatosensory cortex and thalamus are involved in fear processing and are part of the fear circuit (Caseras et al., 2010; Damasio et al., 2000). Task fMRI has also shown that the somatosensory cortex is activated in response to unconscious and frightening stimuli (Liddell et al., 2005). Similarly, in the current study, the rsFC of the somatosensory cortex and thalamus was higher in SAD and GAD than in HCs. These findings suggest that SAD and GAD may not have proper regulation of cortical activity in the CSTC circuit and that more somatosensory cortex is coping with fear, with correspondingly higher thalamic activity.
Patients with SAD had lower rsFC around the striatum and amygdala, including the caudate nucleus, and particularly low rsFC between the right caudate nucleus and left amygdala. The amygdala plays a mediating role in fear and anxiety (Davis and Whalen, 2001) and a key role in emotional processing and regulation (Phillips and Swartz, 2014). The caudate nucleus is involved in emotional learning (Krstonošić et al., 2015). The caudate nucleus also interacts with the amygdala to regulate these emotional responses (Šimić et al., 2021). This interaction is essential for regulating the strength and appropriateness of emotional responses and contributes to emotional balance and adaptive behavior. In this study, the rsFC between the caudate nucleus and amygdala was negatively correlated with the GAD-7, STAI-Trait, LSAS total, and LSAS fear scores. Thus, it is possible that in SAD, the dysfunction of the caudate nucleus results in reduced interaction with the amygdala, which may not be able to regulate fear and anxiety appropriately. Patients with SAD had lower global efficiency of the postcentral gyrus compared with HCs. In addition, patients with SAD had higher rsFC in the precentral gyrus and thalamus, in addition to rsFC in the somatosensory cortex and thalamus. The precentral gyrus has been shown to be involved in higher somatic arousal in anxiety states (Yuan et al., 2023). In addition to being involved in somatic arousal functions, this region is involved in processes central to anxiety generation (Drabant et al., 2011). Thus, patients with SAD may have higher activity in the precentral gyrus and increased somatic arousal and may cope with anxiety than HCs. The involvement of the precentral gyrus in these processes also suggests that SAD is more likely to affect the function of these networks in the brain more extensively.
GAD was characterized by higher rsFC between the right nucleus accumbens and the right thalamus than that in HCs. Connections between the nucleus accumbens and thalamus are involved in negative motivation, aversion, and reinforcement learning (Parsons et al., 2007; Pezze et al., 2001). Task fMRI reports suggested that the nucleus accumbens and thalamus have been shown to be activated during fear overgeneralization (Carlson et al., 2014; Greenberg et al., 2013). Fear overgeneralization is the transfer of conditioned fear to perceptually similar stimuli beyond the appropriate range and is strongly linked to the dopaminergic network involving the nucleus accumbens and thalamus (Greenberg et al., 2013). In addition, fear overgeneralization has been suggested to be an important pathogenic marker in GAD (Carlson et al., 2014; Lissek et al., 2014). Similarly, the higher rsFC in the right nucleus accumbens and right thalamus in GAD in the current study suggests that fear overgeneralization might be the main abnormal mechanism underlying GAD.
The nucleus accumbens and thalamus network distinguishing GAD from SAD
The SAD group tended to have lower state anxiety than the GAD group. In addition, the rsFC between the left nucleus accumbens and right thalamus, which was higher in patients with GAD than in those with SAD, was positively correlated with the STAI-State score. The STAI is self-administered, and the environment in which the STAI is administered is not a social setting (Özdemir and Kuru, 2023), which may reflect lower state anxiety in SAD.
In this study, patients with GAD had significantly higher rsFC between the right thalamus and the bilateral nucleus accumbens and between the left thalamus and the right nucleus accumbens than those with SAD. Among them, rsFC between the right nucleus accumbens and the right thalamus distinguished between SAD and GAD. The global efficiency in the right thalamus was also increased in GAD than in SAD. Connections between the nucleus accumbens and thalamus are associated with dopaminergic mesocortical circuits (Haber and Knutson, 2010). The fear mentioned above overgeneralization has been noted as a sign of anxiety disorders and has been strongly associated with GAD (Dymond et al., 2015; Lissek et al., 2014). However, its association with SAD is unclear, and some reports suggest that it does not universally manifest as a sign of SAD (Ahrens et al., 2016). In the current study, the dopaminergic network contained in the rsFC between the right nucleus accumbens and right thalamus was lower in SAD and higher in GAD. Thus, there may be a difference in the involvement of the dopaminergic system in the fear-learning process between SAD and GAD.
Limitations
This study has some limitations. First, the sample size was small. If the sample size of participants were larger not only in the GAD group but also in the SAD and HC groups, it would have been possible to perform more advanced analyses, such as those that take into account the dominant hand, medication status, and machine learning. Second, two patients with GAD had comorbid autism spectrum disorder. Future studies investigating disease-specific neural bases are needed to analyze samples, taking into account the presence or absence of comorbidities. Third, this study found that high rsFC between the nucleus accumbens and thalamus in GAD is associated with excessive fear overgeneralization. However, this study did not measure fear generalization scores. In the future, we would like to measure fear generalization scores and investigate their correlation to dopaminergic network activity, including the nucleus accumbens and the thalamus during the resting state. Finally, this study utilized an approach based solely on neuroimaging and psychological scales. In addition to the current results, it would have been even better if we could have collected environmental factors and physiological data, such as behavior, heart rate variability, and dopamine and cortisol levels, without measurement timing errors, to create a model that aids in distinguishing SAD and GAD from a multifaceted perspective. (Hu et al., 2022).
Conclusion
This study was conducted using functional brain MRI. Patients with GAD and SAD have higher rsFC in the somatosensory networks between the postcentral gyrus and thalamus than HCs. Patients with GAD exhibited higher functional connectivity in the nucleus accumbens and thalamus than patients with SAD or HCs. In addition, SAD and GAD could be distinguished by the rsFC of the right nucleus accumbens and right thalamus. These findings may reflect differences in the fear learning processes between SAD and GAD. Although it was a small-sample study, our findings provide insight into the disease-specific neural basis of SAD and GAD. They will contribute to future treatment strategies and differential diagnosis. A comprehensive study with a larger sample size, taking into account cultural and environmental factors and combining behavioral and physiological measures, is needed to elucidate the disease-specific brain networks of SAD and GAD.
Footnotes
Acknowledgments
The authors express their gratitude to all participants for their dedication and valuable contributions to this study.
Authors’ Contributions
T.N.: Conceptualization (lead); Formal analysis (lead); Visualization (lead); and Writing—original draft (lead). K.K.: Conceptualization (lead); Formal analysis (lead); Funding acquisition (equal); and Writing—original draft (lead). T.Y.: Data curation (equal) and Writing—review and editing (supporting). K.M.: Data curation (equal). J.O.: Writing—review and editing (supporting). B.C.: Writing—review and editing (supporting). E.S.: Resources (lead) and Writing—review and editing (equal). Y.H.: Data curation (lead) and Funding acquisition (lead). All authors have confirmed and approved the final article.
Author Disclosure Statement
No competing financial interests exist.
Funding Information
This work was supported by the AMED Brain/MINDS Beyond Program [grant number JP18dm0307002] and JSPS KAKENHI [grant numbers 19K03309, 21K03084, 22H01090, and 24K06547].
Supplementary Material
Supplementary Data S1
Supplementary Data S2
Supplementary Table S1
Supplementary Table S2
Supplementary Table S3
Supplementary Table S4
Supplementary Table S5
Supplementary Table S6
Supplementary Table S7
Supplementary Table S8
Supplementary Table S9
Supplementary Table S10
References
Supplementary Material
Please find the following supplemental material available below.
For Open Access articles published under a Creative Commons License, all supplemental material carries the same license as the article it is associated with.
For non-Open Access articles published, all supplemental material carries a non-exclusive license, and permission requests for re-use of supplemental material or any part of supplemental material shall be sent directly to the copyright owner as specified in the copyright notice associated with the article.