
Abstract
Introduction:
Recent addiction and obesity-related research suggests that episodic future thinking (EFT) can serve as a promising intervention to promote healthy decision-making. We used data from a pilot study to investigate the acute neural effects of EFT in alcohol use disorder (AUD). Because of the limitations of those data, we additionally used data from a previously published functional MRI (fMRI) study in which participants had not received any intervention for their AUD.
Methods:
In an out-of-scanner, guided interview, participants (n = 24; median age = 37.3 years; median AUDIT = 22.5) generated scenarios and cues about their future (EFT intervention, n = 15) or recent past (control episodic thinking [CET] control intervention, n = 9). Then, they performed both resting-state and task-based (delay discounting [DD]) fMRI. We used nodes from the default mode network and salience networks as well as the hippocampus to perform seed-based analyses of the resting-state data. The results then guided psychophysiological interaction analyses in the DD task. In addition, we used data from a larger, previously reported study as a “no intervention” group of AUD participants (n = 50; median age = 43.3; median Diagnostic and Statistical Manual of Mental Disorders, Fourth Edition (DSM-IV) alcohol dependence score = 7) to reproduce and aid in interpreting our key findings.
Results:
EFT, but not CET, participants showed statistically improved DD rates—a behavioral marker for addiction. Resting-state analyses of the left hippocampus revealed connectivity differences in the frontal poles. The directionality of this difference suggested that EFT may reduce a hypo-connectivity relationship between these regions in AUD. We also found resting-state connectivity differences between the salience network and the right dorsolateral prefrontal cortex (R DLPFC), which then led us to discover R-to-L DLPFC psychophysiological interaction differences during DD. Moreover, the resting-state salience-to-DLPFC functional connectivity showed an inverse relationship to DD rate while hyperconnectivity between left and right DLPFC reflected slower reaction times during DD trials.
Discussion:
These findings suggest that previously noted benefits of EFT such as the improved DD replicated here might coincide with changes in neural connectivity patterns in AUD. The alterations in connectivity highlight potential mechanisms underlying the effectiveness of EFT in improving decision-making in AUD. Understanding these neural effects may contribute to the further development of targeted interventions for AUD and related disorders.
Impact Statement
Episodic future thinking (EFT) is emerging as a potential behavioral intervention for substance use disorders. Previous studies have demonstrated its ability to reduce DD and promote making healthy choices. Although brain activity during EFT tasks has been previously characterized, the acute effects on the brain following EFT in the context of an intervention have not been characterized. This study examined fMRI connectivity changes that occurred after an EFT intervention in alcohol use disorder (AUD). The results suggest that the intervention alleviated maladaptive connectivity in AUD and that these changes are related to DD rate and decision-making speed.
Introduction
Alcohol use disorder (AUD) remains the most prevalent substance use problem in the United States (Müller-Oehring et al., 2015). Although many far-reaching repercussions of both acute and chronic alcohol use have been documented, one emerging observation is that AUD impairs the capacity to think clearly about the future (El Haj et al., 2019). This capacity draws on episodic and semantic memory systems, both of which are impacted by AUD (El Haj et al., 2019). A related challenge faced by many AUD individuals is their steep discounting of future value in favor of immediate rewards (Petry, 2001), as measured by delay discounting (DD) (Bickel and Marsch 2001). Most important, DD correlates with addiction severity and treatment outcomes (Stanger et al., 2012).
Based on these considerations, EFT may provide a behavioral intervention that can address both the steep discounting and memory impairments associated with AUD (Bickel et al., 2023). EFT requires the integration of episodic and semantic memory processes to create a concrete simulation of the future and is often implemented for goal-oriented planning (Schacter, Benoit, and Szpunar, 2017). A foundational study by Peters and Büchel (2010) showed that vivid EFT imagery during an intertemporal choice task reduced DD in healthy participants. Subsequently, several studies in AUD have reported DD decreases following EFT (Bickel et al., 2023; Snider et al., 2018; Mellis et al., 2019). Real-world reductions in heavy drinking following brief EFT interventions have also been reported (Athamneh et al., 2022). Additionally, the effect of repeated EFT sessions on DD suggests that this ability can be improved by the generation of successive EFT events (Mellis et al., 2019).
Regarding neuroimaging, EFT meta-analyses have identified a core network of brain regions that govern episodic memory and future simulation (Schacter, Benoit, and Szpunar, 2017). These regions have broad overlap with the default mode network (DMN), which is known to be important in self-referential processing (Buckner, Andrews-Hanna, and Schacter, 2008) and subjective value judgment (Bartra, McGuire, and Kable, 2013). In temporally bound thought, core DMN regions recruit the hippocampus through structural connections to the medial temporal lobe (Fox et al., 2015). Beyond this, a recent meta-analysis found broad activation of the DMN and the salience network during the engagement of future thinking and prospective memory, respectively (Cona, Santacesaria, and Scarpazza, 2023). Because intertemporal choice engages all of these regions (Peters and Büchel 2010; Bartra, McGuire, and Kable, 2013; Schacter, Benoit, and Szpunar, 2017), DD may reveal information about neural processes related to EFT in addition to the hippocampus, DMN, and salience network. Finally, we note that the DMN and the salience network are also central to network theories of addiction (Sutherland et al., 2012).
Despite our understanding of brain activity during EFT tasks, the effects of EFT as an intervention have not been characterized. To address this, we investigated whether an EFT intervention outside the scanner leads to acute resting-state functional connectivity changes in AUD. We used data from a pilot study that compared brief interventions of future thinking (EFT) and recent past thinking (control episodic thinking [CET]) with functional MRI (fMRI) measures of resting-state and DD (Study 1: EFT and CET). Based on the current understanding of both future thinking and AUD, as outlined above, we examined the possible effects of EFT on resting-state functional connectivity with the DMN (including the hippocampus) and the salience network of AUD participants. This, indeed, led to findings of EFT vs. CET resting-state connectivity differences. We then used two strategies to help corroborate these findings and to contextualize their functional relevance. The first strategy was to use these resting-state results to guide psychophysiological interaction (PPI) analyses of Study 1’s DD fMRI task. The second strategy was to use an additional dataset to partially compensate for Study 1’s weaknesses, which include both a small sample size as well as its lack of a preintervention baseline scan. Thus, we used data from a larger independent cohort of individuals who did not receive a behavioral intervention (Study 2: no intervention—NOI).
Materials and Methods
Data sources
We used data from two previous studies. Our primary results came from the resting-state data of an EFT or CET intervention (Study 1). Supporting findings came from the analysis of Study 1’s fMRI DD task and from the baseline session of a larger study (Study 2).
Study 1 (primary data source, EFT or CET)
This study was initiated during the COVID-19 pandemic, and these data have not been previously published. Due to the study’s complexity, time burden on participants, and costs, it was discontinued. Figure 1 shows the general timeline of Study 1. Participants were active drinkers (AUDIT scores greater than 15) who were interested in reducing their alcohol consumption but had no proximate plans to do so. Participants were randomly assigned to either the experimental (EFT; n = 15) or control (CET; n = 9) group through a stratification scheme that minimized the differences between groups across variables that included AUDIT scores and sex. The final group numbers were reduced after five participants (two from EFT, three from CET) were removed for excessive head motion in the MRI scanner. Immediately after randomization, all participants completed the baseline assessment session (S1), which included an adjusting-amount DD task (Koffarnus and Bickel, 2014). This DD task determined indifference points at seven hypothetical future delays: 1 day, 1 week, 1 month, 3 months, 1 year, 5 years, and 25 years. The following week, participants completed S2 (day 8 of the experiment) and S3 (day 10 of the experiment), consisting of an alcohol self-administration session and an fMRI session (S2 and S3 occurred approximately 2 days apart, with counterbalanced order across participants). At the beginning of S2, participants in both groups underwent a guided interview process during which they generated cues about their lives. These guided interviews constituted the EFT or CET intervention. For EFT, participants elaborated on separate, positively valanced events that could happen to them in the future at each of the following seven delays: 1 day, 1 week, 1 month, 3 months, 1 year, 5 years, and 25 years. For CET, participants described seven actual life events from time intervals spanning the previous 2 days (2 days prior: 4:00–7:00 PM and 7:00–10:00 PM, and previous day: 7:00–10:00 AM, 10:00 AM–12:00 PM, 1:00–4:00 PM, 4:00–7:00 PM, and 7:00–10:00 PM). Unlike other AUD interventions (e.g., brief motivational interviewing, CBT, or implementation intentions), participants were instructed not to refer to alcohol use or goals of abstinence. As in (Snider et al., 2016), the interviewer guided participants to generate sensory details about each event (e.g., what are you seeing, hearing, smelling, and tasting?) as well as episodic detail (e.g., who were you with?; what were you doing?; and how were you feeling?). Participants were recorded explaining a 2–3 sentence summary of each event, and they also created event-specific summary phrases, which were used as cues in S2 and S3. Following this guided EFT or CET interview, participants completed the same adjusting-amount DD task as in S1. Thus S1’s out-of-scanner DD task served as a baseline to determine participant’s DD rate (k), and the S2 task provided an acute, post-intervention estimate of k. At S3, participants again sat with the interviewer to comprehensively refresh their memory of the cues that they had generated at S2.
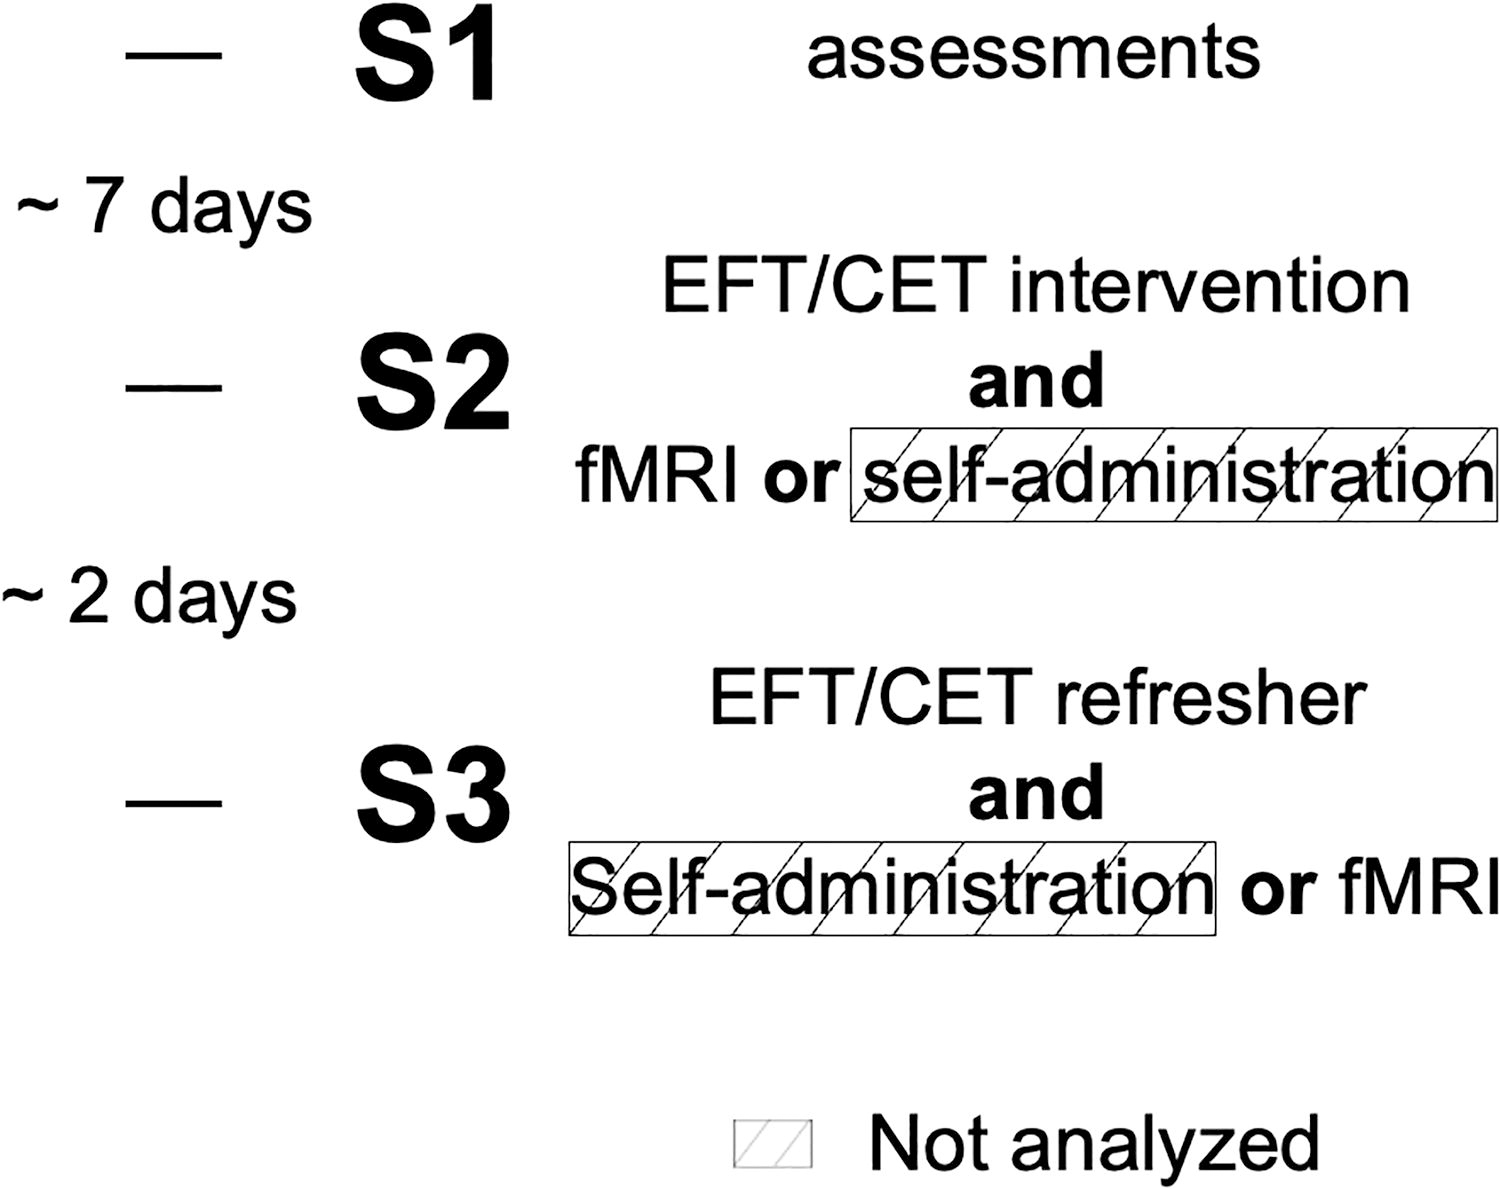
Timeline of events in Study 1. At S1, participants completed baseline assessments and were randomly assigned to the EFT group or CET group, counterbalanced for the order of events in S2 and S3. At S2, participants completed the EFT or CET-guided interview, followed by either the fMRI session or the self-administration session. At S3, participants completed a comprehensive EFT or CET interview refresher, followed by the remaining experiment (whichever was not completed at S2). Note that the data from the self-administration session were not analyzed for this study. The small sample size limited our ability to support any hypotheses about individual variation in the results. CET, control episodic thinking; EFT, episodic future thinking.
Study 2 (confirmatory data source, NOI)
We used baseline data (n = 50) from an independent cohort of AUD individuals that we have previously described (Snider et al., 2018). These individuals completed the same MRI scans and baseline DD task as the EFT/CET participants but received NOI before scanning. Participants were eligible for that study if they reported drinking in the past six months, satisfied at least three of the seven dependence criteria outlined in the DSM-IV-TR (unlike Study 1, which used AUDIT), and were between the ages of 18 and 65.
Neuroimaging
Study 1: We used a 3T Siemens MAGNETOM Prismafit scanner (Siemens, Erlangen, Germany) with a 20-channel head/neck coil. T1-weighted images were acquired at 1 × 1 × 1 mm3 resolution using: 3D MPRAGE, FOV = 256 × 256 × 176 mm3, TR/TE/TI = 1950/4.44/950 ms, FA = 12°, phase partial Fourier 7/8, slice partial Fourier 6/8, GRAPPA factor = 4 with 33 reference lines, and bandwidth = 140 Hz/pixel. Functional Blood Oxygen Level-Dependent (BOLD) data were acquired using: echo-planar imaging (EPI) with 33 4 mm interleaved slices with a 10% slice gap, TR/TE = 2000/30 ms, FA = 10°, in-plane resolution of 3.4 × 3.4 mm2, anterior-to-posterior phase encoding and a bandwidth = 2442 Hz/pixel.
Study 2: The scan protocol was identical to Study 1’s, with the following exceptions. We used a 3T Siemens Magnetom TIM Trio with a 12-channel head matrix coil. The MPRAGE used TR/TE/TI = 2600/3.02/900 ms, FA = 8°, GRAPPA factor of 2 with 32 reference lines, and bandwidth = 130 Hz/pixel.
In both Study 1 and Study 2, participants completed a 6-min resting-state scan followed by the fMRI DD task (see Koffarnus et al., 2017 for more details). Participants used button boxes to select between two monetary choices for this DD task. The task consisted of 98 trials and lasted ∼17.5 min. Similar to previous studies (Peters and Büchel, 2010), event-specific summary phrases, or “cues,” were visually displayed below the monetary choices (Fig. 2). For EFT participants, the cue matched the hypothetical delay period. For CET participants, the cues were randomly presented. Cues were not presented in Study 2.

EFT and CET summary statements and their translation into cue tags for the fMRI DD task. The top left shows an example summary statement for an EFT event generated at the 1-year future time point. After envisioning a potential event that could happen in 1 year and expanding on several details about that hypothetical event, the participant created a three-sentence summary statement to encompass the general nature of the guided interview. The participant generated one summary statement at each of seven future time points. Shown in the top right is an example trial for the fMRI DD task. In the fMRI DD task, the participant made choices between hypothetical monetary amounts that would be delivered at different time points. Below the choices is the corresponding EFT cue tag that was condensed from the summary statement. For EFT participants, the cue tag matched the time point for the hypothetical delayed amount (in 1 year). The bottom left and bottom right show an example summary statement for a CET event and the corresponding fMRI DD trial showing the CET cue tag. For CET participants, the cue tag could not match the time point for the hypothetical delayed amount and was instead chosen at random. Most important, the resting-state fMRI scan was always completed before the fMRI DD task. DD, delay discounting; fMRI, functional MRI.
fMRI analysis
Resting-state seed-based analyses were conducted with the CONN toolbox (Whitfield-Gabrieli and Nieto-Castanon, 2012). For Study 1’s resting-state data, preprocessing included slice-timing correction, outlier detection, motion realignment, normalization to the MNI template, and spatial smoothing using a Gaussian kernel with a 6-mm Full width at half maximum (FWHM). Following this, the data were bandpass filtered (0.008–0.09 Hz) and despiked. Finally, the data were linearly detrended using CompCor with five principal components to remove white matter and cerebrospinal fluid signal. Each participant’s analysis computed seed-based correlations for each region of interest (ROI) to all voxels in the brain. Seeds were defined by the Harvard–Oxford atlas in the CONN toolbox and consisted of nodes of the DMN (posterior cingulate cortex, medial prefrontal cortex, left angular gyrus, right angular gyrus), salience network (anterior cingulate cortex, left insula, right insula), and the left and right hippocampi. Group analyses implemented a general linear model to determine connectivity differences between EFT and CET participants. Study 2’s data were also processed using the same CONN toolbox procedures to examine and corroborate the right insula’s connectivity with DLPFC found in Study 1’s data, as described in the Results section.
A seed-to-whole-brain PPI analysis of the DD task was conducted with the CONN toolbox. PPI analyses (Friston et al., 1997) examine connectivity in task data. Most commonly, a seed-based time series and the task design are examined together in a GLM analysis to identify regions that demonstrate a statistically significant interaction between these two regressors. Such brain regions are interpreted as showing task-dependent connectivity with the seed region. Thus, PPI analyses can show connectivity changes that are relevant to task behavior. As a reminder, we view the resting-state results as this study’s primary contribution. The motivation for PPI analysis was to determine whether any group differences revealed from the resting-state fMRI analysis were functionally relevant in the context of delayed reward decision-making. Therefore, clusters revealed by the resting-state group contrast maps were used as seed regions in the PPI analysis. We applied the same preprocessing to the fMRI DD data as was applied to the resting-state data, omitting the bandpass filter. At the subject level, using the all trials vs. rest contrast, a weighted GLM was used to measure bivariate regression between the seed and each voxel. Therefore, the physiological term was the time course of the seed region, the psychological term was the task design, and the interaction between the two was the PPI term. Second-level analyses tested for DD connectivity differences between EFT and CET groups. Note that this approach of using resting-state results for selecting PPI seeds has been used by other groups (e.g., Ho et al., 2015).
DD trial difficulty and reaction times
A trial’s difficulty (or easiness) can be determined by the distance of the delayed option from the participant’s discounting curve, with trials closer to the indifference point being more difficult. As mentioned, each participant’s discounting curve was determined outside of the scanner before the scanning session (Koffarnus and Bickel, 2014). The parameter k characterizes their discounting curve. Then, using the approach adopted by (Ballard et al., 2017), we quantified each trial’s easiness by estimating a DD rate for each trial (ktrial
) and determining the proximity from the participants’ discounting curves (governed by k). Therefore, each trial’s easiness is given by:
As a minor point, we note that the DD task that we used (Koffarnus et al., 2017) includes trials in which both options are framed in the future (e.g., $100 in 1 week vs. $1000 in 1 month). The trials that do not include a “now” option likely require different mental processing and therefore may not be comparable to the other trials. These trials were omitted from the subsequent analyses.
To test for differences in response speed between groups, we examined the relationship between trial easiness and reaction time. Reaction time distributions tend to be exponential-Gaussian, skewed, and contain outliers (McGill et al., 1963). To optimize the normality of the reaction time distribution, we used the Box-Cox transformation (Marmolejo-Ramos et al., 2014) on each participant’s response time data. Optimization through the Box-Cox transformation uses maximum likelihood estimation to find an optimization parameter, λ, that satisfies the following equations for any distribution
Once each distribution was transformed (and a corresponding λ parameter was calculated), the median value for λ across participants was obtained. Then, this common λ was applied to transform each of the original datasets to perform a uniform comparison across distributions for EFT and CET participants. Finally, we calculated linear fits for response time as a function of trial easiness (Eq. 1). This procedure was implemented separately for the NOI group.
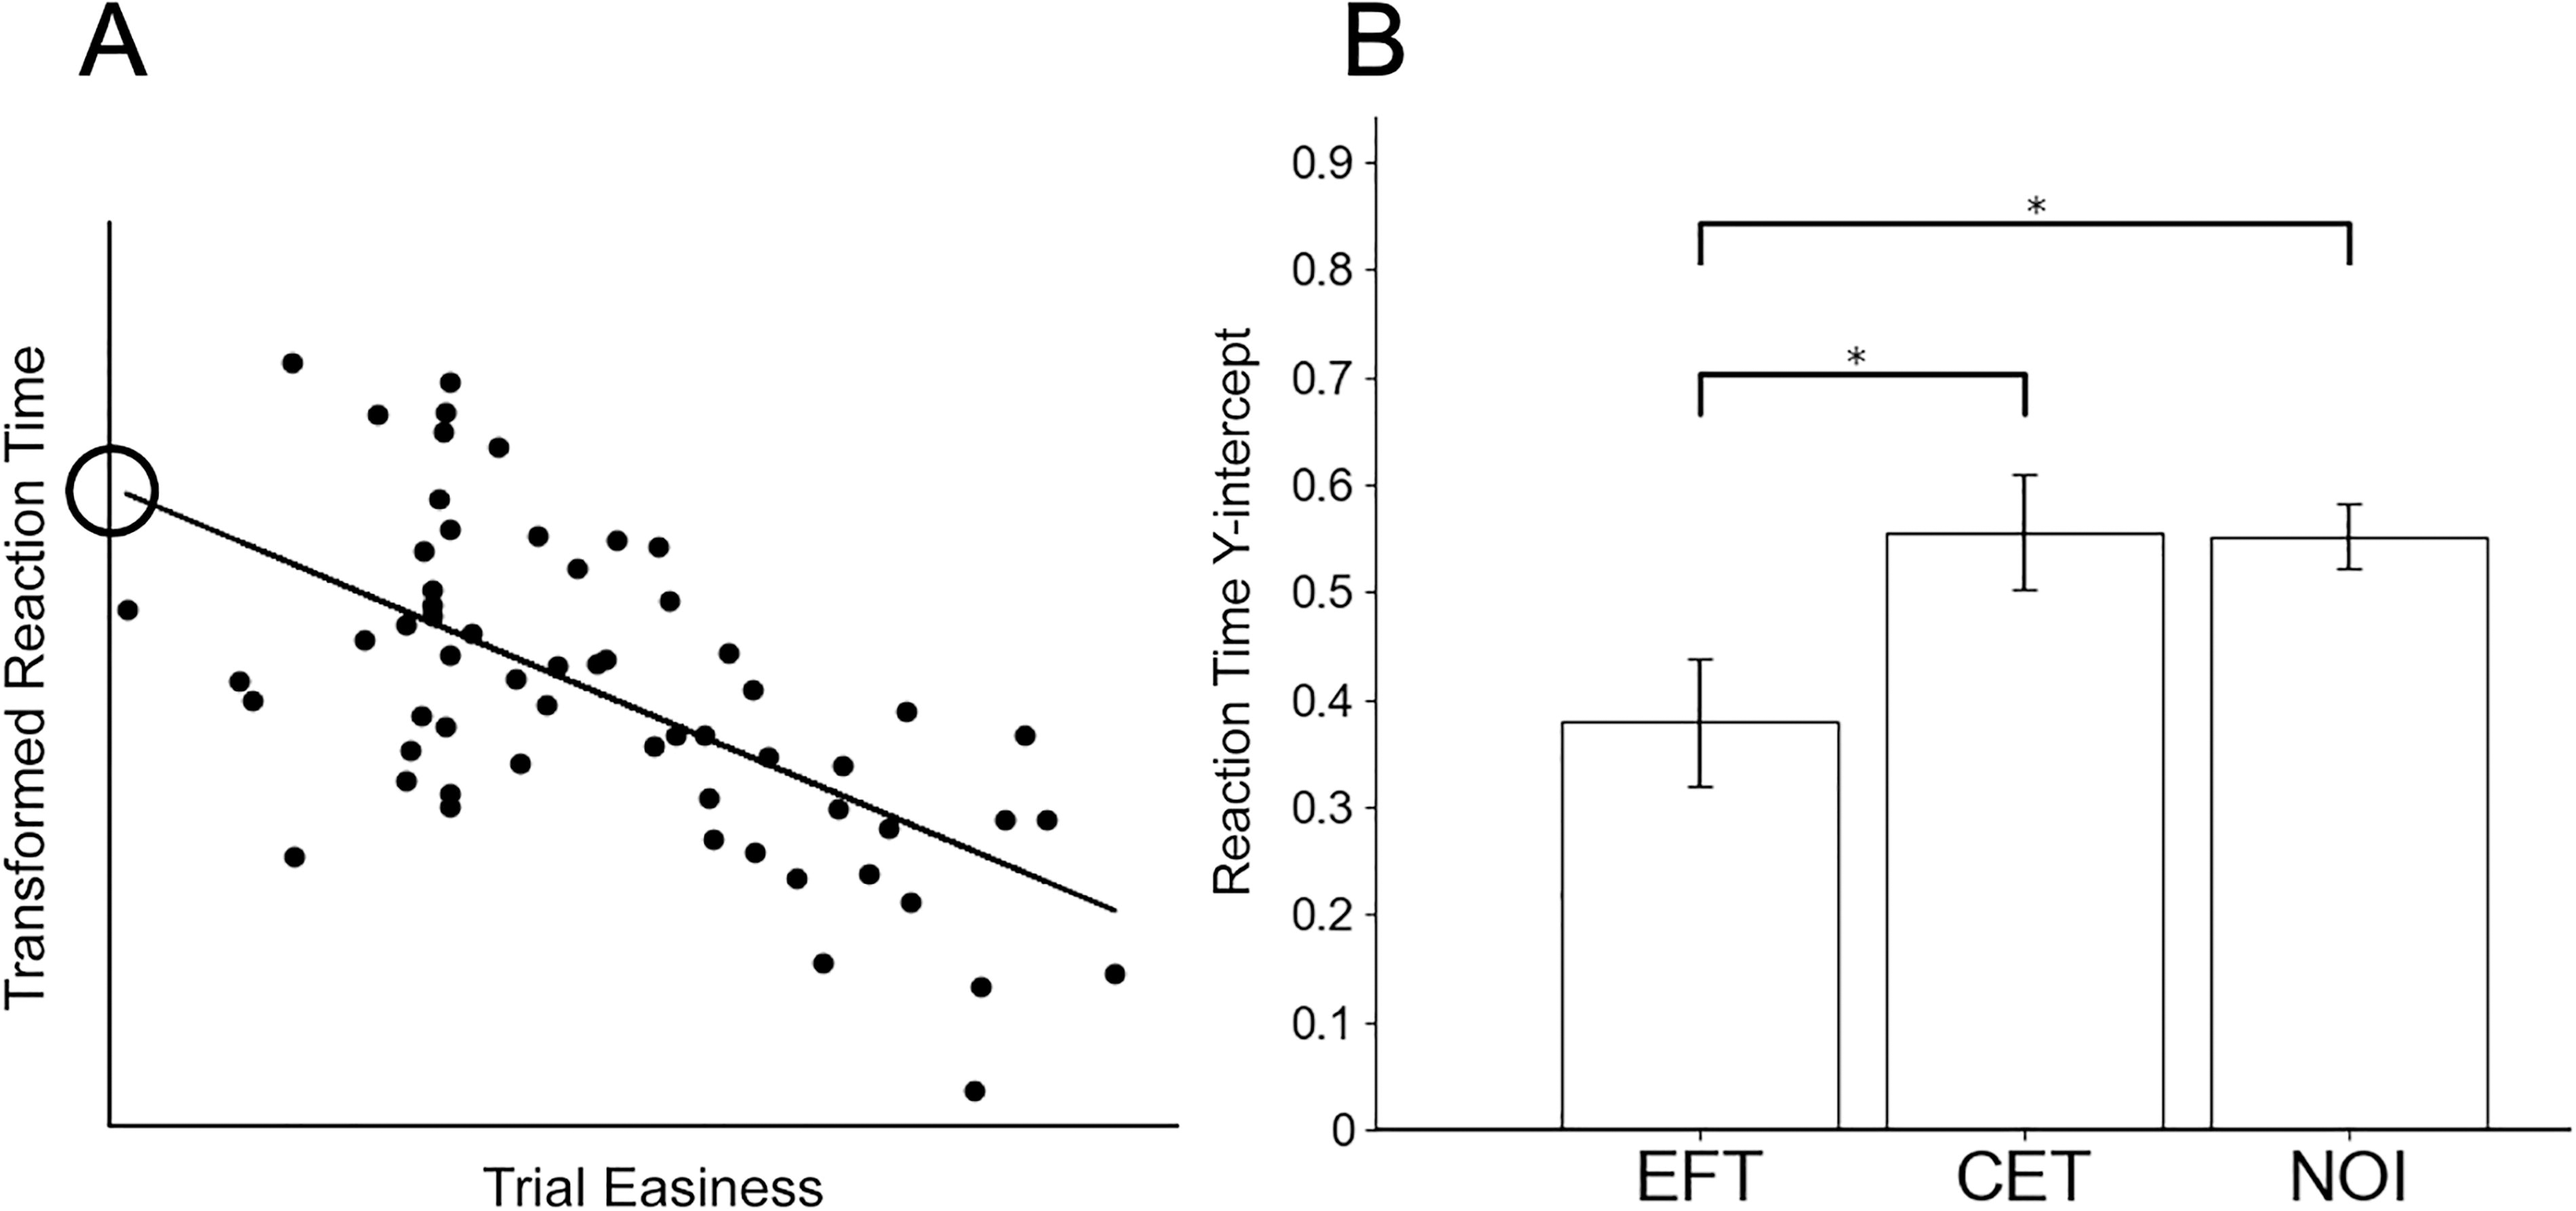
We used the linear fits for response speed vs. trial easiness (see Fig. 5A for an example) to compare the “y-intercepts” between groups. The y-intercept of a participant’s linear fit represents the response time for the minimum value of trial easiness, which defines the most difficult trials. Based on observations described in the Results section, we hypothesized that EFT would reduce the speed at every level of difficulty—and consequently reduce the y-intercept for the linear fit. Therefore, responses to the most difficult trials, parameterized by the y-intercept, were compared between EFT, CET, and NOI participants using one-sided t-tests.
Resting-state functional connectivity results from Study 1.
Results
Table 1 reports the demographic information for each group and the DD rates at baseline and after intervention in Study 1. As hypothesized, we observed a significant reduction in DD rate following EFT (t = 3.62, p = 0.003) but not CET (t = 0.65, p = 0.536). We did not observe an interaction between the group and the session (F = 0.8, p = 0.4). Note also that we found significant differences between baseline DD rates between Studies 1 and 2 (EFT vs. NOI: t = −2.56, p = 0.01; CET vs. NOI: t = −2.87, p = 0.006).
Demographic Information for Intervention (Episodic Future Thinking, Control Episodic Thinking) and Non-Intervention Cohorts
CET, control episodic thinking; EFT, episodic future thinking; NOI, no intervention.
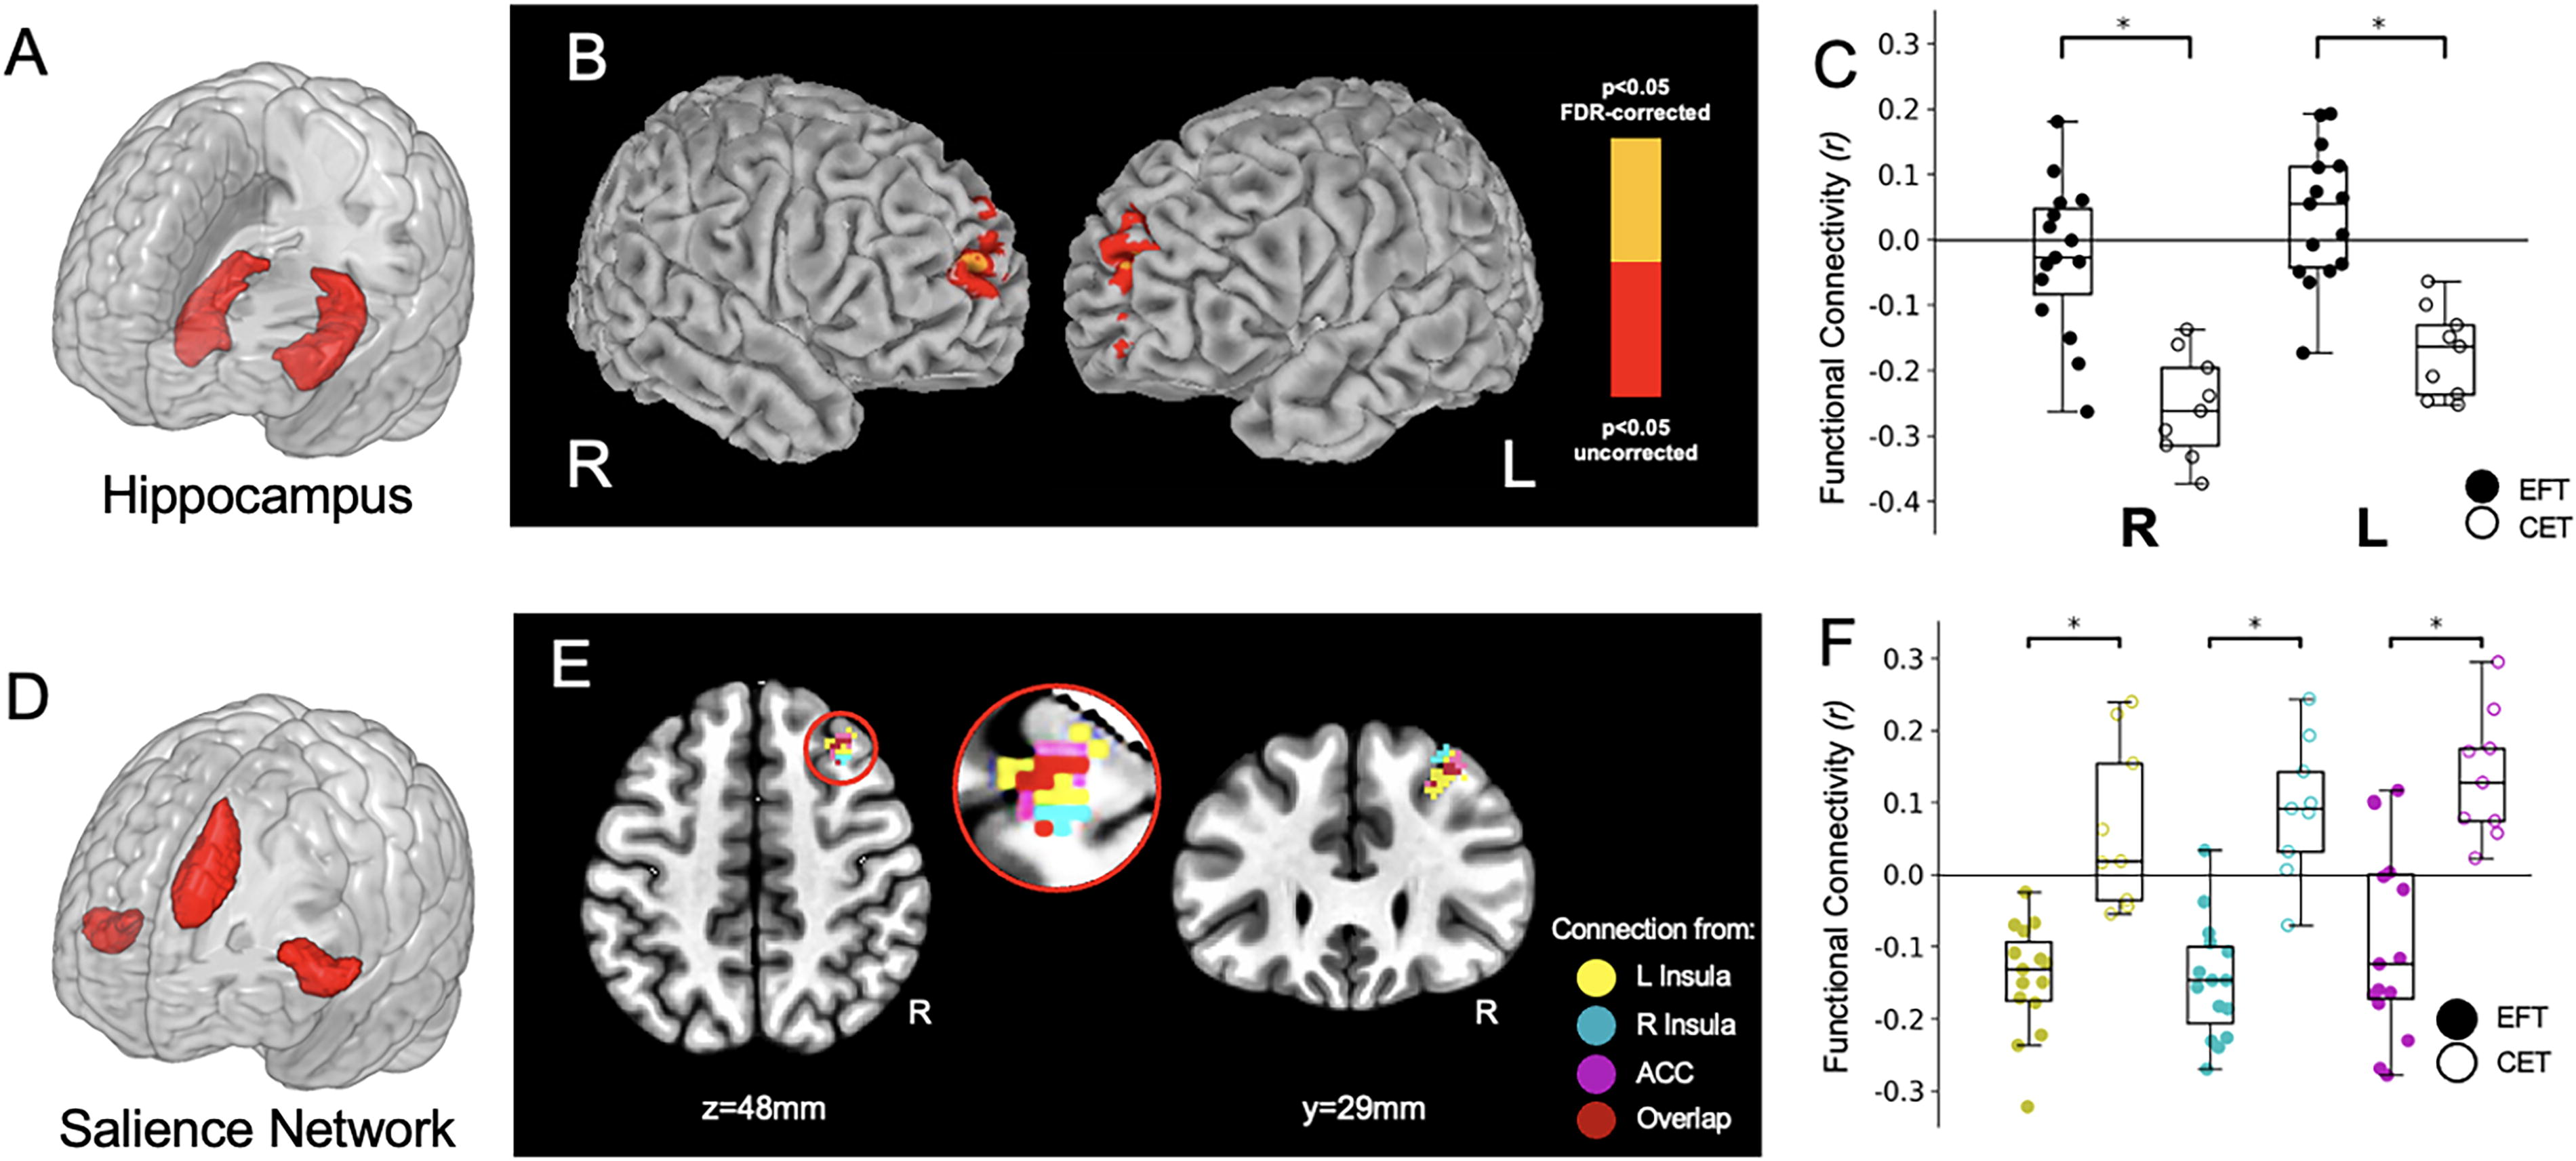
Among our a priori seeds for the resting-state analyses, only the left hippocampus and salience network nodes (anterior cingulate cortex, left insula, right insula) revealed group connectivity differences based on an FDR-corrected threshold of q < 0.05. Figure 3B shows the resting-state functional connectivity differences between the EFT and CET groups for the left hippocampal seed (see also Table 2 for cluster coordinates and statistics). We observed group differences bilaterally in the connectivity between the left hippocampus and the right and left frontal poles (Fig. 3B). Figure 3C is a non-independent analysis (Kriegeskorte et al., 2009) included to show the directionality of these differences. The analysis revealed a negative correlation between the left hippocampus and the right and left frontal poles in the CET participants. This connectivity was smaller, on average, in the EFT participants (non-independent statistics: right frontal pole: t = 5.22, p < 0.001; left frontal pole: t = 5.42, p < 0.001). We note also that the CET connectivity results were much more consistent across individuals than EFT (e.g., the CET standard deviation in connectivity to the left frontal pole is 0.10, whereas for EFT it is 0.16). Although we cannot directly examine the brain connectivity patterns as within-subject changes, the group-level differences suggest that EFT may disrupt a negative hippocampal-to-frontal pole connectivity relationship in AUD, but its effects vary from individual to individual.
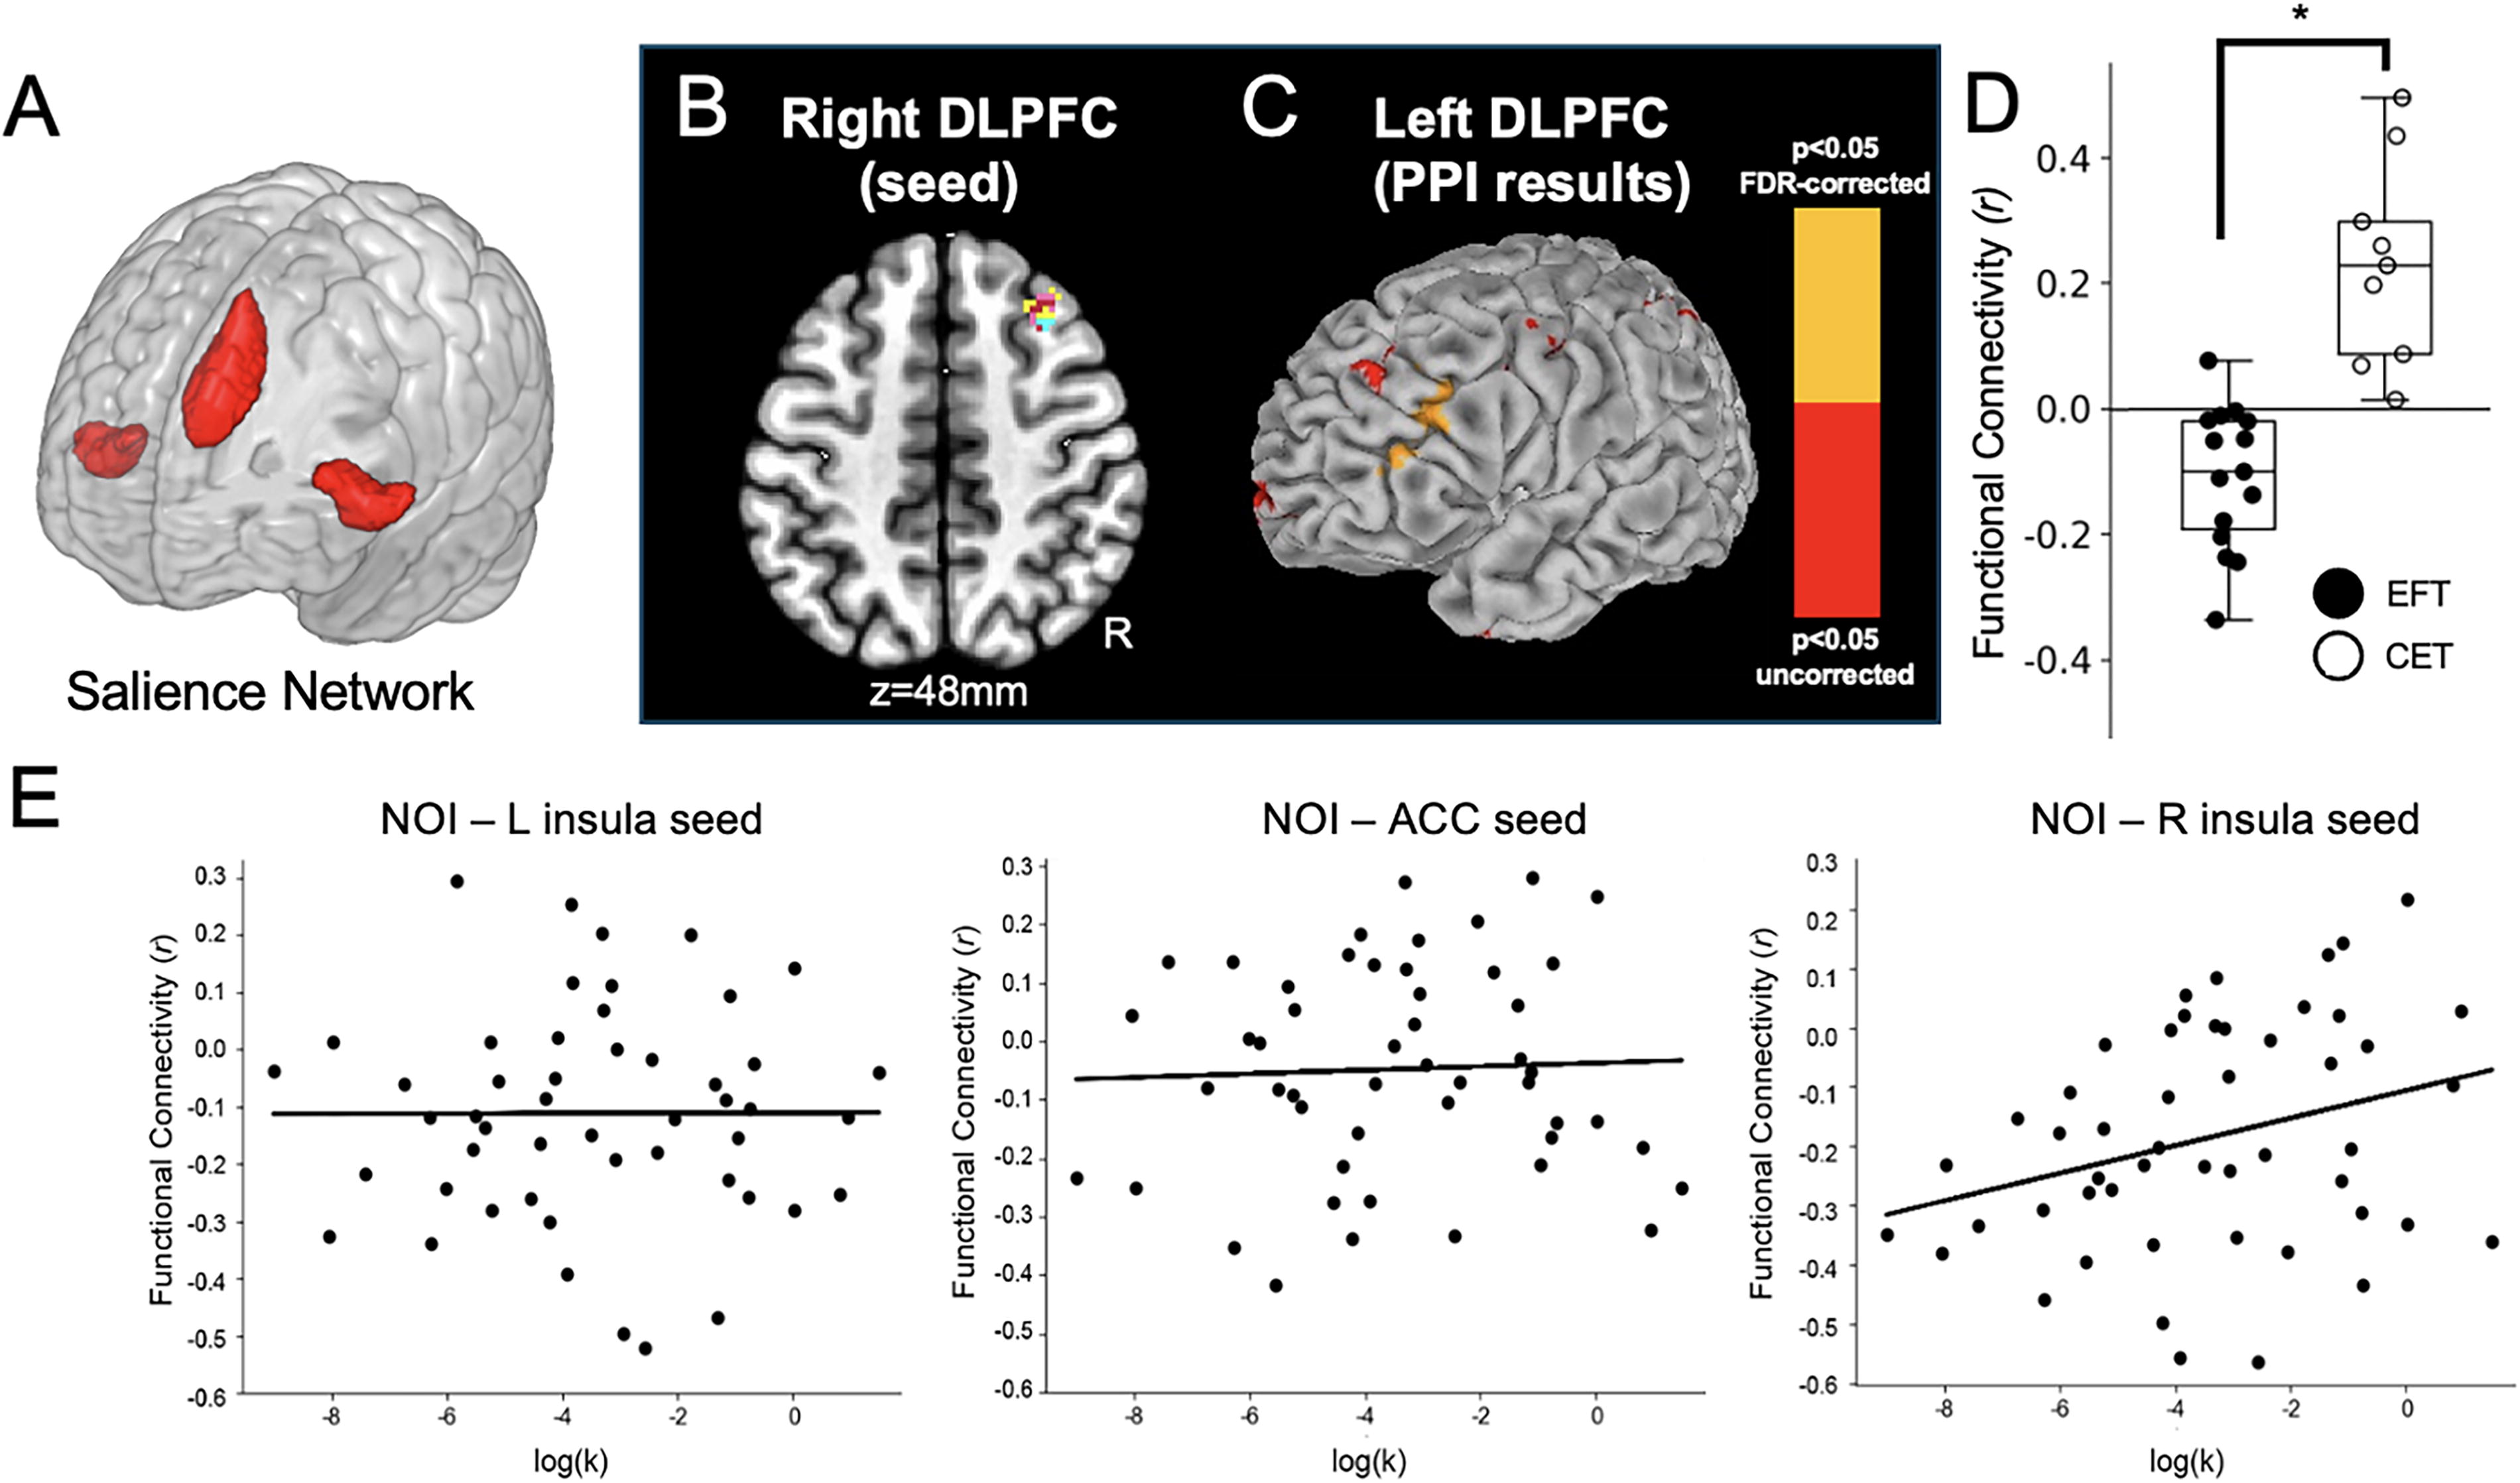
Results from the analysis of the R DLPFC cluster, which was revealed from the EFT vs. CET contrast map of resting-state functional connectivity.
EFT Versus CET Connectivity Differences for Resting State and PPI Seeds
Foci are in MNI coordinates and reflect the peak t value.
ACC, anterior cingulate cortex; DLPFC, dorsolateral prefrontal cortex; PPI, psychophysiological interaction.
One EFT vs. CET contrast map was derived for each seed of the salience network (left insula, right insula, anterior cingulate cortex), resulting in three group contrast maps. Remarkably, each map revealed a single cluster in the right dorsolateral prefrontal cortex (R DLPFC), overlapping between the three maps (see Fig. 3E and Table 2). In this case, as Fig. 3F shows, the salience-to-R DLPFC functional connectivity reflected a negative correlation for EFT and a positive correlation in CET. The group differences between the EFT and CET values across participants produced the following non-independent statistics (Kriegeskorte et al., 2009): left insula (t = 9.12, q < 0.001); right insula (t = 6.52, q < 0.001); anterior cingulate cortex (t = 6.66, q < 0.001).
To probe neural connectivity mechanisms that could potentially support decreases in DD following EFT, we examined these functional connectivity findings in an independent cohort of resting-state data as well as through a PPI analysis of DD. Figure 4E was generated with the salience network seeds in the 50-participant NOI group. The results corroborate the relationship between an individual’s right insula-to-R DLPFC resting-state connectivity with their DD rate (R 2 = 0.08, p < 0.006). Despite the baseline differences in DD between Studies 1 and 2, Figures 3F and 4E qualitatively agree with each other in that (Fig. 3F) the more negative connectivity scores between salience nodes and R DLPFC occur in the EFT group, and (Fig. 4E) the more negative this neural correlation, the less likely an individual is to discount the future strongly. This relationship with DD rate was limited to the right insula–R DLPFC connectivity and was not found using the other salience network seeds.
Parameter estimates for the reaction time analysis.
The CONN toolbox-based PPI results are shown in Figure 4C. The frontal pole regions from Figure 3 did not lead to significant group differences. Using the R DLPFC from Figure 3E (also Fig. 4B) as the PPI seed, however, produced a significant difference between EFT and CET (Fig. 4C). To interpret the directionality of these findings, Figure 4D depicts a non-independent analysis showing a negative correlation between the two hemispheres during the DD task in the EFT group and a positive correlation in the CET group. The non-independent statistics between EFT and CET groups in L DLPFC in Figure 4D were: group t = −6.0367, p < 0.001. Notably, the NOI group replicated these results with positive connectivity (as in CET) and a significant difference with EFT (independent cohort: t = −2.188, p = 0.032) but not the CET group (independent cohort: t = 1.133, p = 0.262).
Previous studies have demonstrated the role of DLPFC in working memory and cognitive control (Miller and Cohen, 2001), its increased activity during successful self-control (Hare, Camerer, and Rangel, 2009), and the compensatory nature of bilateral DLPFC to facilitate improved reaction times and cognitive processing (Liang et al., 2011). Based on the observed reduction in DLPFC connectivity with EFT, we hypothesized that the EFT intervention might facilitate decision-making by priming decision processes to speed choices at all levels of difficulty. We performed a post hoc analysis of DD trial reaction times to examine this, predicting that these should be faster in the EFT group. This reaction time analysis produced significant EFT vs. CET differences in the y-intercept of these reaction time vs. trial easiness fits, demonstrating the EFT participants were significantly faster during DD decisions. Study 2 corroborates these results. Using the same process as Study 1, we obtained a nearly identical y-intercept as the CET group. Thus, for both CET and NOI, the reaction time y-intercept was significantly greater than for EFT (CET: t = −2.0145, p = 0.0282; NOI: t = −2.5677, p = 0.0088). Note that the CET and NOI groups were not different (intercept: t = 0.0652, p = 0.5255; see Fig. 5).
Discussion
We examined EFT’s acute effects on functional connectivity in AUD. We first verified that EFT reduced DD, replicating previous studies (Peters and Büchel, 2010; Bickel et al., 2023). We then used key nodes for seed-based resting-state analyses. Those results subsequently guided PPI analyses of the fMRI DD data. Although our initial hypothesis included the DMN, no direct links to its core regions were revealed. Previous DMN findings were reported during EFT-related tasks, but our participants performed an extensive EFT-guided interview before the fMRI session, which may account for our null core DMN findings. Instead, the left hippocampus demonstrated EFT/CET differences in bilateral frontopolar connectivity. The hippocampus is frequently coupled to DMN, but the coherence of the hippocampus to other DMN nodes is thought to depend on context, including memory retrieval and encoding demands (Huijbers et al., 2011). The hypo-connectivity between the hippocampus and the frontal poles observed following CET is consistent with the general pattern of negative correlations observed in nicotine and alcohol users (Vergara et al., 2017). Although further experiments will be necessary to establish that EFT increases connectivity in this cortico-limbic path, the memory-specific component of EFT and the overlap of the frontal poles and the medial temporal cortex in future thinking (Okuda et al., 2003) make this an interesting area for future examination.
The three salience network nodes revealed group differences in R DLPFC connectivity. Here, Study 2’s data enabled a functional interpretation of this relationship since high (non-adaptive) DD rates were correlated with right insula-to-R DLPFC hyperconnectivity. The relationship did not hold for the other salience network nodes (left insula, ACC), which may suggest the importance of local fronto-insular connectivity in explaining DD variance. A similar relationship has been shown in the left hemisphere in smokers during intertemporal choice (Clewett et al., 2014). The R DLPFC was also important for uncovering hyperconnectivity to L DLPFC during DD in the CET group. When we proceeded to the PPI analysis, only the R DLPFC (not the frontal poles) showed a significant group contrast map between EFT and CET participants. These hyperconnectivity findings in CET follow observations that injured brains utilize hyperconnectivity as a compensatory mechanism (Hillary and Grafman, 2017). For example, a study of early improvement following treatment with antidepressants produced early responder vs. non-responder results that strikingly resemble the EFT vs. CET differences in Figure 4E (Yuan et al., 2020). The same study also hypothesized that increased connectivity to the DLPFC is a compensatory marker of an impaired salience network. Although the fMRI DD task engaged both PFC areas, the processes related to the DLPFC (executive control and focused attention) would be more likely to utilize compensatory resources than the processes related to the frontal poles (cognitive branching and meta-goal awareness). This supposition aligns with our PPI findings and the observation that EFT participants responded faster to DD choices than both CET participants and NOI participants. We speculate that our EFT-guided interview and the presence of EFT lexical stimuli in the fMRI DD task may prime participants by decreasing the novelty of future choices, thus reducing the cognitive resources required for all decisions, especially more challenging decisions. In light of these findings, it is possible that future PPI studies of tasks that probe episodic memory (Velanova et al., 2003), cognitive branching (Koechlin and Hyafil, 2007), or other putative frontal pole-hippocampus connectivity (Okuda et al., 2003) may reveal similar compensatory relationships.
Our study is limited by several factors, the most important of which are the lack of a preintervention fMRI scan and our small sample size in Study 1. We demonstrated DD differences, response time differences, and corroboration of several data points with our Study 2 data partially address these weaknesses. Ultimately, though, a pre–post design would allow us to make stronger claims about the strengthening or weakening of brain connectivity following EFT. We also note that five participants (two from EFT and three from CET) were removed from the analysis due to excessive head motion during scanning. Furthermore, it was difficult to directly compare alcohol use severity across the two studies, since the inclusion criteria for Study 1 (AUDIT greater than 15) and Study 2 (at least three of seven DSM-IV criteria for alcohol dependence) were different. However, AUDIT and DSM-IV criteria for alcohol dependence are correlated and provide clinically meaningful and accurate results at the severe end of the spectrum (Dawson et al., 2012; Moehring et al., 2019). The inclusion criteria for both studies resulted in admitting participants from the severe end of the AUD spectrum; Study 1 participants had a median AUDIT of 22.5, and Study 2 had a median DSM-IV score of 7 (out of maximum 11) with a heavily left-skewed distribution. Baseline DD differences could be a contributing factor in some of the differences that we observed, but these are unlikely due to differences in AUD status.
In sum, this study demonstrated that EFT not only decreases DD rates, but also results in distinct fronto-insular and cortico-limbic connectivity patterns at rest, as well as distinct PFC connectivity that may influence decision-making speed. These findings add to previous accounts of disrupted functional networks in AUD, which are hypothesized to represent network deficiencies, compensatory processing, and network dedifferentiation through hypo-, hyper-, and decreased connectivity (Müller-Oehring et al., 2015). Future research establishing a baseline to examine within-subject changes in connectivity would provide a clearer picture of EFT’s potential to ameliorate maladaptive connectivity patterns associated with AUD and establish links to real-world alcohol consumption and recovery.
Footnotes
Authors’ Contributions
J.M.: Conceptualization, data analysis, investigation, methodology, writing—original draft, and writing—reviewing and editing. S.M.: Conceptualization, supervision, and writing—reviewing and editing. J.L.: Data analysis, data curation, methodology, and supervision. D.C.T.: Investigation, methodology, project administration, and writing—reviewing and editing. A.S.K.: Conceptualization and writing—reviewing and editing. J.M.: Conceptualization and writing—review and editing. M.N.K.: Conceptualization and writing—reviewing and editing. R.M.F.: Project administration writing—reviewing and editing. W.K.B.: Conceptualization, funding acquisition, supervision, and writing—reviewing and editing. S.M.L.: Conceptualization, data analysis, funding acquisition, supervision, and writing—reviewing and editing.
Author Disclosure Statement
No competing financial interests exist.
Funding Information
This research was supported by the