
Abstract
Background:
Pareidolias are visual phenomena wherein ambiguous, abstract forms or shapes appear meaningful due to incorrect perception. In Parkinson's disease (PD), patients susceptible to visual hallucinations experience visuo-perceptual deficits in the form of pareidolias. Although pareidolias necessitate top–down modulation of visual processing, the cortical dynamics of internally generated perceptual priors on these visual misperceptions is unknown.
Objectives:
To study prestimulus-related electroencephalography (EEG) spectral and network abnormalities in PD patients experiencing pareidolias.
Methods:
Twenty-one PD in-patients and 10 age-matched controls were evaluated. Neuropsychological assessments included tests for cognition, attention, and executive functions. Pareidolias were quantified by using the “noise pareidolia test” with simultaneous EEG recording. The PD patients were subdivided into two groups—those with high pareidolia counts (n = 10) and those without (n = 11). The EEG was analyzed 1000 msec before stimulus presentation in the spectral domain (theta, low-alpha, and high-alpha frequencies) with corresponding graph networks to evaluate network properties. Statistical analysis included analysis of variance and multiple regression to evaluate the differences.
Results:
The PD patients with high pareidolia counts were older with lower scores on neuropsychological tests. Their prestimulus EEG low-alpha band showed a tendency toward higher frontal activity (p = 0.07). Graph networks showed increased normalized clustering coefficient (p = 0.05) and lower frontal degree centrality (p = 0.005). These network indices correlated positively to patients' pareidolia scores.
Discussion:
We suggest that pareidolias in PD are a consequence of an abnormal top–down modulation of visual processing; they are defined by their frontal low-alpha spectral and network alterations in the prestimulus phase due to a dissonance between patients' internally generated mental processing with external stimuli.
Impact statement
Pareidolias in Parkinson's disease (PD) are considered to be promising early markers of visual hallucinations and an indicator of PD prognosis. In certain susceptible PD patients, pareidolias can be evoked and studied. Here, via electroencephalography, we aimed at understanding this visual phenomenon by studying how neural information is processed before stimulus presentation in such patients. Using spectral and graph network measures, we revealed how top–down modulated internally generated processes affect visual perception in patients with pareidolias. Our findings highlight how prestimulus network alterations in the frontal cortex shape poststimulus pareidolic manifestations in PD.
Introduction
Parkinson's disease (PD) is predominantly a motor neurodegenerative disease, but those affected frequently show nonmotor symptoms of psychosis such as mood disorders, impulsivity, and hallucinations (Ffytche et al., 2017). Specifically, visual hallucinations (VH) have a strong prevalence in PD and contribute adversely to motor symptoms (Barnes, 2001; Kulick et al., 2018). Notably, VH are often preceded by minor hallucinations (Lenka et al., 2019) wherein patients develop misperceptions of inanimate forms, objects, or shapes (Ffytche et al., 2017). These visuo-perceptual deficits commonly occur in the form of “pareidolias”—misperceptions of ambiguous shapes or forms that appear meaningful—and serve as precursors in identifying hallucinatory tendencies in PD patients (Uchiyama et al., 2015). Several studies have previously shown a commonality of features between pareidolia and VH in patient populations (Nishio et al., 2017; O'Brien et al., 2020; Uchiyama et al., 2015; Yokoi et al., 2014), making it ideal to quantify pareidolias as a harbinger of VH.
Clinically, pareidolias can be quantified by using the noise pareidolia test (NPT), a neuropsychological test wherein ambiguous patterns are presented to evoke illusionary responses in PD or dementia with Lewy body patients (Uchiyama et al., 2012, 2015). Pareidolias evoked on the NPT inherently prompt a visuo-perceptual demand (Uchiyama et al., 2015) that requires reorienting attention depending on the salience revealed by the target. Recently, in a multimodal electroencephalography (EEG) experiment, we showed that PD patients exhibited abnormal top–down modulation of visual information “during” pareidolic manifestations (Revankar et al., 2020), suggestive of deficits in matching external sensory information with prior knowledge (Flowers and Robertson, 1995). However, considering the impact of abnormal priors in the causation of pareidolias (Corlett et al., 2019; Watanabe et al., 2018), it is yet to be determined how neural information “preceding” stimulus onset influences perception in those susceptible to pareidolias. To that end, we investigated how prestimulus cortical activity affects visual processing in PD patients during the performance of the NPT.
Prior studies on prestimulus oscillations have detailed the causal role of alpha frequencies in shaping and detecting sub-threshold stimuli (Linkenkaer-Hansen et al., 2004). The voluntary visual attentional stream, defined by the connections between the frontal and parietal cortices, reportedly has a strong impact of alpha band oscillations in discriminating ambiguous targets (Dijk et al., 2008) as well as the prediction of perceptual decisions (Mathewson et al., 2009). Within the domains of attention and working memory, cortical alpha activity has been variously described under different terminologies such as mind-wandering (Arnau et al., 2020), creative ideation (Fink and Benedek, 2014), or mental imagery (Bartsch et al., 2015), all to emphasize the influence of subjects' internally generated mental operations (Cooper et al., 2003) in the absence of bottom–up sensory information. Considering that the communication between these exo- and endogenous attentional systems is impaired in PD patients with VH (Shine et al., 2011), alpha oscillations may have a crucial role in the generation and maintenance of misperceptual tendencies. However, full-band (8–13 Hz) alpha frequencies are critically dependent on age and neurological status (Klimesch et al., 1993), and in patients with neurological disorders they may necessitate the use of narrow sub-band frequencies to highlight the attentional and perceptual processes (Klimesch, 1999; Pfurtscheller, 2003; Pfurtscheller et al., 1996). The use of low and high-alpha sub-bands, defined via subject-specific individual alpha frequencies (IAF), has shown to be a promising approach to characterize narrow-band properties, thereby preventing frequency-specific effects to remain unaccounted for (Gonzalez-Rosa et al., 2015; Grandy et al., 2013; Klimesch, 1999, 2012). In PD without dementia, an increase in theta and low-alpha power is reported in resting-state recordings (Babiloni et al., 2011; Stoffers et al., 2007), with stimulus-dependent studies reinforcing the importance of low-alpha bands (Schmiedt et al., 2005). As symptoms and severity worsen, theta-prealpha rhythms in the frontal cortex have been shown to predict the cognitive decline (Singh et al., 2018) and are associated with hallucinations and/or delusions (Onofrj et al., 2019). Regardless of this, the visuo-perceptual dynamics in PD patients before stimulus onset is currently unknown.
Although EEG studies conventionally use event-related and/or time-frequency analysis to study stimulus-related effects, application of the graph theory concepts to EEG data provides an efficient modality to examine alterations in higher-level whole-network brain areas (Sporns, 2013). Given that pareidolias directly relate to a failure of attentional (Revankar et al., 2020) and perceptual decision making (Yokoi et al., 2014), the involvement of multiple attentional network domains (Shine et al., 2015) suggestive of a global cortical dysfunction cannot be overlooked. Therefore, evaluating prestimulus graph network metrics is speculated to clarify the abnormal network organization in such patients. Graph network construction using synchronization metrics such as weighted phase lag index (wPLI) has been shown to be an ideal method to define functional communication between different brain areas (Ortiz et al., 2012; Seidkhani et al., 2017; Vinck et al., 2011). With respect to PD, prior studies using the graph theory have demonstrated decreased “small world” properties, network efficiency, and centrality measures when compared with healthy controls (HC), with the outcomes worsening further in PD with dementias (Hassan et al., 2017; Olde Dubbelink et al., 2014; Utianski et al., 2016). Accordingly, in our present study, we will focus on deriving frequency-specific graph metrics derived from wPLI associated with pareidolias and their impact on visuo-perception.
In summary, we hypothesized that PD patients with pareidolic tendencies demonstrate aberrant low-frequency oscillations with reciprocal network insufficiencies, addressed in an experimental paradigm where decisions are critically dependent on the individual's prior expectation of the stimulus. To achieve these aims, we performed an exploratory analysis on prestimulus intervals in PD patients and HC to study the global and local (fronto-parietal) network dynamics using EEG spectral and graph-theory indices when participants performed the NPT. The results of our current work are expected to reinforce the findings of our prior study (Revankar et al., 2020) and further our understanding on the effects of prestimulus cortical activity that shape poststimulus pareidolic misperceptions.
Materials and Methods
General information and recording procedures
We analyzed a dataset of 21 PD in-patients (age 70.4 ± 8.5 years [mean, SD]) and age-matched 12 HC (69.4 ± 8.5 years) whose details are previously published (Revankar et al., 2020). Notably, PD patients with dementia were excluded (mini-mental state examination scores <24) and testing was done during the “ON” state of PD medication. All participants had normal or corrected-to-normal vision. Neuropsychological assessments relevant to the study were conducted by a trained psychologist, independent of experimenters who performed EEG. These included the Japanese adult reading test (JART), frontal assessment battery (FAB), montreal cognitive assessment (MoCA), and the short form of Benton's judgment of line orientation test (JLO, Form H). At the outset, we classified the patients based on the clinical NPT, a standardized paper-based test to evoke and quantify pareidolias (Mamiya et al., 2016). The test comprises black and white patches of visual noise, with certain images containing faces. Correct responses refer to appropriate discrimination of faces from noise. However, when faces are identified in stimuli without a face, such responses are marked as pareidolias. Unidentified faces are categorized as missed responses. The test uses misperceptual cutoff scores of 0–1 as nonpareidolics and ≥2 as pareidolics. Of the 21 PD patients, 10 exhibited high pareidolia scores, henceforth classified as PD pareidolia type (PDP), and the rest were classified as PD nonpareidolic type (PDnP). There were two dropouts within the HC group (due to technical difficulties), bringing the total number of tested participants to HC = 10, PDnP = 11, and PDP = 10 for final EEG analysis. A summary of the participant details is shown in Table 1. Informed consent was obtained from all subjects and in accordance with the ethical standards of the Declaration of Helsinki; the institutional review board cleared the protocol for the study (approval number 18136).
Demographic and Neuropsychological Assessment
Significance of the italicized values are given on the corresponding right-most columns and described in the results section.
NPT scores shown are medians (interquartile range). All other scores are presented as means ± standard deviation.
Student's t-test.
Mann Whitney-U test.
FAB, frontal assessment battery; HC, healthy controls; JART, Japanese adult reading test; JLO, judgment of line orientation test; LEDD, levodopa equivalent daily dose; MDS-UPDRS, Movement Disorder Society—Unified Parkinson's disease rating scale; MMSE, mini-mental state examination; MoCA, montreal cognitive assessment; NPT, noise pareidolia test; PDnP, Parkinson's disease nonpareidolic type; PDP, Parkinson's disease pareidolia type.
For the EEG experiment, participants were shown a total of 80 NPT images on a computer monitor in two successive testing blocks, each with 40 images, with a 5 to 10 min break provided between the blocks to prevent fatigue. Of the 80 images, 60 were with visual noise and 20 had faces embedded in them in a pseudorandomized order (Supplementary Data and Supplementary Fig. S1). The faces on the NPT were low-information, 2-toned images that required configural knowledge-based facial-feature processing (Schwartzman et al., 2008). Cutoffs were appropriately increased. Participants were seated upright at a distance of 80 cm from the monitor display, which had images subtending a size of 700 × 700 pixels (width × height). Participants verbally responded to each image within 30 sec of stimulus presentation, and the experimenter recorded the responses since patients' tremor severity may have prevented reliable manual responses. Visual mis-perceptual phenomena are strongly influenced by time of the day (“sundowning”), age-related vision problems, and mood that fluctuate during the day (Ffytche et al., 2017; Suzuki et al., 2011; Watanabe et al., 2018; Weil et al., 2016). To minimize these effects, we performed the NPT (1) at a fixed time of the day (late afternoons), (2) when vision was normal or corrected-to-normal; and (3) providing a calm, neutral environment (away from in-patient wards) allowing for a placid mood during testing.
The EEG data were recorded on a 32-channel Biosemi, ActiveTwo system at 2 kHz sampling rate on ActiView software (LabVIEW). The EEG recordings were re-referenced to average of all the electrode channels, pass filtered between 1 and 45 Hz, and down-sampled to 500 Hz for independent component analysis. Final EEG data were then reconstructed after independent components that were responsible for heartbeat, eye-blinks, and muscle-related artifacts were removed by using visual inspection.
Analysis of inter-stimulus intervals
An overview of the evaluation procedure and analysis is shown in Figure 1. Each NPT image was preceded by a fixation-cross for 2 sec on the monitor on which the subjects were asked to focus. Fixation-cross eye-open EEG data were epoched from −2000 to 0 msec, with 0 being the onset of NPT image. To avoid any stimulus-onset related potential from the fixation-cross image, the first 1000 msec was discarded. Data epochs from −1000 to 0 msec (longer segments were chosen on either ends to avoid edge artifacts) were pooled per subject to calculate the power spectrum density by using Welch's method with settings fixed to Hamming window, no window overlaps, and frequency resolution of 0.5 Hz. For each band, power spectra were normalized by each signal and each time point by the total power for this signal/time point to obtain the relative power, which was then log-transformed to identify peak IAF. IAF was calculated within a range of 7 to 13 Hz in posterior and occipital electrodes. As reported in prior studies, theta and alpha sub-bands were defined with respect to IAF (Grandy et al., 2013; Klimesch, 1999, 2012). However, due to age-related alpha changes, in nearly half of all of our participants (n = 14 of 31), a strict second low-alpha band, that is, IAF −4 Hz, without theta overlaps, was not possible to evaluate (Babiloni et al., 2012; Klimesch, 1999). As a result, theta frequency was evaluated at 4–7 Hz, with low- and high-alpha bands being defined as IAF −2 Hz and IAF +2 Hz, respectively. In addition, the IAF range was also assessed. In our formulation of spectral and graph networks, we analyzed (1) global activity—defined by all 32 electrodes, and (2) local measures—predefined via 13 frontal and 11 parietal electrodes. Frontal electrodes comprised Fp1, AF3, F7, F3, FC1, FC5, FC6, FC2, F4, F8, AF4, Fp2, and Fz; whereas parietal area included CP1, CP5, P7, P3, Pz, PO3, PO4, P4, P8, CP6, and CP2 electrodes according to Biosemi cap-coordinate system. This selection was motivated by our predefined hypothesis and prior literature (Nikolaev et al., 2013; Revankar et al., 2020) with respect to the involvement of the fronto-parietal networks in target search-and-detect paradigms.
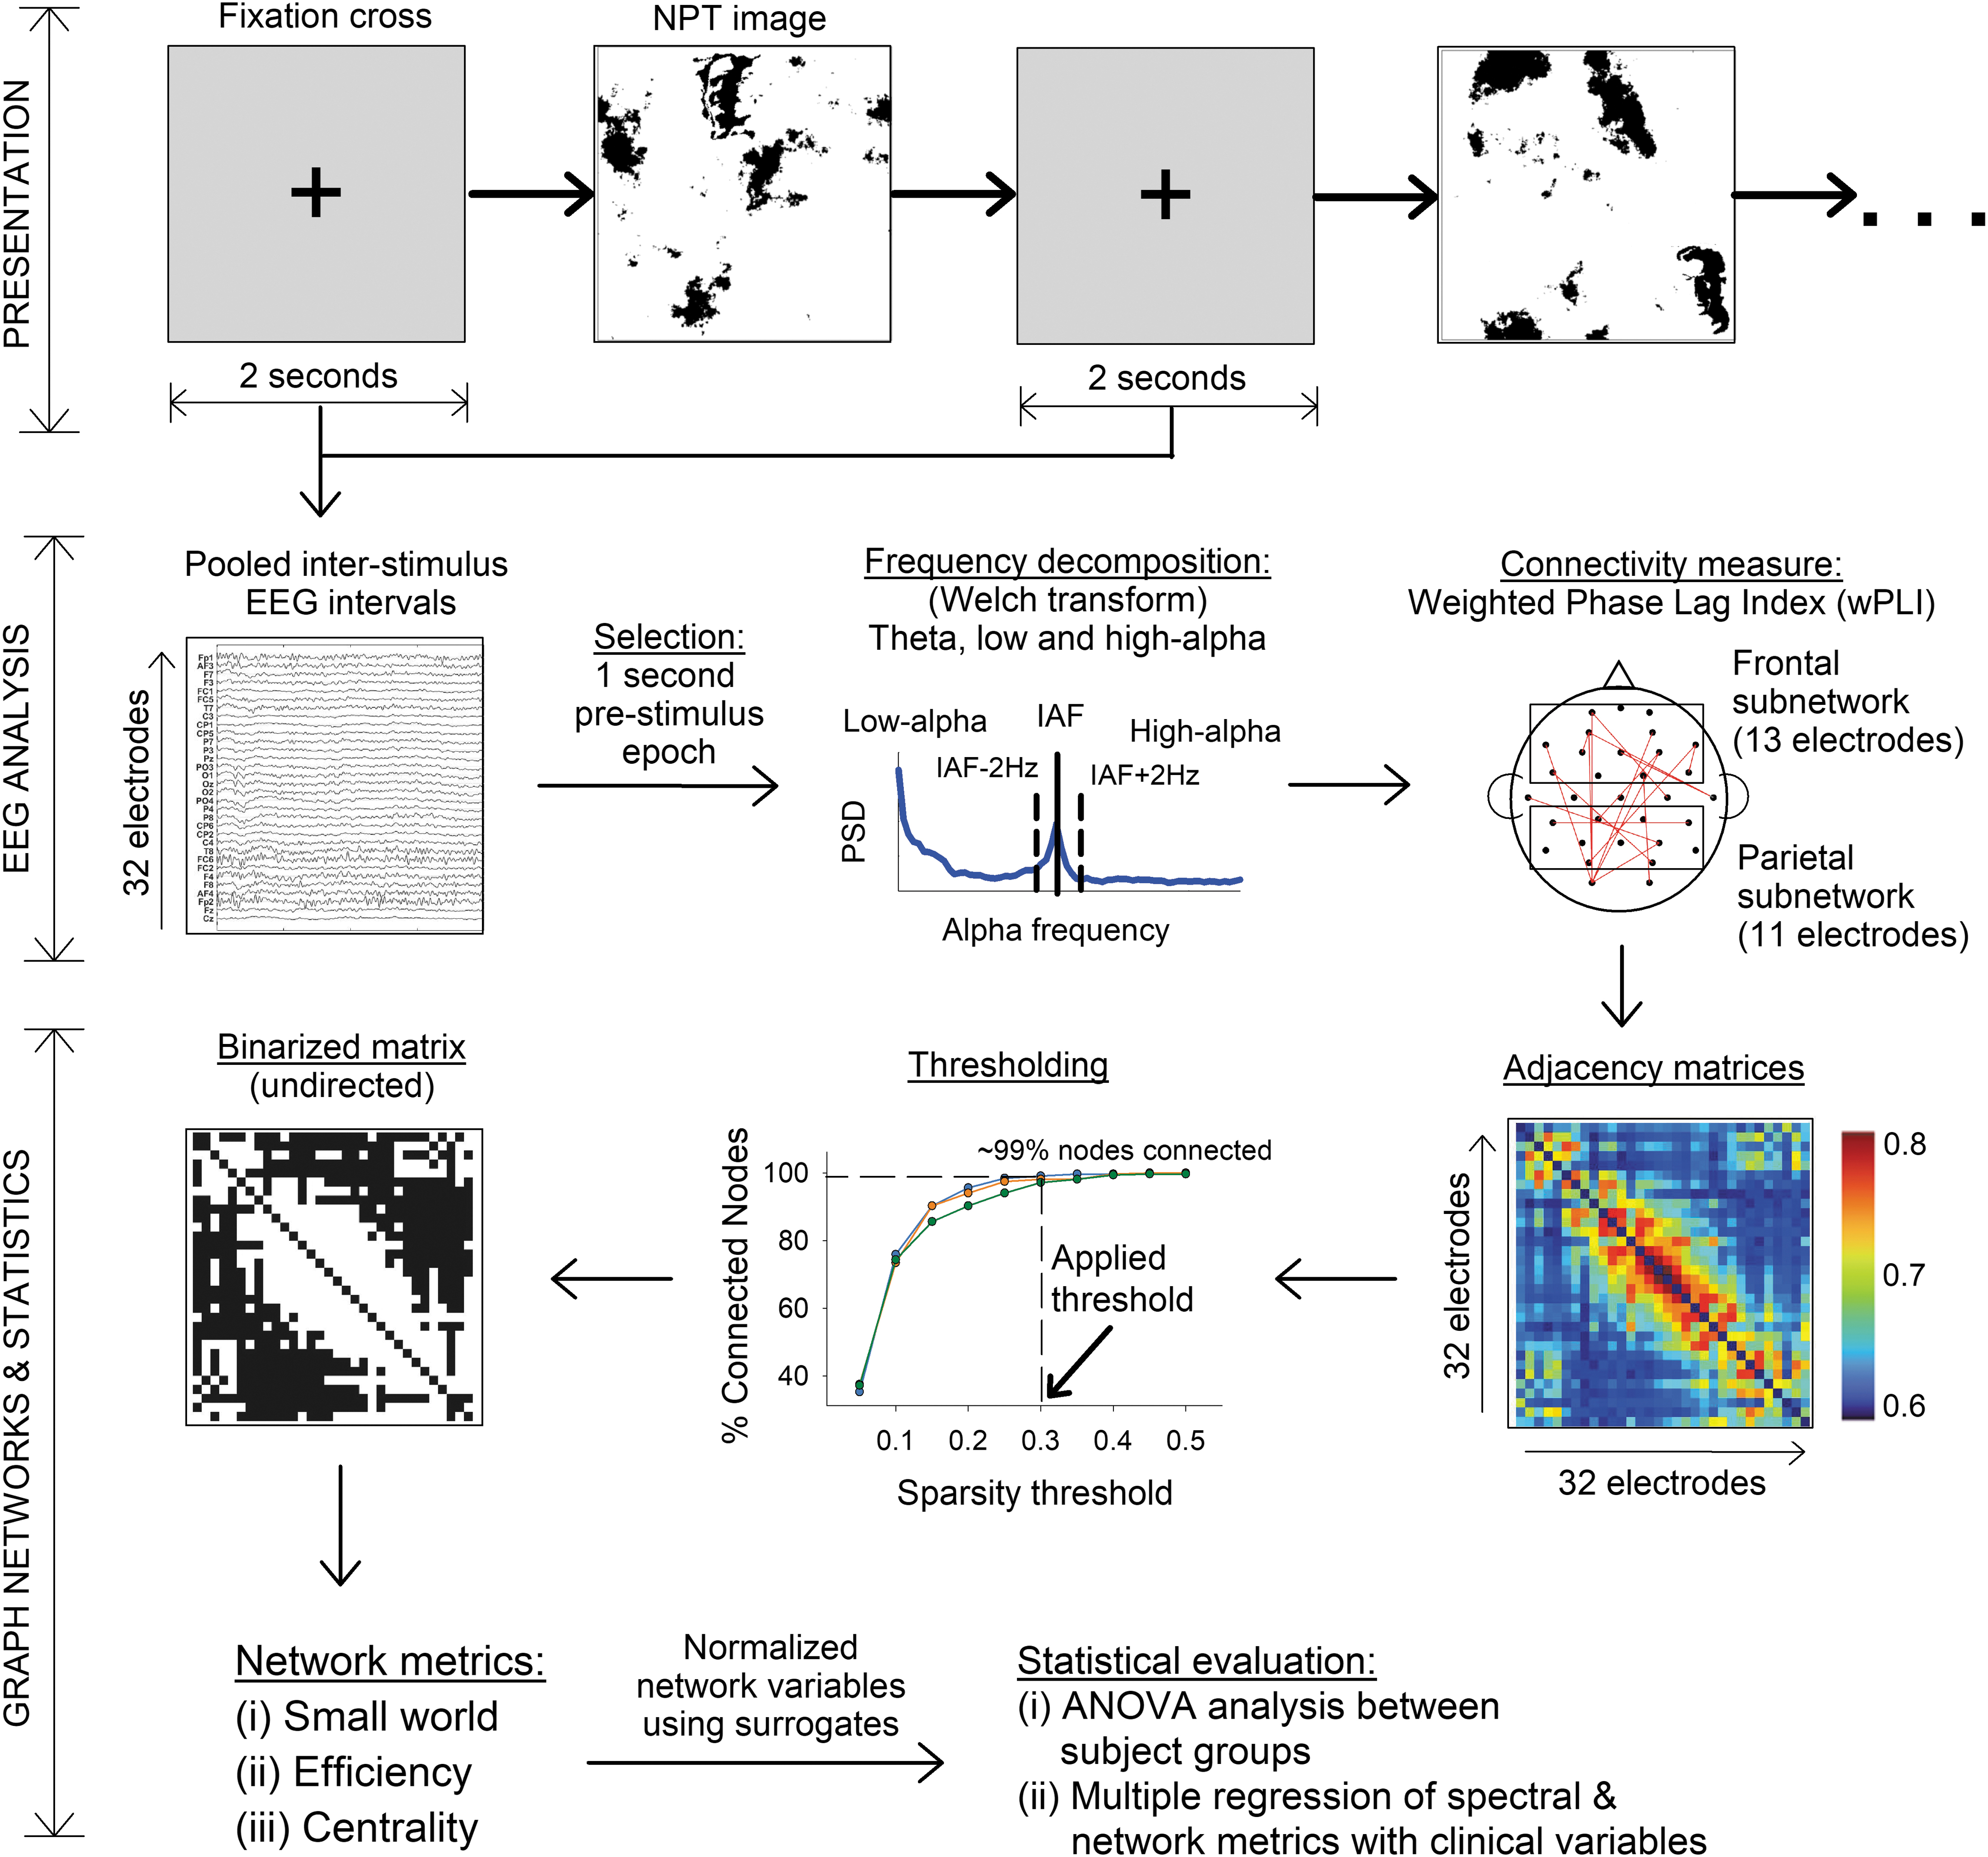
Overview of presentation, recording, and analysis methods. The workflow was divided into three parts, as shown on the left margins: Presentation of stimuli, EEG analysis, and Graph network analysis. Presentation of stimuli comprised 80 NPT images, each preceded by a fixation cross for 2 sec, which served as epochs for EEG analysis. The EEG analysis involved preprocessing and calculation of theta, low-alpha and high-alpha band with respect to IAF. Finally, graph networks were calculated based on binarized matrices obtained by using wPLI as edges and EEG electrodes as nodes. Line-plot shown in thresholding represents the three groups that were tested. Statistical comparisons were subsequently performed for spectral and network measures between the three participant groups. ANOVA, analysis of variance; EEG, electroencephalography; IAF, individual alpha frequency; NPT image, noise pareidolia test image; PSD, power spectrum density; wPLI, weighted phase lag index. Color images are available online.
To evaluate graph network properties for each frequency band, we utilized the wPLI as a measure of network connectivity. True neural interaction between two sources (here, the sensor space) shows a coherent relationship when their time-series information is synchronized. The wPLI provides a measure of this relationship between the sensor pairs to define cortical signals that are independent of volume conduction and exclude zero-lag connections caused due to spurious uncorrelated noise, thereby improving statistical power to identify phase synchronizations (Imperatori et al., 2019; Vinck et al., 2011). Intuitively, wPLI estimates the interaction between electrode pairs and quantifies the functional coupling between brain regions. The wPLI values were calculated separately for theta (4–7 Hz), low-alpha (IAF −2 Hz), and high-alpha (IAF +2 Hz) bands by using an index for synchronization previously described by Vinck et al. (2011). These values served as “edges” between the network pairs. For each subject, a 32 × 32 node-to-node adjacency matrix was obtained, which was subsequently binarized to create undirected graphs for analysis. A crucial step in binarization is the application of thresholds to the adjacency matrices. Since threshold setting is often arbitrary (Langer et al., 2013), to obtain consistent results, we calculated the shortest path lengths between interconnected nodes for a range of thresholds and selected the one in which the nodes were connected ∼99% of the time.
Graph network indices
Relevant to our hypothesis, we evaluated small-world properties (normalized clustering coefficient and normalized characteristic path length), efficiency (global and local sub-networks), and centrality (degree and betweenness centrality). The clustering coefficient is a measure of functional segregation between locally associated nodes and provides the likelihood that a node is connected by its neighbors. The characteristic path length is the average shortest path length between all possible pairs of nodes within the network and outlines the integration of information from different brain regions. Both the indices cited earlier were normalized by using 100 random surrogate networks (to obtain Gamma and Lambda values, respectively) (de Haan et al., 2009). The efficiency of a graph defines the ability of information exchange within the network. Global efficiency illustrates parallel information processing with a high integration of nodes, whereas local efficiency is the averaged global efficiency within a sub-network of locally selected nodes, which illustrates the tolerance of information exchange when a locally connected node is eliminated (Sporns, 2013). Centrality measures the effectiveness of a node in information transfer within the network. Here, degree centrality defines the importance of a node(s) and its direct impact on adjacent brain areas. In our formulation of binarized graphs, the degree centrality illustrated the number of connections of each node to all other nodes in the graph. We also evaluated the betweenness centrality, which provides a quantification of the node that acts as a bridge between two other connected nodes along its shortest path length. The shortest path length was the smallest number of connections between two nodes; it was utilized not only to calculate various network measures but also to define the sparsity threshold (Liu et al., 2017).
Statistical analysis
Differences between demographic and neuropsychological tests were reported by using Kruskal Wallis test. For significant p-values, Dunn's post hoc tests (for unequal groups) were performed between HC, PDnP, and PDP groups. To report differences between patient groups (PDnP and PDP), Student's t-test or Mann Whitney-U test was performed.
For each spectral narrow-band calculated by using IAF, between-group differences were evaluated by using analysis of variance (ANOVA) analysis on HC, PDnP, and PDP groups. For graph networks analysis, age and MoCA scores were used as covariates since these are known to be contingent on age-related cognitive differences (Stumme et al., 2020). Assumptions of normality and homogeneity were performed by using Shapiro-Wilk's test and Levene's test, respectively, with the test statistic set to 0.05. For responses that did not achieve normality, nonparametric ANOVA was performed. Statistical significance was set to p < 0.05 with a subsequent post hoc Tukey test performed for each significant dependent variable, adjusted for family-wise comparisons.
Since the aforementioned cortical metrics were calculated specifically for the NPT, we evaluated whether these results could be envisioned for other cognitive or visuospatial tests. We, therefore implemented a multiple linear regression for the three participant groups with neuropsychological tests as the clinical dependent variable; and age, EEG spectral power, and graph indices as independent variables. Significance for the regression ANOVA model was set to 0.05.
The EEG preprocessing and epoching was implemented with an open-source toolbox, Brainstorm (Tadel et al., 2011). The wPLI indices were calculated by using Hermes toolbox (Niso et al., 2013), and the resulting output was used as edge weights for network construction using Gretna toolbox (Wang et al., 2015). Statistical analysis was performed on JASP (JASP Team, 2020). All other offline analysis and graphing of data were done by using Matlab 2017b. Data analyzed in this study will be made available from the corresponding author on reasonable request.
Results
Demographic characteristics of participants are summarized in Table 1. In brief, PD patients susceptible to pareidolias (PDP) were older and under-performed on neuropsychological tests.
For EEG analysis of the prestimulus phase, a grand total of 780 trials for HC, 840 for PDnP, and 755 for PDP groups were analyzed. Due to eye-open condition, within the alpha frequency of 7–13 Hz, IAF peaks were not consistently present in all electrodes. Median IAF values for the three groups were HC = 10 Hz (9,10), PDnP = 10 Hz (9,10), and PDP = 9 Hz (8,10) (Supplementary Table S1). Spectral analysis of the full IAF range showed no significant differences between the groups (Global: F (2,28) = 1.42, p = 0.26; Local frontal F (2,28) = 2.50, p = 0.10; Local parietal F (2,28) = 0.92, p = 0.41). For theta, low-alpha (IAF −2 Hz), and high-alpha (IAF +2 Hz) bands, no significant differences were observed (Supplementary Table S2). However, low-alpha frequencies in the frontal area exhibited a trend toward higher spectral power for the PDP group (p = 0.07) (Fig. 2A and Table 2). Both global and local wPLI showed no significant differences between the groups.
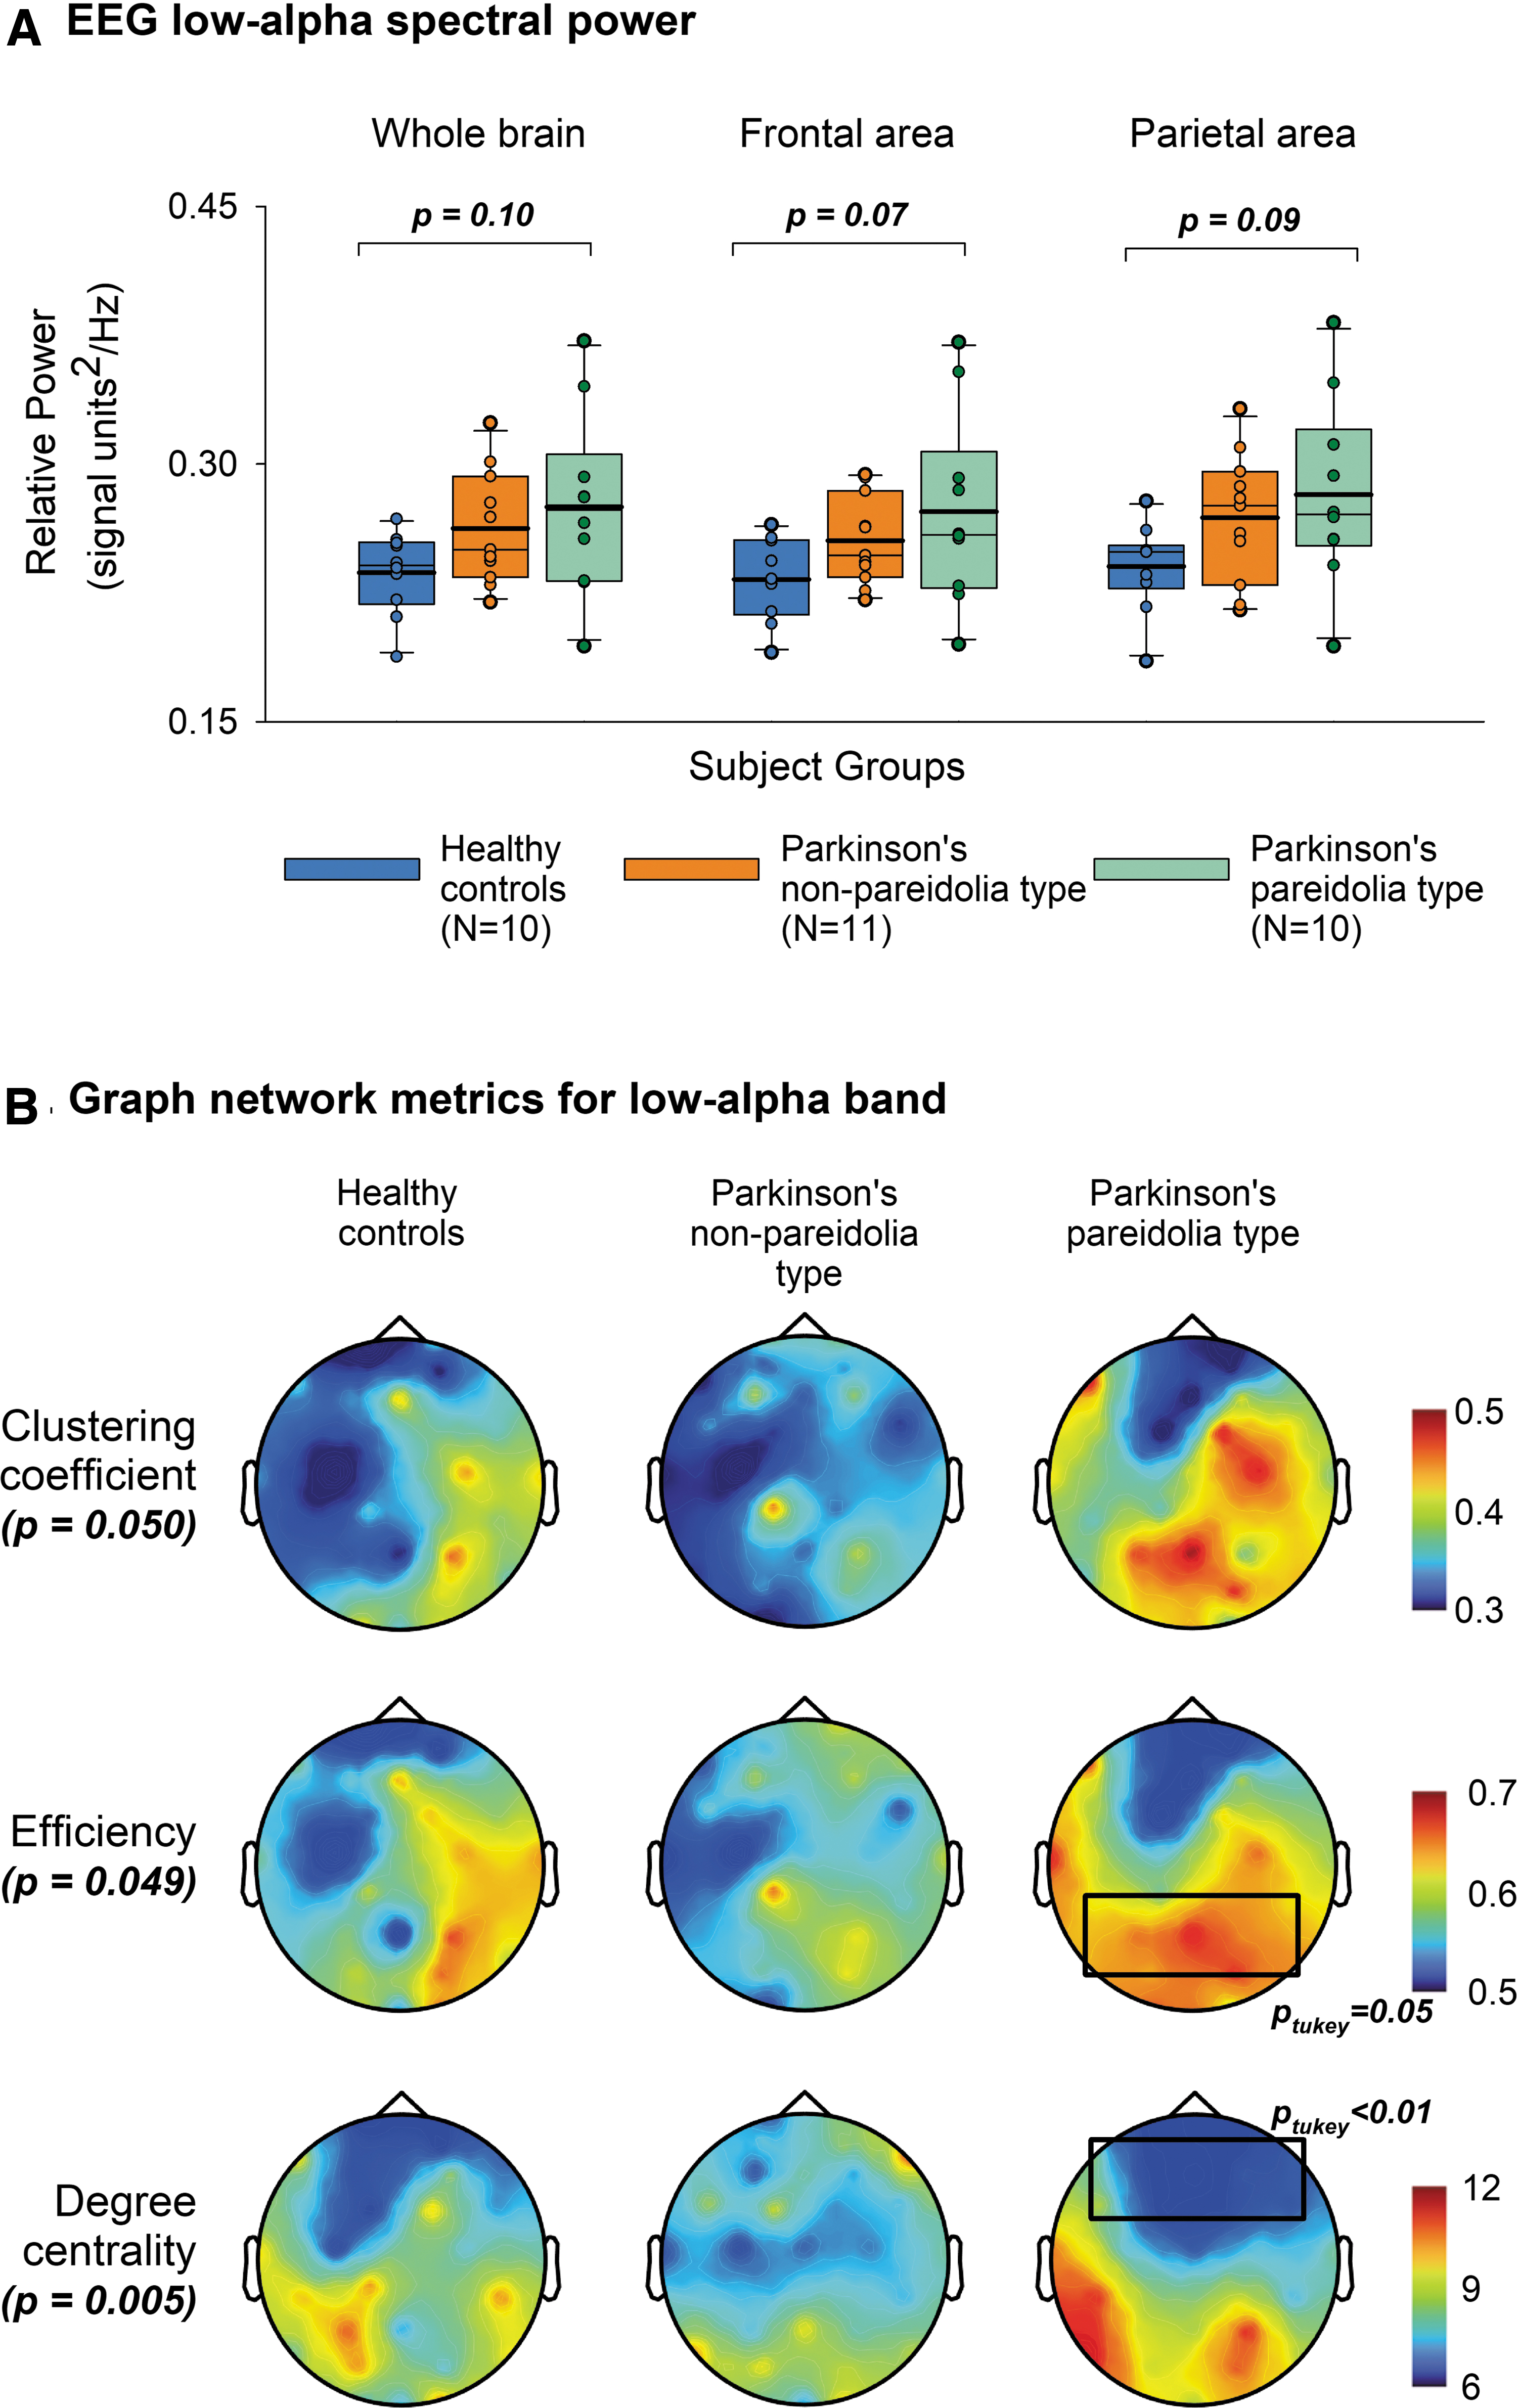
Spectral and topological structures of graph indices for low-alpha band.
Analysis of Variance on Spectral and Graph Network Measures for Low-Alpha Frequency Band
Significance of the bold values are given on the corresponding right-most columns and described in the results section.
For all significant comparisons, post hoc tests (Tukey) are shown in the right-most column.
IAF, individual alpha frequency in Hertz (Hz); wPLI, weighted phase lag index.
Calculating the shortest path lengths for a series of 10 sparsity thresholds ranging from 0.05 to 0.5, incrementing every 0.05, we fixed the threshold at 0.3 wherein the nodes were connected ∼99% of the time (Fig. 1, Sparsity threshold). Subsequent ANOVA analysis of the graph networks using age and MoCA scores as covariates revealed significant differences for a low-alpha frequency band (Table 2), with no changes within theta and high-alpha activity (Supplementary Table S2). In general, low-alpha band changes between HC and PDnP groups were inconsequential. However, the PDP group showed a statistically higher normalized clustering coefficient (PDPGamma = 1.04 ± 0.03 vs. PDnPGamma = 0.94 ± 0.03 or HCGamma = 0.93 ± 0.03, adjusted means ± error), with no significant differences in the normalized path lengths. Locally, parietal electrodes showed a higher nodal efficiency, which served to demonstrate the higher information exchange of the interconnected network in the parietal area during the prestimulus phase. Further, the PDP group showed significantly low-degree centrality in frontal electrodes, suggestive of a dispersed or disconnected network. Topological illustration of graph indices is shown in Figure 2B.
Multiple linear regression between clinical variables and spectral/network metrics is shown in Table 3. Results of regression analysis indicated that the spectral and graph indices were significantly correlated to pareidolia scores (R 2 = 0.35, p = 0.042) and weakly to FAB scores (R 2 = 0.30, p = 0.07). The regression coefficients for the independent variables are described in Supplementary Table S3.
Multiple Linear Regression of Low-Alpha Spectral and Graph Indices for Neuropsychological Tests
Significance of the italicized values are described in the results section.
Discussion
We investigated how large-scale network organization is altered before stimulus onset in PD patients susceptible to pareidolias. In patients who demonstrate pareidolic misperceptions, we found that: (1) the prestimulus low-alpha power tends to be higher in the frontal cortex, (2) there are notable changes in global and local network properties during anticipation of stimuli, and (3) the spectral and network indices are characteristic of pareidolic expression on the NPT.
Face detection on the NPT necessitates an active search-and-detect effort requiring configural face processing and a top–down integration of facial features (Revankar et al., 2020). Although these images serve as sensory-deprived ambiguous stimuli, a subset of PD patients consciously misperceive noisy patches as faces, likely due to abnormal perceptual biases (Watanabe et al., 2018). In our experiment during the prestimulus phase, this misrepresentation was observed as a near-significant increase in low-alpha spectral power in the frontal electrodes. In literature, alpha power codes stimulus identity (Klimesch, 2012). However, within the alpha band, the distinction between high- and low-alpha activity depends on when and how neural assemblies in the cortex activate—upper-alpha reflecting task-based processes, as opposed to low-alpha for nontask-based processes (Petsche et al., 1997). Upper-alpha is associated with working memory and semantic encoding (Klimesch et al., 2005), whereas lower-alpha mainly represents the guided attentional (directional or suppressive) responses that link visuo-perceptual processing (Collerton et al., 2005; Foxe and Snyder, 2011; Klimesch, 2012). Given that cortical low-alpha power represents the attentional dynamics within the cortico-cortical loops (Klimesch, 2012; Pfurtscheller and Lopes da Silva, 1999), our findings are suggestive of a diversion of attentional resources toward internal processing to code nonrelevant stimulus identity in patients susceptible to pareidolias.
The anticipation of relevant stimuli also increases alpha activity, its strength proportional to the saliency of the stimuli (Barne et al., 2020). As prestimulus low-alpha power increases, participants consciously perceive low-level information as relevant (Babiloni et al., 2006). However, this increase in prestimulus low-alpha power is seen globally, that is, in the frontal, parietal, and occipital electrodes when targets are actively perceived (Babiloni et al., 2006). Our results partially support this finding since we did not find any differences in the posterior parietal electrodes that have a critical role in prestimulus internally generated processes (Benedek et al., 2014). This discrepancy could be attributed to a diverse pathology seen in pareidolias, which are known to occur at different stages of PD involving both cortical (frontal or parieto-occipital cortex) and subcortical structures (upper brainstem or thalamus) (Nishio et al., 2017).
Pertaining to global network level deficits in PD, we explored small-world properties that are commonly affected in neuropsychiatric diseases (de Haan et al., 2009). Pareidolic misperceptions may reflect a precursor state of global cortical networks dysfunction, which could eventually lead to VH (Nishio et al., 2017; O'Brien et al., 2020; Yokoi et al., 2014). The increased normalized clustering coefficient reported in the PDP group suggests a heightened integration of information during the prestimulus phase. Visualization of the topology showed a delineation of clusters in the parietal cortex (Fig. 2). Further, these posterior nodes also revealed a high nodal efficiency when compared with HC or PDnP groups. As a proxy to small-worldness (Bullmore and Bassett, 2011), these indices demonstrate an efficient information transfer within the parietal network. Within the framework of low-alpha band frequency, our findings suggest a reduced disengagement of the posterior cortex during nonrelevant stimulus anticipation (Dijk et al., 2008). This cortical signature in the posterior electrodes reflecting focused intentional awareness (Benedek et al., 2014) is a persisting feature for ambiguous stimuli, since similar findings have also been observed in PD patients with hallucinations via bi-stable percept paradigms that demonstrate the altered communication between the default mode network (DMN) and the dorsal attentional network (DAN)(Piantoni et al., 2017; Shine et al., 2015).
The degree centrality is an index of how well the nodes are connected, whereas the betweenness centrality is a measure of the node connected to other independent node clusters (Liu et al., 2017). We observed that patients experiencing pareidolias had significantly lower degree centrality in the frontal electrodes, without any change in betweenness centrality. Intuitively, this signifies a higher number of discrete nodes, with low connections within the frontal cortex. According to scale-free distributions, in sparsely connected networks, these nodes represent a low linkage with an absence of hub characteristics (Barabási, 2009). Psychophysiologically, with a concomitant high frontal spectral power, this could imply the maintenance of cortical excitability within the network to process imminent visual stimuli irrespective of its saliency (Babiloni et al., 2006). The fallout of this process is a breakdown of communication between the DMN and DAN that modulates visuo-perceptual priors (Shine et al., 2015), disordered frontal attention networks that create an abnormal competition with weak stimuli (Collerton et al., 2005), or an increased dependence on top–down signals leading to the development of misperceptions (O'Callaghan et al., 2017).
We found that the spectral and graph indices were significantly correlated only to pareidolia scores in our participant groups. Our selection of neuropsychological tests was to examine the effect of altered networks in visuo-perception that overlaps with cognitive (MoCA, JART), executive (FAB), visuo-spatial, and visuo-construction function (JLO). The less than significant findings from JLO were notable since posterior parietal cortex lesions often show lower scores on JLO (Tranel et al., 2009). It is, therefore, likely that the high clustering coefficient and nodal efficiency we observed in the parietal electrodes could be an epiphenomenon observed due to the stimulus anticipation process. Since regression did not affect the outcome of other neuropsychological tests, the findings mentioned earlier signify a higher influence of the fronto-cortical network structure on the outcome of pareidolic misperception. Regardless of this, profiling disease pathology in neuropsychiatric disorders in terms of increased or decreased connectivity purely on the basis of the graph theory must be treated with caution due to overlaps in domain-specific tasks with different brain areas (Bullmore and Bassett, 2011).
Limitations
There are some limitations to this study. Within our cohort, it is important to note that only one patient had a positive history for VH. This patient, with presence-type of hallucinations, for the past 1 year, had a score of 52 pareidolias in the NPT. Since VH are difficult to evoke in a clinical setting with respect to their feature diversity, we believe that we may not have addressed VH directly, but rather only face-pareidolias as a proxy for VH. Moreover, here we did not report the crucial subjective experiences of patients (images that were responded to as animals, etc.) that may be relevant to the concept of illusionary/hallucinatory responses. Therefore, more data by increasing sample sizes are necessary to understand conclusively the effects of pareidolia and their overarching effects on VH.
Clinically, patient assessment using Movement Disorder Society—Unified Parkinson's disease rating scale (MDS-UPDRS) Part-1 sub-score has hallucination questionnaire (Part I-q2) clubbed with psychosis, making it slightly less specific for detailed nonmotor symptom assessment. A thorough measure such as the MDS nonmotor rating scale (MDS-NMS) is expected to be ideal for better interpretability (Martinez-Martin et al., 2015).
The scope of this article was mainly to demonstrate the cortical dynamics via EEG though other behavioral measures may be relevant. Eye-tracking metrics such as change in low-frequency pupillary power is suggested to be crucial during stimulus anticipation in patients experiencing pareidolias (Suzuki et al., 2017). The effect of negative mood is also known to affect the outcomes of the NPT (Watanabe et al., 2018). We also avoided sub-classifying the prestimulus responses into face, noise, pareidolias, and missed images due to the skewed nature of the NPT (fewer face stimuli than noise). Further, the saliency of Mooney face images within the NPT was not trivial (Supplementary Fig. S1), and considering the duration of the experiment, some level of temporal variability of the EEG was inevitable (Marathe et al., 2014).
The effect of levodopa (Armstrong, 2011) was not systematically studied except that the NPT was always performed during the “ON” state of medication. Apart from levodopa, a majority of the patients were on at least one or more additional antiparkinsonian medication to control their motor symptoms (Supplementary Table S4). In literature, some of these antiparkinsonian medications are infrequently related to symptoms of psychosis (Bunten and Happe, 2006; Ecker et al., 2009; Postma and Van Tilburg, 1975). Although the effects of drugs were not formally evaluated, none of the patients were on any medication that was specific to a group (PDnP or PDP) to have contributed particularly to the misperceptual phenomenon (Supplementary Fig. S2).
Statistically, the data distribution followed the Gaussian distribution, allowing us to control our analysis methodologies for age and cognitive levels. Although the addition of other covariates (e.g., JLO, FAB) increased the statistical significance of the tests (data not shown), we avoided their inclusion due to a paucity of prior literature on their effects on graph networks. Our mode of comparing normal and diseased networks of a similar size by fixing thresholds for binarized graphs is in line with prior literature, although weighted graphs could be an informative substitute to compare such conditions. Addressing these issues in the future would be beneficial not only for cross-sectional studies but also for studies that focus on the longitudinal evolution of pareidolia in the culmination of hallucinations/psychosis in PD.
Conclusions
Pareidolias in PD are a consequence of an abnormal top–down modulation of visual processing (Revankar et al., 2020); they are defined by frontal low-alpha spectral and network alterations in the prestimulus phase due to a dissonance between patients' internally generated mental processing and external stimuli. As a surrogate of VH, our result highlights the impact of pareidolias on the frontal cortex in susceptible PD populations. Further work is needed to ascertain the burden of cortico-subcortical structures in the pathogenesis and maintenance of such symptoms in PD.
Footnotes
Acknowledgments
The authors express their sincere gratitude to the patients who participated in this study, and to Mr. Toshiaki Fujimoto and the members of the Minoh Senri-Chuo Rotary Club, Japan for their undivided support. They also thank Dr. Mariko Ohara, Dr. Maki Suzuki, and Dr. Hiroyuki Watanabe for their advice during the development process.
Authors' Contributions
Conceptualization: G.S.R., Y.K., T.S., N.H., E.M., and H.M. Methodology: G.S.R., T.S., and Y.K. Software, Validation: G.S.R., Y.K., T.S., and T.N. Formal analysis, Data curation: G.S.R., N.H., T.N., and Y.K. Writing—original draft preparation: G.S.R. Writing—review and editing: Y.K., T.S., T.N., N.H., M.M., E.M., and H.M. Supervision, Funding acquisition: G.S.R. and H.M.
Author Disclosure Statement
No competing financial interests exist.
Funding Information
G.S.R. was supported by the Grants-in-Aid for Interdisciplinary Research, JSPS, Japan and KAKENHI Grant-in-Aid for Early-Career Scientists (Grant number 21K15680). H.M. was supported by Grants-in-Aid from the Research Committee of Central Nervous System Degenerative Diseases, Research on Policy Planning and Evaluation for Rare and Intractable Diseases, Health, Labor and Welfare Sciences Research Grants, the Ministry of Health, Labor and Welfare, Japan (Grant number KH39Q033a).
Supplementary Material
Supplementary Data
Supplementary Table S1
Supplementary Table S2
Supplementary Table S3
Supplementary Table S4
Supplementary Figure S1
Supplementary Figure S2
References
Supplementary Material
Please find the following supplemental material available below.
For Open Access articles published under a Creative Commons License, all supplemental material carries the same license as the article it is associated with.
For non-Open Access articles published, all supplemental material carries a non-exclusive license, and permission requests for re-use of supplemental material or any part of supplemental material shall be sent directly to the copyright owner as specified in the copyright notice associated with the article.