
Abstract
Background/Purpose:
To identify brain hubs that are behaviorally relevant for neglect after stroke as well as to characterize their functional architecture of communication.
Methods:
Twenty acute right hemisphere damaged patients underwent neuropsychological and resting-state functional magnetic resonance imaging sessions. Spatial neglect was assessed by means of the Center of Cancellation on the Bells Cancellation Test. For each patient, resting-state functional connectivity matrices were derived by adopting a brain parcellation scheme consisting of 153 nodes. For every node, we extracted its betweenness centrality (BC) defined as the portion of all shortest paths in the connectome involving such node. Then, neglect hubs were identified as those regions showing a high correlation between their BC and neglect scores.
Results:
A first set of neglect hubs was identified in multiple systems including dorsal attention and ventral attention, default mode, and frontoparietal executive–control networks within the damaged hemisphere as well as in the posterior and anterior cingulate cortex. Such cortical regions exhibited a loss of BC and increased (i.e., less efficient) weighted shortest path length (WSPL) related to severe neglect. Conversely, a second group of neglect hubs found in visual and motor networks, in the undamaged hemisphere, exhibited a pathological increase of BC and reduction of WSPL associated with severe neglect.
Conclusion:
The topological reorganization of the brain in neglect patients might reflect a maladaptive shift in processing spatial information from higher level associative-control systems to lower level visual and sensory–motor processing areas after a right hemisphere lesion.
Impact statement
In this study, by employing the theoretic graph measures of betweenness centrality, we identified a set of neglect hubs, that is a cohort of cortical hubs that are behaviorally relevant for neglect after right hemisphere stroke. Although regions in higher level associative-control systems decreased their centrality and efficacy in communication, lower level visual and sensory–motor processing areas exhibited a dysfunctional increase in centrality. These findings have clinical implications as neglect hubs may be targeted for noninvasive brain stimulation protocols to restore their centrality and in turn to ameliorate the spatial deficit.
Introduction
A
In fact, in the past two decades, a large body of studies showed that the brain is organized in large-scale resting-state networks (RSNs). These are defined by means of magnetic resonance imaging (MRI)-derived resting-state functional connectivity (FC), that is, the temporal coupling of blood-oxygenated-level-dependent signals between different brain regions in the absence of a task (Biswal et al., 1995; Fox and Raichle, 2007). Such RSNs exhibit coherent intrinsic activity and their topography recapitulates that of networks recruited during task performance (Gordon et al., 2016; Power et al., 2011b; Yeo et al., 2011). Crucially, this way of studying brain functions allows to assess the pathological effects of focal lesions on neural communication among distant cortical regions, a novel form of diaschisis recently defined as “connectomal” diaschisis (Carrera and Tononi, 2014).
Indeed, a growing number of reports indicate that stroke induces widespread changes in FC within and across RSNs that are correlated with the severity of behavioral impairments in several domains (Siegel et al., 2016a) such as motor (Baldassarre et al., 2016a; Bauer et al., 2014; Carter et al., 2010; Rehme et al., 2015; Wang et al., 2010), visuospatial attention (Baldassarre et al., 2014, 2016a; Carter et al., 2010; He et al., 2007), language (Baldassarre et al., 2019), and praxis (Watson et al., 2019) [for reviews see Baldassarre et al. (2016b); Varsou et al. (2014)]. Furthermore, longitudinal variations of FC have been associated with the degree of spontaneous recovery (Ramsey et al., 2016; van Meer et al., 2012) as well as the outcome of noninvasive brain stimulation treatments (Volz et al., 2016).
In this study, we adopted a network-wise perspective to investigate the topological reorganization of the brain associated with spatial neglect, which affects ∼20–30% of stroke patients (Buxbaum et al., 2004; Ringman et al., 2004). Spatial neglect is a heterogeneous syndrome. The core deficit of visuospatial neglect is the inability of patients to attend, process, and respond to stimuli presented in the portion of the space and body contralateral to the side of the lesion (more frequently in the right hemisphere), in absence of a primary sensory deficit (Corbetta and Shulman, 2011; Halligan et al., 1989; Heilman and Watson, 1977). Furthermore, neglect patients also exhibit deficits of sustained attention, arousal, and vigilance (Husain and Rorden, 2003).
Despite a large body of studies, the neural correlates of spatial neglect are still debated (Bartolomeo et al., 2012; Corbetta and Shulman, 2011; Husain and Rorden, 2003; Karnath and Rorden, 2012). Lesion-behavior reports have linked neglect to the damage of several brain structures including inferior frontal (Committeri et al., 2007; Corbetta et al., 2015; Husain and Kennard, 1996), insular (Corbetta et al., 2015; Karnath et al., 2009), temporoparietal (Committeri et al., 2007; Corbetta et al., 2015; Karnath et al., 2001, 2004), and inferior parietal (Mort et al., 2003; Vallar and Perani, 1987) cortex, basal ganglia (Corbetta et al., 2015; Karnath et al., 2005), thalamus (Corbetta et al., 2015), as well as underlying white matter (Corbetta et al., 2015; Doricchi and Tomaiuolo, 2003; Karnath et al., 2009; Thiebaut de Schotten et al., 2014).
However, several functional neuroimaging studies showed that the severity of spatial neglect is associated with the hypoperfusion of cortical areas (Hillis et al., 2005), interhemispheric imbalance of task-driven activity (Corbetta et al., 2005), and changes of resting-state FC (Carter et al., 2010; He et al., 2007) in regions structurally spared beyond the site of lesion (i.e., diaschisis effects). Indeed, in our previous study (Baldassarre et al., 2014), we showed that the severity of spatial neglect can be associated with a reduction of interhemispheric FC within intact dorsal attention network (DAN)/sensory–motor network as well as with a loss of segregation between these networks and the default mode network (DMN).
These findings suggest that stroke-associated damage to the brain involves several cortical networks whose FC architecture of integration is severely affected. In the healthy brain, such architecture is characterized by a balance between functional specialization and dynamic integration, which is ensured by the presence of cortical hubs, as reported by functional magnetic resonance imaging (fMRI) (Power et al., 2013) but also magnetoencephalography (MEG) (de Pasquale et al., 2010, 2012, 2016), electroencephalography (Kabbara et al., 2017), and modeling studies (Cocchi et al., 2017). These nodes act as waystations of communication among distinct functional networks and can be defined within the graph theory framework. Although widespread neglect-relevant changes of FC across multiple RSNs have been described, it is unknown whether there are critical brain regions behaving as hubs whose functional topology is central for the pathophysiology of neglect.
The overall goal of the study was to investigate the pattern of topological changes associated with spatial neglect, not only by identifying the involved cortical hubs but also by characterizing their functional architecture of communication. To this aim, we assessed spatial neglect with highly diagnostic Bells Cancellation Test (Ferber and Karnath, 2001) and we measured resting-state FC MRI in a cohort of acute right hemisphere damaged patients. Neglect-relevant hubs were identified by means of the betweenness centrality (BC), defined as the number of times a node participates in a shortest path [i.e., the node acts as a bridge between the strongest connections of any two nodes (Rubinov and Sporns, 2010)].
Although the modulation of functional architecture has been studied to characterize brain network dysfunctions in several clinical populations (Aerts et al., 2016; Khazaee et al., 2015; Zhou et al., 2014), little is known about the changes of the topology of RSN integration associated with spatial neglect after stroke. Therefore, in this study, we aimed at identifying BC-based hubs that are behaviorally relevant for this pathology. Next, we investigated the behavioral relevance of topographic changes of the functional interactions among neglect hubs and multiple RSNs. Specifically, we assessed the relationship between the severity of the rightward deficit and the efficacy of communication of neglect hubs characterized through their shortest paths to the rest of the brain.
To these aims we recruited a cohort of right hemisphere damaged patients at acute stage (∼2 weeks after stroke onset) to study changes in brain network topology associated with visual neglect before any significant functional reorganization and behavioral recovery. Since neglect might affect different functions, for example, spatial/nonspatial attention, motor/exploratory, and executive/control, we expected to detect behaviorally relevant neglect hubs as well as changes in brain topology involving several RSNs.
Materials and Methods
Stroke patients
A cohort of 20 right hemisphere damaged patients (mean age 65.1 years, SD = 12.3 years) was enrolled within 2 weeks since first-time stroke onset from February 2017 to December 2018. The inclusion criteria were as follows: (1) clinical diagnosis of right hemisphere stroke (ischemic or hemorrhagic) at hospital discharge; (2) persistent stroke symptom(s) at hospital discharge; (3) awake, alert, and able to complete study tasks; and (4) age >18 years. Exclusion criteria are (1) severe psychiatric or neurological disorders/conditions, (2) claustrophobia; and (3) body metal not allowing 3T MRI. Table 1 displays the demographic and clinical information of the stroke patients.
Demographic and Clinical Characteristics of the Stroke Patients
AG, angular gyrus; BS, brainstem; C, cortical; Cau, caudate; CBL, cerebellar; CorRad, corona radiata; ExtCap, external capsule; F, female; FFG, fusiform gyrus; H, hemorrhagic; I, ischemic; IFG, inferior frontal gyrus; Ins, insula; IntCap, internal capsule; LG, lingual gyrus; LOG, lateral occipital gyrus; M, male; MFG, middle frontal gyrus; Pal, pallidum; PHG, parahippocampal gyrus; PrCG, precentral gyrus; PreCun, precuneus; Put, putamen; SC, subcortical; SD, standard deviation; SLF, superior longitudinal fasciculus; SPL, superior parietal lobule; STG, superior temporal gyrus; Tha, thalamus; Y, year.
Neuropsychological assessment
The severity of visual neglect was assessed by means of the Bells Cancellation Test (Rorden and Karnath, 2010), in which patients were asked to mark with a pen the targets displayed with distracters in a pseudo-random array presented on paper. The rightward visual bias was quantified by means of the Center of Cancellation (CoC), which is the lateralized center of mass of hits (Binder et al., 1992; Rorden and Karnath, 2010). This was computed using the software provided by Rorden and Karnath, for contralesional versus ipsilesional hits (Rorden and Karnath, 2010) on the scores at the Bells Cancellation Test. Patients were classified as having neglect if their CoC score was above the cutoff equal to 0.081(Rorden and Karnath, 2010).
We assessed also general cognitive efficiency, executive functions, constructional abilities, and verbal memory by means of mini mental state examination (Folstein et al., 1975), letter fluency test (Benton, 1968), copying geometrical figures test and Rey 15-item memory test (Carlesimo et al., 1996), respectively (Supplementary Table S1). It must be considered that for each domain, the cohort is different as some patients did not carry out the tests for several reasons such as fatigue or lack of collaboration, thus the results are reported at a descriptive level.
fMRI procedure
MRI scanning was performed with GE Signa HDxt 3T at NEUROMED within 24 h of the neuropsychological assessment. Structural scans consisted of (1) an axial T1-weighted 3D SPGR (TR = 1644 ms, TE = 2.856 ms, flip angle = 13°, voxel size = 1.0 × 1.0 × 1.0 mm) and (2) an axial T2-weighted turbo spin-echo (TR = 2.856 ms, TE = 127.712 ms, slice thickness 3 mm, matrix size: 512 × 512). Resting-state functional scans were acquired with a gradient echo-planar imaging sequence with repetition time (TR) = 1714 ms, echo time (TE) = 30 ms, 34 contiguous 3.6 mm slices, during which participants were instructed to keep eyes open in a low luminance environment. Three resting-state fMRI runs, each including 260 volumes, were acquired. Each run lasted 7.5 min.
fMRI data preprocessing
fMRI data were preprocessed as described in several previous studies (Baldassarre et al., 2014; Shulman et al., 2010). Furthermore, in preparation for the FC analysis, data were passed through several additional preprocessing steps (Fox et al., 2009): (1) isotropic spatial smoothing 6 mm full width at half maximum Gaussian blur in each direction, (2) temporal filtering retaining frequencies <0.1 Hz, and (3) removal of the following sources of spurious variance through linear regression: (i) head motion (modeled through a six-parameter affine transformation), (ii) global brain signal (estimated as the average signal from fixed region in atlas space), (iii) signal from a ventricular region of interest (ROI), and (iv) signal from a region centered in the white matter.
Quality control of resting-state fMRI data
Before FC mapping, motion-contaminated frames were identified through the root mean square change of the temporally differentiated fMRI signals averaged over the brain (Power et al., 2011a). This criterion for high motion frames was set at 0.2 root mean square functional MRI signal change in percentage units. This frame-censoring criterion was uniformly applied to all resting-state fMRI data. Furthermore, since the delay in the hemodynamic response can affect FC measurements in stroke populations (Siegel et al., 2016b), we estimated the lag scores in each patient for each node. We applied to the current data set a procedure for computing lag score, which is fully described in detail in a previous study (Siegel et al., 2016b). Finally, for each patient, we excluded a posteriori nodes exhibiting a lag larger than 2 s, as a longer delay in hemodynamic response monotonically affects the magnitude of resting-state FC (Siegel et al., 2016b).
Lesion segmentation
The lesions were manually segmented using MRIcron software by inspecting T1-weighted and T2-weighted images simultaneously displayed in the atlas space. All segmentations were reviewed by a trained radiologist (G.G.). Figure 1A shows the lesion topography of the cohort of right hemisphere damaged patients.
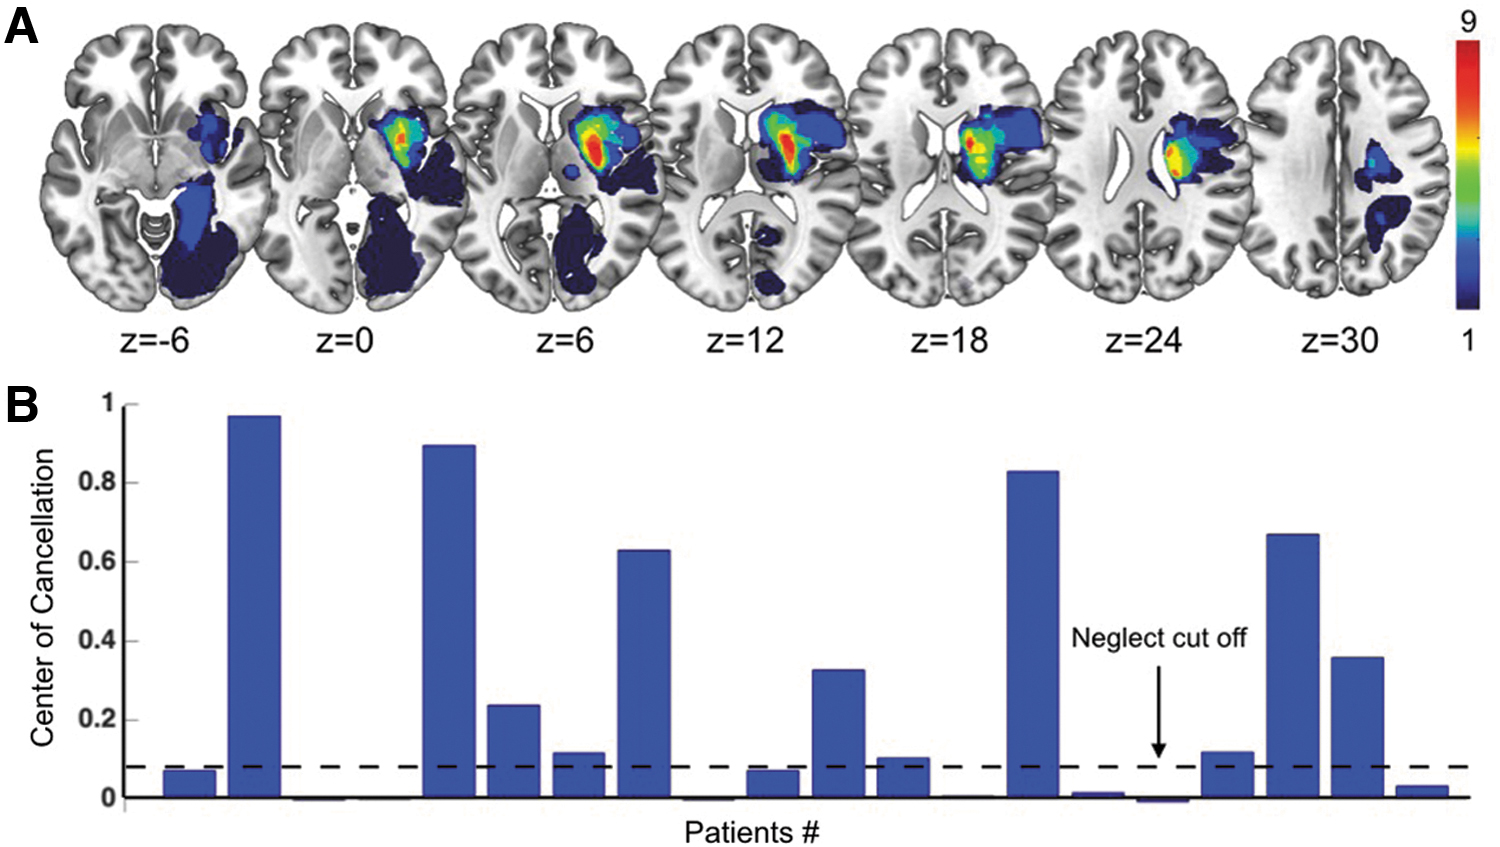
Lesion topography and behavioral results.
Resting-state networks
In this study, we employed a set of 153 ROIs, called “nodes,” belonging to 9 RSNs derived in an independent cohort of 21 young healthy subjects (14 female, mean age 24.6 years, 23–35 years) described in our previous study (Hacker et al., 2013). The considered RSNs included visual network (VN), dorsal (DAN), and ventral attention network (VAN), auditory network (AN), cingulo-opercular network (CON), language network (LN), frontoparietal network (FPN), and defaul mode network (DMN) (Fig. 2A).
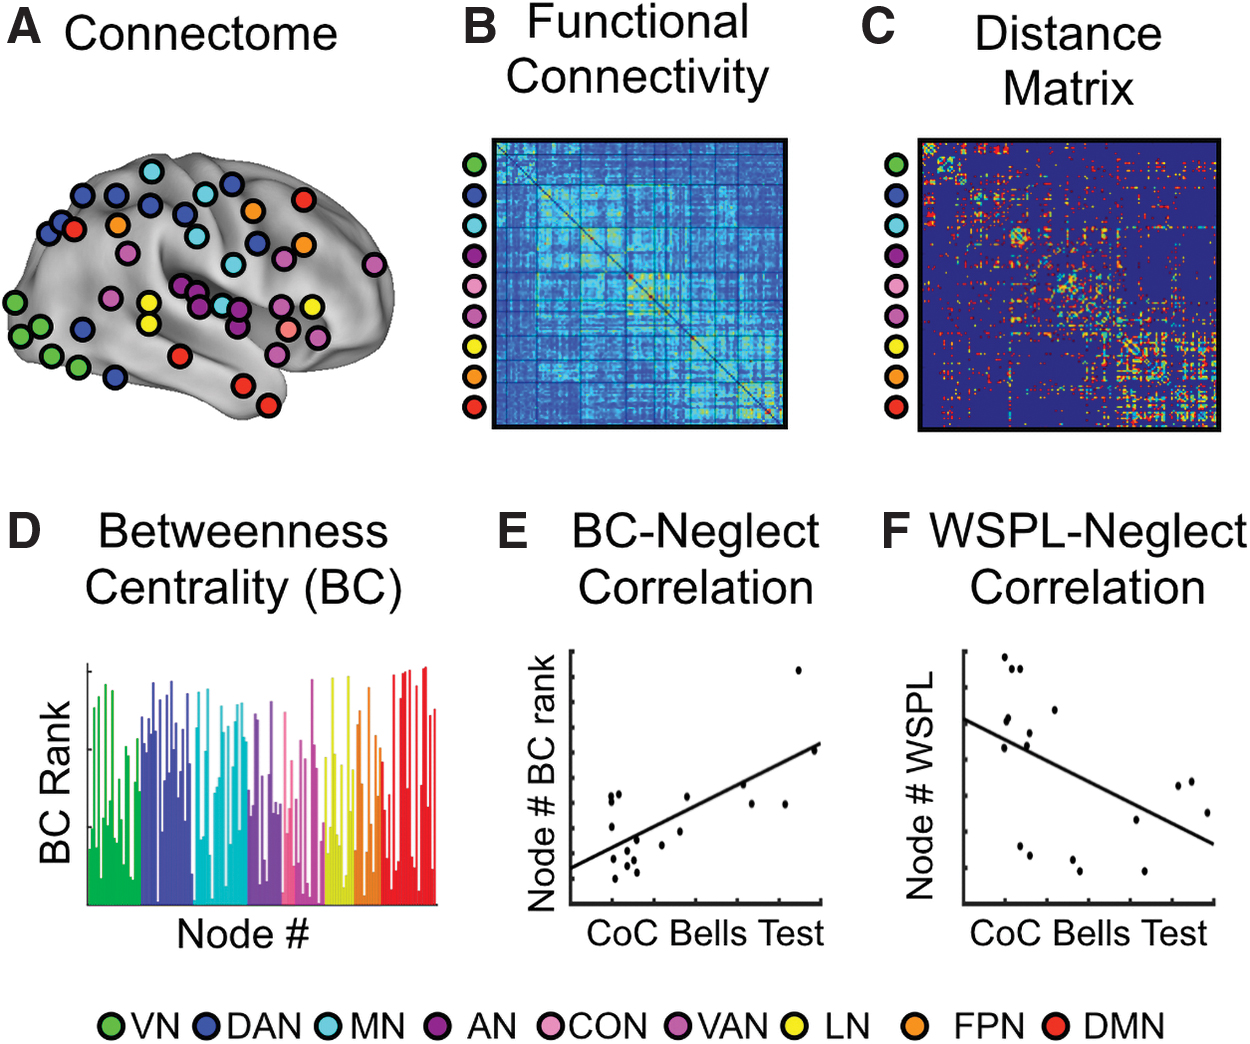
Analysis steps for identifying neglect hubs. Analysis pipeline for computing the BC and WSPL values and correlating them with CoC scores (i.e., neglect measure) across patients.
Identification of hubs associated with the severity of neglect
To identify cortical hubs behaviorally relevant for neglect after stroke, we employed a multistep procedure (Fig. 2), in which graph measures were obtained through the Brain Connectivity Toolbox (
In fact, to obtain robust results with respect to the choice of the threshold, we specifically considered three different density thresholds (D), namely 15%, 20%, and 25% [see Bordier et al. (2017) on suggested density]. In other words, we cut the original FC matrices by adopting as a threshold the highest zs leading to the desired density value. All z values larger than the threshold were kept in, by contrast the z values lower than the threshold were set as equal to 0. Finally, all the elements along the diagonal of the matrix (i.e., self-connections) were also set as equal to 0. In this way, we obtained three weighted FC matrices for each patient. Third, for each D, weighted connection-length matrices were defined as the inverse of FC matrices (distance matrix shown in Fig. 2C), so that higher zs corresponded to shorter lengths and vice versa.
Fourth, for each node and D value, based on the connection-length matrices, we computed the BC, defined as the portion of shortest paths involving that node (Rubinov and Sporns, 2010). BC is sensitive to detecting hubs and it often covaries with other measures of nodal centrality (Zuo et al., 2012). Furthermore, BC is poorly sensitive to the eventual inflation induced by the community size, that is, the number of nodes composing a functional network. Then, nodes were ranked based on their BC values (Fig. 2D). Finally, for each node and D, we computed, across patients, the Spearman's rank correlation between the score of CoC and its BC rank, obtaining a BC-CoC value (Fig. 2E). Nodes corresponding to a statistically significant correlation will be denoted in what follows “neglect hubs.”
Nodes falling within the damaged territory and/or exhibiting hemodynamic delay (lag) >2 sec were excluded a posteriori from the subsequent analyses.
Spatial neglect and functional architecture of hubs
Once we identified neglect hubs, we investigated the underlying architecture leading to their modulations of centrality. To this aim, for every hub, we extracted the set of weighted shortest paths of its connections with the rest of the brain. Since the shortest path represents the most efficient way of connecting two nodes, this set denotes the most efficient architecture connecting the considered hub to the rest of the brain. In fact, higher values of the length of the weighted shortest path length (WSPL) indicate longer and less efficient minimum travel time between two nodes.
By contrast, lower score of WSPL denotes shorter and more efficient trail linking two given regions. Thus, to investigate topological changes associated with neglect, for every connection of a neglect hub, we correlated the estimated WSPL with the CoC. This led to a set of WSPL-CoC scores indicating a relationship between neglect severity and the efficiency of the considered connection. Accordingly, positive WSPL-CoC correlations will suggest that higher (lower) neglect will correspond to longer (shorter) and thus less efficient shortest paths. In contrast, negative WSPL-CoC correlations indicate an inverse linear relationship, that is, shorter minimum walks, that is, more efficient, corresponding to higher neglect. Consistently with the previous analyses, these steps were performed at the three density values D already introduced.
Statistical analyses
To assess the statistical significance of both BC-CoC and WSPL-CoC correlations, we applied a permutation test. Specifically, from each original BC and WSPL array, we generated a sample of 1000 random permutations based on which we computed BC and WSPL-CoC correlation. In this way, we obtained the reference null distribution against with we tested the original values of the correlation between BC and CoC as well as between WSPL and CoC. Specifically, the corrleation values exceeding the 95% percentile (p < 0.05) of the null distribution were considered as statistically significant. Nodes whose BC (and WSPL) resulted statistically significant at all three density thresholds D were classified as neglect hubs (neglect-shortest path length).
Standard Protocol Approvals and Patient Consents
The institutional review board (IRB) of IRCCS NEUROMED approved the study, which has been carried out in accordance with Declaration of Helsinki. All participants provided signed informed consent.
Results
Behavior
The rightward visual bias of visual neglect was quantified by means of CoC, that is the lateralized center of mass of hits (Binder et al., 1992; Rorden and Karnath, 2010), on the scores at the Bells Cancellation Test (Vallar et al., 1994). Based on the cutoff of 0.081 (Rorden and Karnath, 2010), 11 out of 20 (55%) patients showed signs of neglect (Fig. 1B for individual scores), an incidence comparable with previous studies (Buxbaum et al., 2004). Furthermore, we carried out a general neuropsychological assessment, as described in Material and Methods section, but the size of cohort of patients varies across the behavioral domains. Among the neglect subgroup (n = 11), some patients exhibited also deficits in general cognitive efficiency (60%), executive functions (57%), praxis abilities (37%), and verbal memory (66%). Whereas at descriptive level, these results indicate that spatial neglect might co-occur with other behavioral impairments, consistent with previous studies (Corbetta et al., 2015).
Lesion topography
The distribution of lesions indicated that most strokes involved the middle cerebral artery territory, with the most common region of damage in thalamus and putamen (Fig. 1A). Furthermore, we computed the lesion density map for neglect and non-neglect groups (Supplementary Fig. S1). The lesion map of neglect group showed the hotspots in the putamen and caudate (8 out 11 patients). In contrast, the non-neglect group exhibits a more heterogeneous lesion distribution with a maximum overlap of two out of nine patients in the parahippocampal and lingual gyri. These findings suggest that, at qualitative level and without taking into account the scores variability, visual neglect is associated with a damage to the putamen and caudate, in line with previous reports (Baldassarre et al., 2014; Corbetta et al., 2015; Karnath et al., 2005; Ringman et al., 2004).
Furthermore, although nodes falling within lesions were excluded, we compared the lesion size between neglect (mean = 9.98 cm3; SD = 9.23 cm3; n = 11) and non-neglect (mean = 8.95 cm3; SD = 16.51 cm3; n = 9) subgroups, to control for potential effects of lesion extent on connectivity–behavior analysis. The two-sample t-test revealed that two cohorts did not differ in terms of lesion extent (t-test (18) = 0.1762, SD = 12.98; p = 0.862), suggesting that the amount of structural damage does not account for the association between BC and CoC.
Neglect hubs in multiple RSNs
As described in the previous section, neglect hubs were identified through the Spearman rank correlation between the hub BC rank, defined at three density thresholds (D = 0.15; 0.20; 0.25), and CoC (see Materials and Methods section). This led to the identification of two sets of cortical nodes, belonging to multiple resting networks, whose BC was either negatively or positively correlated with the degree of neglect, that is, severe neglect was associated with lower or higher BC (Fig. 3A). The first cohort of neglect hubs included right dorsolateral prefrontal cortex (RdlPFC), posterior cingulate cortex (PCC), and anterior cingulate cortex (ACC) as well as right postcentral gyrus (RPCG), belonging to frontoparietal executive–control network, DMN, VAN, and DAN, respectively. These hubs showed a positive correlation between BC rank and CoC, that is, patients with a strong rightward bias, as indexed by high CoC score, exhibited a loss of BC in these regions distributed in high-order brain networks (Fig. 3B displays a representative scatterplot of the correlation between CoC scores and BC in the right dorsolateral prefrontal cortex at D = 0.25).
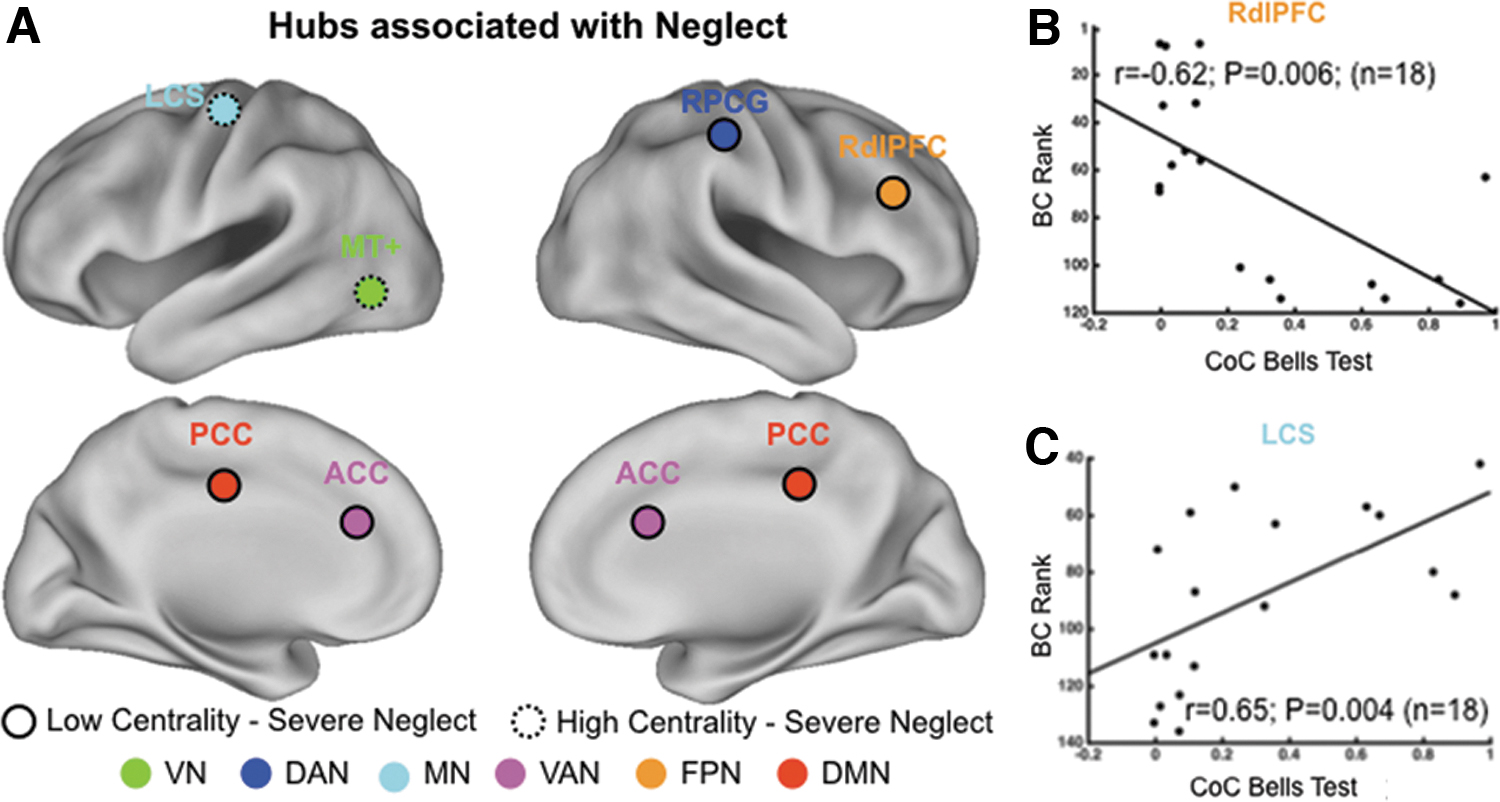
Neglect hubs in multiple RSNs.
By contrast, a second group of neglect hubs in the left contralesional hemisphere showed opposite pattern (Fig. 3 dotted circles): the BC of middle temporal complex (MT+; VN) and left central sulcus (LCS; motor network [MN]) positively correlated with CoC scores. Thus, these nodes showed higher centrality in patients with severe deficit (Fig. 3C displays a representative scatterplot of the correlation between CoC scores and BC in LCS at D = 0.25).
Brain topological changes associated with spatial neglect
Next, we investigated the changes of brain network topology associated with the severity of spatial neglect. To this aim, we correlated the measure of the rightward bias, that is, CoC scores, with the WSPL computed between each neglect hub and the rest of the connectome (see Materials and Methods section). In other words, we identified brain regions whose efficiency of minimum walks to reach a given neglect hub was associated with the degree of spatial neglect. Accordingly, a positive (negative) WSPL-CoC correlation will denote that severe patients exhibit a pathological loss (increase) in communication and information exchange between a neglect hub and a given brain region. Overall, the correlational analyses revealed that neglect hubs RdlPFC, PCC, RPCG, and ACC, showing a reduction of BC, exhibited a positive association between CoC scores and WSPL, that is, severe neglect related to longer and less efficient minimum walks.
Conversely, hubs with a pathological increase of BC, specifically left middle temporal complex (LMT+) and LCS, showed an opposite pattern, that is, marked neglect associated with reduction of WSPL. Figure 4 displays the circular plots where arches connect a given neglect hub with the brain regions, hereafter called “target nodes,” whose WSPL was positively (Fig. 4A–D) or negatively (Fig. 4E, F) correlated with the measure of spatial neglect, that is, neglect-relevant WSPL (p < 0.05 after permutation tests at all three D thresholds; see Table 2 for the list of all target nodes). Hereunder we describe the patterns of neglect-relevant WSPL for each of the six neglect hubs (1–4 positive, 5–6 negative).
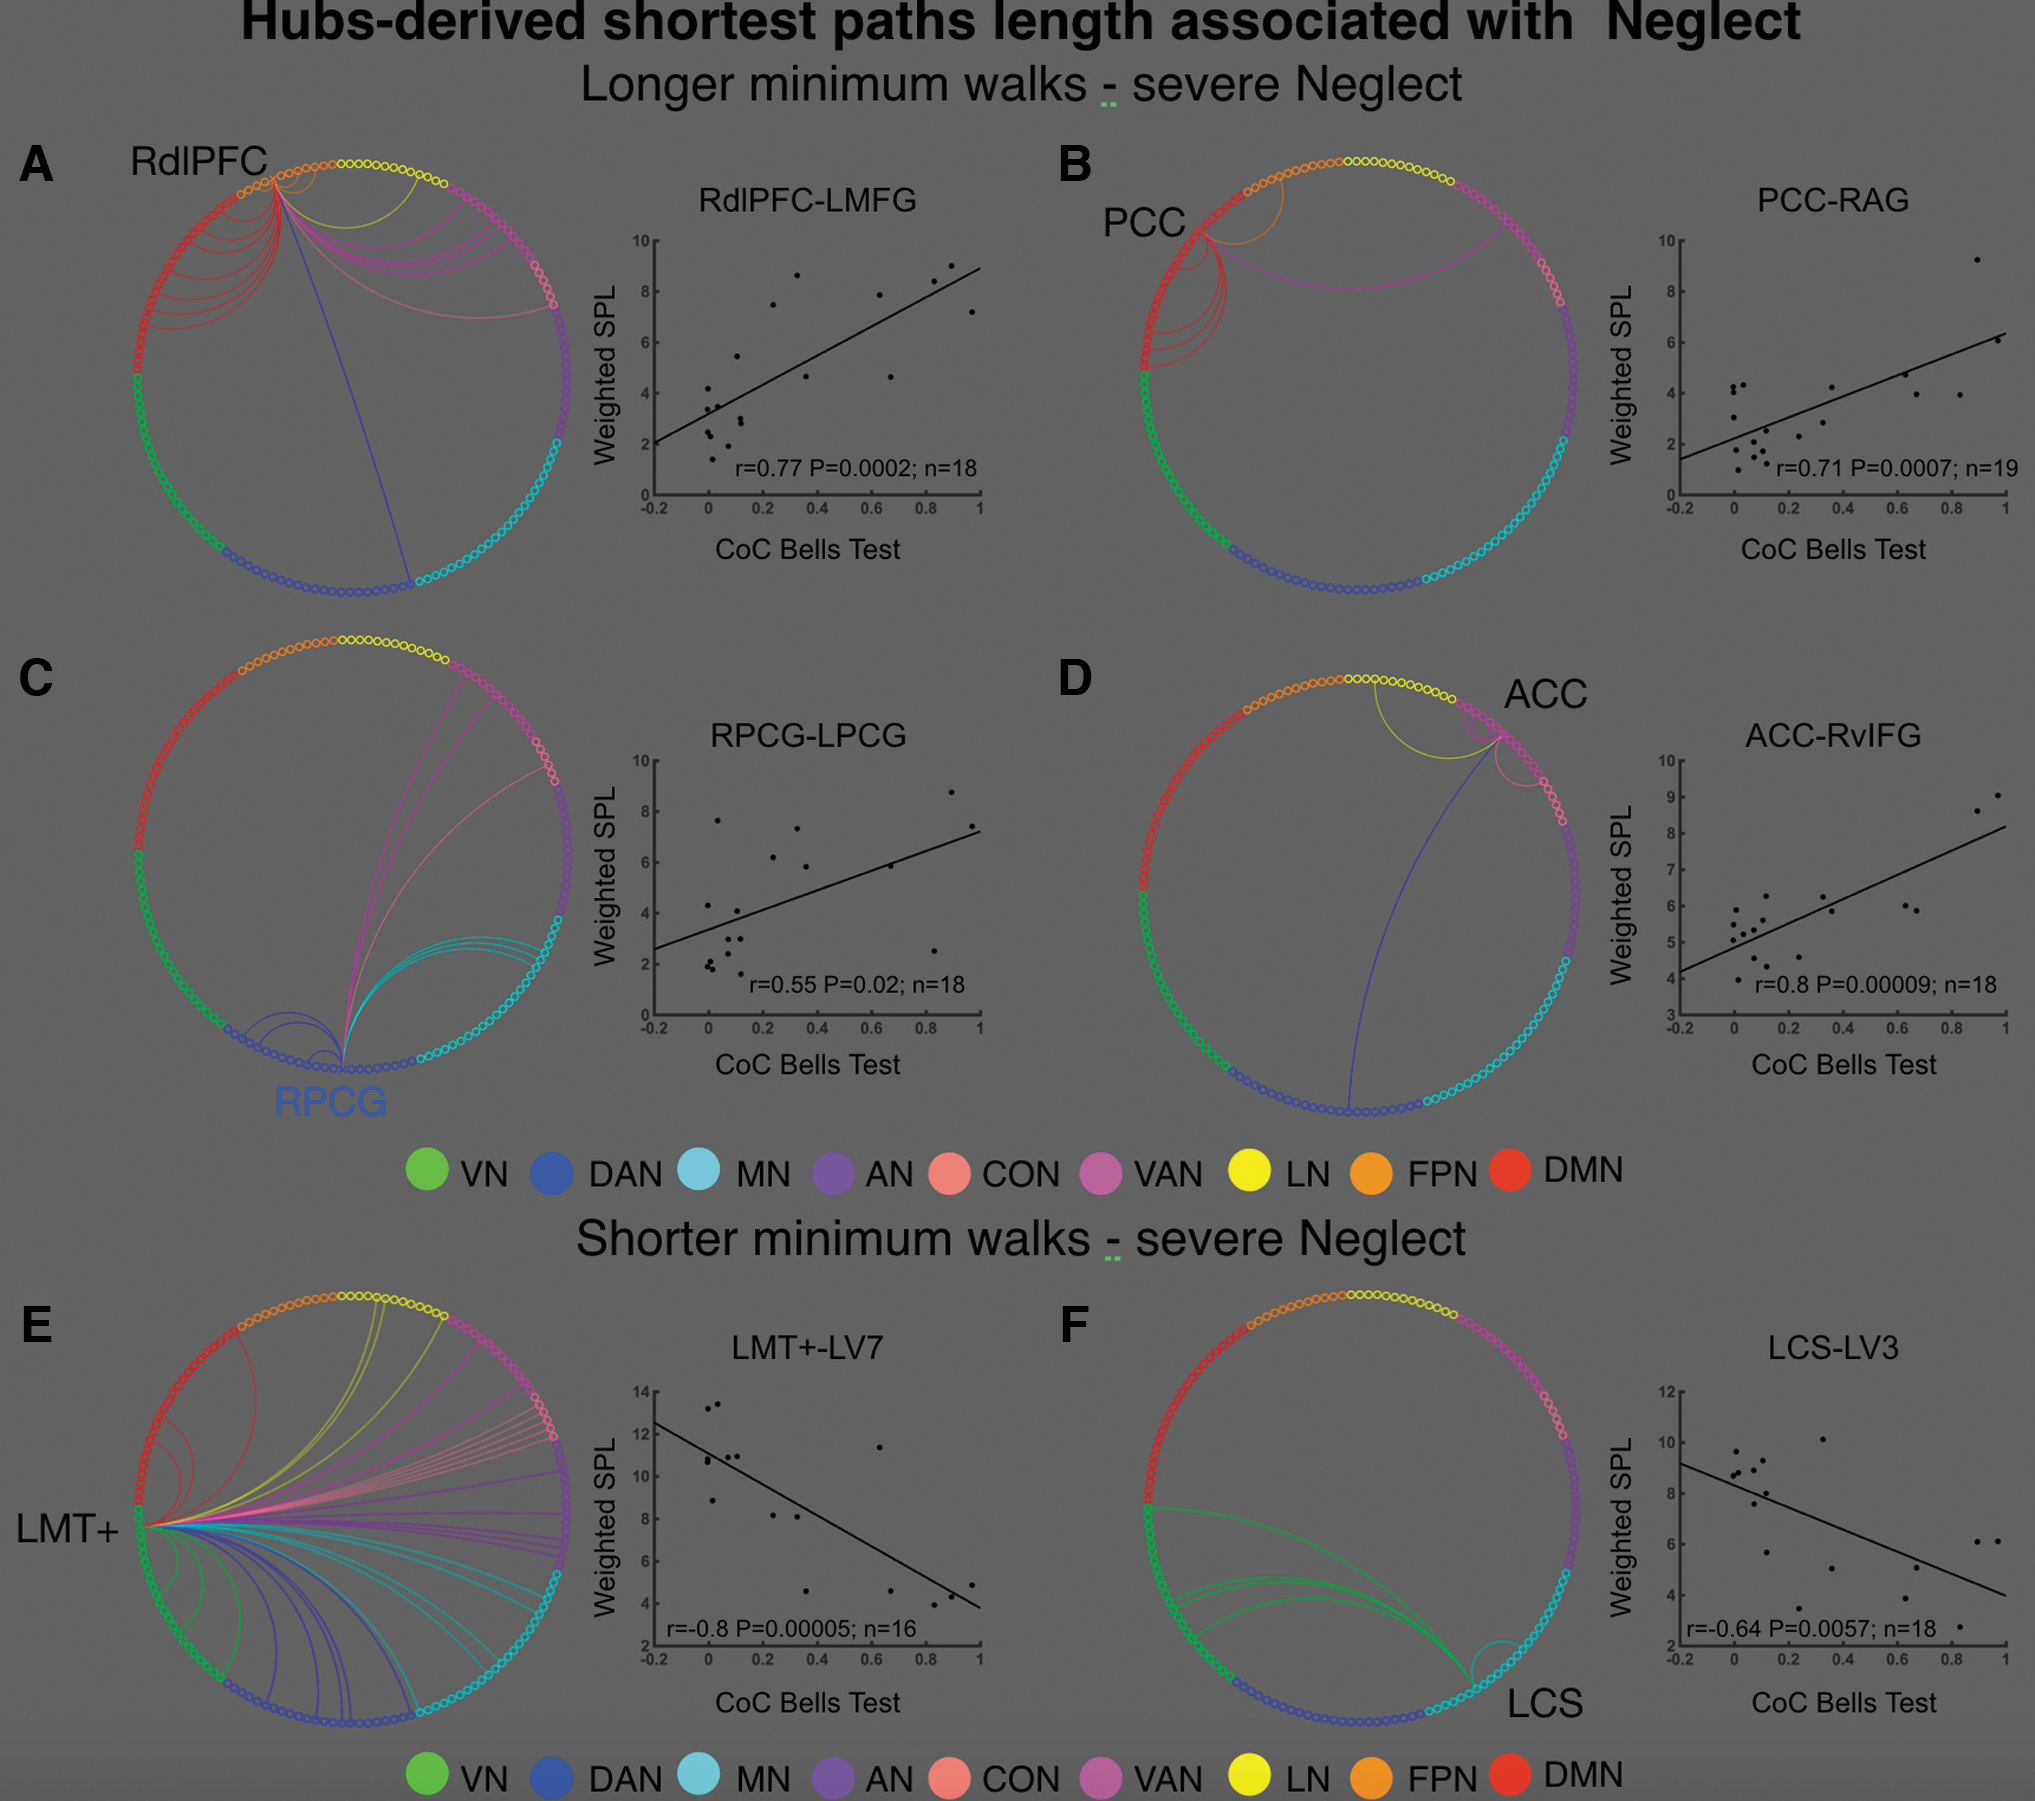
Neglect-relevant shortest path lengths. Each panel displays a circular plot in which the arches connect a given neglect with “target” nodes whose shortest path length (WSPL) was positively
For Each of the Six Neglect Hubs, The Table Lists the “Target Nodes,” which are the Regions Whose Shortest Path Length was Positively (or Negatively) Correlated with the Severity of Neglect
AI, anterior insula; AN, auditory network; aPFC, anterior prefrontal cortex; ATh, anterior thalamus; CBL, cerebellum; CON, cingulo-opercular network; CS, central sulcus; dACCmsFC, dorsal anterior cingulated cortex, middle superior frontal cortex; DAN, dorsal attention network; DMN, default mode network; dPoCG, dorsal postcentral gyrus; FPN, frontoparietal network; Hip, hippocampus; LCS, left central sulcus; LN, language network; LO, lateral occipital; mdSPL, middle dorsal superior parietal lobule; MN, motor network; pIPS-SPL, posterior intraparietal sulcus-superior parietal lobule; POSv, ventral parietal occipital sulcus; PreCun, precuneus; RPCG, right postcentral gyrus; RSN, resting-state network; SMA, supplementary motor area; STG, superior temporal gyrus; VAN, ventral attention network; vIFG, ventral inferior frontal gyrus; vIPS, ventral intraparietal sulcus; VN, visual network; vPCG, ventral postcentral gyrus.
Right dorsolateral prefrontal cortex
RdlPFC exhibited neglect-relevant WSPL with 18 cortical regions belonging to FPN, DMN, and VAN as well as one node of DAN, CON, and LN (Fig. 4A). These target nodes were located in both ipsilesional (7/18) and contralesional (7/18) hemispheres as well as along the midline of the brain (4/18), therefore, the neglect-relevant minimum walks were both intra- and interhemispheric.
Posterior cingulate cortex
PCC displayed neglect-relevant WSPL with six regions of DMN (4/6), FPN (1/6), and VAN (1/6) (Fig. 4B). This pattern mostly involved right intrahemispheric minimum walks as five out of six of these nodes were located within the damaged hemisphere.
Right postcentral gyrus
Neglect-relevant WSPL passing through RPCG included nine regions belonging to DAN (3/9), MN (3/9), VAN (2/9), and CON (1/9) (Fig. 4C). Approximately half (4/9) of such target nodes were located in the left contralesional hemisphere (i.e., interhemispheric minimum walks), one was in the right ipsilesional hemisphere (i.e., intrahemispheric minimum walk) and the remaining areas (4/9) were located in the midline of the brain.
Anterior cingulate cortex
ACC was mainly associated with VAN regions (5/7) as well as one area of DAN, CON, and LN (Fig. 4D). Such areas were mostly (6/7) restricted to the right ipsilesional hemisphere (i.e., intrahemispheric minimum walks), whereas one region was in the midline of the brain.
Left middle temporal complex
LMT+ showed a widespread set of neglect-relevant WSPL involving a large cohort of target nodes (n = 32) in multiple RSNs such as VN (4), DAN (5), MN (5), AN (5), CON (5), VAN (2), LN (3), and DMN (3) (Fig. 4E). These regions were in both left contralesional (17/32; i.e., intrahemispheric minimum walks) and ipsilesional (13/32; i.e., interhemispheric minimum walks) hemispheres as well as two nodes in the midline of the brain.
Left central sulcus
LCS was associated with a group of the left cerebellum (MN) as well as four target nodes in the VN (two left/two right hemisphere; Fig. 4F).
To summarize, the WSPL-CoC correlational analyses revealed that severe neglect is associated with longer and less efficient minimum walks passing through hubs belonging to associative networks. By contrast, hubs in sensory and motor systems are characterized by pathological shorter and more efficient minimum walks.
Discussion
In this study, we employed the resting-state FC within the graph theory framework to investigate the functional topology of brain networks' integration associated with visuospatial neglect in a cohort of acute right hemisphere stroke patients.
In particular, we identified two sets of hubs relevant to neglect and we characterized their architecture of connections. A first set of “neglect hubs” belonged to higher order associative systems such as frontoparietal executive–control network, DMN, DAN, and VAN. Such cortical regions exhibited a loss of centrality and increased (i.e., less efficient) shortest paths length (WSPL) associated with severe neglect. By contrast, an opposite pattern was observed in a second cohort of neglect hubs in lower level sensory-processing systems such as VN and MN showing a pathological increase of BC and reduction of WSPL related to larger degree of neglect.
Individually, such behaviorally relevant changes in centrality and the related modulation of shortest path length involved multiple RSNs. This might reflect different, yet co-occurring, components of neglect including spatial and nonspatial attention as well as motor/exploratory and executive/control, which are captured by Bells test and its CoC index. Together, these findings suggest a broad large-scale change in the brain functional architecture such that areas of higher level associative systems, for example, dorsolateral prefrontal cortex and PCC, which are topologically central in the healthy brain (van den Heuvel and Sporns, 2011; Zamora-López et al., 2010), become more peripheral and less efficient. Conversely, peripheral regions such visual MT+ increase their centrality and thus their communication. Noteworthy, the set of neglect hubs, as well as their behaviorally relevant changes in network topology, was observed in undamaged cortical areas distant from the lesion site, therefore, such patterns represent a clear example of connectomal diaschisis (Carrera and Tononi, 2014), through what has been defined a secondary hodological mechanism (Catani and ffytche, 2005).
In this study, we first discuss the neglect components that plausibly are most associated with the topography of the observed neglect hubs. Then, we discuss the observed changes in the network architecture in terms of global reorganization of the brain integration.
The first group of neglect hubs (i.e., decreased BC—severe neglect) included RPCG, a region of the DAN involved in the control of the visuospatial attention (Corbetta and Shulman, 2002). This region showed also a neglect-relevant increase of WSPL (i.e., less efficient) with several DAN regions in the left hemisphere as well as MN and associative-control network. Our interpretation is that these changes likely reflect the inability of patients with visual neglect to attend and process stimuli in the contralesional visual field. This hypothesis is supported by several lines of evidence indicating that these patients' DAN areas exhibit imbalance of task-driven activity during task requiring visuospatial attention (Corbetta et al., 2005) as well as disrupted interhemispheric resting-state FC (Baldassarre et al., 2016a; Carter et al., 2010; He et al., 2007). As a matter of fact, in our previous study in a large cohort of acute stroke patients, RPCG showed a decreased interhemispheric FC with DAN and sensory–motor network that strongly correlated with the extent of the visuospatial deficit (Baldassarre et al., 2014).
A similar pattern of association between BC and neglect severity was observed in another higher level hub, namely RdlPFC belonging to the frontoparietal control network (Dosenbach et al., 2007), also known as executive–control network (Seeley et al., 2007). This network is devoted to several executive functions including working memory, control processes, and set shifting. Moreover, RdlPFC exhibited an increase of WSPL with multiple regions of FPN, DMN, and VAN, indicating that severe neglect can be associated with less efficient communication with these RSNs. Such pattern might suggest a deficit of the executive–control functions, leading to an inefficient strategy in selecting targets and suppressing distractors during visual search (Wager and Smith, 2003). This interpretation is consistent with the observation that neglect patients with frontal lobe lesions exhibit severe deficit in tasks including distractors such as cancellation and visual search (Husain and Kennard, 1997).
Furthermore, such pattern might also reflect the inability to suppress internal distractors as the behaviorally relevant WSPL between RdlPFC and DMN regions is consistent with the preferential connectivity of such node with DMN reported by Dixon et al., (2018). Moreover, based on previous lesion-behavior study (Verdon et al., 2010), showing a selective association between damage to right RdlPFC and poor scoring in cancellation tests, this pattern could also be associated with a visuomotor component, which allows to explore the contralesional space.
A reduction of centrality has also been observed in PCC, a crucial region of the DMN (Shulman et al., 1997), as well as an increase of shortest path length between PCC and the rest of such network within the damaged hemisphere. The DMN is described as a system involved in internally directed processes such as autobiographical memory and future planning (Buckner et al., 2008). However, it has been proposed that PCC plays a central role also in controlling the focus of attention (Gusnard and Raichle, 2001; Hampson et al., 2006) as well as in maintaining arousal/vigilance level, awareness (Boly et al., 2008; Vogt and Laureys, 2005), and sustained attention (Gilbert et al., 2007; Shulman et al., 1997).
Indeed, previous studies have shown that hypometabolism in PCC is associated with low level of arousal (Leech and Sharp, 2014). Furthermore, the reduction of FC between PCC and other DMN regions predicts impairments of sustained attention in traumatic brain injury patients (Leech and Sharp, 2014). Accordingly, a potential explanation is that the loss of centrality in PCC and impaired communication within DMN in severe patients might reflect a nonspatial component of neglect such as decreased arousal and sustained attention. These deficits interact with and exacerbate the severity of spatial deficit (Robertson et al., 1995).
The nonspatial component of neglect might also be related to the reduction of centrality in ACC, in the VAN, as well as to the increased shortest path length with several regions of such network in the right hemisphere including supramarginal gyrus and inferior frontal gyrus. Although ACC is not a canonical VAN region, previous study in healthy individuals showed that it exhibits robust FC with such network (Hacker et al., 2013).
As matter of fact, the VAN is engaged during processes such as arousal, reorienting, and detection of novel behaviorally relevant stimuli (Corbetta and Shulman, 2002). Lesions in such system lead to impairment of such functions in neglect patients (Corbetta and Shulman, 2011). Accordingly, a reduction of efficiency in the communication among these regions might likely reflect the nonspatial component of neglect. However, PCC and RdlPFC have been identified as hubs in healthy brain networks, in several studies with fMRI 45 and MEG. 10 11 Therefore, a nonmutually exclusive interpretation is that the loss of centrality of these nodes might reflect broader large-scale changes in brain network topology, which are potentially associated with multiple impairments in different cognitive domains.
A second set of neglect hubs consisted of LMT+ and LCS, whose BC positively correlated with the measure of neglect, that is, increased centrality associated with severe deficit. The increase of centrality in the left visual area MT+ and the associated growth in shortest path length with several nodes in multiple networks could reflect the disruption of top–down control of higher order networks over visual areas. Instead, the increase of centrality in left contralesional central sulcus as well as the reduction of shortest path length connecting LCS with the right cerebellum and several visual regions in both hemispheres might be related to an increase of FC between CS and VN and, therefore, a reduction of visuomotor segregation that has been reported as good biomarker of learning new motor skills. Accordingly, a possible interpretation could be that the overinteraction between CS and visual areas might reflect a deficit of the motor/exploratory ability to execute motor responses toward stimuli in the contralesional part of the body and space.
In general, the healthy brain is characterized by an interplay between functional specialization and dynamic integration that is handled through specific functional hubs. Thus, the observed changes in the functional architecture of neglect hubs, apart from the functional interpretation of the involved regions, have a wide-spread impact on the global integration of the brain network. In particular, the observed decrease of BC in neglect hubs suggests a shift from a connector to a peripheral role for these nodes.
In healthy subjects, peripheral and connector roles in hubs strictly relate to the brain's global integration [see e.g., Kabbara et al. (2017)]. In this study, we observed such a shift in fundamental hubs such as PCC and RdlPFC reported in several fMRI (Buckner et al., 2009; Gordon et al., 2018) and MEG studies (de Pasquale et al., 2010, 2012). Notably, recent findings showed that some of these nodes form a dynamic core network of hubs whose topography and temporal dynamics are fundamental in ensuring an efficient mechanism of integration in the brain (de Pasquale et al., 2016). This mechanism involves high-order cognitive domains such as attention, motor planning, and internal cognition. Thus, we expect that if these nodes become more peripheral, this will reverberate beyond their RSNs of origin leading to a disruption of the overall integration mechanism.
This interpretation is also sustained by the observation of an increase of centrality in motor and visual nodes that are typically more peripheral in the healthy subjects. This seems to be part of this dysfunctional reorganization of the brain networks observed in neglect that, involving peripheral hubs, fails to reach an efficient integration across multiple cognitive domains. This might be potentially associated with multiple impairments observed in this complex syndrome (Langer et al., 2019).
Current findings rely on behavioral assessment and functional imaging at acute stage, it can be expected that the patterns of neglect-relevant topological changes would be different at chronic stage. Specifically, on the light of the study by Ramsey and colleagues (2016), showing a significant improvement of FC (and recovery) from 2 weeks to 3 months, which plateaus up to 1 year, it can be speculated that the most restoration in brain topology, for example, increase/reduction of BC in associative-control/visual and sensory–motor systems, would occur ∼3 months after stroke.
In this study, we report a direct link between neglect syndrome and brain's network topology after stroke, suggesting a maladaptive shift in processing spatial information from higher level associative-control systems toward lower level visual and sensory–motor processing areas, leading to compromised behavioral output. The detected topological overturning might reflect a dedifferentiation-like mechanism (Fornito et al., 2015), since peripheral nodes (e.g., LMT+) exhibit increased recruitment, that is, centrality, as well as show a loss of segregation, that is, efficient minimum walks across multiple networks.
However, we cannot exclude that the neglect-relevant changes in network topology might reflect an initial phase of compensatory adaptation, since such acute modulations might be potentially prognostic of functional improvement over time. Future studies tracking topological changes longitudinally after stroke are needed to evaluate this hypothesis.
More in general, the behavioral significance of spontaneous brain activity in stroke is still unclear, despite a large body of studies. Neuroimaging findings in healthy individuals suggest a circular interplay (Corebtta and Deco, 2012) in which prior experience, for example, learning, and associated brain coactivations shape the intrinsic activity (Albert et al., 2009; Lewis et al., 2009), which, in turn, would bias behavior and cognition (Harmelech and Malach, 2013) as well as task-evoked activation (Cole et al., 2016). Based on these lines of evidence, it has been proposed that the association between off-line impairments and resting-state FC might be the output of a “reset” of such circle at stroke onset (Baldassarre et al., 2019). The structural damage would affect the normal interactions between behavior and spontaneous/task-evoked activity. In this framework, future studies that combine correlative, for example, resting-state fMRI, and causal, for example, TMS, techniques are required to disclose the causal and directional link between behavioral impairments and changes in network topology in neglect patients.
Conclusion
In this study we observed behaviorally relevant changes in functional brain network topology associated with spatial neglect. These findings have at least two important implications. Clinically, the set of neglect hubs may be targeted in noninvasive brain stimulation protocols (e.g., transcranial magnetic stimulation) of neglect to restore their centrality (e.g., inhibiting hypercentrality) and, in turn, to ameliorate the spatial as well as nonspatial deficits. Based on the lines of evidence already discussed (Ramsey et al., 2016), rehabilitative treatment could be carried out before 3 months since stroke onset when spontaneous recovery and networks restoration appear to be mostly completed.
Collectively, these findings offer advances in our knowledge of the functional topology of human brain by describing the behavioral effects of stroke-related alterations in networks architecture.
Limitations
The relatively small sample size (n = 20) represents a first limitation of the study. Nevertheless, the percentage of patients having neglect is in line with previous studies, and thus, it makes the cohort representative of a clinical population of right hemisphere stroke patients. A second important limitation is that the study was focused on the extrapersonal ego-centric neglect, assessed by means of cancellation tests. Further studies should be carried out by investigating the association between brain network topology and different aspects of neglect such as allocentric extrapersonal and personal neglect. Moreover, for many patients, it was not possible to assess other neuropsychological domains, therefore, it could not be excluded that detected patterns of changes of functional interactions in multiple networks might also be related to other clinical deficits.
Future studies should disclose this point by employing cohort of patients with different deficits. Finally, the hubness of cortical regions was indexed by BC, which is mainly based on shortest path lengths. Future investigations might be worth considering different metrics for defining cortical hubs, such as participation coefficient (Power et al., 2013) that accounts for functional interactions of a given node with members of multiple brain subnetworks.
Footnotes
Authors' Contributions
F.d.P. and A.B. designed and conceptualized the study. F.d.P.,
Author Disclosure Statement
No competing financial interests exist.
Funding Information
This study was supported by Ministry of Health Italy.
Supplementary Material
Supplementary Figure S1
References
Supplementary Material
Please find the following supplemental material available below.
For Open Access articles published under a Creative Commons License, all supplemental material carries the same license as the article it is associated with.
For non-Open Access articles published, all supplemental material carries a non-exclusive license, and permission requests for re-use of supplemental material or any part of supplemental material shall be sent directly to the copyright owner as specified in the copyright notice associated with the article.