
Abstract
Background:
Probabilistic tractography, in combination with graph theory, has been used to reconstruct the structural whole-brain connectome. Threshold-free network-based statistics (TFNBS) is a useful technique to study structural connectivity in neurodegenerative disorders; however, there are no previous studies using TFNBS in Parkinson's disease (PD) with and without mild cognitive impairment (MCI).
Materials and Methods:
Sixty-two PD patients, 27 of whom classified as PD-MCI, and 51 healthy controls (HC) underwent diffusion-weighted 3T magnetic resonance imaging. Probabilistic tractography, using FMRIB Software Library (FSL), was used to compute the number of streamlines (NOS) between regions. NOS matrices were used to find group differences with TFNBS, and to calculate global and local measures of network integrity using graph theory. A binominal logistic regression was then used to assess the discrimination between PD with and without MCI using non-overlapping significant tracts. Tract-based spatial statistics were also performed with FSL to study changes in fractional anisotropy (FA) and mean diffusivity.
Results:
PD-MCI showed 37 white matter connections with reduced connectivity strength compared with HC, mainly involving temporal/occipital regions. These were able to differentiate PD-MCI from PD without MCI with an area under the curve of 83–85%. PD without MCI showed disrupted connectivity in 18 connections involving frontal/temporal regions. No significant differences were found in graph measures. Only PD-MCI showed reduced FA compared with HC.
Discussion:
TFNBS based on whole-brain probabilistic tractography can detect structural connectivity alterations in PD with and without MCI. Reduced structural connectivity in fronto-striatal and posterior cortico-cortical connections is associated with PD-MCI.
Impact statement
Our data help to clarify that whole-brain connectome analysis based on probabilistic tractography is a useful and sensitive approach to explore the role of white matter damages as a relevant pathological substrate of cognitive deficits in Parkinson's disease (PD). Our results might add some evidence regarding the involvement of mostly posterior cortical regions and their connections in PD patients with worse cognitive prognosis. Therefore, a threshold-free network-based statistics approach might indicate that structural connectivity abnormalities are not a global phenomenon, and suggests the implication of regional and predominantly posterior structural network disruption underlying cognitive impairment in PD.
Introduction
Parkinson's disease (PD) is a neurodegenerative disorder chiefly known for its motor symptoms; however, the course of PD is also accompanied by a broad range of nonmotor features, including cognitive decline (Kalia and Lang 2015). Mild cognitive impairment (MCI) is a common trait of PD that may be present in its earliest stages, gradually advancing with the progression of the disease and potentially leading to dementia, thus unfavorably affecting the patient's quality of life (Antonini et al. 2012).
Different neuroimaging approaches have been used to describe neuroanatomical correlates of MCI in PD. Previous studies comparing PD-MCI with healthy controls (HC) and PD without MCI have revealed global gray matter (GM) atrophy (Segura et al. 2014) and ventricular enlargement (Dalaker et al. 2010; Segura et al. 2014), as well as cortical thinning mainly involving posterior regions (Pereira et al. 2014; Segura et al. 2014). Nevertheless, little is known about the relevance of white matter (WM) microstructure degeneration in PD, or specifically in PD-MCI. Diffusion-weighted magnetic resonance imaging (MRI) (DWI) is a commonly used acquisition method to study the complex organization of WM tracts. However, tract-based spatial statistics (TBSS), a commonly used analysis method based on whole-brain voxel-based fractional anisotropy (FA) measures, have not been conclusive in characterizing WM alterations in PD, as some have found decreased FA in the corpus callosum (Garcia-Diaz et al. 2018), corona radiata, as well as in the internal and external capsule (Li et al. 2018) when comparing PD with HC, while others did not find significant results (Worker et al. 2014).
In addition, a few studies have focused on PD-MCI, showing decreased FA compared with HC in major associative tracts, the corona radiata and the corpus callosum (Agosta et al. 2014; Hattori et al. 2012; Melzer et al. 2013), but others did not find FA differences between PD-MCI patients and PD without MCI using TBSS (Galantucci et al. 2017).
Tractography is another DWI technique, which permits reconstruction of WM tracts and quantification of the local fiber density. This approach, in combination with graph theory, has been used to identify integration and segregation abnormalities in the reconstructed structural whole-brain connectome of PD patients (Abbasi et al. 2020; Mishra et al. 2020; Nigro et al. 2016).
Galantucci and colleagues (2017) studied structural connectivity across different brain systems and found PD-MCI to have reduced structural connectivity in networks, including the basal ganglia and fronto-parietal regions, when compared with HC and with PD patients without MCI. Wang and colleagues found decreased structural connectivity in PD-MCI patients in comparison with PD without MCI in several subnetworks, as well as reduced nodal efficiency, mostly involving orbitofrontal regions (Wang et al. 2019).
The two studies mentioned above have used a deterministic tractography approach (Galantucci et al. 2017; Wang et al. 2019). However, with this approach, estimating the true trajectories of WM tracts becomes a relevant problem in the context of crossing or kissing fibers (Mori and Van Zijl 2002). To surmount this limitation, and to account for uncertainty in the estimation of the models at each voxel, probabilistic tractography algorithms have been proposed (Behrens et al. 2007). Muller and colleagues (2019) used both types of tractography in the same PD sample and demonstrated the benefits of probabilistic tractography over the deterministic one.
Given this, other studies have opted for probabilistic tractography to study PD patients (Abbasi et al. 2020; Barbagallo et al. 2017; Shah et al. 2017). Some of the reported findings are decreased clustering coefficient (Shah et al. 2017), decreased global efficiency, and increased path length in PD, as well as disrupted networks, which were mainly subcortical and already present in the early stages of the disease (Abbasi et al. 2020). In addition, changes in brain network metrics, such as decreased global efficiency and increased characteristic path length, have been found to correlate with a decline in global cognition (Abbasi et al. 2020).
When aiming to describe specific patterns of connectivity alterations in an edge-wise manner, network-based statistic (NBS) (Zalesky et al. 2010) has been one of the most frequently used methods. Using NBS, many studies have described reduced connectivity in PD compared with HC (Barbagallo et al. 2017; Gou et al. 2018; Nigro et al. 2016; Shah et al. 2017). In the last years, the development of the threshold-free network-based statistics (TFNBS) method (Baggio et al. 2018), which, unlike NBS, does not require the a priori definition of a component-defining threshold and generates edge-wise significant values, has been proposed as a step forward. TFNBS has been proved to be able to detect alterations in the organization and topology of WM tracts, along with the potential to correctly distinguish between neurodegenerative motor disorders (Abos et al. 2019a, 2019b).
To the best of our knowledge, there is no previous work studying TFNBS based on probabilistic tractography and graph theory analysis to characterize whole-brain structural connectivity in PD-MCI. In this regard, the present study aims to investigate potential abnormalities associated with MCI in PD in the complex structural brain networks.
Materials and Methods
Participants
The initial sample included 69 PD patients recruited from the Parkinson's Disease and Movement Disorders Unit, Hospital Clínic (Barcelona, Spain), and 54 HC from the Institut d'Envelliment, Universitat Autònoma de Barcelona. Inclusion criteria for patients were (1) fulfilling UK PD Society Brain Bank diagnostic criteria for PD and (2) no surgical treatment with deep-brain stimulation. Exclusion criteria for all participants were (1) dementia according to Movement Disorders Society criteria, (2) Hoehn and Yahr (H&Y) scale score >3, (3) severe psychiatric or neurological comorbidity, (4) low global intelligence quotient estimated by the vocabulary subtest of the Wechsler Adult Intelligence Scale 3rd edition (scalar score ≤7), (5) Mini Mental State Examination (MMSE) score below 25, (6) claustrophobia, (7) pathological MRI findings other than mild WM hyperintensities in the fluid attenuated inversion recovery (FLAIR) sequence, and (8) MRI artifacts. A total of 62 PD patients and 51 HC were finally selected. The following participants were excluded from the study: five patients and two HC with MRI artifacts, two patients with claustrophobia, and one HC with a cyst. Motor symptoms were assessed with the Unified Parkinson's Disease Rating Scale, motor section (UPDRS-III).
All PD patients were taking antiparkinsonian drugs that consisted of different combinations of L-dopa, catechol-O-methyltransferase inhibitors, monoamine oxidase inhibitors, dopamine agonists, and amantadine. To standardize the doses, the L-dopa equivalent daily dose (LEDD) (Tomlinson et al. 2010) was calculated. Written informed consent was obtained from all study participants after a full explanation of the procedures. The study was approved by the Institutional Ethics Committee from the University of Barcelona (IRB00003099).
Neuropsychological tests
All participants underwent a comprehensive neuropsychological assessment in the on state addressing cognitive domains frequently impaired in PD (Litvan et al. 2012). Attention and working memory were assessed with the Trail Making Test (parts A and B), Digit Span Forward and Backward, Stroop Color-Word Test, Symbol Digits Modalities Test—oral version. Executive functions were evaluated with phonemic and semantic fluencies. Language was assessed by the Boston Naming Test (BNT). Memory was assessed using Rey's Auditory Verbal Learning Test total learning recall, delayed recall, and recognition abilities (RAVLT total, RAVLT recall, and RAVLT recognition, respectively). Visuospatial and visuoperceptual functions were assessed with Benton's Judgment of Line Orientation, Visual Form Discrimination (VFD), and Facial Recognition (FRT) tests. Neuropsychiatric symptoms were evaluated with the Beck Depression Inventory-II, Starkstein's Apathy Scale, and Cumming's Neuropsychiatric Inventory. Expected z scores adjusted for age, sex, and education were calculated for each test and subject based on a multiple regression analysis performed in the HC (Aarsland et al. 2009). The presence of MCI was defined using PD-MCI diagnostic criteria level II (Litvan et al. 2012).
MRI acquisition
MRI data were acquired with a 3 T scanner (MAGNETOM Trio, Siemens, Germany). The scanning protocol included high-resolution, three-dimensional, T1-weighted images acquired in the sagittal plane (repetition time [TR] = 2300 ms, echo time [TE] = 2.98 ms, inversion time [TI] = 900 ms, 240 slices, field of view [FOV] = 256 mm; 1 mm isotropic voxel), two sets of single-band, spin-echo diffusion-weighted images in the axial plane with opposite (anterior-posterior and posterior-anterior) phase encoding directions (TR = 7700 ms, TE = 89 ms, FOV = 244 mm; 2 mm isotropic voxel; number of directions = 30, b-value = 1000 sec/mm2, b 0 value = 0 sec/mm2), and a T2-weighted axial FLAIR sequence (TR = 9000 ms, TE = 96 ms).
MRI preprocessing
Structural MRI preprocessing was performed using the automated FreeSurfer (version 5.1) pipeline. The cerebral cortex was parcellated into gyral and sulcal structures based on 68 cortical regions of interest (ROIs) from the Desikan/Killiany atlas (Desikan et al. 2006), and 18 deep gray matter (DGM) ROIs from the automated FreeSurfer segmentation step (Filipek et al. 1994; Fischl and Dale 2000; Seidman et al. 1997). DWI images were preprocessed with the FMRIB Software Library (FSL; version 5.08). The preprocessing steps included brain extraction using Brain Extraction Tool, susceptibility-induced distortion correction using topup, and eddy-current distortion and subject motion correction with eddy. FMRIB's Diffusion Toolbox (FDT) was used for data processing, local diffusion modeling, and tractography (Jbabdi et al. 2012).
Tract-based spatial statistics
Preprocessed diffusion MRI images were analyzed with FDT software from FSL. Individual FA maps were obtained using a Diffusion Tensor Model fit (DTIFIT), and the voxel-wise statistical analysis of FA was carried through with TBSS (Smith et al. 2006). TBSS performs nonlinear registration (using Nonlinear Image Registration Tool [FMRIB]) of FA images from DTIFIT to the MNI standard space and generates a mean FA skeleton that represents the center of all WM tracts common to the whole group. Each subject's FA image was projected onto the skeleton and the resulting FA skeleton images were fed into a general linear model (GLM) modeling the three groups (HC, PD without MCI, PD-MCI) to find vertex-wise differences in FA skeleton maps. The same steps were used to obtain the mean diffusivity (MD) maps. The global mean FA and MD were also extracted.
Tractography and structural connectivity analysis
To run probabilistic tractography, the 86 ROIs previously obtained with FreeSurfer were linearly registered from native structural space to native diffusion space with FMRIB's Linear Image Registration Tool (Jenkinson et al. 2002) to be used as seeds. Next, Bedpostx was applied to calculate the probability distribution of fiber directions in each voxel (Behrens et al. 2007). Then, we ran the tractography with the Probrtarckx2 tool (Behrens et al. 2007) using 5000 streamlines from each ROI, and an ROI-by-ROI connectivity setting obtaining an 86 × 86 connectivity matrix per subject, which contained the number of reconstructed streamlines (number of streamlines [NOS]) between each pair of ROIs. NOS was taken as a measure of the strength of structural connectivity between these regions. To minimize false-positive connections, streamlines intersecting fewer than two regions were ignored, and those detected in at least 50% of the individuals were considered (Abos et al. 2019b; Zalesky et al. 2010). Finally, to test tract-wise differences between groups in interregional NOS, we used TFNBS (Baggio et al. 2018), which performs statistical inference on the data matrix. Results were corrected using family-wise error rate (FWE) correction, with a significance level of p < 0.05. Whole-brain NOS was also calculated as the mean of all NOS values.
Graph theory computation
Graph theory topological parameters derived from the thresholded NOS matrices were obtained using the Brain Connectivity Toolbox from MATLAB. The graph metrics included global and local normalized clustering coefficient, global and local node degree, small worldness, normalized path length, modularity, local efficiency, and betweenness centrality (see Rubinov and Sporns [2010] for detailed definitions and calculations of the graph metrics).
Additional statistical analyses
Demographic, neuropsychological, and clinical statistical analyses were conducted using IBM SPSS Statistics 25.0 (IBM Corp., Armonk, NY). To assess differences in demographic, clinical, and neuropsychological quantitative variables, the Kruskal–Wallis or Mann–Whitney U tests were used. The chi-squared test was used for categorical variables. Intergroup comparisons for summary graph measures, as well as for global mean FA; MD and NOS were assessed with GLM using in-house MATLAB scripts and Monte Carlo simulations with 5,000 permutations. Results were corrected for multiple testing using FWE correction, with a significance level of p < 0.05. Correlations between neuropsychological test scores and clinic data with global FA measures and NOS were evaluated using Pearson correlation.
Additional analyses were conducted to explore differences between PD with and without MCI. For this purpose, the number of connections with significantly reduced connectivity strength in PD-MCI patients compared with HC was matched to those obtained in PD without MCI compared with HC, and the overlapping connections were excluded. The resulting non-overlapping connections were used to calculate their capacity to discern between both groups of PD patients. This set of connections was split into cortico-cortical and cortico-DGM. To observe if both sets of connections could separately discriminate between PD with and without MCI, a binomial logistic regression for classification was performed using MATLAB (The MathWorks, Inc.; R2019b). Binomial logistic regression is based on a regression model to predict the probability that, for a given input data, each input belongs to a numeric category (0 or 1). It models data using a sigmoid function and becomes a classification technique when a threshold is established on the sigmoid (0.5). The receiver operating characteristic (ROC) curve was obtained from the probability estimations by the logistic regression as scores, as well as the corresponding area under the curve (AUC).
Results
Demographic and clinical characteristics of PD
PD patients and the HC group did not differ significantly in age or years of education, but they did in gender (Supplementary Data S1). Twenty-seven PD patients were classified as PD-MCI, and 35 without MCI. Regarding the sociodemographic and clinical characteristics of the three groups (HC, PD without MCI, and PD-MCI), shown in Table 1, no significant differences between groups were observed for age, years of education, nor global cognition (MMSE). A significant effect was found in gender (p = 0.006). PD groups did not differ in disease duration, LEDD, nor in motor disease severity as measured by the UPDRS-III scale. There was a difference in H&Y scores (p = 0.044) between subgroups.
Sociodemographic and Clinical Data
Group differences were assessed using Kruskal–Wallis or Mann–Whitney U test according to the number of groups being compared. Categorical variables were analyzed with Pearson's chi-squared test.
HC, healthy controls; IADL, instrumental activities of the daily life; IQR, interquartile range; LEDD, L-dopa equivalent daily dose; MCI, mild cognitive impairment; MMSE, Mini Mental State Examination; NA, not applicable; PD, Parkinson's disease; UPDRS, Unified Parkinson's Disease Rating Scale.
Neuropsychological differences between groups
Table 2 shows differences in neuropsychological performance between groups. PD-MCI patient scores were significantly worse than those of PD without MCI and HC in all tests except forward and backward digits, and BNT. PD-MCI patients also showed lower scores than HC in VFD and FRT.
Group Comparison of Neuropsychological Performance
Neuropsychological data presented as z-scores. For the statistical analyses Kruskal–Wallis test and Mann–Whitney U test were used.
BNT, Boston Naming Test; FRT, Facial Recognition Test; JLO, Judgment of Line Orientation Test; RAVLT, Rey's Auditory Verbal Learning Test; SDMT, Symbol Digits Modality Test; TMTA, Trail Making Test part A; TMTB, Trail Making Test part B; TMTAB, Trail Making Test B minus A; VFD, Visual Form Discrimination.
TBSS analysis
The TBSS analysis did not show significant differences between PD and HC in FA nor in MD. However, when the PD sample was subdivided according to the presence of MCI, PD-MCI patients showed reduced FA compared with HC (p = 0.031) (Fig. 1). Concretely, decreased FA was detected in the left inferior fronto-occipital fasciculus, corticospinal tract, inferior and superior longitudinal fasciculus, and forceps major. There were no differences between PD without MCI and HC, nor between PD subgroups. In contrast, TBSS analysis on MD maps did not show any significant results.
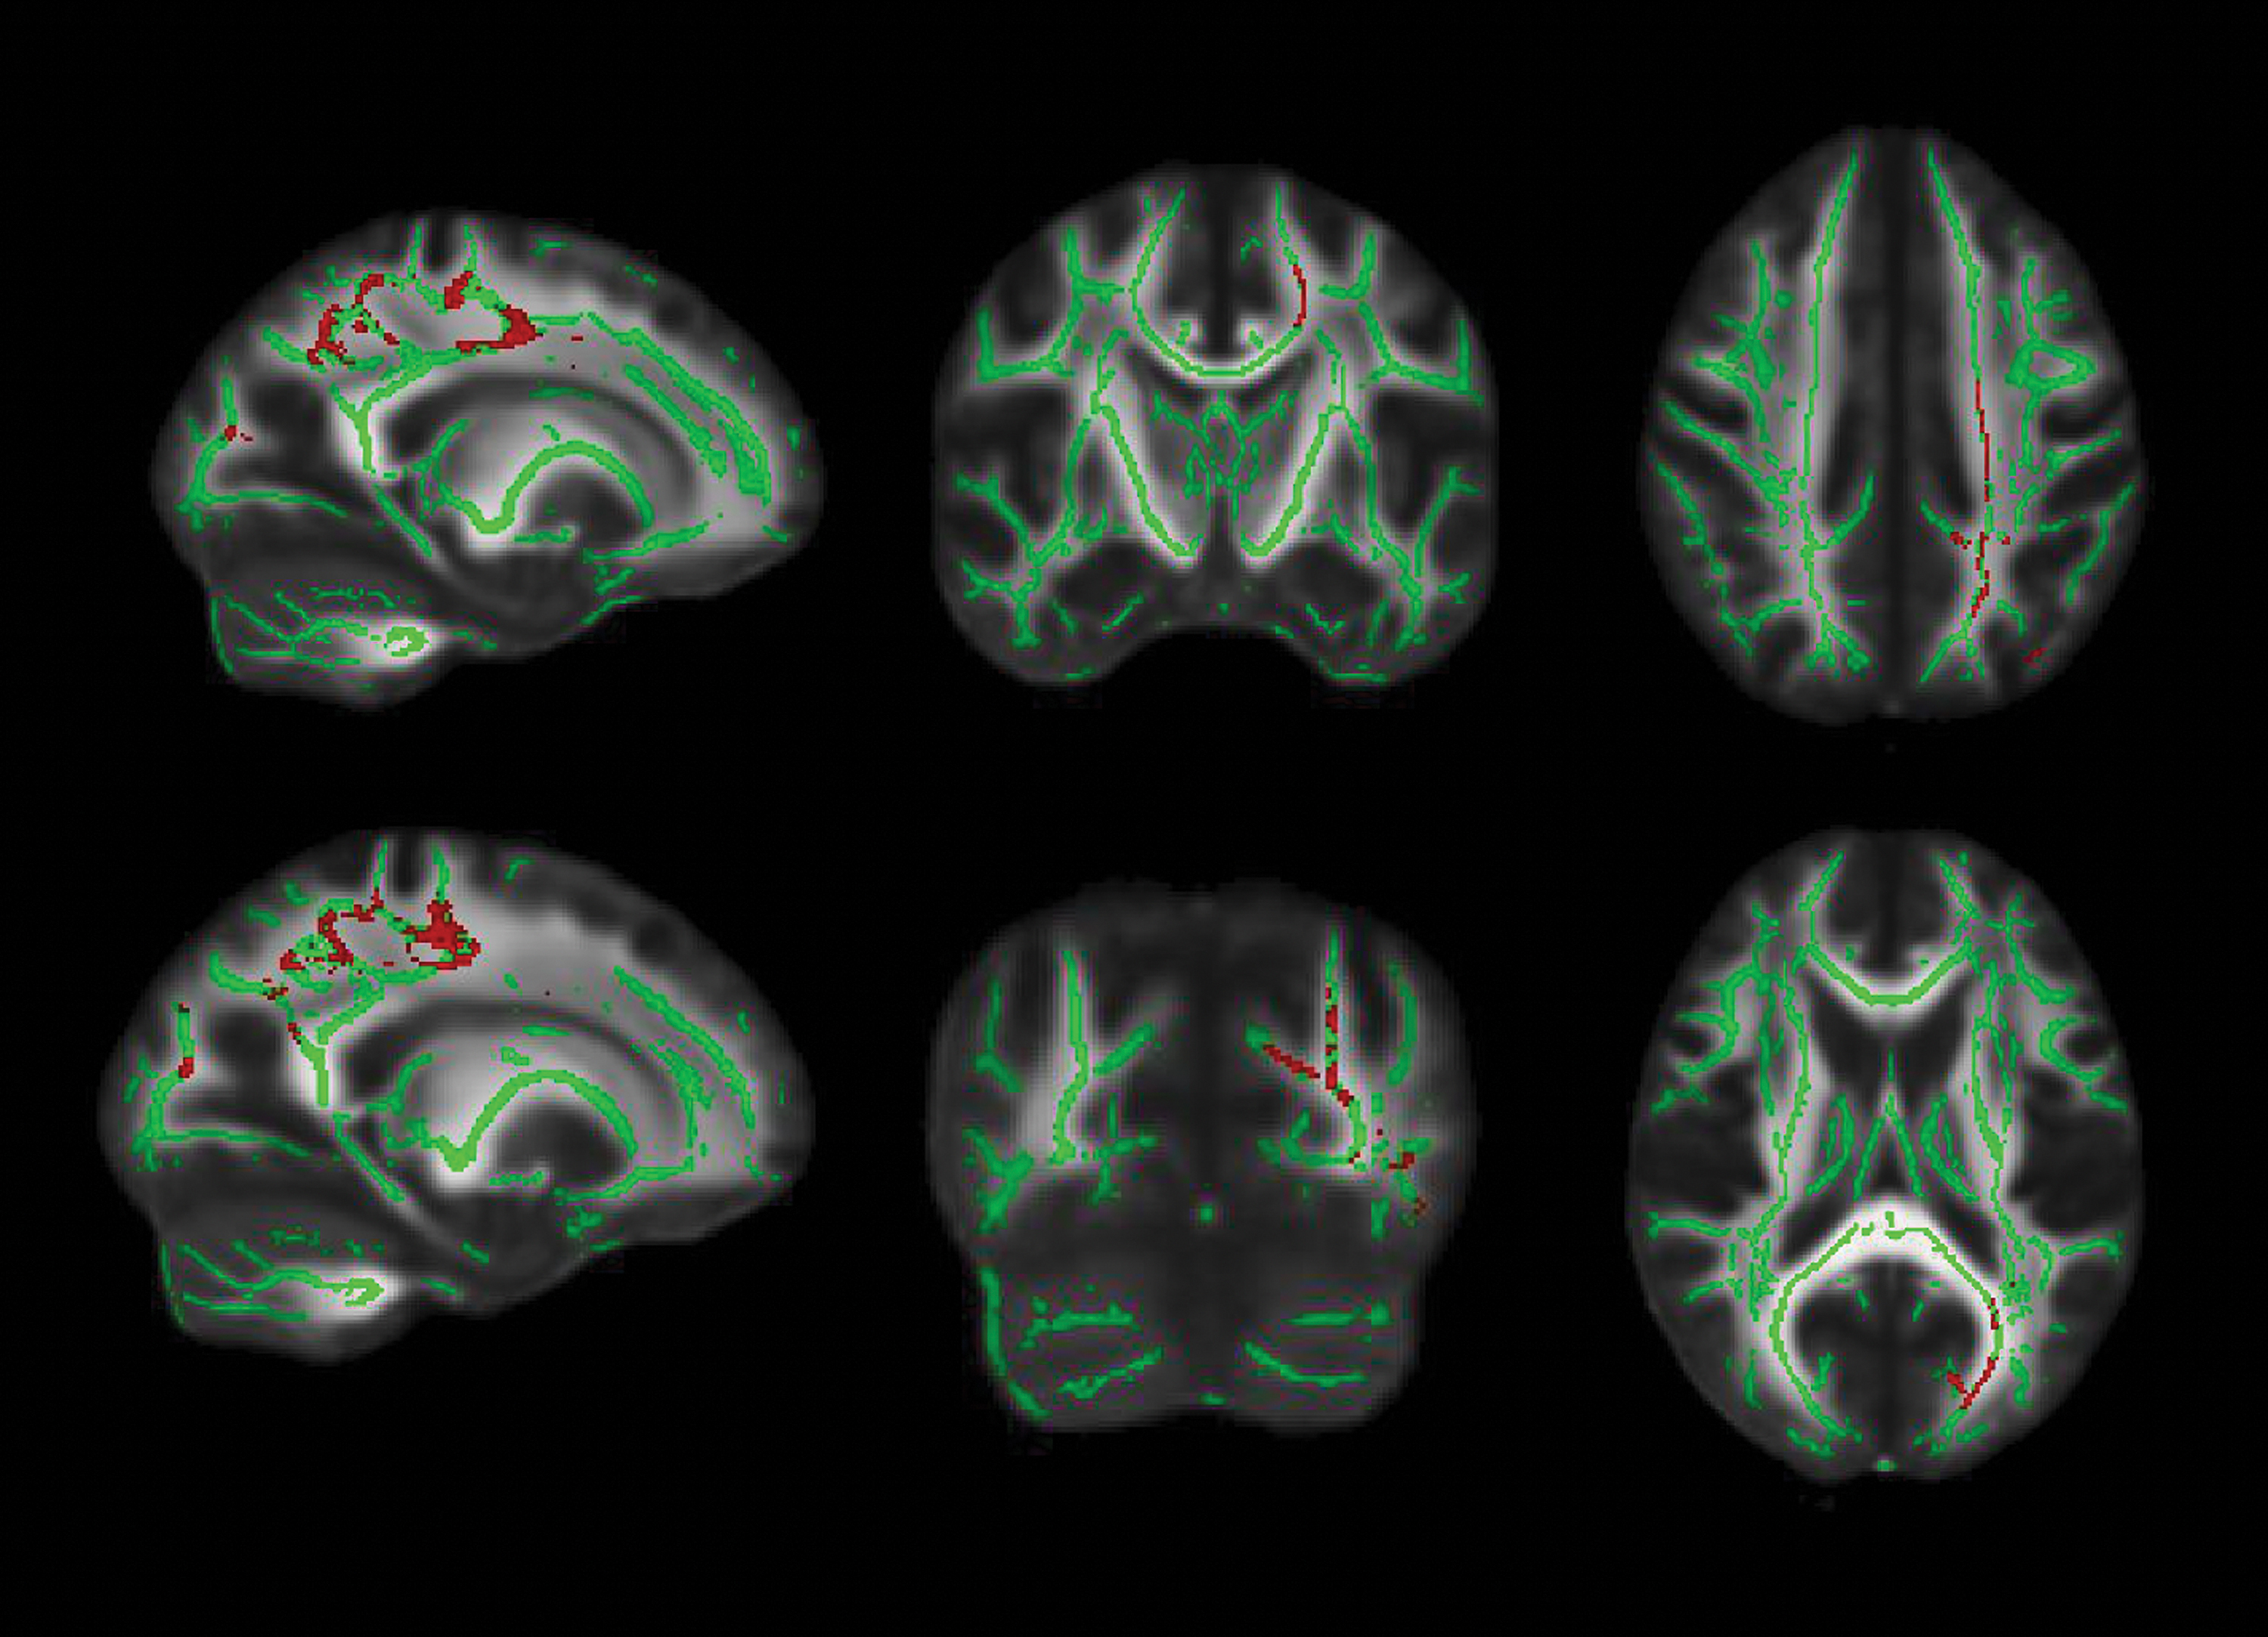
White matter maps (in green) showing regions of significantly decreased FA in PD-MCI patients compared with HC (in red). Results were adjusted by gender (p < 0.05, FWE-corrected). Radiological convention is used. FA, fractional anisotropy; HC, healthy controls; MCI, mild cognitive impairment; PD, Parkinson's disease; WM, white matter. Color images are available online.
Comparisons in global mean FA did not show significant differences when comparing PD with HC (F = 1.102; p = 0.323) or when comparing PD-MCI or PD without MCI with HC (F = 1.104; p = 0.339).
No significant intergroup differences in global mean MD were found either between PD patients and HC (F = 0.126; p = 0.723) or when assessing the three previously mentioned groups (F = 0.546; p = 0.588).
TFNBS analysis
The PD patient group showed a reduced number of streamlines (NOS) compared with HC in 114 connections (FWE-corrected, p < 0.05). From these 114 connections, 67 were found to be cortico-cortical (59%), 46 were cortico-DGM (40%), and only one was a DGM-DGM connection (1%). No connections showed significantly higher NOS in PD patients compared with HC. Figure 2 shows the violin plot distribution of the average NOS derived from the 114 connections.
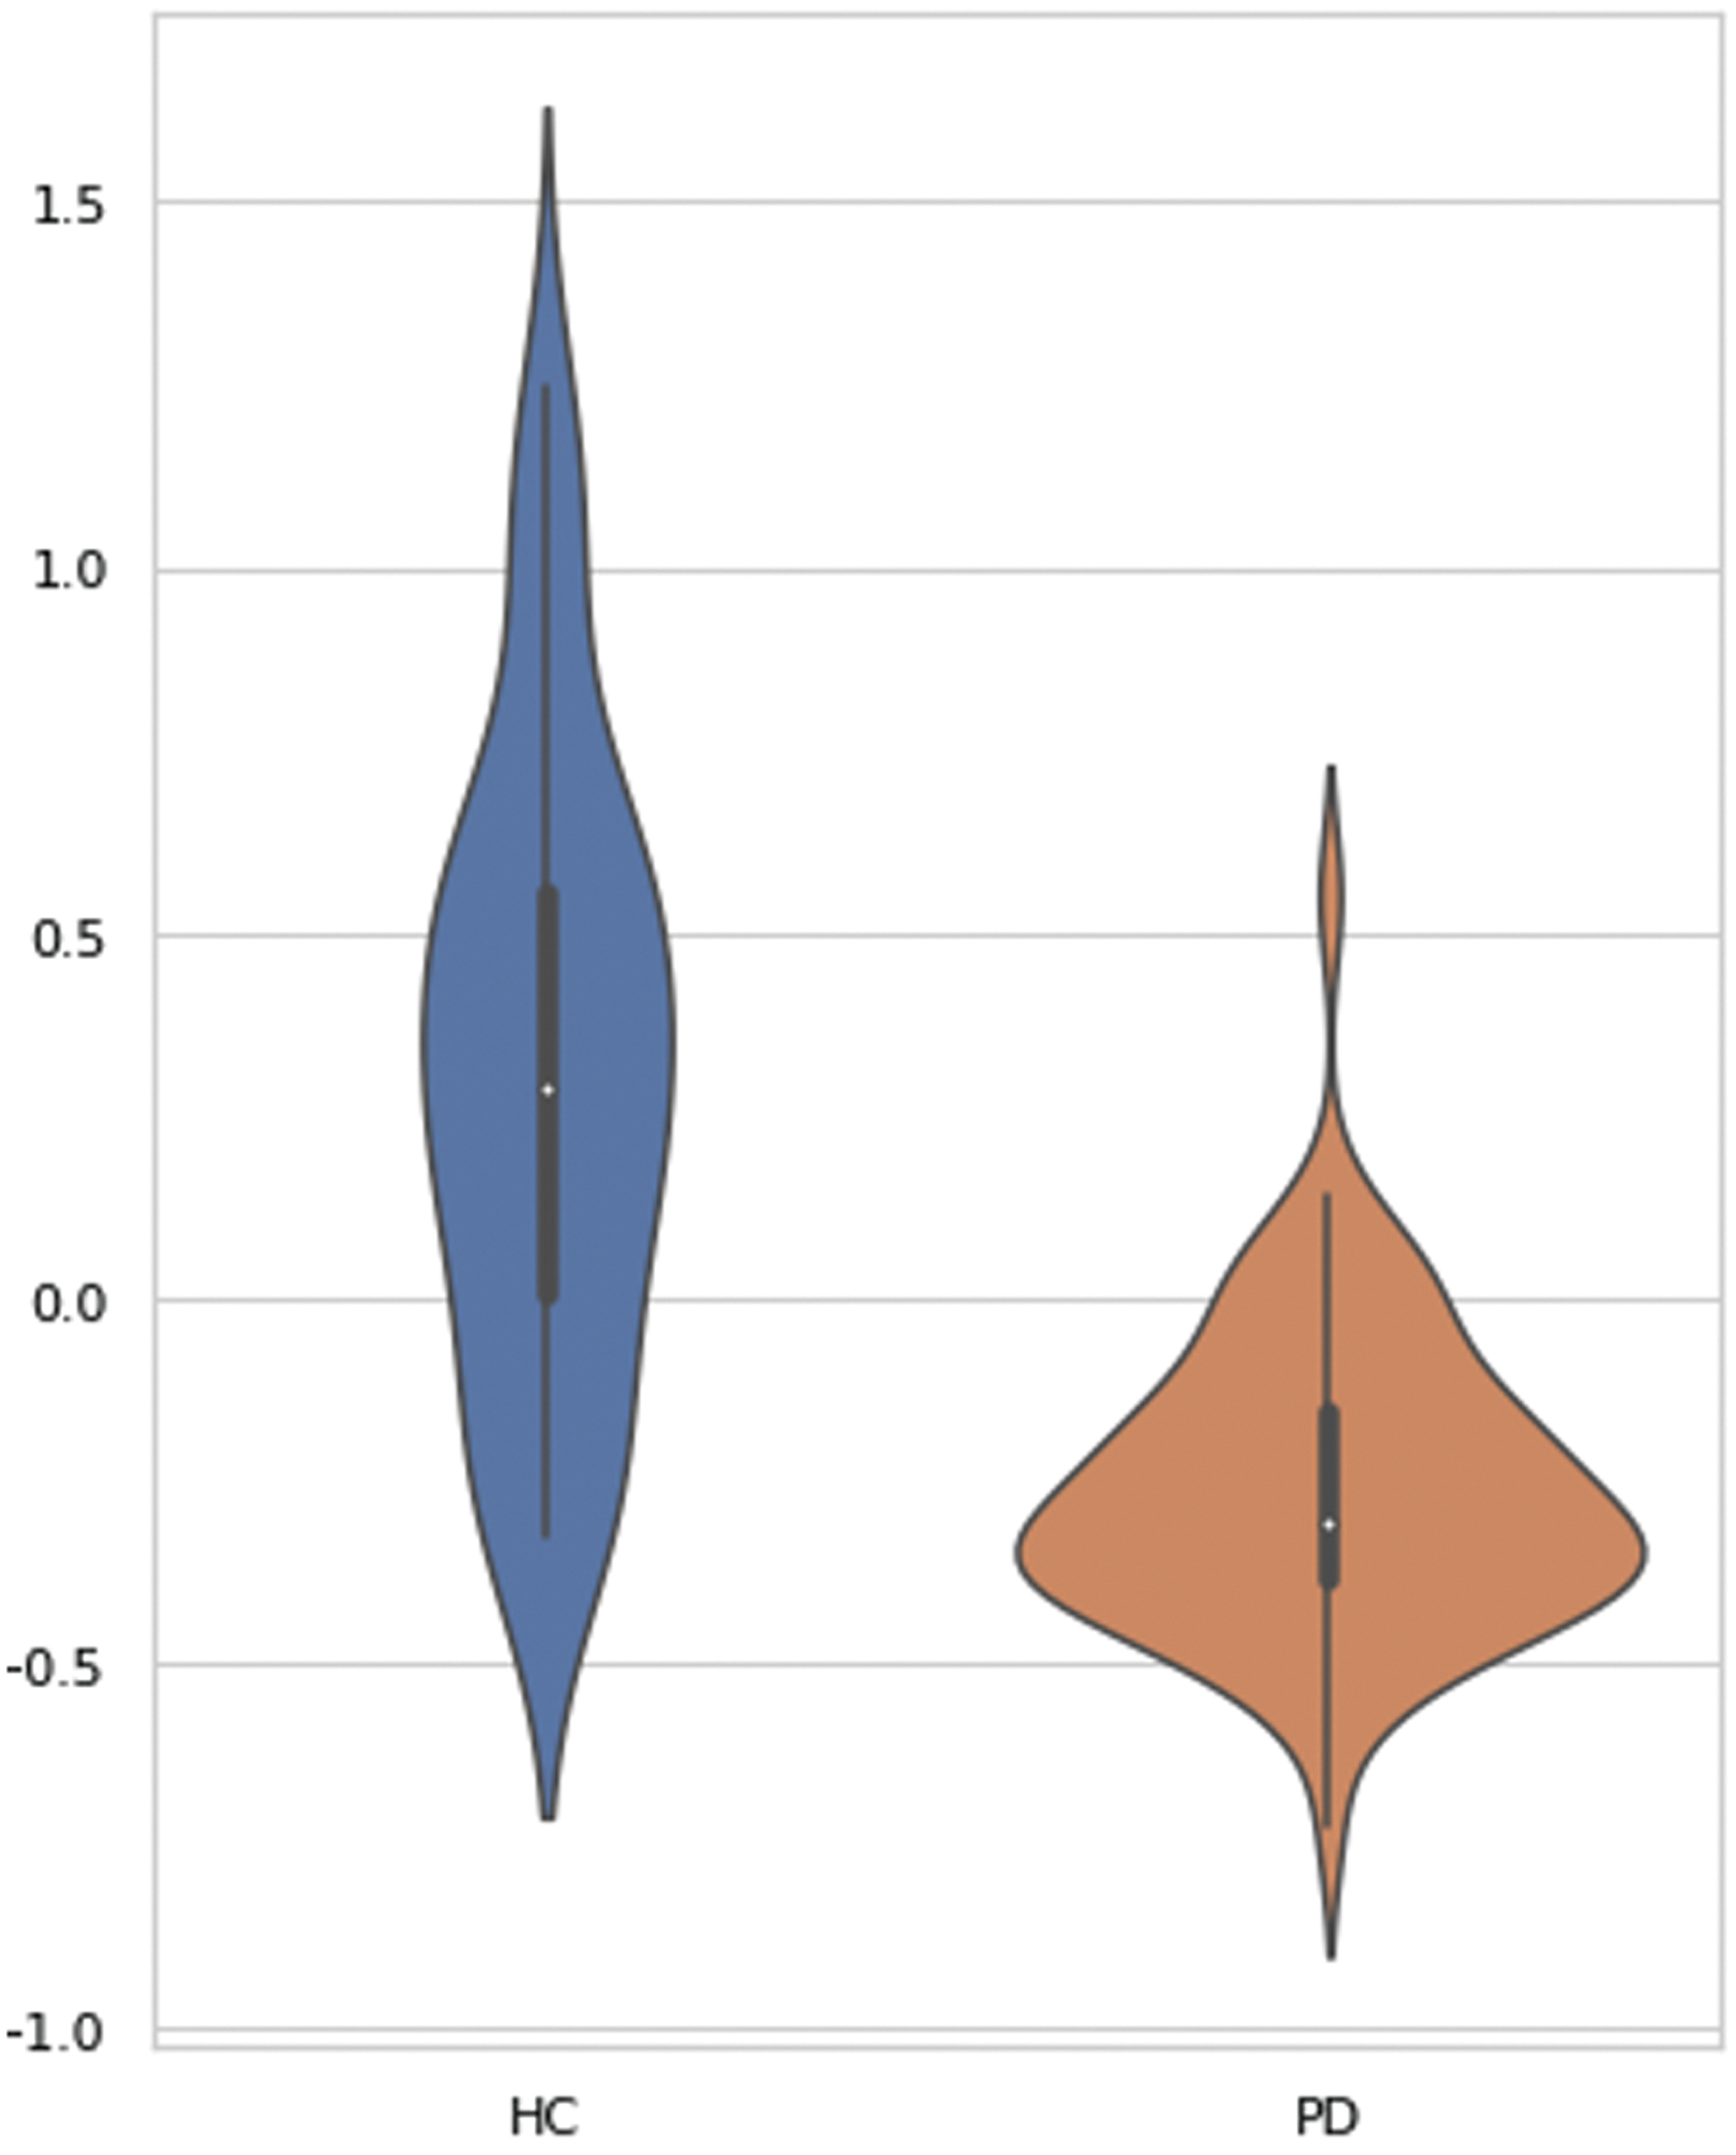
Comparison of mean connectivity between HC and PD patients. Plots illustrate the distribution of average NOS derived from the 114 connections with significantly reduced connectivity in PD compared with HC. Significance of intergroup analyses (FWE-corrected, p < 0.05) is shown. NOS, number of streamlines; TFNBS, threshold-free network-based statistics. Color images are available online.
When studying the two PD groups separately, we found that both PD-MCI and PD without MCI showed reduced NOS compared with HC; specifically, patients with PD-MCI showed a higher number of altered connections than PD without MCI (Fig. 3). However, differences between PD-MCI and PD without MCI did not reach statistical significance. PD-MCI showed reduced connectivity in 37 connections when compared with HC, 16 of which were cortico-cortical (43%), mainly involving temporal and occipital regions, and 21 were cortico-DGM (57%). At the same time, PD without MCI showed reduced structural connectivity compared with HC in 18 connections mainly involving frontal and temporal regions. Twelve connections were cortico-cortical (67%), five were cortico-DGM (28%), and only one was a DGM-DGM connection (5%). No connections showed significantly higher NOS in any of the PD groups compared with HC (Supplementary Data S2).
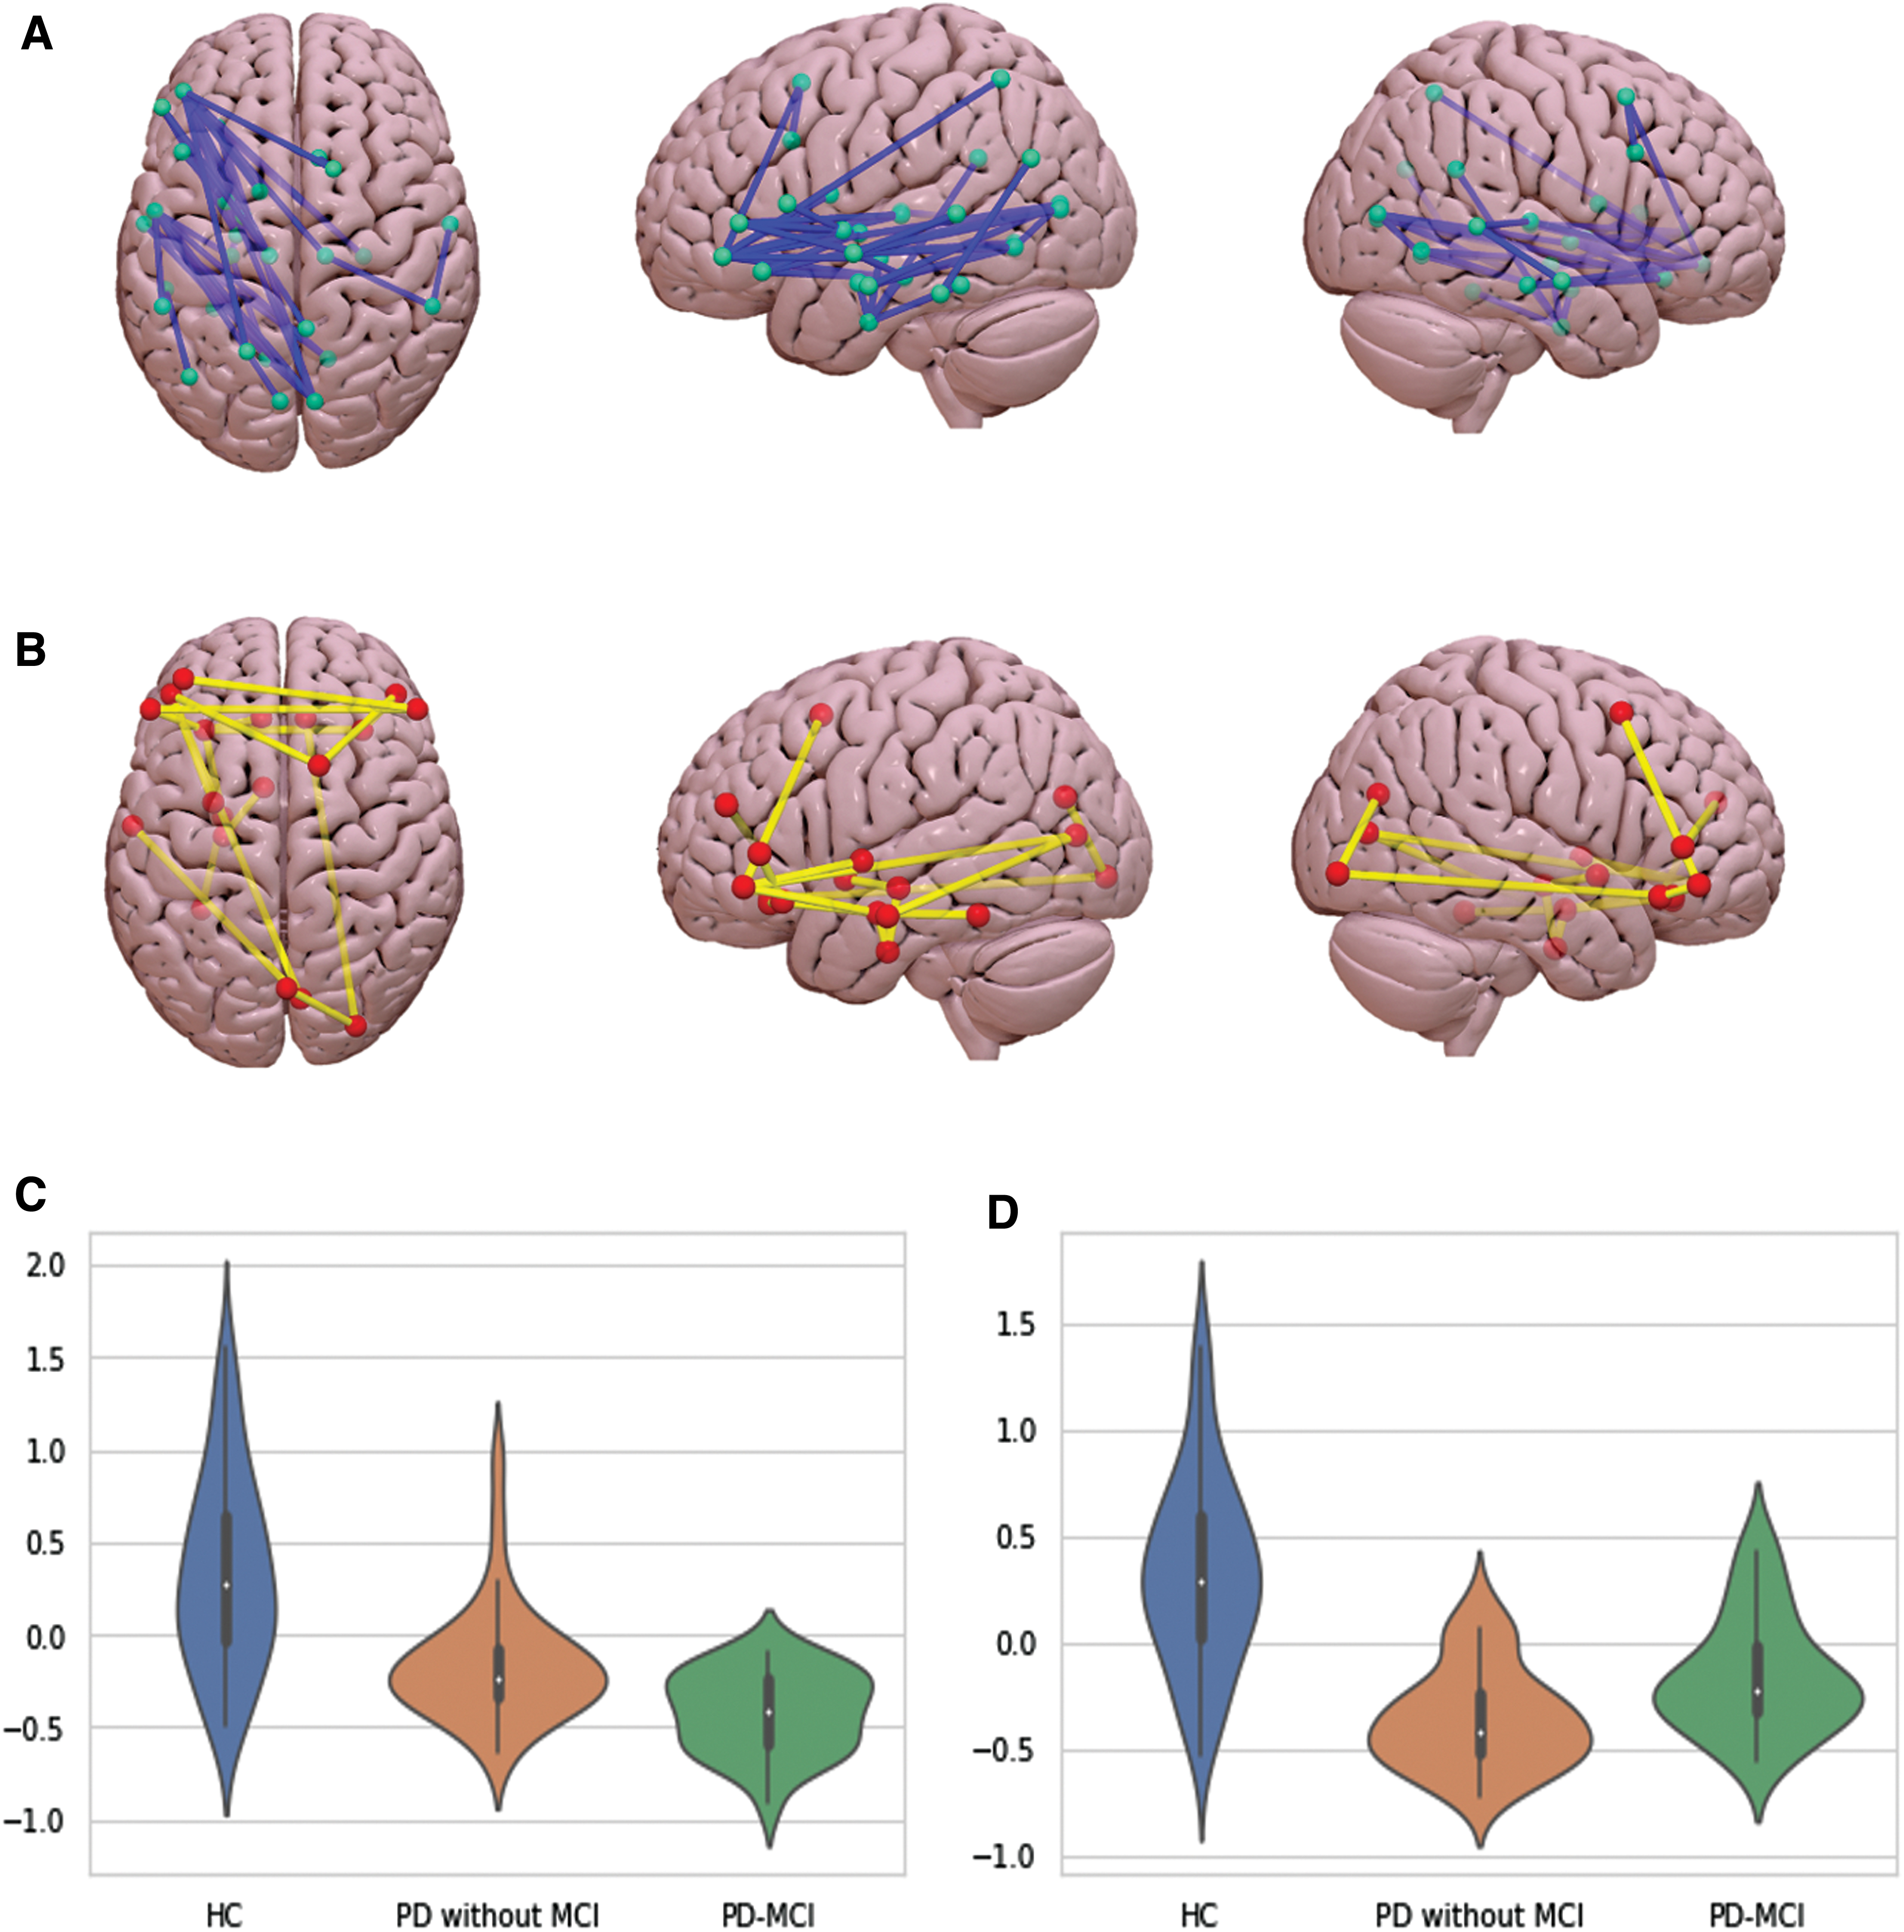
Schematic representation of the structural connections with reduced structural connectivity strength in PD-MCI
Whole-brain mean NOS was significantly reduced in PD compared with HC (T = 2.78, p = 0.003). When divided into PD-MCI and PD without MCI, both subgroups showed decreased whole-brain mean NOS compared with HC (T = 2.56, p = 0.008 for PD-MCI and T = 2.13, p = 0.022 for PD without MCI; FWE-corrected).
We then selected the connections that were differentially altered in PD-MCI and did not overlap with the ones altered in PD without MCI, and we evaluated their discriminatory capabilities using classification metrics. The ROC analysis showed that cortico-cortical connections with reduced NOS in PD-MCI compared with HC determined a good AUC of 0.83 in distinguishing patients with MCI from those without MCI. In the same line, for DGM-cortical connections, we obtained an AUC of 0.85 (Supplementary Data S3 and Supplementary Figure S1).
NOS and FA values did not correlate with clinical variables nor with cognitive performance.
Graph analysis
No group effect was found for global graph parameters, which included the normalized clustering coefficient, mean node degree, small worldness, normalized path length, and modularity (Table 3). However, we found differences in local graph measures (FWE-corrected, p < 0.05), which implied decreased local efficiency, node degree, and nodal clustering coefficient in both PD groups compared with HC (Table 4). Of note, we found differences between PD groups according to MCI presence. PD without MCI had higher nodal clustering coefficient in the left banks of the superior temporal sulcus, postcentral, transverse temporal cortices, as well as in the right superior parietal cortex in comparison with PD-MCI (Table 4). PD-MCI patients, on the contrary, showed higher local efficiency and nodal clustering coefficient in the right accumbens, as well as increased node degree in the left banks of the superior temporal sulcus, when compared with PD without MCI.
Global Graph Measures
Group differences were assessed using Monte Carlo simulations with 5,000 permutations (FWE-corrected, p < 0.05).
FWE, family-wise error rate.
Local Graph Measures
Group differences were assessed using Monte Carlo simulations with 5,000 permutations (FWE-corrected, p < 0.05).
n.s., not significant; ROI, regions of interest.
Discussion
We have studied structural connectivity alterations in PD and PD-MCI by assessing local changes in WM integrity with TBSS, pair-wise connectivity measures using TFNBS, and global as well as local measures of network integrity using graph theory. As far as we know, this is the first work investigating structural connectivity using TFNBS based on probabilistic tractography in PD-MCI.
PD patients showed reduced NOS compared with HC. Structural connectivity reduction was present in both PD-MCI and PD without MCI patients. Specifically, PD-MCI showed a higher number of abnormal connections involving cortico-DGM connections and mainly posterior cortico-cortical regions. PD patients without MCI, in turn, showed fewer impaired connections, mostly located in bilateral prefrontal regions. Our data suggest that whole-brain connectome analysis based on probabilistic tractography is a useful and sensitive approach to explore the structural abnormalities related to cognitive decline in PD.
Whole-brain analysis of pair-wise connections showed reduced NOS in PD compared with HC in 114 connections. Particularly, PD-MCI showed reduced connectivity in a higher number of connections than PD without MCI, which were mainly fronto-striatal and posterior cortico-cortical connections.
A previous study identified decreased global FA and increased global MD, as well as structural brain connectivity changes in certain subnetworks based on FA and MD values, which included basal ganglia as well as frontal and parietal nodes in PD-MCI patients in comparison with HC (Galantucci et al. 2017). Similarly, our results showed reduced NOS in fronto-striatal connections, which are known to be related to early cognitive deficits in PD, including those commonly described as dopaminergic fronto-striatal executive impairments (Schapira et al. 2017).
In agreement with our results, Galantucci and colleagues (2017) did not find differences in global NOS between PD patient subgroups; nonetheless, both PD-MCI and PD without MCI groups showed reduced global NOS in comparison with HC (Galantucci et al. 2017). In addition, in their study, initial FA NBS analyses showed no differences between PD patients. However, when more liberal statistical thresholds were used, FA connection changes were identified, and were similar to PD changes between controls and PD-MCI patients.
In contrast with the results of Galantucci et al. (2017) that found decreased FA in PD-MCI compared with HC in a bilateral principal connected component, we identified significant differences mainly in the left hemisphere. The differences could be due to the sample characteristics, as Galantucci et al. (2017) performed the analysis using matched PD samples. However, our results agree with those of Agosta et al. (2014) that reported decreased FA in PD-MCI compared with HC in several left tracts. A recent review of DTI in PD and other parkinsonism showed that although FA decreases are often bilateral, there are also different studies showing only left hemisphere decreases (Zhang et al. 2020). The origin of hemispheric asymmetries is unknown; however, the unilateral findings do not necessarily imply that the other hemisphere is not affected, the nonsignificant results may be a consequence of the specific threshold established for statistical significance.
In our study, moreover, PD-MCI patients showed reduced NOS in cortico-cortical connections mainly including temporal and occipital regions. In this context, posterior cortical-based neuropsychological deficits have been related to a higher risk of evolution to dementia (Williams-Gray et al. 2007). This hypothesis is supported by findings from other modalities: FDG-PET data have shown that posterior cortical hypometabolism may play an important role in the pathogenesis of cognitive impairment in PD (Garcia-Garcia et al. 2012; Wu et al. 2018). Moreover, regional cortical thinning in parieto-temporal regions, as well as increased global atrophy, has been suggested as structural neuroimaging markers of cognitive impairment in nondemented PD patients (Segura et al. 2014; Uribe et al. 2016).
Furthermore, based on pathological findings, the presence of cortical Lewy body pathology, as well as concomitant Alzheimer pathology, seems to be the most relevant factor in the development of cognitive impairment in PD (Halliday et al. 2014). A possible explanation is that neuronal cell bodies could be affected, with gradual loss of synaptic terminals, but dendritic arborization and neuronal connections could also be affected. Therefore, WM abnormalities observed in cognitively impaired patients may be understood as secondary to axonal degeneration after neuronal body damage. Within this framework, our results might add some evidence regarding the involvement of mostly posterior cortical regions and their connections in PD patients to worse cognitive prognosis.
In our work, logistic regression and ROC curve analysis showed that decreased cortico-cortical and cortico-DGM connections described in the group comparison between PD-MCI patients and HC can identify subgroups of patients with an AUC of 83% and 85%, respectively. Although our analyses were done to provide a quantification of the results obtained from the whole connectome, they are in accordance with results from recent approaches that have assessed the discriminant value of features extracted from MRI modalities. A previous study showed that structural connectivity data are relevant in distinguishing parkinsonian patients at the single-subject level with an overall accuracy of 82.23% (Abos et al. 2019b). In PD patients, these MRI data are also able to correctly discern PD patients from HC in longitudinal studies, obtaining similar accuracy results (83.6%) (Peña-Nogales et al. 2019). Only one previous study in PD-MCI (Galantucci et al. 2017) showed that structural abnormalities identified throughout the NBS approach could discriminate PD-MCI from those with PD without MCI with an 81% accuracy.
On the contrary, in our study, other measures derived from DTI showed lower sensitivity to WM abnormalities. We did not find significant differences between groups using mean global measures such as mean global FA and MD. Moreover, only PD-MCI patients compared with HC showed microstructural damage measured by TBSS. Previous literature using this methodological approach suggested that WM damage was emerging as a relevant pathological substrate of cognitive deficits in PD patients (Baggio et al. 2018; Hattori et al. 2012). While some studies identified widespread bilateral WM abnormalities in PD-MCI compared with PD without cognitive impairment in the left corticospinal tract, inferior longitudinal fasciculus, and forceps major (Agosta et al. 2014), others found more spatially restricted regions limited to the corona radiata (Melzer et al. 2013) and the posterior part of the corpus callosum (Garcia-Diaz et al. 2018), or did not find significant differences (Galantucci et al. 2017; Hattori et al. 2012).
Characterizing the structural connectome through graph theory provides information about the organization of the network (Griffa et al. 2013). Few studies have investigated the WM structural network connectome alterations in PD-MCI patients. In our study, graph analysis of global network properties did not show significant differences. Similarly, although Wang et al. (2019) reported decreased global efficiency and increased shortest path length in PD-MCI compared with HC, both important indicators of network interconnectivity, they did not find significant differences between PD subgroups or PD without MCI and HC. Contrarily, Galantucci et al. (2017), using FA and MD matrices, found increased assortativity—that is, the preference of a node to connect with similar nodes—and reduced clustering coefficient and global efficiency when comparing PD with and without MCI, suggesting global abnormalities in structural networks (Galantucci et al. 2017).
Moreover, our exploratory analysis brought noteworthy differences in local graph measures to light. PD patients showed less local efficiency, nodal degree, and clustering coefficient in several regions. Intergroup comparisons mostly suggested decreased nodal clustering coefficient, specifically in the left banks of the superior temporal sulcus, postcentral, transverse temporal cortices, as well as in the right superior parietal cortex in PD-MCI, in comparison with PD patients without cognitive impairment. The opposite trend was observed only in the right accumbens together with increased node degree in the left banks of the superior temporal sulcus. Widespread regions with decreased nodal efficiency have been previously observed between PD subgroups and HC. However, when PD-MCI and PD without MCI were compared, the reported regions only involved the left olfactory cortex and the left superior frontal gyrus, but not posterior regions (Wang et al. 2019).
In this sense, it should be pointed out that the reproducibility of network metrics can be affected by many factors. One relevant aspect would be that previous studies estimated structural connectivity using deterministic tractography, whereas our results were based on a probabilistic approach. Methodological differences as well as diversity in patient characteristics could be contributing to the heterogeneity of these results.
Previous results, taken altogether, highlighted the involvement of complex structural brain networks in PD-related cognitive impairment, rather than degeneration of individual WM tracts. Nevertheless, our TFNBS analysis, which allowed us to find a predominant reduction of NOS between PD patients and HC with no a priori selection of tracts, as well as the graph analysis results, might indicate that these structural abnormalities are not a global phenomenon and suggests the implication of regional and predominantly posterior structural network disruption underlying cognitive impairment in PD.
By combining the different methods, we aimed to surpass their individual limitations and give a more accurate vision of structural connectivity in PD-MCI. TBSS is a method that can detect changes in FA throughout the WM of the brain simultaneously. At the same time, although it is an approachable method that delivers comprehensive images, it may also cover relevant aspects of the data, as it only makes use of the FA map and discards the orientations' information.
This leads to complications when it comes to anatomical specificity in regions where paths of different structures merge (Bach et al. 2014). On the contrary, DTI fiber tracking measurements are derived from individual WM connections, and they do allow us to distinguish between adjacent connections.
However, they may also introduce spurious WM connections that do not exist, a limitation that we had tried to minimize by ignoring streamlines intersecting fewer than two regions and only considering the connections between pairs of regions that were detected in at least 50% of the individuals. While other approaches to the method, such as constrained spherical deconvolution, had managed to improve it (Jeurissen et al. 2011). In addition, graph theory facilitates study of topological properties of an entire network, instead of an individual analysis of large numbers of tracts. However it has its limitations as well, as these parameters are influenced by the number of nodes of the network, which are indeed arbitrarily chosen. For this reason, we selected well-implemented and standardized atlases.
As expected, in line with previous studies (Segura et al. 2014), our neuropsychological results showed a significantly worse performance in verbal memory, semantic fluency, visuospatial and visuoperceptive functions, and processing speed in PD-MCI compared with PD without MCI and HC. However, although altered WM has been recurrently associated with PD-MCI, we did not find significant correlations between cognition and WM measures in accordance with previous studies (Agosta et al. 2014). Although there are several authors who found significant correlations between neuropsychological performance and FA decreases (Zhang et al. 2020, review), they usually combine PD with and without MCI. Greater variability in the degree of cognitive impairment as well as in FA reductions favors the finding of correlations. It is probable that in our sample there is not enough variability within the PD-MCI group to provide statistical significance. Regarding the studies using NBS, only one reported significant correlations between the neuropsychological performance and graph measures, but they did not distinguish between PD with and without MCI (Wang et al. 2019).
On the contrary, it could also be considered that cognitive impairment is mainly explained by GM degeneration. For example, when both GM and WM changes are considered in the same sample, WM appears to be explaining just a small part of the degenerative pattern. In Inguanzo et al. (2021), we used GM and WM measures to perform a hierarchical cluster analysis, and we found three subgroups, of which only one presented WM alterations. Accordingly, cognitive performance in PD has been consistently seen to correlate with GM structural parameters (Garcia-Diaz et al. 2018; Mak et al. 2014), and with functional connectivity (Baggio et al. 2015).
Baggio and colleagues (2015) found that PD-MCI patients had reduced functional connectivity between the dorsal attention network and fronto-insular regions, as well as increased connectivity between posterior cortical regions and the default mode network, which in turn correlated with the attention/executive and visuospatial/visuoperceptual functions. Graph theory approaches also showed that PD-MCI had increased clustering coefficient, small-worldness, and modularity measures, which were negatively associated with visuospatial/visuoperceptual and memory scores (Baggio et al. 2014). All these taken together suggest that WM might be playing a secondary role in the cognitive impairment of PD.
Conversely, beyond the acceptance of MCI definition (Litvan et al. 2012) as useful clinical criteria to identify patients with worse cognitive profiles and dementia risk, recent evidence suggested the existence of a more complex picture, identifying PD subtypes based on neuropsychological, clinical, and MRI data (Dujardin et al. 2013; Uribe et al. 2016; Fereshtehnejad et al. 2017; Inguanzo et al. 2021). In light of our results, it could be suggested that the study of structural connectivity in PD subtypes might facilitate the study of different patterns of cognitive deterioration and shed light on their anatomical basis/substrates. Future studies should consider a whole-brain approach to better describe structural connectivity abnormalities in PD subtypes and its possible association with cognitive impairment. Moreover, combining neuroimaging with clinical data would allow for better precision in finding PD subgroups.
Conclusion
In conclusion, whole-brain structural connectivity techniques based on probabilistic tractography allow identification of reduced connectivity in fronto-striatal and posterior cortical connections related to cognitive decline in PD and are able to reveal potential structural connectivity indicators to classify PD disease phenotypes with high accuracy.
Footnotes
Authors' Contributions
C.J. and B.S. contributed to the research project conception and in the design of the study. A.A., A.C., and C.U. contributed to the acquisition of the data. A.I., R.S.-L., and G.M.-R. contributed to the analysis of the data and A.I., B.S., R.S.-L., G.M.-R., A.A., A.C., C.U., H.C.B., Y.C., M.J.M., F.V., N.B., and C.J. contributed to the interpretation of the data. A.I. and B.S. contributed to the draft of the article. A.I., B.S., R.S.-L., G.M.-R., A.A., A.C., C.U., H.C.B., Y.C., M.J.M., F.V., N.B., and C.J. revised the article critically for important intellectual content and approved the final version of the article.
Acknowledgments
We are grateful to all the participants in the study for their goodwill and generosity. We are also indebted to the Magnetic Resonance Imaging core facility of the IDIBAPS for technical support; and we acknowledge the CERCA Programme/Generalitat de Catalunya.
Author Disclosure Statement
No competing financial interests exist.
Funding Information
This study was sponsored by the Spanish Ministry of Economy and Competitiveness (PSI2013-41393-P; PSI2017-86930-P cofinanced by Agencia Estatal de Investigación [AEI] and the European Regional Development Fund), by Generalitat de Catalunya (2017SGR 748), Fundació La Marató de TV3 in Spain (20142310), and supported by María de Maeztu Unit of Excellence (Institute of Neurosciences, University of Barcelona) MDM-2017-0729, Ministry of Science, Innovation and Universities. A.I. and A.C. were supported by APIF predoctoral fellowship from the University of Barcelona (2017–2018). AA was supported by a fellowship from 2016, Departament d'Empresa i Coneixement de la Generalitat de Catalunya, AGAUR (2016FI_B 00360). C.U. was supported by the European Union's Horizon 2020 research and innovation programme under the Marie Sklodowska-Curie fellowship (grant agreement 888692). M.J.M. received honoraria for advice and lecture from AbbVie, Bial, and Merz Pharma and grants from Michael J. Fox Foundation for Parkinson Disease (MJFF): MJF_PPMI_10_001, PI044024. Y.C. has received funding in the past 5 years from FIS/FEDER, H2020 programme, Union Chimique Belge (UCB pharma), Teva, Medtronic, AbbVie, Novartis, Merz, Piramal Imaging, and Esteve, Bial, and Zambon. Y.C. is currently an associate editor for Parkinsonism and Related Disorders.
Supplementary Material
Supplementary Data S1
Supplementary Data S2
Supplementary Data S3
Supplementary Figure S1
References
Supplementary Material
Please find the following supplemental material available below.
For Open Access articles published under a Creative Commons License, all supplemental material carries the same license as the article it is associated with.
For non-Open Access articles published, all supplemental material carries a non-exclusive license, and permission requests for re-use of supplemental material or any part of supplemental material shall be sent directly to the copyright owner as specified in the copyright notice associated with the article.