
Abstract
Introduction:
VNS is an adjunctive neuromodulation therapy for patients with drug-refractory epilepsy. The antiseizure effect of VNS is thought to be related to a diffuse modulation of functional connectivity but remains to be confirmed.
Aim:
To investigate electroencephalographic (EEG) metrics of functional connectivity in patients with drug-refractory epilepsy treated by vagus nerve stimulation (VNS), between VNS-stimulated “ON” and nonstimulated “OFF” periods and between responder (R) and nonresponder (NR) patients.
Methods:
Scalp-EEG was performed for 35 patients treated by VNS, using 21 channels and 2 additional electrodes on the neck to detect the VNS stimulation. Patients were defined as VNS responders if a reduction of seizure frequency of ∼50% was documented. We analyzed the synchronization in EEG time series during “ON” and “OFF” periods of stimulation, using average phase lag index (PLI) in signal space and phase-locking value (PLV) between 10 sources. Based on graph theory, we computed brain network models and analyzed minimum spanning tree (MST) for responder and nonresponder patients.
Results:
Among 35 patients treated by VNS for a median time of 7 years (range 4 months to 22 years), 20 were R and 15 were NR. For responder patients, PLI during ON periods was significantly lower than that during OFF periods in delta (p = 0.009), theta (p = 0.02), and beta (p = 0.04) frequency bands. For nonresponder patients, there were no significant differences between ON and OFF periods. Moreover, variations of seizure frequency with VNS correlated with the PLI OFF/ON ratio in delta (p = 0.02), theta (p = 0.04), and beta (p = 0.03) frequency bands. Our results were confirmed using PLV in theta band (p < 0.05). No significant differences in MST were observed between R and NR patients.
Conclusion:
The correlation between VNS-induced interictal EEG time-series desynchronization and decrease in seizure frequency suggested that VNS therapeutic impact might be related to changes in interictal functional connectivity.
Impact statement
Electroencephalography (EEG) desynchronization has been proposed to be a mechanism for antiepileptic effect of vagus nerve stimulation (VNS). We measured interictal EEG time-series synchronization during stimulated (ON) and nonstimulated (OFF) periods in epileptic patients treated by VNS. Phase lag index differences between ON and OFF periods were measured in delta, theta, and beta bands only in responder patients. To our knowledge, our study is the first to statistically correlate interictal cortical desynchronization during ON periods with reduction in seizure frequency. Our result supports the hypothesis that the antiseizure effect of VNS is mediated by cortical desynchronization.
Introduction
Long-term vagal nerve stimulation (VNS) is a palliative, low-risk, surgical option for drug-resistant epilepsy. About 50% to 60% of patients achieve 50% reduction in seizure frequency after 1 year of treatment (Englot et al., 2016; Kawai et al., 2017; Panebianco et al., 2015). A recent meta-analysis (Dibué-Adjei et al., 2019) suggested that acute VNS implantation could reverse refractory status epilepticus, with an overall response rate of 74%. However, mechanisms underlying the effects of VNS remain misunderstood (Vonck and Boon, 2015).
The antiepileptic effect of VNS could be related to a diffuse cortical modulation of synchronization, as suggested in previous studies with animal models (Chase et al., 1967; Magnes et al., 1961; Zanchetti et al., 1952), electroencephalography (EEG) (Bodin et al., 2015), stereoelectroencephalography (SEEG) (Bartolomei et al., 2016), magnetoencephalography (MEG) (Babajani-Feremi et al., 2018; Mithani et al., 2019), or imaging evaluations in humans (Ibrahim et al., 2017; Mithani et al., 2019). Combining diffusion tensor imaging and resting-state MEG recordings in responder (R) and nonresponder (NR) patients, a multimodal connectomic prediction algorithm for VNS has been proposed (Mithani et al., 2019).
Ravan and colleagues (2017) showed that seizures occurring after VNS had a reduced ictal spread and a lower impact on cardiovascular parameters than seizures before implantation. Furthermore, they highlighted the correlation between ictal spatial synchronization and seizure frequency reduction (Ravan, 2017).
EEG interictal activity is also influenced by VNS. Wang and colleagues (2009) measured a progressive decrease in the number of interictal epileptiform discharges (IEDs) with time. These results were supported by intracranial recordings (Olejniczak et al., 2001). Although the mechanisms underlying the decrease in IEDs remain unknown, it could be related to a progressive EEG time-series desynchronization.
Bodin and colleagues (2015) measured a lower global level of EEG time-series synchronization in 19 patients with chronic VNS therapy (10 responder and 9 nonresponder patients) assessed by phase lag index (PLI) during ON periods versus OFF periods. Responders were characterized by a lower level of EEG synchronization compared with nonresponders in broadband (0.5–70 Hz), delta, and alpha frequency bands. Another study, in 5 patients with epilepsy who underwent SEEG recordings during ongoing VNS therapy (4 nonresponder and 1 responder patients), showed that interdependencies between 26 bipolar SEEG channels estimated by nonlinear regression analysis were higher during the ON periods in comparison with OFF periods in nonresponders. Decreased connections were observed during ON periods in comparison with OFF periods for the only responder patient, suggesting that therapeutic impact might be related to this mechanism (Bartolomei et al., 2016). Brain networks connectomic profiling and functional topology seem to be modulated by long-term VNS therapy and could be used to predict VNS clinical response. A network reorganization toward a higher integrated architecture has been measured in patients responding to VNS on preimplantation compared with postimplantation EEG PLI matrices (Fraschini et al., 2014). Furthermore, responders and nonresponders have accurately been discriminated using machine-learning algorithms for connectome profiling (Mithani et al., 2019), or MEG-based graph measures and a Bayes classifier (Babajani-Feremi et al., 2018).
Interictal and ictal excess of synchrony characterized the seizure-onset zones and propagation networks (Besson et al., 2017; Clemens et al., 2019; Englot et al., 2015; Lagarde et al., 2018). We hypothesized that VNS could prevent seizure onset by causing a diffuse desynchronization during ON periods and reorganizing functional brain networks. To test those hypotheses, we aimed to evaluate the correlation between electrophysiological changes in synchronization during ON and OFF periods with the changes in seizure frequency. We also investigated whether VNS could modulate the topology of functional brain network.
Methods
Patients
The study did not modify the usual medical practices. All patients provided written informed consent according to the protocols validated by the DRCI (Direction Recherche Clinique Innovation) of the GHU Paris Psychiatry and Neurosciences. From January 2017 to April 2019, 42 patients with drug-resistant epilepsy implanted with a vagus nerve stimulator device (LivaNova, London, United Kingdom) underwent standard EEG in the neurophysiology department at Sainte Anne Hospital. Median implantation time was 7 years (range 4 months to 22 years). System diagnostics were performed routinely at follow-up visits, and impedances of the VNS leads were in the normal range for all patients, responders, and nonresponders. Seven patients were excluded from analysis: two because of missing clinical data and five had noninterpretable EEG data (one had infraclinic ictal discharge, two had major and permanent movement artifacts, and two had an insufficient number of ON periods).
Participants were assigned to two different groups according to their clinical response to VNS therapy, in terms of change in monthly seizure frequency before and after VNS implantation. Baseline seizure frequency was assessed from reports in the 6 months before implantation (seizure diary, reports from patients and their relatives). Seizure frequency was expressed as a composite of all seizure types experienced by the patient during the month preceding EEG recording. The group in which the number of seizures had reduced by ∼50% was defined as R; the other group as NR.
EEG recording
Scalp-EEG was recorded using a 21-channel EEG system (Natus Neuro, WI) positioned according to the 10–20 system (FP1, FP2, F7, F8, F3, F4, A1, A2, T3, T4, C3, C4, T5, T6, P3, P4, O1, O2, Fz, Cz, and Pz) with 2 additional bipolar electrodes on the neck to detect the VNS stimulation artifact. Signals were acquired during a 30 min period of nonsleep eyes-closed resting state, ∼4 months after the VNS surgery and seizure free for ∼3 h. Vigilance was closely monitored, and patients were orally stimulated in case of drowsiness. Signals were digitized at a sampling rate of 256 Hz and band-pass filtered between 0.5 and 70 Hz. For each subject, the first sixteen 8.19 sec artifact-free epochs were selected with a visual inspection for analysis (2048 samples in both ON and OFF periods). OFF epochs were selected both at the beginning of the EEG recording and between ON periods. They were band-pass filtered after standard EEG frequency bands: delta (0.5–4 Hz), theta (4–8 Hz), alpha (8–13 Hz), beta (13–30 Hz), and broadband (0.5–70 Hz).
Phase lag index
The PLI measures the asymmetry of the distribution of phase differences between two signals. It is less affected by the influence of common sources and active reference electrodes. The method used to calculate the PLI has been described in detail previously (Stam et al., 2007). A PLI value of zero indicates either no coupling or coupling with a phase difference centered ∼0, while a PLI value of 1 indicates perfect phase locking plus or minus pi. PLI computation was performed using Brainwave software. A mean global PLI was calculated by averaging PLI values from bipolar EEG channels. Mean global PLI values were compared for each frequency band between ON and OFF periods and between the R and NR groups.
Phase-locking value
The phase-locking value (PLV) is an estimation of the instantaneous phase relation between oscillators using Hilbert Transform or time–frequency representations (Lachaux et al., 1999). Before measuring PLV, source reconstructions were conducted using Brainstorm (Tadel et al., 2011), an open access toolbox, released under the terms of the GNU general public license. Realistic mesh models of the brain surface, skull, and scalp were extracted from the ICBM152 template MR image, using the default number of 1922 vertices per layer. The surface was divided into 10 broad regions of interest as defined by the Desikan-Killiany atlas (Mahjoory et al., 2017). The forward model for EEG source imaging was calculated using three shell models provided by the OpenMEEG package (Gramfort et al., 2013). The conductivities used for the three compartments were as follows: σ brain = 1 S/m, σ skull = 0.0125 S/m, and σ skin = 1 S/m. Inverse estimation of sources was carried out using the standardized low-resolution brain electromagnetic tomography algorithm (sLORETA).
Graph analysis
Based on Graph Theory, brain networks can be represented as graph, set of elements (nodes), and their interconnections (edges), which can be summarized in the form of a connection matrix (Sporns, 2014; Stam, 2004). The combination of pairwise connection in all channels results in matrix of 19 × 19 entries, where each element corresponds to the PLI value. The network's topology is defined by the relations of all nodes and edges. It can be analyzed using the minimum spanning tree (MST), a subnetwork that connects all nodes while minimizing the link weights, without forming loops. The MST algorithm minimizes bias in data analysis when comparing networks (Tewarie et al., 2015). All the analyses were performed using the Brainwave software (version 0.9.70). The MST of every matrix was computed by Kruskal's algorithm, extracting the measures of diameter (longest distance between any two nodes), mean eccentricity (longest distance between a node and all other nodes in the graph), normalized leaf number (number of nodes with degree = 1 divided the total number of nodes, where degree represents the number of edges the node has to other nodes), and betweenness centrality (fraction of all shortest paths that pass through a particular node) (Stam, 2014).
Statistical analysis
Statistic analysis was performed using StatView® software. The Wilcoxon test, the Mann–Whitney test, and Spearman's rank correlation were used for paired data (ON vs. OFF periods), nonpaired data (R vs. NR), and regression analyses (correlation between the PLI values and changes of seizure frequency), respectively. Subject demographics and clinical characteristics were analyzed using the Mann–Whitney test for continuous variables, and chi-square analysis or Fisher's exact test for nominal data. Within each frequency band and for each patient, multiple comparisons of PLI across EEG channels and across regions in PLV matrices were corrected by false discovery rate. A MANOVA with Bonferroni Dunn's adjustment for multiple comparisons in each frequency band was used for graph metrics. A significance level of 0.05 was used.
Results
Patients demographics and clinical characteristics
From January 2017 to April 2019, 35 patients were included in the analysis, 20 responders and 15 nonresponders, treated by VNS for an average of 6.6 years (range 4 months to 22 years). The characteristics and stimulation parameters did not differ statistically between the two groups (Table 1). There was a higher percentage of patients with generalized epilepsy in the responder group; however, the difference was not significant (p = 0.3).
Demographic and Clinical Characteristics
Continuous variables are indicated by mean ± standard deviation.
p-Value calculated using the Mann–Whitney test.
Chi-squared test.
Fisher's exact test.
CBZ, carbamazepine; FBM, felbamate; LCM, lacosamide; LTG, lamotrigine; LVT, levetiracetam; NR, nonresponders; OXC, oxcarbamazepine; PER, perampanel; PHB, phenobarbital; PHT, phenytoin; R, responders; RFM, rufinamide; TMP, topiramate; VBA, vigabatrin; VPA, valproic acid; ZNS, zonisamide.
Effect of VNS therapy on EEG time-series synchronization
In the responder group, interictal EEG time-series synchronization during ON periods was lower than that in OFF periods, in broadband (0.5–70 Hz) (PLI ON = 0.1046 ± 0.021, PLI OFF = 0.1122 ± 0.028, z = −2.7, r = −0.59, p = 0.008), in delta (PLI ON = 0.1592 ± 0.021, PLI OFF = 0.1694 ± 0.033, z = −2.7, r = −0.59, p = 0.009), theta (PLI ON = 0.1571 ± 0.025, PLI OFF = 0.1650 ± 0.029, z = −2.4, r = −0.54, p = 0.02), and beta (PLI ON = 0.0934 ± 0.033, PLI OFF = 0.1022 ± 0.045, z = −2.1, r = −0.47, p = 0.04) frequency bands.
There was no significant difference between ON and OFF periods in the alpha frequency band (PLI ON = 0.167 ± 0.049, PLI OFF = 0.175 ± 0.049, p = 0.1, z = −1.2, r = −0.26) (Fig. 1). In the nonresponder group, ON and OFF periods did not differ significantly in any frequency sub-band (broadband PLI ON = 0.101 ± 0.021, PLI OFF = 0.098 ± 0.021, p = 0.08, z = −1.8, r = −0.45; delta PLI ON = 0.156 ± 0.011, PLI OFF = 0.158 ± 0.018, p = 0.9, z = −0.1, r = −0.03; theta PLI ON = 0.159 ± 0.017, PLI OFF = 0.151 ± 0.015, p = 0.7, z = −0.5, r = −0.11; alpha PLI ON = 0.168 ± 0.035, PLI OFF = 0.166 ± 0.028, p = 0.5, z = −0.6, r = −0.16; beta PLI ON = 0.096 ± 0.018, PLI OFF = 0.0965 ± 0.017, p = 0.6, z = −0.14, r = −0.14).
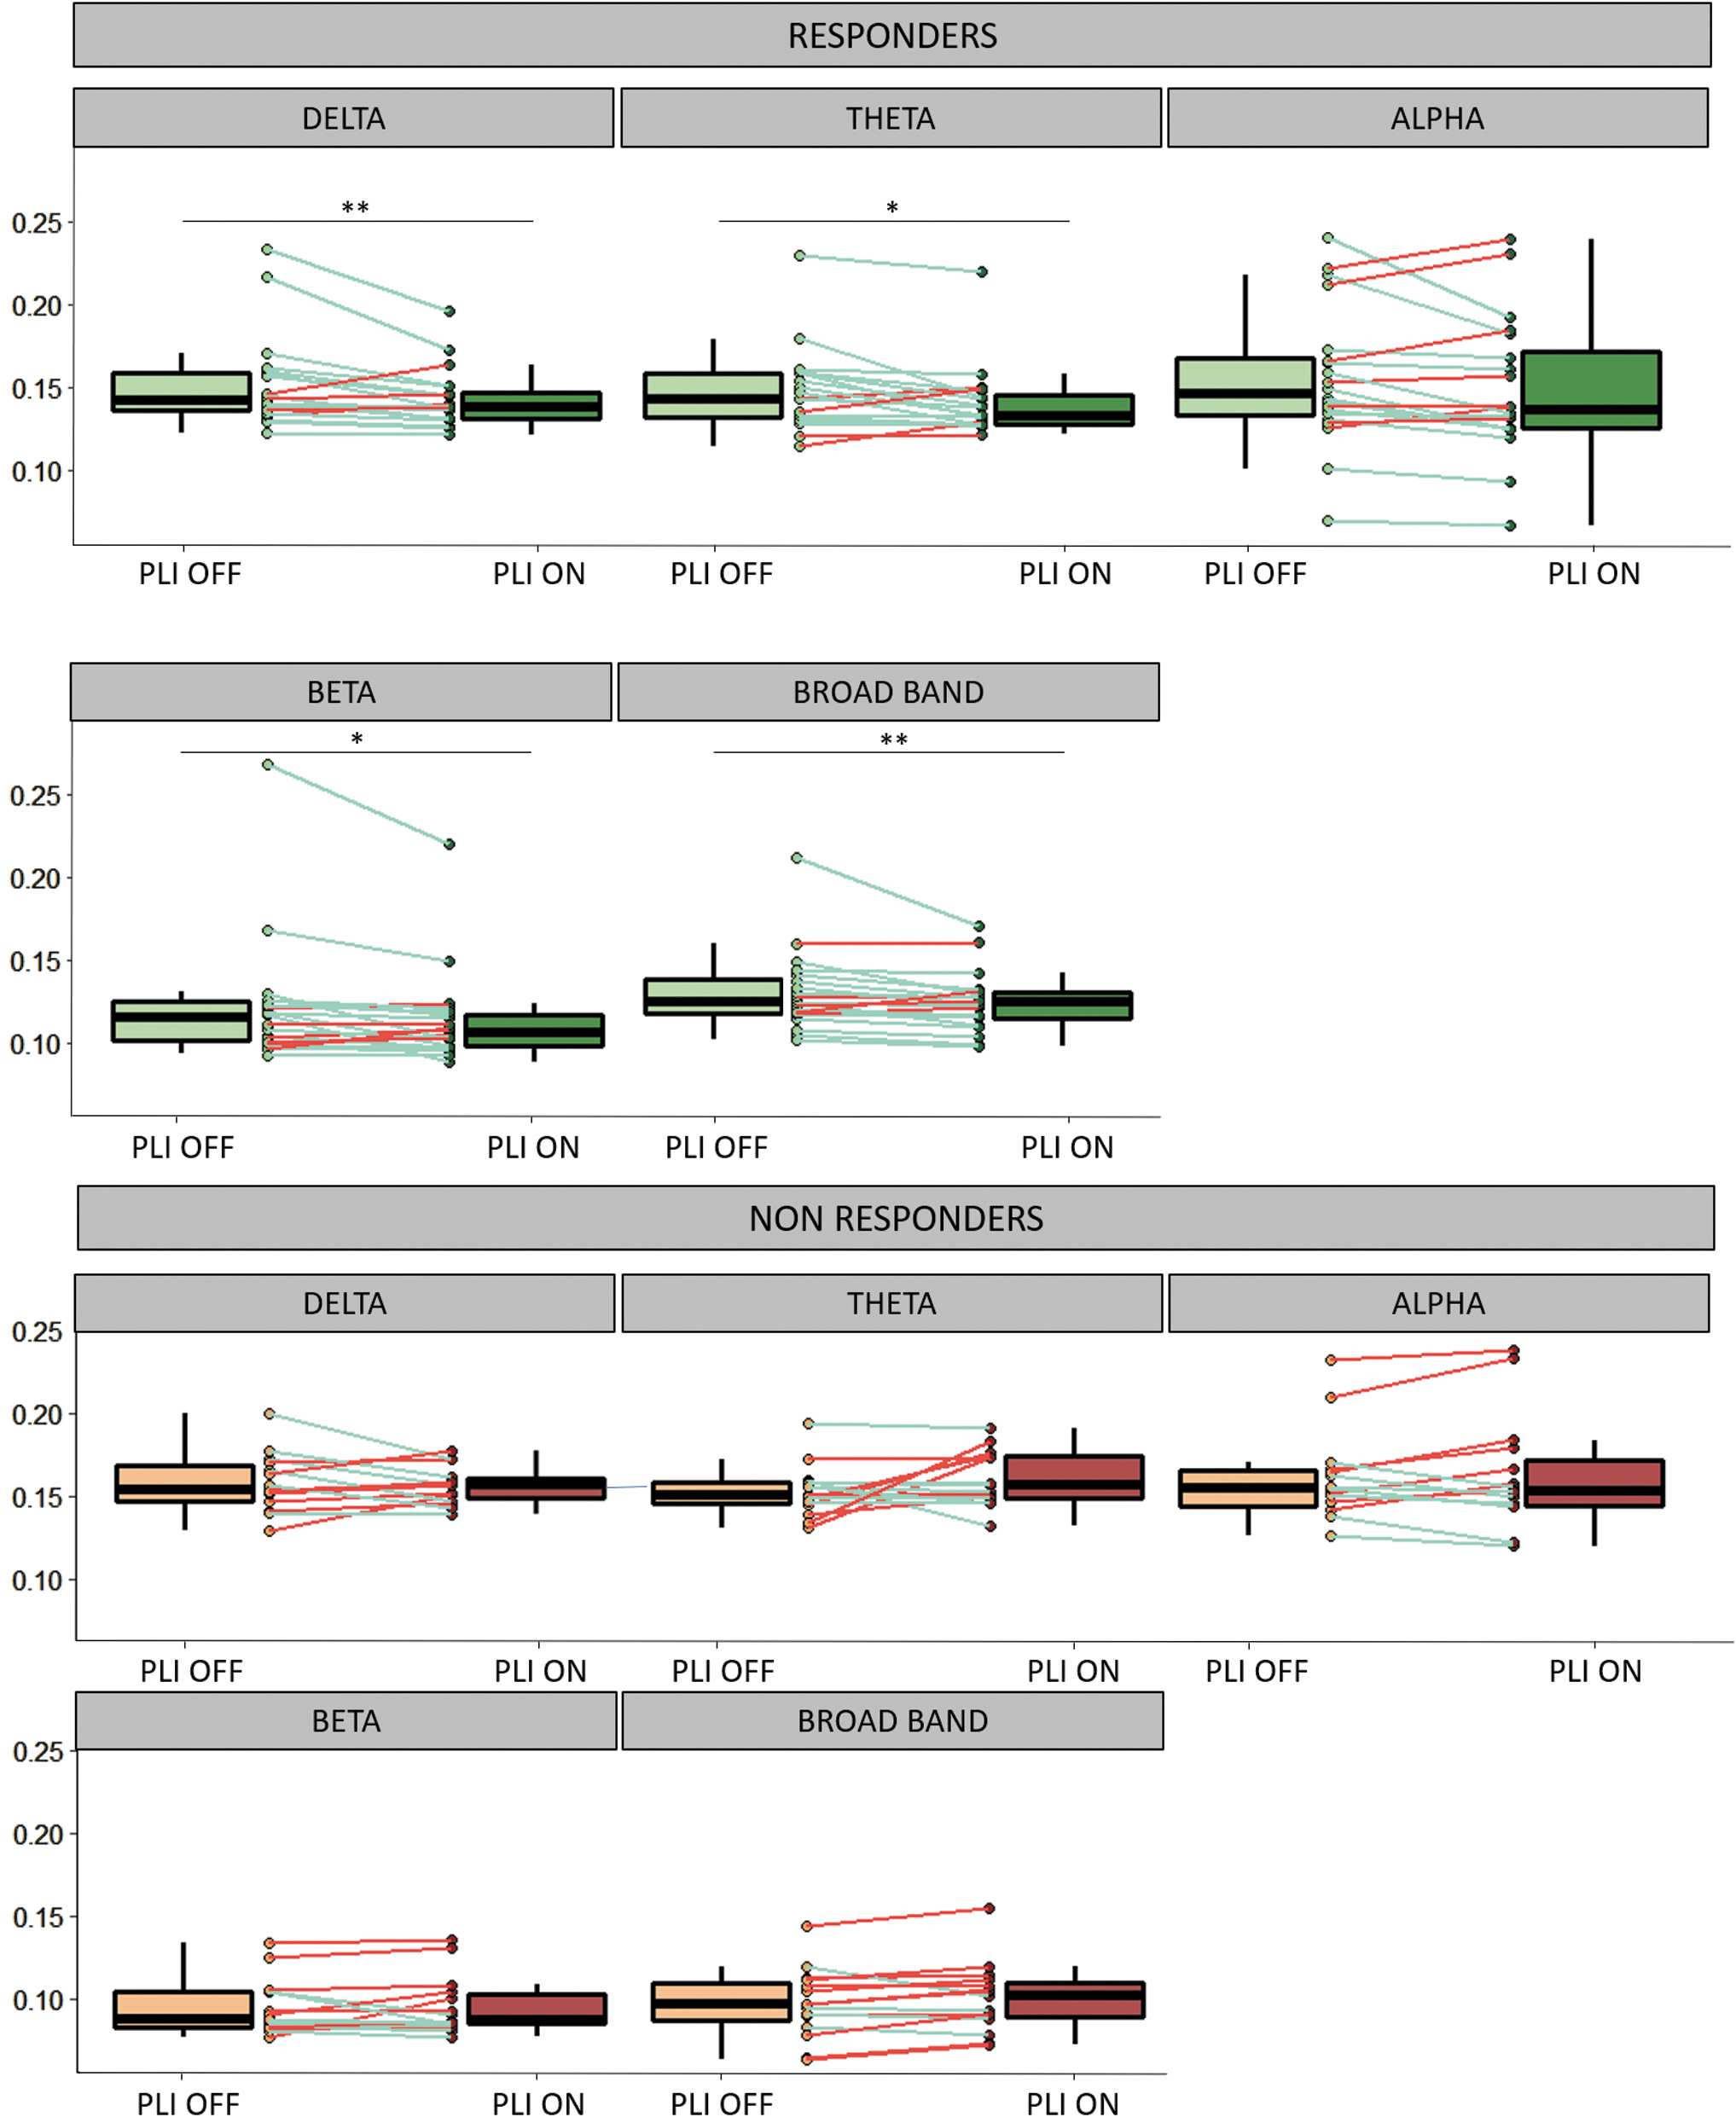
Mean PLI values during ON and OFF periods in responders and nonresponders. In each frequency band, average PLI values from each pair of EEG channels are reported in a box plot representation. Lower, upper, and middle lines of each box indicate the 25th, 75th percentiles and the median of each sample. The lines extending above and below the box represent the sample minimum and maximum. Individual data are reported by points and lines connecting data in ON and OFF periods (green lines: decrease of PLI during ON periods, red lines: increase of PLI during ON periods). Asterisks indicate significant variations (*p < 0.05, **p < 0.01, Wilcoxon's test). EEG, electroencephalography; PLI, phase lag index.
A decrease of interictal EEG time-series synchronization during ON periods was observed in 75% of R patients versus 27% of NR patients in broadband, in 80% of R patients versus 40% of NR patients in delta band, in 80% of R patients versus 53% of NR patients in theta band, in 70% of R patients versus 40% of NR patients in beta band. The performance of connectivity changes in distinguishing these two groups reported with receiver-operating characteristics curve showed poor discrimination ability (Supplementary Fig. S1). Area under the curve values were 0.76 (broadband), 0.66 (delta band), 0.74 (theta band), and 0.69 (beta band).
PLI values during ON periods did not statistically differ between responders and nonresponders (broadband p = 0.6, U = 133, r = −0.01; delta p = 0.9, U = 147, r = −0.02; theta p = 0.3, U = 117, r = −0.19; alpha p = 0.7, U = 138, r = −0.04; beta p = 0.2, U = 112, r = −0.21). PLI values during OFF periods did not statistically differ either between responders and nonresponders (broadband p = 0.2, U = 106, r = −0.25; delta p = 0.4, U = 122, r = −0.16; theta p = 0.1, U = 102, r = −0.27; alpha p = 0.6, U = 134, r = −0.09; beta p = 0.8, U = 141, r = −0.05).
To study the impact of other factors, we compared the PLI OFF/ON ratio in broadband between generalized and focal epilepsies, and found no differences (focal epilepsy (n = 24) PLI OFF/ON = 1.014 ± 0.095, generalized epilepsy (n = 11) PLI OFF/ON = 1.032 ± 0.114 Mann–Whiney p = 0.7, z = −0.35, r = −0.06).
We also compared the PLI OFF/ON ratio according to the delay from VNS implantation and VNS parameters (frequency, intensity). The ratio did not differ between patients implanted for more or less than 1 year (>1 year [n = 27]: PLI OFF/ON = 1.013 ± 0.97; <1 year [n = 8]: PLI = 1.043 ± 0.114), Mann–Whitney p = 0.05, z = −0.7, r = −0.12). The ratio did not differ between patients stimulated at 20 Hz or at frequency >20 Hz (20 Hz [n = 20]: PLI OFF/ON = 1.018 ± 0.119; >20 Hz [n = 15]: PLI OFF/ON = 1.023 ± 0.070, p = 0.7, z = −0.44, r = −0.08). The PLI OFF/ON ratio did not differ between patients stimulated at a frequency greater or less than 2 mA (≥2 mA, n = 18: PLI OFF/ON = 1.013 ± 0.106 [<2 mA, n = 17, PLI = 1.027 ± 0.097], Mann–Whitney p = 0.6, z = −0.49, r = −08).
Correlation between changes in EEG time-series synchronization and response to VNS therapy
We correlated changes in synchronization between ON and OFF periods with the antiseizure effect of VNS, estimated by the percentage change in the frequency of seizures. The decrease in seizure frequency was measured in 29 of the 35 patients because the precise number of some nonmotor seizures could not be assessed. The desynchronization during ON periods, estimated by the PLI OFF/ON ratio, was correlated with the decrease in seizure frequency in broadband (Spearman's correlation Rho = 0.6; p = 0.001, R 2 = 0.4), delta (Rho = 0.4; p = 0.02, R 2 = 0.1), theta (Rho = −0.4; p = 0.04, R 2 = 0.1), and beta (Rho = 0.4; p = 0.04, R 2 = 0.1) bands (Fig. 2). We observed that four NR patients had seizure worsening. Some of them were characterized by an increased synchronization during ON periods (Fig. 2).
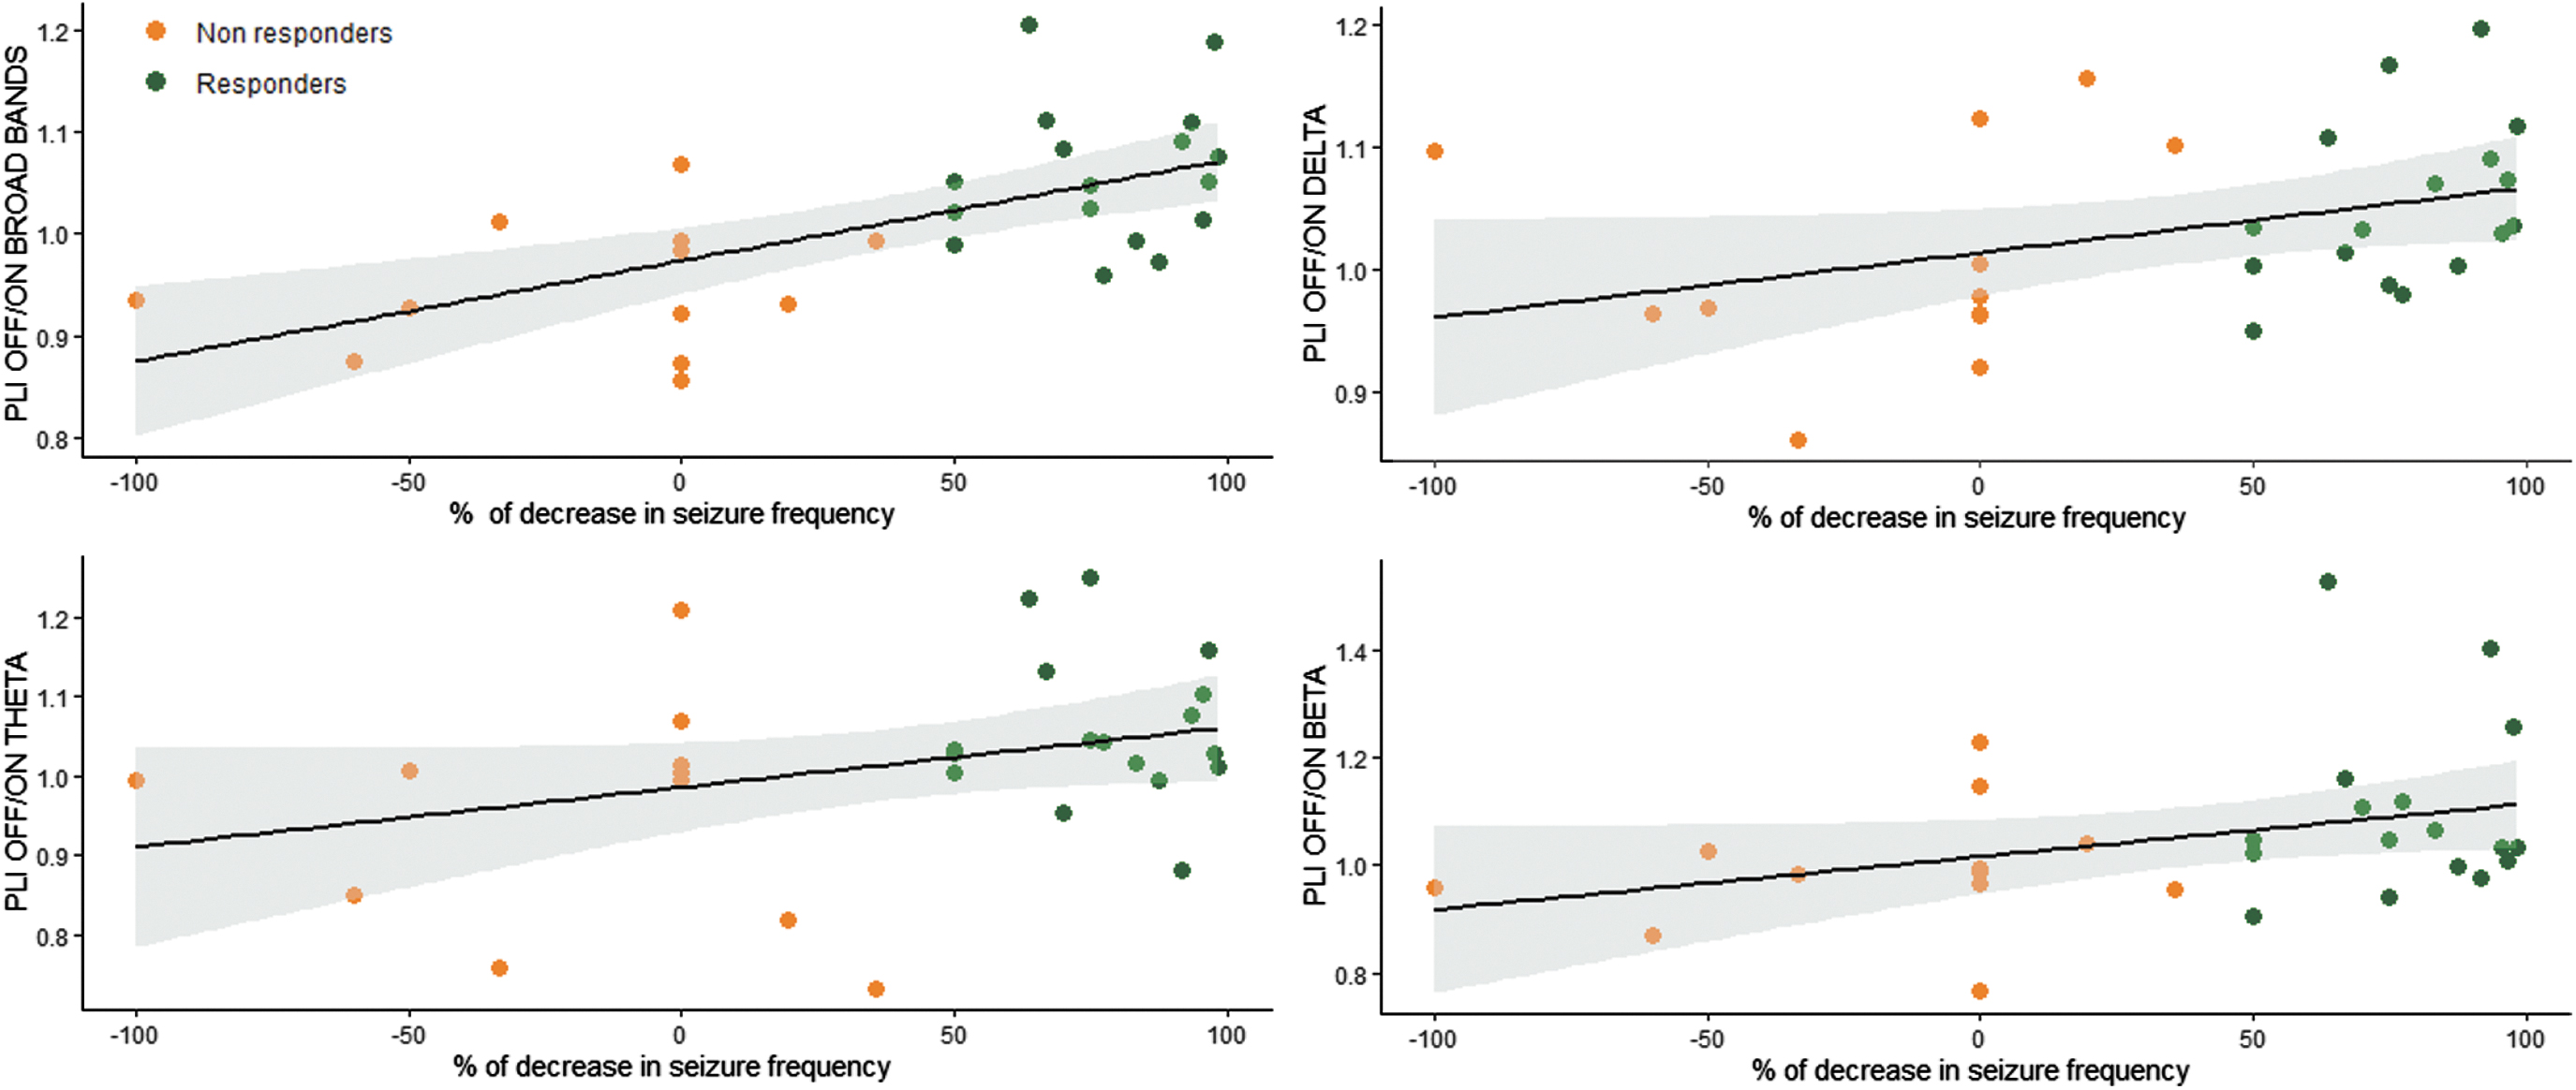
Correlation between decrease in seizure frequency and the PLI OFF/ON ratio in broadbands (0.5–70 Hz), delta, theta, and beta bands. Linear regression slope and 95% confidence interval in responders and nonresponders are indicated.
Topographical variation of synchronization
In responders, in several channel pairs, at sensor level PLI values tended to be lower during ON periods than during OFF periods. After adjustment for multiple comparison, there was no significant difference in any frequency band (Fig. 3). We estimated EEG synchronization using PLV measures after source localizations in 10 large cortical regions: frontal, central, parietal, occipital, and temporal regions bilaterally. In the responder group, ON period PLV was lower than OFF period PLV in the theta frequency band, between left frontotemporal and frontoparietal regions and between right frontal–left temporal and left frontal–right central regions (p < 0.05, t-test matched after correction for multiple comparisons). This result was observed only in responder patients (Fig. 4).
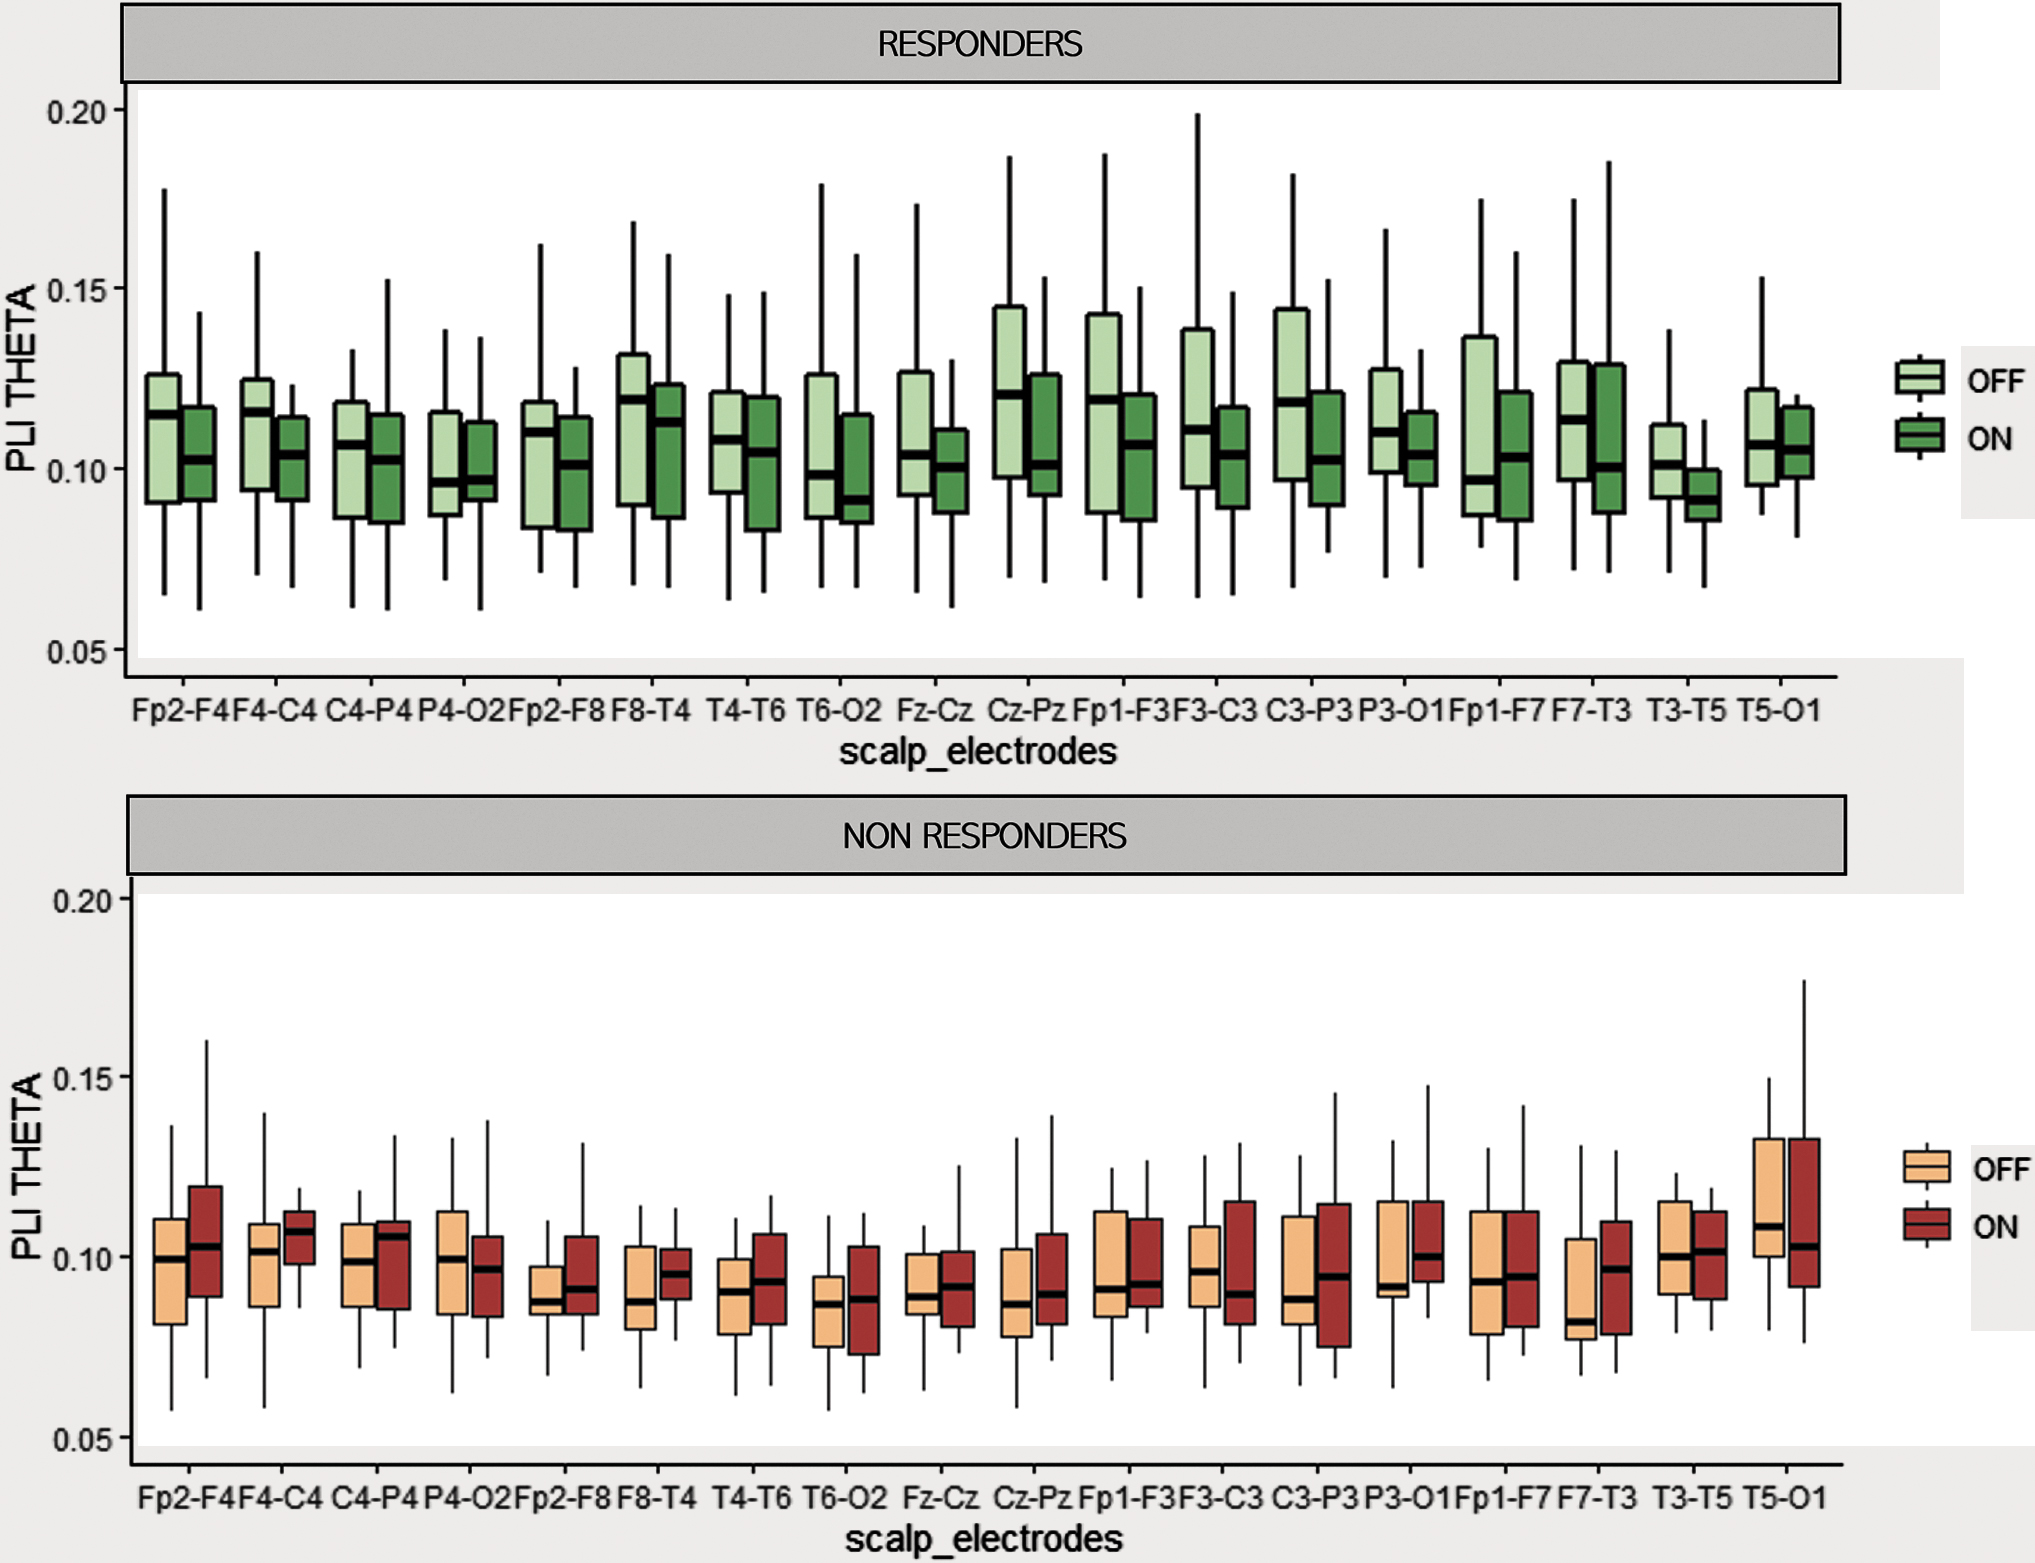
Mean PLI values during ON and OFF periods, in responders and nonresponders for each pair of electrodes. In theta frequency band, PLI values from each channel are reported in a box plot representation. Lower, upper, and middle lines of each box indicate the 25th, 75th percentiles and the median of each sample. The lines extending above and below the box represent the sample minimum and maximum.
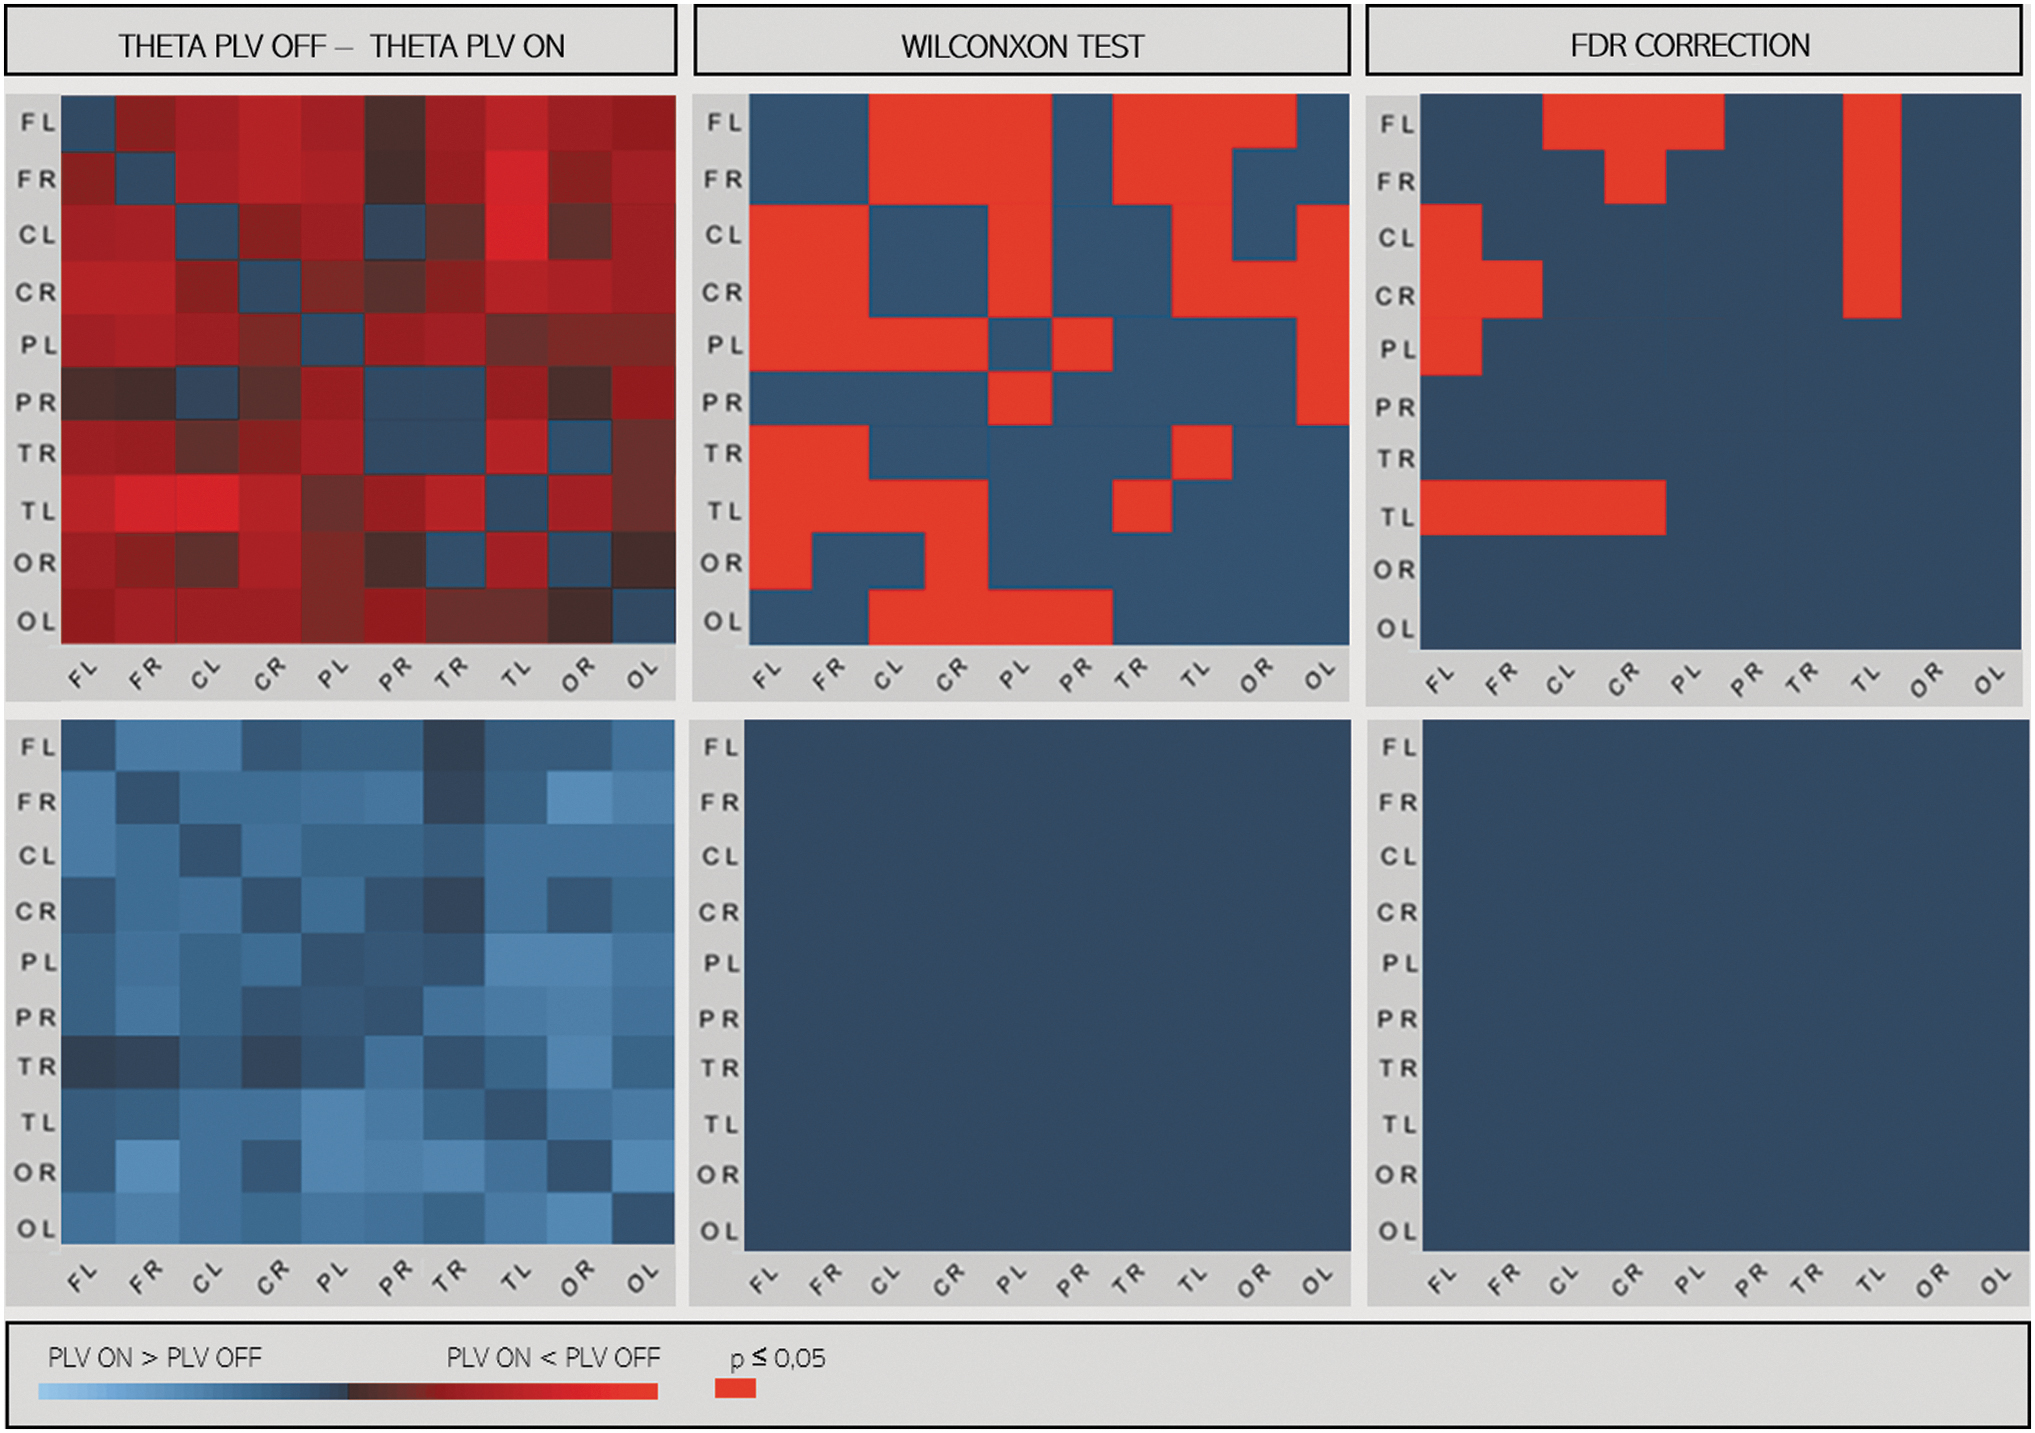
PLV matrices in source space between 10 regions in responders (at the top) and nonresponders (at the bottom) in the theta band. In left panels: differences between PLV matrices during ON and OFF epochs (PLV ON − PLV OFF). In right panel, significant differences with the Wilcoxon test and after correction by the FDR are represented in red (p < 0.05). C, central; F, frontal; L, left; O, occipital; P, parietal; PLV, phase-locking value; R, right; T, temporal.
Graph metrics
Results of MST analysis are shown in Table 2, and the results of statistic comparisons are reported in Supplementary Table S1. MST parameters (leaf ratio, eccentricity, diameter, betweenness centrality) did not differ between responders R and NR, nor between ON and OFF periods in any frequency bands after correction for multiple comparison.
Summary of Minimum Spanning Tree Results
Values are expressed as mean and standard deviation.
MST parameters (leaf ratio, eccentricity, diameter, betweenness centrality), mean (standard deviation) in R and NR.
NR, nonresponders; R, responders; MST, minimum spanning tree.
Discussion
In this study, we measured interictal EEG time-series synchronization to investigate changes in functional connectivity induced by VNS in epileptic patients. The main results of our study were as follows: (i) we confirmed that VNS could modulate functional connectivity. Stimulation (ON) periods were associated with a reduction in EEG time-series synchronization assessed by PLI and PLV after localization of underlying sources; (ii) we correlated VNS-induced desynchronization with clinical responses. VNS-induced desynchronization was observed only in responder patients and was statistically correlated with seizure frequency changes; and (iii) we compared brain networks between responder and nonresponder patients and found no differences in average PLI or graph parameters.
Mean PLI stayed slightly >0.1. Similar PLI values were reported in other studies with epileptic patients (Stam et al., 2007; Wang and Meng, 2016), and also in patients with other neurological diseases such as Alzheimer's disease, brain tumors, and Parkinson's disease (Douw et al., 2010; Geraedts et al., 2018; Stam et al., 2009) and with other acquisition techniques such as MEG or high-density EEG (Douw et al., 2010; Hardmeier et al., 2014; Stam et al., 2009). The amplitude of EEG time-series desynchronization induced by VNS was moderate but consistent with previous studies (Bodin et al., 2015; Douw et al., 2010; Geraedts et al., 2018; Stam et al., 2009; Wang and Meng, 2016). In Bodin's study, which is closest to ours, ON/OFF differences were ∼0.01. In other studies, the intraindividual and even interindividual comparisons of functional connectivity assessment with PLI had similar amplitudes (Douw et al., 2010; Geraedts et al., 2018; Stam et al., 2009; Wang and Meng, 2016). A small difference is explained in part by numerous cofactors that influence interictal functional connectivity such as age (Smit et al., 2012, 2016), cognitive and psychiatric coexisting conditions (Yoo et al., 2018), epilepsy types (Li Hegner et al., 2018) and treatments (Clemens et al., 2014; Haneef et al., 2015). Furthermore, the decrease in functional connectivity between ON and OFF periods does not need to be high to be relevant. A small change in neuronal network topology can induce explosive synchronization transition and activity propagation in the entire network (Wang et al., 2017).
VNS-induced cortical desynchronization could be due to the activation of the main cortical projections to the brainstem, including the nucleus tractus solitarius (NTS) and the locus coeruleus, as shown in animal models (Fazlali et al., 2016; Magnes et al., 1961). It is also likely that the thalamic nuclei, connected to the vagus nerve through the NTS and the parabrachial nucleus (Henry, 2002; Ruffoli et al., 2011), contribute to VNS responsiveness (Chae et al., 2003).
PLI differences between ON and OFF periods were measured in broadband and in various frequency sub-bands (delta, theta, and beta) as in previous studies (Bartolomei et al., 2016; Bodin et al., 2015). Because we compared mean PLI, we could not exclude the existence of topographical frequency-band–dependent specificity. Lower frequencies are more involved in long-range connections than higher frequencies (Casimo et al., 2016). PLV, after localization of underlying sources, confirmed our results only in theta frequency band. An explanation for this finding may be that our brain MRI model was divided into only 10 areas, thus neglecting short-distance interactions.
In Bartolomei and colleagues' (2016) SEEG study, changes in functional connectivity were not uniformly distributed but prominent in some anatomical regions. In our study, the investigation of specific topographical variation of synchrony was limited by the small number of EEG electrodes and by the heterogeneity of epileptic syndromes in our patient population. We used PLI, a robust connectivity measure and MST, unaffected by link density (Stam, 2004). In responders, in several channel pairs, PLI values tended to be lower during ON periods than during OFF periods, although the threshold of significance was not reached in any frequency band. PLV, after localization of underlying sources, was lower between some intra- and interhemispheric regions. Spatial sampling density and coverage are crucial for the performance of the source reconstruction (Song et al., 2015). We cannot guarantee that source reconstruction with <64 electrodes produced reliable results. High-density EEG in more homogeneous groups should be performed to better describe the distribution of functional connectivity modulation induced by VNS.
EEG time-series desynchronization was observed only in responders. Bartolomei and colleagues' (2016) study showed similar results. Although Bodin and colleagues (2015) measured a desynchronization in both responders and nonresponders, this effect was largest in responders. In another study, ictal spatial synchronization (EEG-based index of synchronizability) was correlated with reduction in seizure spread, reduction in secondary generalization and long-term responsiveness to VNS therapy (Ravan et al., 2017). Concerning connectivity and VNS, Table 3 indicates, in the different available references, the type of data used (electrophysiological vs. structural) and performed analysis (before implantation, comparison before vs. after VNS implantation, comparison between ON and OFF epochs). To our knowledge, our study is the first to statistically correlate interictal cortical desynchronization during ON periods with reduction in seizure frequency. However, because of the retrospective nature of our study, we could not exclude possible biases in seizure frequency collection.
Vagus Nerve Stimulation and Neuromodulation of Functional Connectivity
EEG, electroencephalography; MEG, magnetoencephalography; SEEG, stereoelectroencephalography; VNS, vagus nerve stimulation.
The comparison of brain networks in responder and nonresponders has led to contradictory results. Bodin and colleagues (2015) measured a lower global broadband level of EEG time-series synchronization in responders. However, we found no differences in average PLI between responders and nonresponders. Fraschini and colleagues (2014) found no differences in MST graph measures between responders and nonresponders as we have documented in our study. These results should be interpreted in the light of the multiple cofactors mentioned above, which could have influenced interictal functional connectivity. All these parameters were not statistically different between responders and nonresponders but could have biased results or masked slight differences. The different VNS parameters (pulse width, intensity, frequency) were not statistically different between R and NR but could also constitute confounding factors. The number of seizures, different between R and NR patients, could be another confounding factor. In our work, the interval between VNS implantation and EEG analysis and some VNS parameters (intensity, frequency) did not explain the VNS-induced interictal EEG time-series desynchronization.
Furthermore, methodological issues challenged at group-level network comparisons [for an overview, see van Diessen and colleagues (2015)]. Response to VNS seems to increase over time (Englot et al., 2016; Kawai et al., 2017). The duration of VNS was heterogeneous in our study, from a few months to >20 years. The ratio PLI OFF/ON ratio did not differ between patients implanted for more or less than 1 year. There were therefore no cumulative neuromodulatory effects of long-term stimulations evidenced in our study.
Prior implantation of VNS, using resting-state fMRI in a pediatric cohort, enhanced connectivity of the thalami to the anterior cingulate cortex and left insula was associated with seizure response after chronic VNS (Ibrahim et al., 2017). Another pediatric study with diffusion tensor imaging reported that white matter tracts differed between responders and nonresponders (Mithani et al., 2019). Higher fractional anisotropy was measured in VNS responders in the left thalamocortical, limbic, and association fibers. This presurgical enhanced connectivity may explain why some patients are sensitive to VNS, which, according to our results, induces a diffuse desynchronization. Few preliminary studies compared pre- and postimplantation EEG time-series synchronization on a small number of patients. They measured a decrease of EEG synchronization in theta and gamma frequency bands after surgery (Fraschini et al., 2013; Marrosu et al., 2005).
This study has several limitations. At first, no accepted standard exists for outcome measurement after VNS treatment. Outcome measurement after VNS insertion should include seizure frequency reduction but also quality of life, neuropsychological performances, diminished antiepileptic drug requirement, ictal and postictal severity. Classification incorporating assessment of seizure frequency, ictal and postictal severity and external magnet effects has been proposed (McHugh et al., 2007). In a future work, it should be interesting to correlate interictal cortical desynchronization during ON periods with a more complete outcome measurement than seizure frequency reduction alone.
Second, interictal spikes may influence large-scale brain connectivity (Coito et al., 2015, 2016; van Mierlo et al., 2019). In a future work, it should be interesting to (i) check that the number of spikes is not different between ON and OFF periods, or (ii) perform long duration EEG to select IEDs-free ON and OFF epochs for connectivity analyses.
In conclusion, our result supports the hypothesis that the antiseizure effect of VNS is mediated by cortical desynchronization. The factors that determine whether different brain networks subjected to the same stimulation are modulated or unaffected, increase or decrease their synchronization, remain unknown. Combining VNS with brain connectivity analysis could help not only to understand VNS mechanism of action but also afterward to predict VNS clinical response.
Footnotes
Authors' Contributions
A.S. contributed to bibliography research, study design, acquisition, analysis and interpretation of data, and wrote the first draft of the article; A.M. contributed to study design and concept, bibliography research, acquisition, analysis, and interpretation of data, critical revision of the article, read and approved the submitted version; E.P.R., C.S., B.C., and C.R. contributed to acquisition of data, critical revision of the article, read and approved the submitted version; B.T. contributed to acquisition of data, surgical contribution, critical revision of the article, read and approved the submitted version; F.C. and E.L. contributed to acquisition of data, bibliography research, critical revision of the article, read and approved the submitted version; M.G. contributed to study design and concept, acquisition of data, critical revision of the article, read and approved the submitted version.
Acknowledgment
The authors thank Sacha Posener for reviewing the English version.
Author Disclosure Statement
No competing financial interests exist.
Funding Information
This work was funded by “Institut National de la Santé et de la Recherche Médicale” “Poste d'Accueil Inserm program” (Aude Sangare).
Supplementary Material
Supplementary Table S1
Supplementary Figure S1
References
Supplementary Material
Please find the following supplemental material available below.
For Open Access articles published under a Creative Commons License, all supplemental material carries the same license as the article it is associated with.
For non-Open Access articles published, all supplemental material carries a non-exclusive license, and permission requests for re-use of supplemental material or any part of supplemental material shall be sent directly to the copyright owner as specified in the copyright notice associated with the article.