
Abstract
Introduction:
The storage of biospecimens is a substantial source of greenhouse gas emissions and institutional energy costs. Energy-intensive ultra-low temperature (ULT) freezers used for biospecimen storage are a significant source of carbon emissions. ENERGY STAR-certified ULT freezers have the potential to decrease the carbon footprint.
Objective:
Quantify the impact of an institutional-scale freezer conversion program on carbon emissions and energy costs.
Methods:
A ULT freezer energy use prediction model was developed to identify and replace the most inefficient freezers in the research building for this pilot, and eventually institution-wide. Multiple linear regression factors included the number of years of use, storage volume, and ENERGY STAR certification status. Electrical usage and carbon emissions were quantified before and after replacement with ENERGY STAR models. Logistical methods were developed to decrease the risks of exposure of frozen samples to ambient temperature during content transfers. Institution-wide energy costs were derived by converting electrical burden to electrical costs. Carbon footprint assessment from ULT freezer operation was computed using the U.S. EPA Greenhouse Gas Equivalencies Calculator.
Results:
The pilot project revealed an annual reduction of 310,493 kilowatt hours of electrical usage, equivalent to 134 metric tons of carbon emissions. Annual electrical costs were reduced by $55,889 resulting in an 8-year payback on the initial investment. Using the pilot results, we modeled the benefit of the freezer exchange across the entire institution. The modeling predicted that conversion of the institution’s remaining 1119 conventional ULT freezers to ENERGY STAR models would lower annual electrical usage by 7,911,549 kilowatt hours (3423 metric tons of carbon emissions), resulting in savings of over $1.4 million annually.
Conclusion:
Our methods make a large-scale initiative to replace energy-inefficient ULT freezers logistically possible, reduce carbon footprint, and demonstrate an attractive return on investment while proactively protecting valuable research materials.
Introduction
Life science research is energy and resource-intensive, with the potential for improved sustainability practices. Research laboratory operations use 3 times the energy of similarly sized offices with associated large carbon footprints. In 2023, the Wellcome Trust concluded that sustainable research strategies are not well developed with gaps between expert recommendations and actual practice. These gaps included insufficient institutional support, evidence-based tools, field-tested methods, as well as reliance upon voluntary efforts. 1
ULT freezers are commonly used for the storage of biological materials, with a typical set point of −80°C. To achieve these ultra-low temperatures, these units consume ≥20 kWh/day. Prior work has demonstrated ensuring oversight of ULT freezers can reduce energy use.2–5 Energy-efficient ULT freezer technology was first available in 2016 and was associated with a significant reduction in energy use. 6 Certified as ENERGY STAR by the U.S. Department of Energy, these models have been proposed as a solution to reduce the institutional carbon footprint. ENERGY STAR ratings are considered objective and unbiased analyses of energy efficiency.
The University of California, San Francisco (UCSF), has approximately 1200 ultra-low temperature freezers, 95% of which are older, non-ENERGY STAR models. The total electrical consumption of the ULT freezer fleet is millions of dollars per year in electricity costs, generating >5000 metric tons of carbon dioxide per year. In addition to the impact upon the environment and associated energy costs, many of these older freezers are at an increased risk of failure, resulting in compromised or destroyed research samples. To explore the real-world benefits of ULT freezer replacement, we documented the impact of an institutional-scale ENERGY STAR freezer conversion program on energy use, costs, and carbon emissions.
Methods
Freezer population data collection
A total of 1175 ULT freezers in 45 UCSF-affiliated buildings were inventoried, resulting in 24 potential factors for modeling energy use, including ENERGY STAR rating, storage volume, years in use, temperature set point, brand, and model, Supplementary Data S1, page 10.
Storage volume data collection
Freezer storage volume was available from product web pages. For discontinued models, we relied on information provided by suppliers. In instances in which suppliers no longer had access to this information, we obtained these data online via the surplus sales market.
Age data collection
Age was defined as the number of years a ULT freezer was in operation from the unit installation date. In most instances, the manufacturing year and installation year were the same. However, in some instances, the manufacturing year overestimated the age by up to 3 years. Previous studies have used both installation and manufacturing dates to characterize the ages of units.
Freezer energy use sample data collection
A total of 34 ULT freezers were selected from our population to create a statistical model, Supplementary Data S1, page 11. All sample units had a set point of −80°C. ULT units set to −70°C were not included as this set point has been associated with a reduction in energy consumption 30%–40%. 7 Centrica Panoramic Power monitoring sensors were used to measure energy consumption, minimize disruption to laboratory staff, and decrease the risks associated with unplugging a freezer during the installation of a monitor between the power cord and the outlet. A certified electrician installed the sensors to the appropriate circuits at the electric panel. Freezers were selected based on their proximity to each other and the identification of single freezers connected to a dedicated circuit. Panels that served multiple freezers were prioritized to minimize the number of panels requiring opening. Data points were collected at 15-minute intervals. Kilowatts (KW) and kilowatt-hours (kWh) for each ULT unit were calculated based on the amperage readings and panel details, including the number of phases/circuits, circuit breaker rate, panel voltage, and power factor. Each freezer was monitored for a minimum of 3 days. Our previous analysis of energy monitoring data collection intervals (range: 1–30 days) confirmed 3 days of data optimally and accurately represented the average daily energy use. Average annual energy consumption was calculated from data collected over the monitoring period. All freezers measured for our regression model, as well as those that comprised our candidates for replacement, were restricted to a single building with documented similar temperatures across all rooms.
Statistical modeling to predict freezer energy use
Our average daily energy use data for the selected ULT freezers (n = 34) was used to create a statistical model to identify the most energy-intensive ULT freezer replacement candidates. The multiple linear regression factors included the number of years of use, storage volume, and unit certification as ENERGY STAR. Statistical analysis was conducted using R (R Core Team, 2023). The details of the development and assessment of our statistical model are in Supplementary Data S1, page 3.
Modeling to forecast energy use
The energy impact of each ULT freezer over time is a function of its energy use plus the additional burden of heat exhaust placed on HVAC systems. 8 Any additional electricity used by HVAC systems was added to each unit’s plug draw to estimate the total energy burden. The impact of HVAC depends upon the local geographical climate. Estimates of HVAC electrical burden that account for local climate were available from the California Public Utilities Commission DEER database Workpaper ID: PGECOREF130. The HVAC impact value was estimated to be an additional 12% of the plug draw. 9
Mechanical decline was considered in calculations of the long-term energy use and costs of freezers. ULT freezers experience a gradual mechanical decline with age, requiring their compressors to increasingly operate longer to maintain the desired temperature. Consequently, mechanical decline draws more power and increased heat exhaust with each year of use. Prior work shows energy use increases by 3% with each year of use. 2 Our model compounded both the plug draw of the unit and the impact of HVAC at 3% per year. This estimate is likely to be conservative because the NIH data was collected from well-maintained freezers, in contrast to typical ULT freezers. 2
Target freezers selection
We applied our statistical model to identify 43 of the most inefficient freezers in the building where we conducted our pilot, Supplementary Data S1, page 12. The building contained 187 freezers at the beginning of our study. The application of our predictive model for energy use yielded an expected value for energy use per cubic foot of storage volume. This metric provided two options by which freezers could be selected for replacement with ENERGY STAR freezers. One option was to remove freezers with the greatest total energy use, which is calculated by multiplying energy use per cubic foot by the storage volume for each unit. The second option, which we ultimately chose, was to target the most energy-inefficient freezers: those with the highest energy use per cubic foot of storage volume, because previous research has demonstrated that inefficient energy consumption per cubic foot of storage is a marker for advanced mechanical decline. 2 In selecting ULT freezers for replacement, we assumed that any ULT freezer might at some point be set to −80°C and consequently ignored temperature settings other than −80°C. For example, many labs are adjusting freezer set points to −70°C in an effort to be greener. 7 Our analysis to identify freezers for replacement was performed in October 2019. Labs were notified, but the program was paused during COVID restrictions and resumed in November 2020.
Incentives for freezer consolidation
Our project team had the ambitious goal of removing more ULT units than those we installed. We incentivized freezer consolidation by purchasing a complete set of new freezer racks for those laboratories willing to consolidate the contents of two freezers into one. Free freezer racks were also purchased for labs with horizontal format chest freezers, enabling the transition to the vertical format of the ENERGY STAR units.
Freezer content transfers
Our goal was to minimize the time that contents were exposed to ambient temperature during the transfer from old to ENERGY STAR freezers. The UCSF Facilities team provided a designated area with the proper electrical infrastructure to enable the old freezers to be placed next to the new ENERGY STAR freezers that were pre-cooled to −80°C. To accommodate freezers of either 208 V or 115 V voltage to be plugged in next to each other, we used two general-purpose portable ground fault circuit interrupter (GFCI) “spider boxes” manufactured by Leviton Manufacturing Co., Inc. and purchased through W.W. Grainger, Inc. (Item description: 6-GFCI Temporary Portable Power, item number 6LP37).
Modeling to forecast energy costs
The impact of ULT units on an institution’s energy costs is the sum of the costs of all ULT freezers. Energy costs are derived by converting electrical burden to electrical costs. The forecasted energy rate for any future year was compounded using the institutional historical average rate increase of 3.5% for the number of study years.
Carbon footprint assessment
The carbon footprint assessment from ULT freezer operation was computed using the U.S. EPA Greenhouse Gas Equivalencies Calculator. 10 The calculator converts energy data to carbon equivalents.
Results
Project costs
Our project costs were $679,837 and are detailed in Supplementary Data S1, page 13. Our project received financial resources from a
Statistical model to predict freezer energy use
Linear regression analysis resulted in the statistical model of energy use below (Fig. 1). To normalize for differences in storage volume, our model estimated energy use per cubic foot. Our model yielded an R-squared value of 0.6862, revealing that three factors—ENERGY STAR designation, age and storage volume, explained 68.62% of the variation in the energy consumption per cubic foot of storage. To characterize the accuracy of our predictive model, we predicted the energy use on 7 ULT freezers using our statistical model and directly measured their energy use. The mean absolute percentage error between measured and predicted energy use was 7.5%.
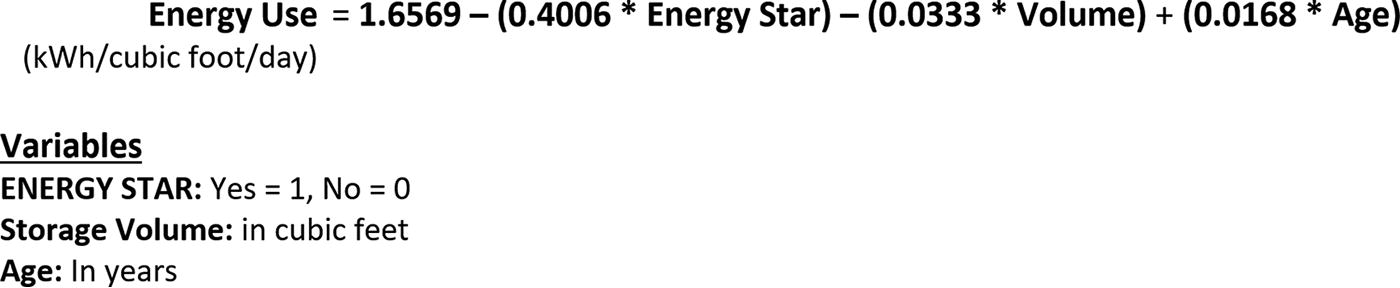
Statistical model to predict energy use. Age and storage volume sources are discussed in Methods. ENERGY STAR rating can be confirmed through the DOE website. 6
Replacement of inefficient freezers
Our institution-wide inventory of 1175 ULT freezers revealed only 62 units (5%) were ENERGY STAR-rated units, providing an opportunity to replace older units with more energy-efficient models. We applied our statistical model to replace 43 of the most inefficient freezers in one building. Figure 2 characterizes the energy savings between the replaced and installed units. Two laboratories were able to consolidate their contents into one ENERGY STAR freezer, resulting in the installation of only 41 ENERGY STAR freezers.
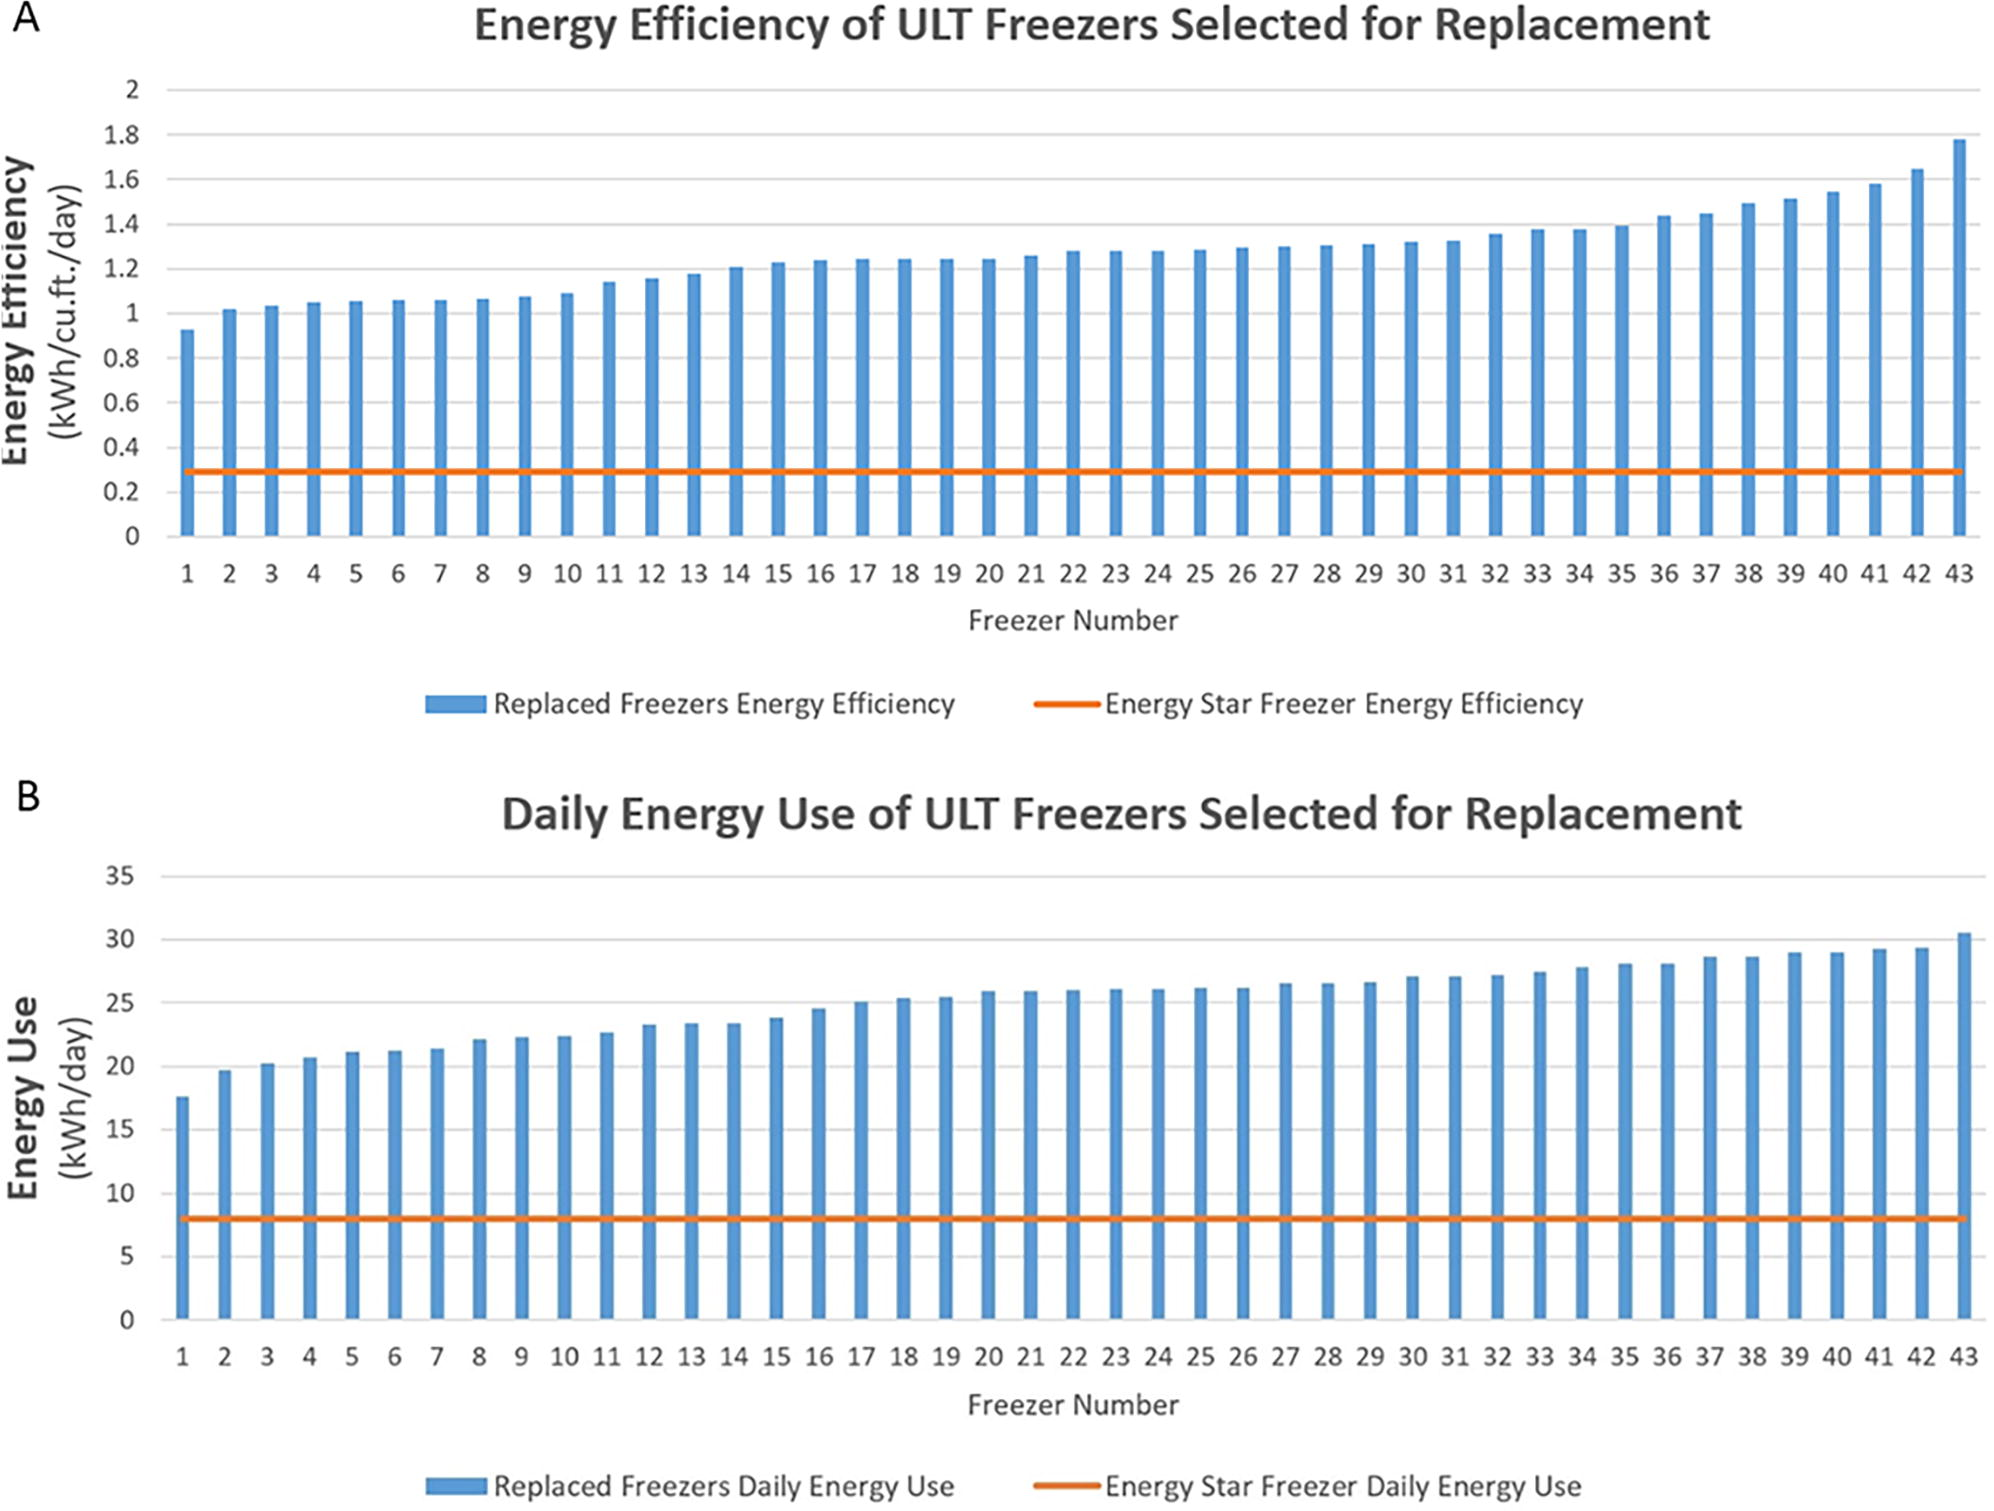
Energy use of replaced and installed ultra-low temperature freezers.
Those laboratories exchanging their units for an ENERGY STAR ULT freezer realized the additional benefit of gaining more storage for the same area of floor space. The average storage volume gained was 7.2 cubic feet.
The average age of the units replaced was 17.5 years. Previous studies have demonstrated the duty cycle of ULT freezers approaches 100% at 10 years of age, resulting in continuous operation to maintain ultra-low temperature set points. 2
A significant and unexpected finding from this project was that the replacement of inefficient ULT freezers protected research materials. Our approach to select freezers based on electrical use per cubic foot identified the most inefficient units and had the added benefit of biasing our selection for units at risk of failure: those in which the compressors were working at capacity to maintain temperature set points. Thirty-five percent of the replaced units exhibited symptoms of operational failure, and 5 units began failing and were prioritized for replacement. This corroborates previous research revealing that inefficient energy consumption per cubic foot of storage is a marker for advanced mechanical decline. 2
A designated space to perform content transfers facilitated the safe transfer of frozen research materials between freezers. No unit experienced a temperature increase of greater than 4°C when either the old freezers or new freezers were unplugged and rolled to and from the staging area.
Energy use and costs forecasting
We developed the energy use forecasting model in (Fig. 3) to calculate the long-term impact of ULT units on institutional energy use. The model predicts annual energy use as kilowatt hours for any number of freezers. Our model accounts for the factors previously discussed, briefly, energy efficiency decline and HVAC impact in the context of local climate. Supplementary Data S1, page 7 provides an example using our energy use forecasting model to forecast energy use.
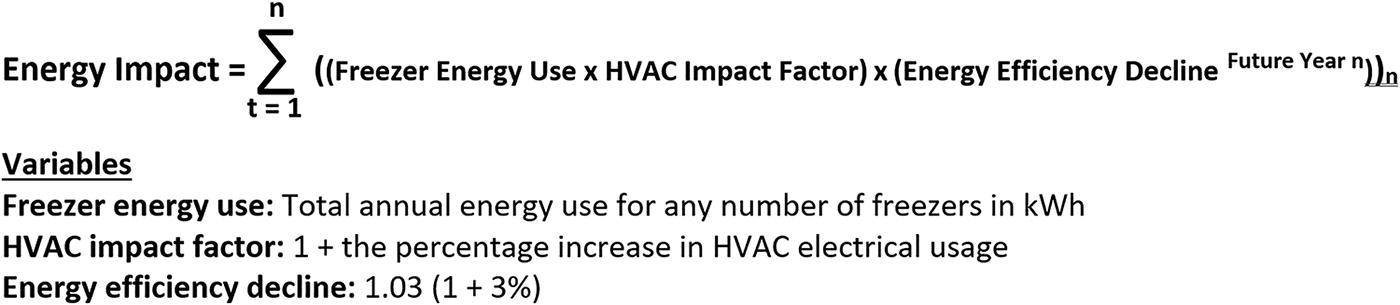
Model to estimate the energy burden of ULT freezers. The model forecasts the total annual energy use starting from the sum of the current energy use of any number of freezers. HVAC Impact factor equals 1 + the percentage increase in HVAC electrical usage from the California Public Utilities Commission DEER database, as described in the main text. Annual Energy Efficiency Decline equals 1.03 (1 + 3% annual decline in energy efficiency with each year of use). 2
We developed the model in (Fig. 4) to predict the long-term institutional energy costs for any number of freezers. The energy costs forecasting model applies energy costs to the results of the energy use forecasting model (Fig. 3) and accounts for annual increases in energy rates. In Supplementary Data S1, page 8, we provide an example of how to calculate the future energy costs of a representative ULT freezer.

Model to estimate the energy costs of ULT freezers. The model forecasts the total annual energy costs. The model uses output from the energy burden forecasting model (Fig. 3).
Energy use and costs forecasting results
Our program removed 43 energy-inefficient freezers and replaced them with 41 ENERGY STAR-certified ULT freezers. Figure 5a shows the results of using energy use forecasting model (Fig. 3) to forecast the total energy use of the replaced and installed units. Two alternative energy use scenarios are shown: continuing the use of the older freezers versus replacing them with ENERGY STAR systems.
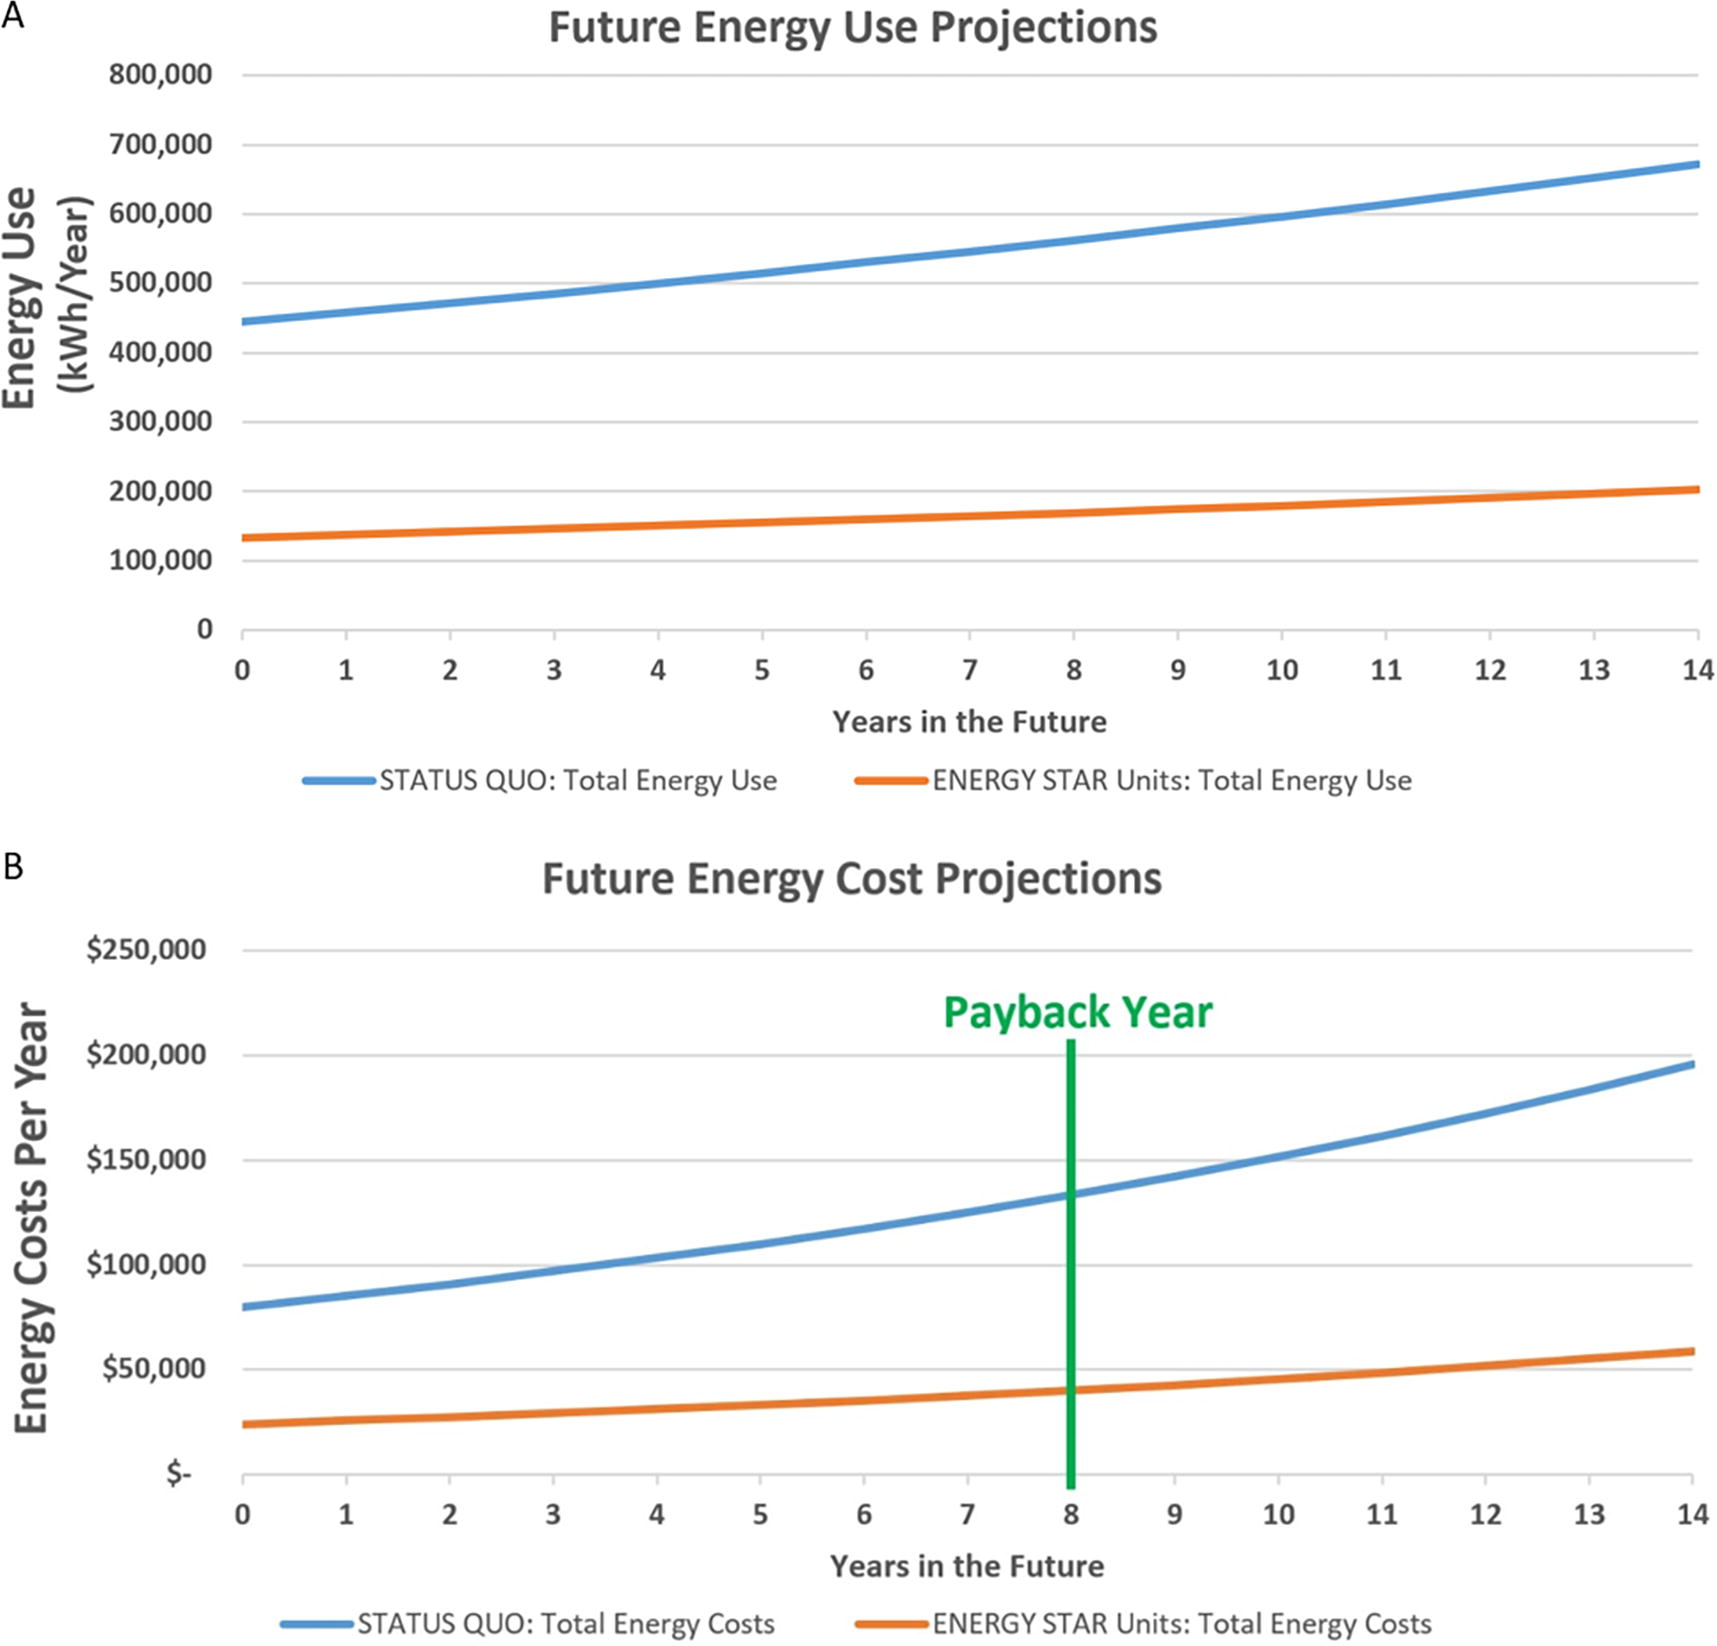
Energy use and cost projections. The blue lines are forecasts for energy-inefficient ultra-low temperature freezers. The orange lines are forecasts for the ENERGY STAR ultra-low temperature freezers.
Figure 5b shows the cost scenarios of continuing the use of the older freezers versus replacing them with ENERGY STAR systems. Our project is projected to achieve a payback period in the 8th year after the replacements were completed. Payback period was defined as the point the cumulative savings exceeded the project costs.
Table 1 shows the energy, cost, and carbon equivalent reductions from our replacements. The elimination of 134 metric tons of carbon dioxide emissions is equivalent to the electricity use of 26.4 homes for 1 year. 10 Note that the actual carbon burden of certain freezers varies because electricity in some our buildings comes from zero-emission sources.
First Year Carbon Reduction Due to Freezer Replacements. Energy Use and Costs Were Calculated for the First Year Using the Forecasting Models Figure 3 and Figure 4 Respectively. Energy Use Was Converted to Carbon Emissions Using the U.S. Environmental Protection Agency, Greenhouse Gas Equivalencies Calculator 10
Institutional impact projections
Table 2 reveals that the operation of our 1119 energy-inefficient freezers consume approximately 11.6 million kWh of electricity per year. This energy consumption results in over 5000 metric tons of carbon emissions annually and burdens our institution with over $2 million in annual electricity costs. If our institution were to convert our 1119 ULT freezers to ENERGY STAR models, the energy profile would change substantially: energy use, carbon equivalent emissions, and energy costs would decrease by 68%. The elimination of 3423 metric tons of carbon dioxide emissions is equivalent to the electricity use of 676 homes for 1 year. 10 Note that the actual carbon burden of certain freezers varies because electricity in some of our buildings comes from zero-emission sources.
Modeled Impact of 100% Institutional ENERGY STAR ULT Freezer Adoption. Energy Use and Costs Were Calculated for the First Year Using the Forecasting Models Figure 3 and Figure 4 Respectively. Energy Use Was Converted to Carbon Emissions Using the U.S. Environmental Protection Agency, Greenhouse Gas Equivalencies Calculator 10
Discussion
Many general initiatives lack institutional support, evidence-based tools, field-tested methods and generally rely upon voluntary efforts. 1 Our project received institutional support and succeeded in a large-scale technology conversion in a real-world setting which reduced carbon footprint and energy costs. ENERGY STAR ULT freezers have been proposed to significantly reduce energy use, and prior work has suggested that institutions should replace all conventional ULT freezers. However, budget constraints limit the pace of technology conversion. It is, therefore, critical to identify the most energy-intensive freezers. Our methods allow those institutions with limited resources to quickly identify the most inefficient units and maximize return on investment. Once a freezer is replaced, routine maintenance requires solely labor to minimize ownership costs and prolong freezer life, postponing replacement costs, and reducing energy use.2–5
Using direct energy measurement to determine which ULT freezers within a population use the most energy is labor-intensive and takes considerable time. We found that at least 3 days of energy use data is necessary per freezer to accurately determine average daily energy use. For an institution that operates 100 ULT freezers, it would take at least 300 days of metering to directly collect the plug draw data needed to identify the best targets for replacement. Additionally, the expertise of an electrician is needed to ensure proper metering and data collection for each unit. It may not be possible to divert electricians from their commitments to maintaining regular operations. Other institutions can now avoid the need for an electrician to help identify the most inefficient units.
Our statistical model to predict energy use without direct measurement requires only information on ENERGY STAR certification, storage volume, and age, and significantly reduces the time and labor to determine ULT freezer energy use. Our model avoids the risks of freezer failures observed when old units are temporarily unplugged to install power meters. Our model is reliable using various measures of accuracy despite variations in energy use due to uncertainty in the quality of freezer maintenance and operation.5–6
Our models for energy and costs forecasting incorporate findings from previous work to account for HVAC impact, mechanical decline and energy rate increases.2,8,9 These models were the basis for a compelling business case to invest in converting UCSF’S entire ULT freezer fleet to ENERGY STAR freezers. A period of high inflation followed the completion our pilot. The payback period was influenced by the relative price of the ENERGY-STAR freezers and associated energy costs. However, these offset each other considering increased energy costs improve the return on investment.
Conclusions
Our work resulted in a positive return on investment and proactively transferred valuable research materials from unstable ULT freezers. The annual cost savings of converting UCSF to ENERGY STAR freezers would save over $1.4 million; UCSF would have to generate over $10 million in revenue to achieve the same net income. Our findings also resulted in a policy change requiring only ENERGY STAR ULT freezer purchases. The success of our pilot resulted in a commitment of an additional $3 million to replace 300 more conventional freezers.
We share our logistical methods for large-scale ULT freezer replacement and for the safe transfer of valuable research materials. Our data sets, statistical analyses, and models can be repurposed by other institutions and allow others to repeat and improve upon our work.
Footnotes
Acknowledgments
The UCSF Logistics Team: Greg Phillips, Donte Casey, Scott Yu, Veimau Lakalaka, Jorge Rivas, Michael Soabas, Marthel Julian, Frank Rosales, and Matt Banzon, for removal and recycling of old freezers and receiving, inspection, and delivery of Energy Star freezers. Adam Schnirel for created staging areas for efficient and safe transfer of contents between freezers. Mary Ann Hallacy for seismic bracing and installation of temperature monitors on freezers. Rowena Eng and Mike Evans (Genentech, Inc.) for research on ENERGY STAR brands. Gail Lee for initiating interest in Energy Star freezer technology. Berna Declet and Trish Hackemack for project management.
Authors’ Contributions
D.S.: Conceptualization (equal); data curation (lead); formal analysis (equal); investigation (lead); methodology (equal); project administration (lead); resources (lead); supervision (lead); validation (equal); visualization (equal); writing—original draft preparation (lead); writing—review and editing (equal). M.-O.K.: Data curation (supporting); formal analysis (equal); investigation (supporting); methodology (equal); resources (supporting); validation (equal). J.R.: Data curation (supporting); formal analysis (equal); funding acquisition (lead); investigation (supporting). N.K.: Funding acquisition (supporting); project administration (supporting); supervision (supporting). D.O.M.: Funding acquisition (supporting); project administration (supporting); supervision (supporting); validation (equal). B.J.G.: Conceptualization (equal); funding acquisition (supporting); project administration (supporting); supervision (supporting); validation (equal).
Author Disclosure Statement
The authors report no competing financial or non-financial competing interests.
Funding Information
Our project received financial resources totaling $679,837 from a
References
Supplementary Material
Please find the following supplemental material available below.
For Open Access articles published under a Creative Commons License, all supplemental material carries the same license as the article it is associated with.
For non-Open Access articles published, all supplemental material carries a non-exclusive license, and permission requests for re-use of supplemental material or any part of supplemental material shall be sent directly to the copyright owner as specified in the copyright notice associated with the article.