
Abstract
Academic biobanks commonly report sustainability challenges, which may be exacerbated by a lack of information on biobank value. To better understand the costs and supported outputs that contribute to biobank value, we developed a systematic, generalizable methodology to determine biobank inputs and publications arising from biobank-supported research. We then tested this in a small cohort (n = 12) of academic cancer biobanks in New South Wales, Australia. A proforma was developed to capture monetary and in-kind biobank costing data from biobank managers and publicly available sources. Participating biobanks were grouped and compared according to the following two classifications: open- versus restricted-access and high versus low total annual costs. Our methodology provides a feasible approach for capturing comprehensive costing data for a defined period. Characterization of biobanks using this approach showed that median total costs, as well as median staffing and in-kind costs, were comparable for open- and restricted-access biobanks, as were the quantity and journal impact metrics of supported publications. High- and low-cost biobanks supported similar median numbers of publications; however, high-cost biobanks supported publications with higher median journal impact factor and Altmetric scores. Overall, 9 of 10 biobanks had higher Field-Weighted Citation Impact scores than the global average for similar publications. This is the first tested, generalizable approach to analyze the costs and publications arising from biobank-supported research. By determining explicit cost and output data, academic biobanks, funders, and policymakers can engage in or support informed redirection of resourcing and/or benchmark setting with the aim of improving biobank support of research.
Introduction
In contrast to the widely held view on the importance of biobank contributions to the health and medical research sector, sustainability remains a worldwide challenge for human tissue biobanks supporting academic research. 1 This is exemplified by a number of high-profile biobank closures and restructures.2–4 Ultimately, loss of sustainability renders the sector at risk of losing cohorts of stored biospecimens and expert workforce to related fields. 5 Downstream biospecimen users may also be impacted, and there are possible ethical implications with respect to tissue donors.5,6
Watson et al. have previously articulated the following three types of biobank sustainability: operational (“efficiency”), financial, and social (“acceptability”). 7 To capitalize on the support that biobanks can provide to health and medical research, there is a need to address all the three aspects of sustainability. Numerous approaches to improve biobank sustainability have been considered; however, there is little evidence to date that these are effective.8–13
Biobank sustainability challenges have given rise to greater focus on business viability. Increasingly, biobanks are implementing business policies and plans that articulate purpose, projected expenditure and income, approaches to cost recovery, and/or utilization of stored samples.14–17 Aspects of business planning can also inform a type of biobank value, which systematically appraises resources, activities, and products. 5 Valuing biobanks in this manner holds potential benefits for biobanks and their stakeholders through enabling intra-biobank comparisons over time and inter-biobank comparisons between similar types or models. However, at present, while there is limited information on the financial costs of individual biobanks,18–22 there is a dearth of published data on biobank outputs. 5
We have previously proposed a link between a lack of information on biobank outputs and threats to biobank sustainability. 5 However, biobanks represent a diverse range of models, collection sizes, quality, and complexity with possible ensuing differences in the quality and quantity of their outputs.23–25 Along with other factors, biobank diversity can influence individual business plans and perceived value, as well as the capability to evaluate biobanks in a consistent manner.
One approach to describe and compare academic biobanks is based on biobank access policy, size, and research supported, where “poly-user” biobanks are formalized, open-access collections for many and diverse research questions, and “mono-user” and “oligo-user” are collections utilized by a single research study or research group. 26 This Canadian Tumour Repository Network (CTRNet) biobank classification scheme was first proposed by Watson and Barnes in 2011. 26 In a previous study, we found that poly-user (“open-access”) cancer biobanks employed greater numbers of staff, were more likely to undertake quality control measures, and were more aware of biobanking best practices, compared with mono-/oligo-user (“restricted-access”) biobanks. 27
In this study, we aimed to develop a systematic and generalizable approach to identify and compare biobank costs and supported research publications. We then implemented this approach for a cohort of n = 12 hospital-affiliated cancer biobanks in New South Wales, Australia. Publications were used in this instance as an output variable that was consistently available for all participating biobanks. Based on our previous findings, we hypothesized that a biobank access policy could influence a biobank’s supported publications by virtue of the greater resourcing and utility of quality approaches reported by open-access cancer biobanks.27,28 We further hypothesized that greater resources available to a biobank would determine a higher quantity and/or quality of supported research output.
Methods
Interview design and conduct
Adapting previous biobank costing literature, a semi-structured set of 14 interview questions was developed for biobank managers on inputs, activities, and supported publications (Supplementary Data S1).20,21,29 For inputs, monetary costs (in Australian dollars [AUD$]) and in-kind support for the 2017/2018 Australian financial year (July 1, 2017–June 30, 2018) were collected. For supported publications, a list of biobank-supported publications from January 2015 to December 2018 was supplied. A 4-year period was selected to capture the number and diversity of publications and allow publication metrics to accrue.
Questions were circulated to managers 1–2 weeks prior to their scheduled in-person interview. A.R. conducted interviews from July 2018 to September 2018.
Identification of biobank cohort
Following approval from the Sydney Children’s Hospitals Network Human Research Ethics Committee (Approval Number: LNR/17/SCHN/494), an Expression of Interest was circulated to a previously identified cohort of cancer biobanks that were operational from 2015 onward. 27 All participating biobanks represented cancer biobanks from a single Australian state that shared a Community of Practice. The biobanks were classified according to the CTRNet biobank classification scheme. 26
Biobank cost data collection
Interview responses were recorded on paper proformas, and then transcribed to a spreadsheet (Microsoft Excel 2013). Outstanding information was clarified via email. Monetary costs included staffing costs (including consenting), asset depreciation, consumables (for biobank operations only), software depreciation, and any other costs described by biobank managers (including contractor costs, travel, stationery, training, recruitment, marketing). Research costs associated with the biobank were excluded. The spreadsheet was further populated with publicly available data, including purchase prices of assets/software and depreciation rates, where these could not be provided by interviewees (Supplementary Data S1). Biobank managers were also requested to report on any cost recovery.
Biobank costs data analyses
In-kind costs included personnel support (tissue and blood collection, fresh and formalin-fixed paraffin-embedded tissue processing, and tissue characterization, and access and steering committee meeting participation) and overheads. To calculate in-kind personnel support, the value of labor for relevant staff within the state’s largest health care employer, NSW Health, was used (Supplementary Data S1). 30 For example, the mean NSW Health Staff Specialist salary (AUD$197,276 per annum) was used to calculate an hourly rate for pathologists and surgeons, based on a 38-hour working week. The quantity of in-kind labor was ascertained from the interviews. The mean value of annual per-square-meter laboratory costs from two medical research institutes in NSW was used to derive overhead costs, using biobank surface areas provided by interviewees (Table 1).
Calculation of In-Kind Support Costs of n = 12 Biobanks for the Financial Year, July 1, 2017—June 30, 2018
After the spreadsheets were fully annotated, total annual costs (monetary plus in-kind) were calculated for each biobank (Tables 1 and 2), with figures rounded to the nearest AUD$100. Median and range values were calculated for total 2017/2018 biobank costs, staffing costs, and in-kind support. The proportions of annual costs that were represented by in-kind and staff wages were also calculated.
Calculation of Monetary Costs Supporting n = 12 NSW Cancer Biobanks for the Financial Year, July 1, 2017–June 30, 2018
In addition to the open- versus restricted-access classification, biobanks were ranked according to their total annual combined monetary and in-kind costs, and divided into two equal groups (high- and low-cost).
Publications arising from biospecimen provision
To ensure a comprehensive list of supported publications for each biobank, the following sources of information were consulted and cross-checked: publication lists from biobank managers, biobank websites and annual reports, biobank names within Google Scholar, and biobank staff names as authors within PubMed and academic profiles online. Each publication was checked for the name of the supporting biobank and/or specific mention of the use of biospecimens. Publications that described individual biobank operations and/or did not describe the use of biospecimens were excluded. Lists of biobank staff names obtained during the interview were cross-checked for authorship in the publications. Acknowledgment of biobank contributions within each publication was also recorded.
Publication metrics
Journal impact factors (JIFs) were accessed from Journal Citation Reports (Supplementary Data S2). The Altmetric bookmarklet was used to record publication Altmetric scores (Supplementary Data S2).31,32 Mean Field-Weighted Citation Impact (FWCI) scores (Supplementary Data S2) were recorded for each biobank’s publications, where FWCI scores are calculated as the ratio of cumulative citations and the total expected citations according to the subject field for a group of publications. 33 The global baseline FWCI is 1.0, with any FWCI score >1.0 reflecting a higher-than-average number of citations. Each publication metric was recorded as at December 2019.
Publication and estimated cost per publication data analyses
The number of publications per biobank was determined, and the median and range were calculated. Estimated total costs per publication were calculated for each biobank as per Supplementary Data S2. Median and range costs per publication for the biobank cohort were then calculated. To allow publication data to accrue over time, and cost data to be captured as close to real time as possible, publication outputs were not directly related to the actual costs supplied. Therefore, costs per publication were based on costs incurred by the biobank post biospecimen/data provision to researchers.
Statistical analyses
IBM SPSS version 26 was used to code data and perform statistical analyses; a p value of <0.05 was considered statistically significant for all tests.
Annual total, in-kind, and staffing costs were compared between biobanks classified as open- and restricted-access and high- and low-cost biobanks using the Mann–Whitney test. Median numbers of publications supported per biobank, median JIFs per publications supported, median Altmetric scores per publications supported, and medians of mean FWCI per biobank, were compared between open- and restricted-access biobanks and high- and low-cost biobanks using the Mann–Whitney test.
The proportions of supported publications with biobank staff authorship or biobank acknowledgment were compared between open-access and restricted-access biobanks and high- and low-cost biobanks, using Fisher’s exact test.
Results
Participating cancer biobanks
Expressions of Interest were sent to the 17 biobanks still open to accrual, from a previously identified cohort of 23 cancer biobanks in 2013. 27 Twelve of the 17 biobanks (71%) agreed to participate. The study cohort comprised one mono-user, five oligo-user, and six poly-user biobanks. As previously, mono-user and oligo-user biobanks were combined, resulting in a restricted-access cohort (n = 6) and an open-access cohort (n = 6) (Table 3). 27 The total number of participants, cancer types stored, and total staff full-time equivalent (FTE) are listed for each biobank in Table 3.
Description of Cancer Biobank Cohort (NSW, Australia), Ranked by Total Annual Costs (Cost Data Shown in Fig. 1)
According to NCI Surveillance, Epidemiology, and End Results Program common cancer types (https://seer.cancer.gov/statfacts/).
FTE = full-time equivalent.
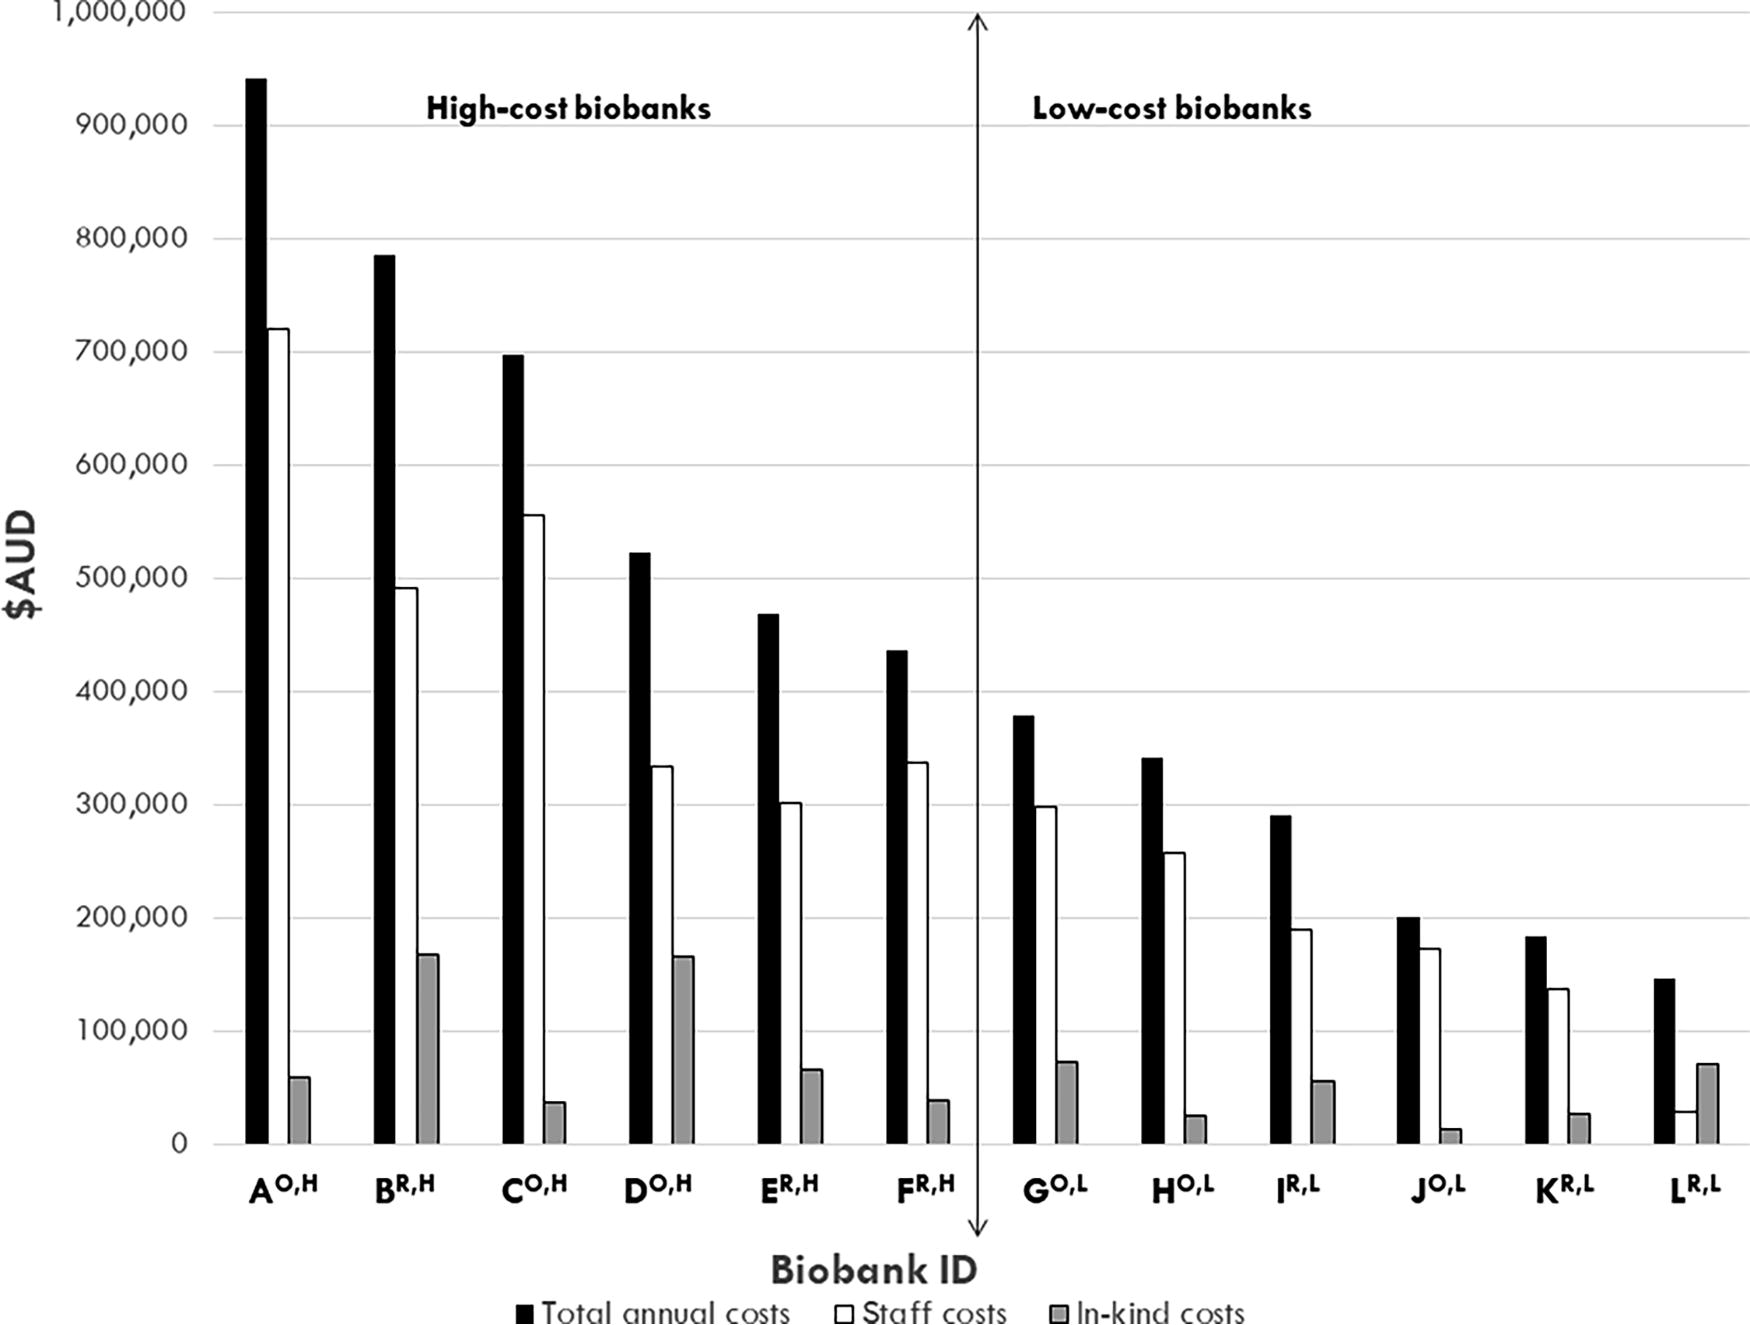
Total annual costs (black bars), staff costs (open bars), and equivalent in-kind costs (gray bars) (y axis) for the 2017–2018 financial year of n = 12 Australian cancer biobanks (x axis), ranked by total annual costs. Median total annual costs, staff costs, and in-kind costs are indicated by horizontal lines. The vertical line separates the high-cost and low-cost biobanks. Open-access biobank IDs are denoted with a superscript “O”; restricted-access biobank IDs are denoted with a superscript “R”; high-cost biobank IDs are denoted with a superscript “H”; and low-cost biobank IDs are denoted with a superscript “L” (x axis).
Reported and calculated annual biobank costs
The median annual total cost (including monetary and in-kind) of biobank operations was AUD$408,100 (range, AUD$146,800–AUD$941,900) (Fig. 1). Seven of 12 (58%) biobanks practiced cost recovery, with annual cost recovery subtracted from their respective operational costs. The median annual staffing budget for the cohort was AUD$300,300 (range, AUD$28,757–AUD$720,492; n = 12) (Fig. 1), which represented 19%–86% of operational costs for biobanks and 63%–86% of operational costs for 11/12 biobanks (Fig. 2). Of the top six biobanks ranked by proportion of staffing costs, n = 5/6 (83%) were open-access biobanks (Fig. 2). The median annual value of in-kind support (in-kind staffing and infrastructure) was AUD$57,400 (range, AUD$13,800–AUD$167,800) (Fig. 1), which represented 5%–49% of annual expenditure of biobanks (Fig. 3).
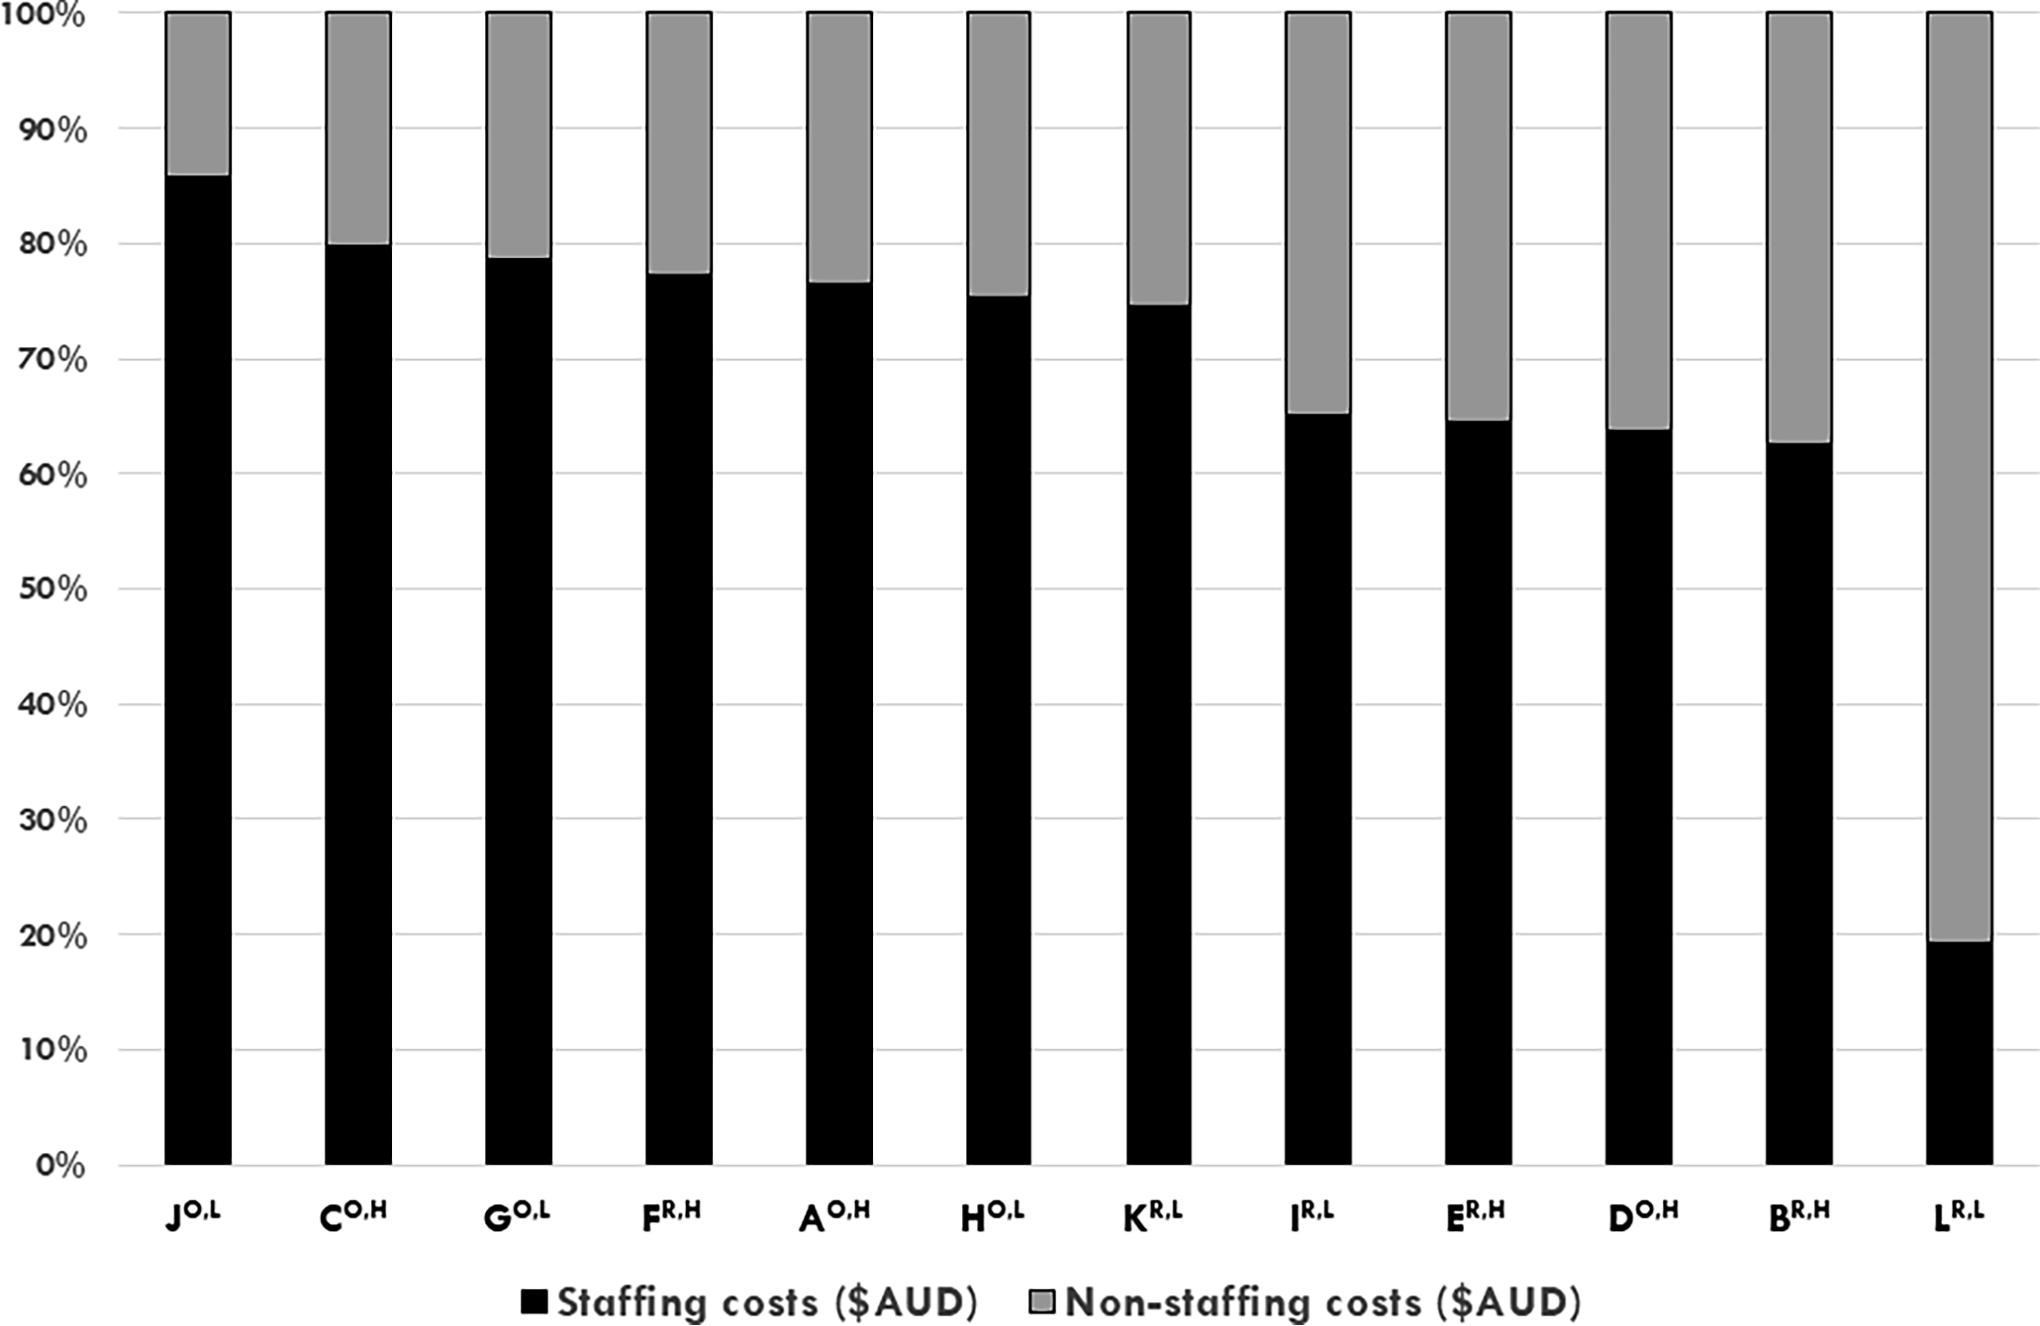
Proportion of staff costs (black bars) to all other costs (gray bars) (y axis) of n = 12 Australian cancer biobanks for the 2017–2018 financial year, ranked by proportion of staff costs. Open-access biobank IDs are denoted with a superscript “O”; restricted-access biobank IDs are denoted with a superscript “R”; high-cost biobank IDs are denoted with a superscript “H”; and low-cost biobank IDs are denoted with a superscript “L” (x axis).
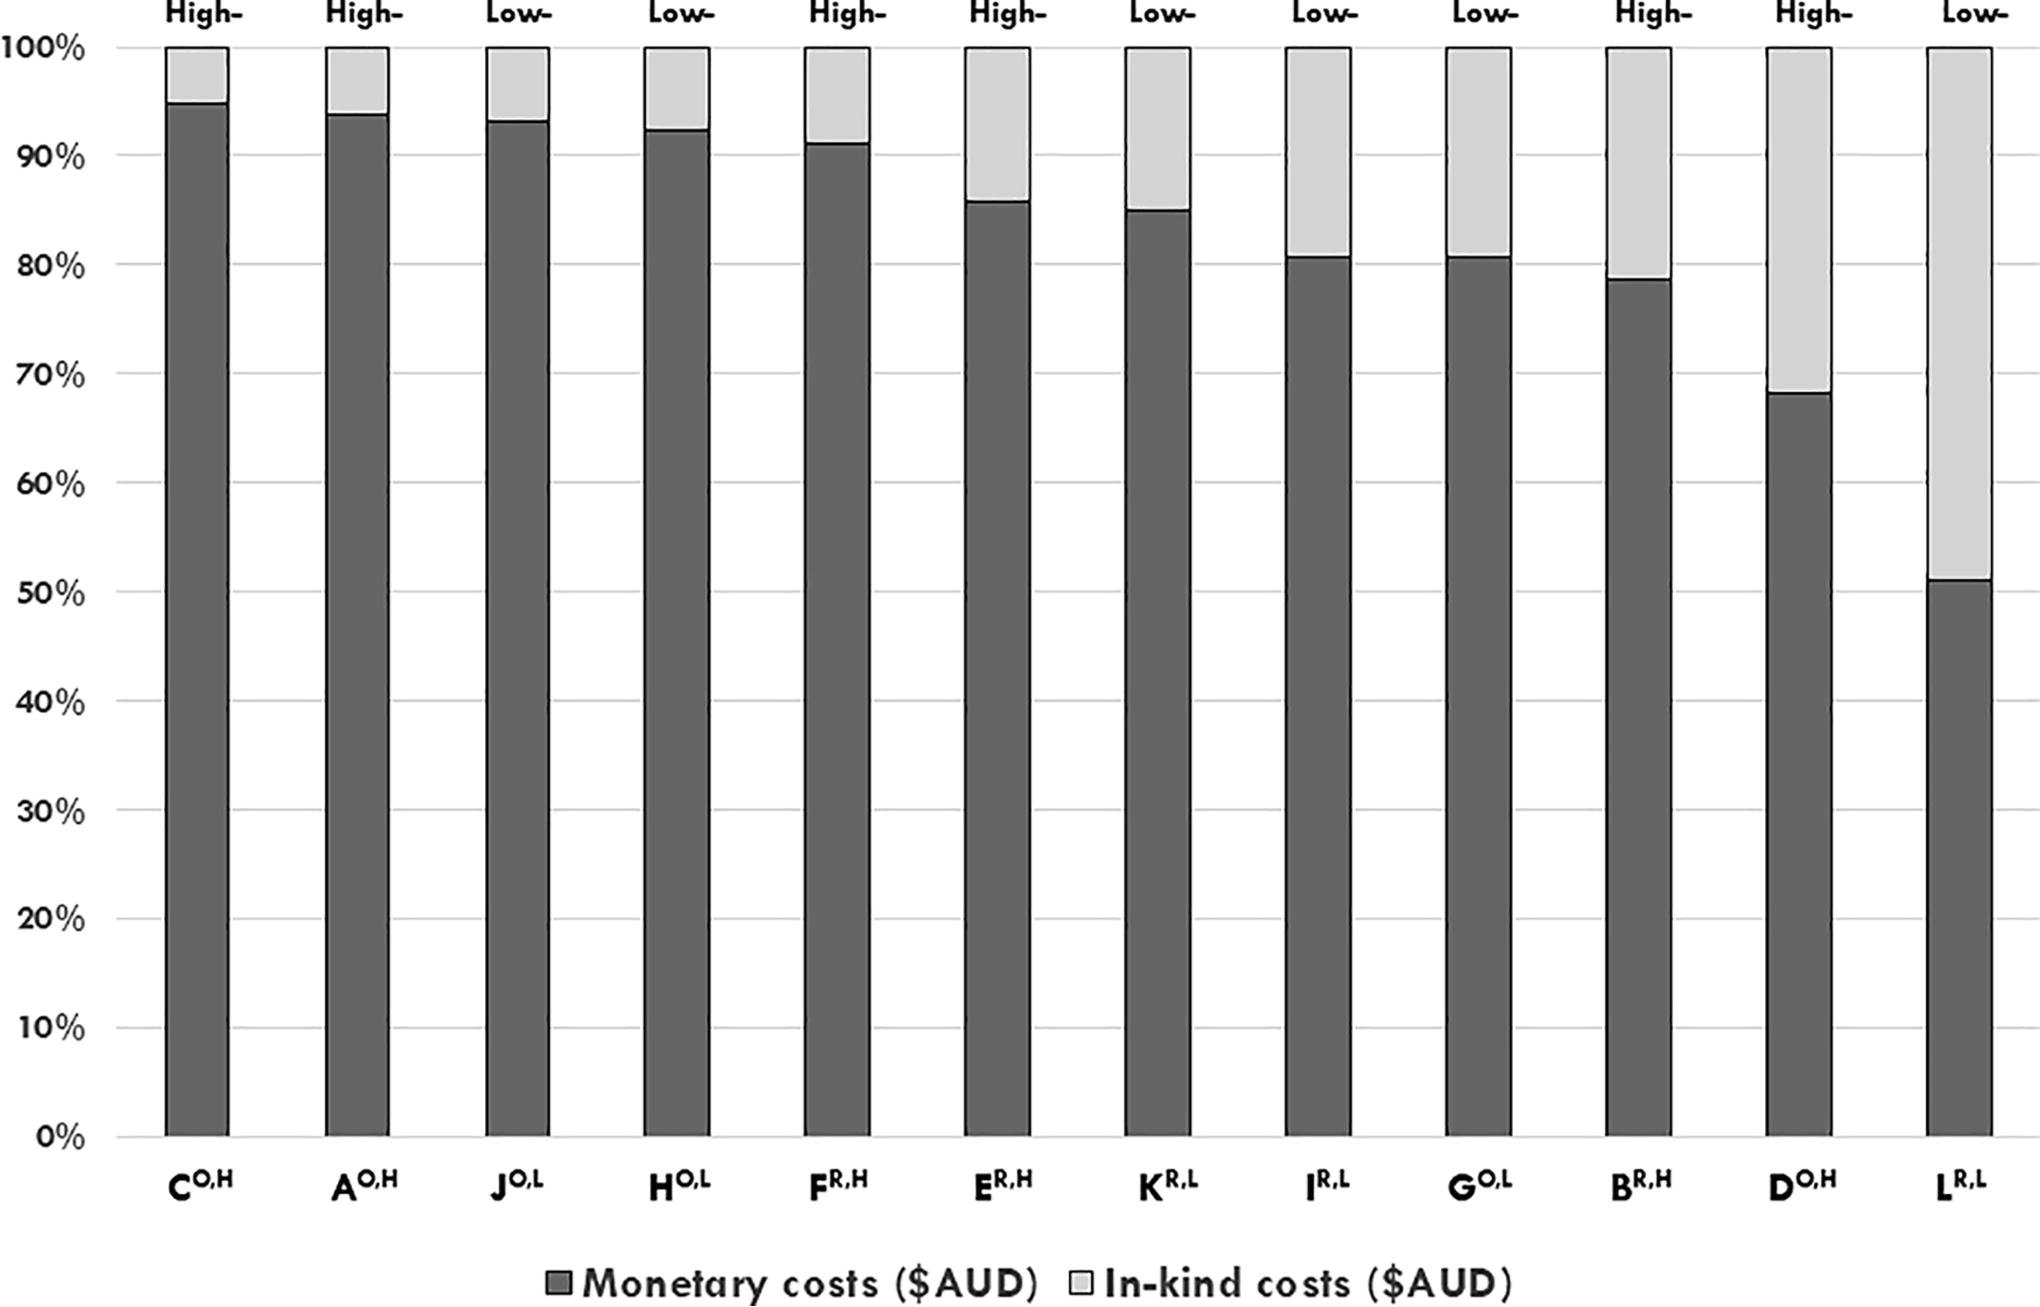
Proportion of monetary costs (dark gray bars) to in-kind costs (light gray bars) (y axis) for the 2017–2018 financial year of n = 12 Australian cancer biobanks (x axis), ranked by proportion of monetary costs. Open-access biobank IDs are denoted with a superscript “O”; restricted-access biobank IDs are denoted with a superscript “R”; high-cost biobank IDs are denoted with a superscript “H”; and low-cost biobank IDs are denoted with a superscript “L” (x axis).
For open- versus restricted-access biobanks, median total costs (monetary plus in-kind) (p = 0.337, n = 12 biobanks), paid staffing costs (p = 0.337, n = 12 biobanks), and in-kind support costs (p = 0.522, n = 12 biobanks) were comparable (Mann–Whitney tests). For high-cost versus low-cost biobanks, median total costs were significantly higher in the high-cost biobank group (Mann–Whitney test, p = 0.004, n = 12 biobanks).
Publications arising from biospecimen provision (n = 144)
Two biobanks (both open-access biobanks) supported no publications during 2015–2018, and were not included in the analyses of biobank outputs. The remaining 10 biobanks supported a total of 144 publications that were published from 2015 to 2018 (median, 11 publications per biobank; range, 3–43; Fig. 4). The median JIF/publication was 5.17 (range, 1.42–43.07), and the median Altmetric score/publication was 2 (range, 0–850) for biobank-supported publications from 2015 to 2018 (n = 144 publications).
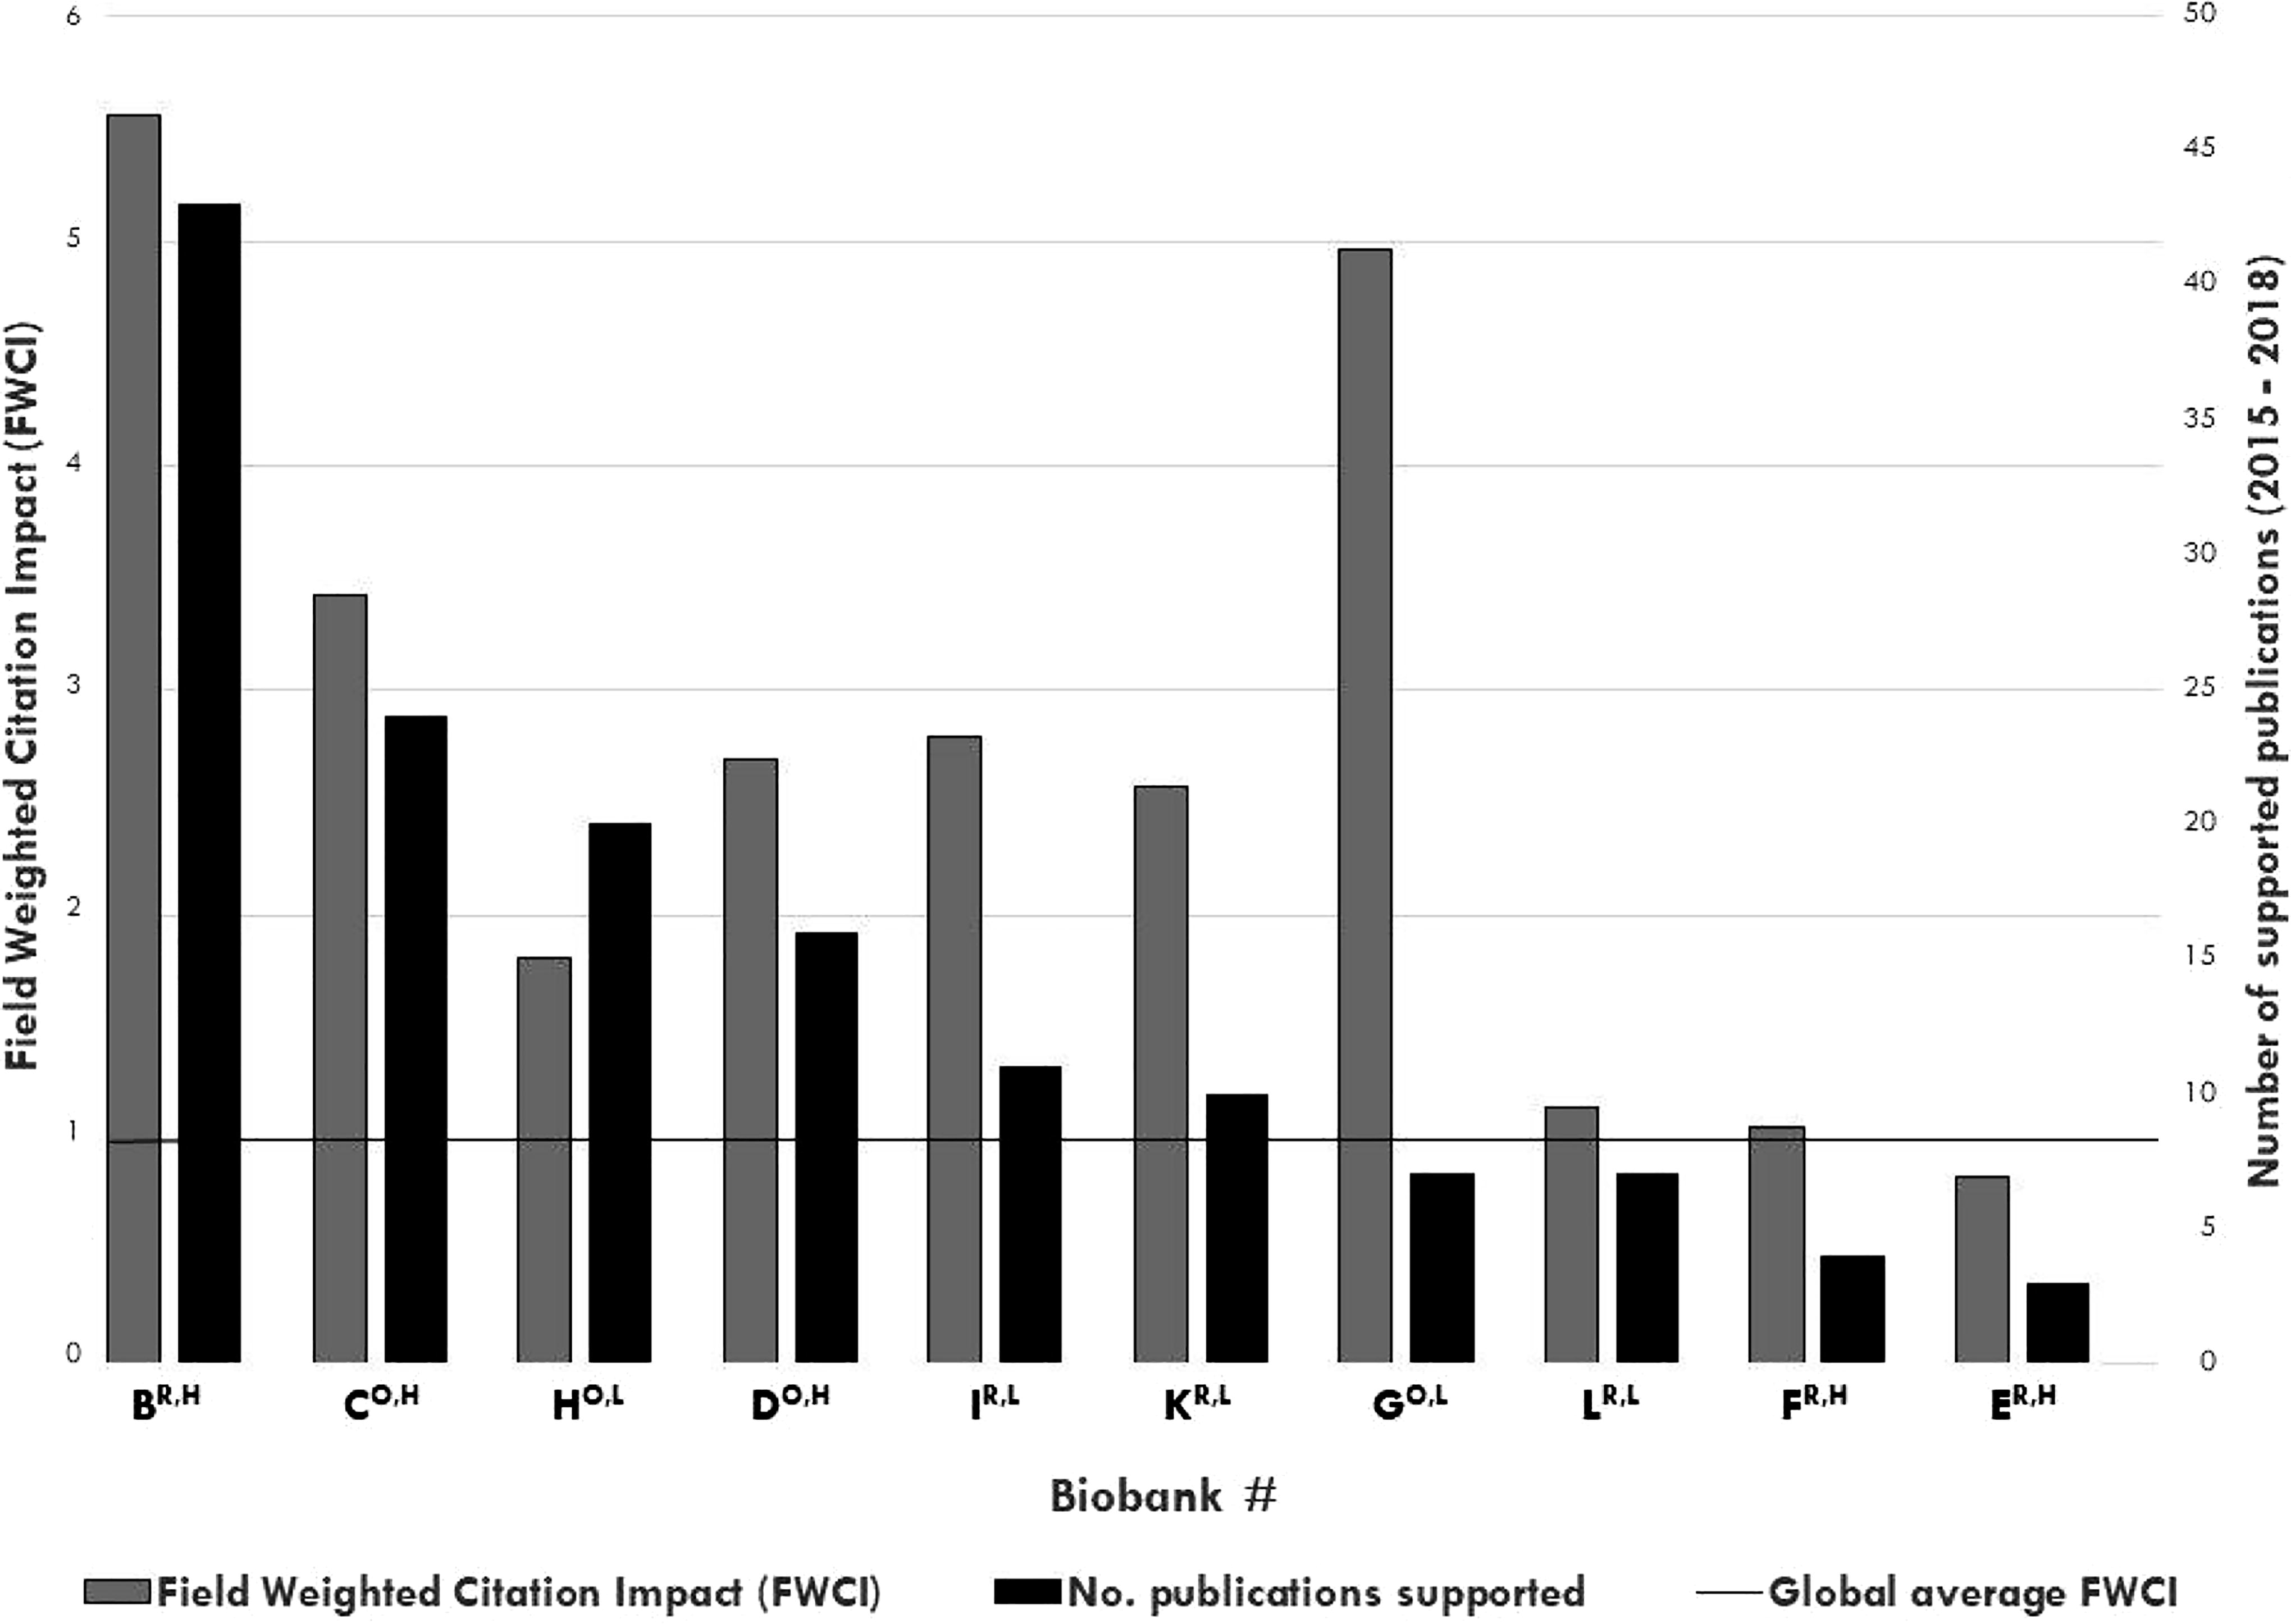
FWCI per biobank (y axis, left, gray bars) and number of supported publications for 2015–2018 (y axis, right, black bars) for n = 10 Australian cancer biobanks (x axis), ranked by the number of publications supported. Open-access biobank IDs are denoted with a superscript “O”; restricted-access biobank IDs are denoted with a superscript “R”; high-cost biobank IDs are denoted with a superscript “H”; and low-cost biobank IDs are denoted with a superscript “L” (x axis). The global average FWCI is indicated by a horizontal line. FWCI, Field-Weighted Citation Impact.
The median FWCI score for all biobanks with supported publications (n = 10) was 2.63 (range, 0.83–5.56), with the median FWCI score of biobanks exceeding the global average of 1.0 for 9/10 (90%) biobanks (Fig. 4).
Publication metrics according to access policy
When supported publication metrics were compared according to access policy (n = 4 open- and n = 6 restricted-access biobanks), the median JIF/publication, Altmetric score/publication, and FWCI/biobank were not significantly different (Table 4). Similar proportions of publications supported by open- and restricted-access biobanks included biobank staff as authors (Table 4). However, a significantly higher proportion of papers supported by open-access biobanks acknowledged the biobank in the Methods and/or Acknowledgment sections, compared with publications supported by restricted-access biobanks (Table 4).
Biobank-Supported Publication Metrics Compared Between Open- Versus Restricted-Access and High- Versus Low-Cost Cancer Biobanks
Mann–Whitney test.
Two open-access biobanks did not support any publications during 2015–2018.
One high-cost and one low-cost biobank did not support any publications during 2015–2018.
Fisher’s exact test.
Publication metrics according to cost
The median cost per publication was similar between five high- and five low-cost biobanks (Table 4). High-cost biobanks supported publications with a significantly higher median JIF and Altmetrics score (Table 4), although median JIF and median Altmetrics score, respectively, were not significantly correlated with total annual biobank cost (Spearman’s rank correlation test, ρ′ = 0.389; p = 0.266, n = 10 biobanks; Spearman’s rank correlation test, ρ′ = 0.504; p = 0.138, n = 10 biobanks) (Supplementary Data S3). FWCI/biobank were similar for high- and low-cost biobanks (Table 4).
A significantly higher proportion of publications supported by high-cost biobanks included at least one biobank staff member as an author, but otherwise similar proportions of publications either included acknowledgments of biobanks, included at least one biobank staff member as an author and acknowledged the biobank, or did not acknowledge the biobank in any way (Table 4).
Discussion
This study sought to develop a generalizable approach for valuing academic biobanks, and then demonstrate the use of this in characterizing a small cohort of cancer biobanks in Australia. To the best of our knowledge, this is the first tested methodology to capture information on comprehensive costs and publications arising from support by an academic biobank cohort. Our methodology incorporates existing and/or publicly available biobank data, resulting in a feasible method for participating biobanks to inform and potentially revise their business plans. Components of the framework may also be adjusted to reflect other biobank types such as academic center biobanks. The results allowed biobanks to better identify the total cost of their operations and the types of publications they supported, as well as track progress and variations over time. In the longer term, this type of evaluation data can provide biobanks with opportunities to inform redirection of resources (e.g., focusing on improving biospecimen quality, revising marketing plans, and/or culling low-value biospecimens), and also to guide benchmark setting. This provides an evidence base to start addressing operational and financial sustainability for all biobanks.
Across the health and medical research landscape, there is increasing recognition of the value of research that improves policy, practice, and societal health.34,35 Our work aligns with this approach by describing a step toward the development of an independent evaluation framework for assessing the impact of the biobanking sector. It incorporates a greater focus on measuring biobank outputs. Without this information, it is challenging for new or alternative models of biobanking to be considered, that may better support research and/or offer improved value for investments. External stakeholders such as funders and policymakers can utilize cost and output analysis to invest more effectively across the sector through rationalizing funding and providing accountability for their decision-making. 36
Studies such as the present one can provide estimates of broader biobanking investments. Our work provides an estimate of the total cost of cancer biobanking for one cohort, which can be extrapolated for defined precincts. For example, using the median annual operational biobank cost for our cohort and the estimated number of cancer biobanks in the state of New South Wales in Australia (n = 20), the monetary cost for cancer biobanking in one Australian state can be estimated at approximately AUD$8 million/year, with staffing costs a large proportion of this.27,28
Inclusion of estimated in-kind costs provided further insights into resourcing for the sector. In-kind costs are a minor but important contributor to biobank resources, which can be overlooked and/or incorrectly assumed to continue indefinitely. Loss or reductions in this type of support could result in financial shortfall for biobanks, if in-kind support was withdrawn. Furthermore, reductions in in-kind support could produce gaps in expertise and specialized equipment. Recognizing the importance and actual costs of in-kind support allows biobanks and their funders to better plan for the future.
The quality and quantity of biobank-supported publications is an important indicator of biobank value. Journal/publication metrics, including FWCI, citation numbers, and JIFs can be used as simple measures to evaluate the research quality of publications supported by biobanks, 37 noting that the number of citations per publication is influenced by publication age. In our study, the biobank FWCI ranked above the global average for 90% of the biobank cohort, providing evidence of the high-quality research that the supply and use of biospecimens and data can facilitate.
Further characterization of our cohort of participating biobanks determined how access policy and annual operational costs related to the numbers and impact of biobank-supported publications. Based on our previous research findings,22–23 we had hypothesized that features of open-access biobanks would enhance their ability to support research, compared with restricted-access biobanks. Yet, despite open-access biobanks supporting a potentially wider pool of researchers, the median number of supported publications and associated journal/publication metrics were similar for open- and restricted-access biobanks. This finding suggests that the biobank access policy does not determine the quantity or quality of publications arising from cancer biobank research support.29,37,38 In some instances, the access policy of a biobank may be set by the host organization or other key stakeholders. While recognizing that other factors beyond biobank support of research influence publication quality, our research suggests that rewarding biobanks and organizations that support high-impact research may be preferable to recognizing and rewarding biobanks based on the open-access nature of their policies.
As expected, the inclusion of a biobank acknowledgment was significantly more frequent in publications supported by open-access biobanks, where this is usually included in the access policy as a requirement of support. At the same time, it is of note that almost 20% of publications did not acknowledge the supporting biobank in any way. However, there was no significant difference in the proportions of papers that included a biobank staff member between open- and restricted-access biobanks. By definition, restricted-access biobanks have closer ties to the research that they support, and we had predicted that the proportion of restricted-access biobanks with staff included as publication authors would be higher. This may indicate that staff in both categories of biobanks are often seen to contribute strongly to direct research outcomes, providing specialized tissue handling expertise and guidance on experimental design.
We also hypothesized that resources available to a biobank would determine the quantity and/or quality of supported research output. However, while the number of publications supported by high- versus low-cost biobanks was similar, high-cost biobanks supported publications with a higher median JIF. This suggests that greater investments in monetary and in-kind support for biobanking may play a role in supporting more prestigious publications. Greater resourcing could allow biobanks to accrue larger cohorts of samples/data, or cohorts with more complex features such as samples linked over time from each case, which could enable publications in higher impact journals. Altmetrics scores were also higher for publications supported by high-cost biobanks, indicating greater impact across social media.
We recognize that the development of the generalizable costing framework has some limitations and may not be applicable for complex biobank business modeling such as stewardship models that host multiple individual biospecimen collections. For simplicity and feasibility, the costing framework does not consider any variations in the age of the samples stored. Our approach focused upon one output arising from biobank support of research, namely, publications, due to varying biobank records for other outputs. Multiple sources from biobank and publication database perspectives were consulted to ensure that complete records of supported publications were obtained. However, a more comprehensive picture of the value of biobank outputs could be obtained through tracking of all research supported by biobanks, such as clinical trial support.
There were also limitations in the testing of the framework. Testing of our cost and output methodology was undertaken in a small biobank cohort, with consent sought from biobank managers through long-standing research relationships. This was particularly important given the sensitive nature of the data requested. Two of the biobanks in the cohort were relatively new in their establishment and had not yet supported research that had generated publications. There was also a lack of complete data that mapped the use of biospecimens from supply to resultant publications. It is therefore possible that results from this small cohort may not be generalizable to other cohorts. Additionally, our results may present a comparatively favorable assessment of biobank costs and outputs, due to study participation bias. A longer and/or larger study of biobanks and their research environment could address any limitations arising from the small number of biobanks studied.
While individual publication metrics have recognized limitations, we have presented a range of common publication metrics to facilitate analysis of publication quality. To allow publication metrics to accrue over time, the time period for biobank cost calculations (2017/2018 Australian financial year) differed from that of the publication analyses (2015–2018). Therefore, rather than a calculated direct cost per publication, estimates of expected costs per publication were provided. A larger cohort size would also be more informative; however, without increased resourcing, this would require the development of methods such as proxies to expedite biobank cost calculations.
Conclusions and Summary
This study provides the first systematic and generalizable methodology to evaluate biobank in-kind and monetary costs and publications arising from biobank-supported research. This is the first evidence of the total costs of biobanking in an unregulated funding system, whereby individual biobanks are responsible for applying for and attracting their own funding. An evidence-based approach for biobanking costs and outputs allows reforms to individual biobank business planning and management, as well as enables policymakers and funders to more easily review their investments in light of other opportunity costs.
The feasibility and utility of such an approach were demonstrated in a small cohort of biobanks, where we compared open- and restricted-access biobanks and high- and low-cost biobanks. The FWCI of 9/10 biobanks were greater than the global average, demonstrating the value of the provision of biospecimens and data to facilitate health and medical research and early evidence for re-evaluating investment into the sector. While the biobank access policy did not influence the quantity or quality of publications arising from biobank support, greater biobank resources were associated with greater publication prestige in the form of JIFs and Altmetrics scores. Based on these outcomes, funders and policymakers may consider rewarding biobanks that support higher impact research and/or consider rewarding biobank outputs rather than biobanks with an open-access model. Such changes to the current financially challenged biobank landscape could not only improve biobank sustainability but bring also about enhancements to biobank support of health and medical research.
Footnotes
Acknowledgments
This work was supported by the NSW Ministry of Health under the NSW Health PhD Scholarship Program. A.R. would particularly like to thank Dr. Rod Ling and Professor Andrew Searles for their advice on this project. The authors acknowledge input from Mr. Kan Chen and Ms. Victoria Keena, formerly of the Asbestos Diseases Research Institute Biobank, and Ms. Kiri Collins, formerly of the Children’s Cancer Institute Biobank. The authors also acknowledge the support of the Menzies Centre for Health Policy and Economics at the University of Sydney (A.R.), the National Health and Medical Research Council of Australia, Cancer Institute NSW, Department of Gynaecological Oncology, and Westmead Hospital (C.K.), the Biobanking and Biospecimen Research Services Program at BC Cancer (supported by the Provincial Health Services Authority), the Canadian Tissue Repository Network (funded by grants from the Institute of Cancer Research, Canadian Institutes of Health Research and the Terry Fox Research Institute, and from the Canadian Cancer Research Alliance) (P.W.), and the NSW Office of Health and Medical Research of the NSW Health Statewide Biobank (J.B.).
Authors’ Contributions
A.R. was invovled in Conceptualization, methodology, formal analysis, investigation, writing—original draft, visualization, project administration and funding acquisition; S.B., N.C., Y.Y.C., J.C., C.G., R.G., AM.H., A.H., V.J., L.K., C.K., D.M., U.P.P., A.Y., L.Z. were involved in Resourcing, project administration, writing—review and editing; D.R.C., J.A.B and W.P.H. were involved in conceptualization, methodology, writing—review and editing, supervision.
Author Disclosure Statement
No competing financial interests exist
Funding Information
Funding to support this research was provided by the NSW Ministry of Health under the NSW Health PhD Scholarship Program.
References
Supplementary Material
Please find the following supplemental material available below.
For Open Access articles published under a Creative Commons License, all supplemental material carries the same license as the article it is associated with.
For non-Open Access articles published, all supplemental material carries a non-exclusive license, and permission requests for re-use of supplemental material or any part of supplemental material shall be sent directly to the copyright owner as specified in the copyright notice associated with the article.