
Abstract
Background:
During sampling and processing, blood samples can be affected by hemolysis. Information is lacking regarding hemolysis for biobank samples. There is a need for a method that can easily measure hemoglobin as an indicator of hemolysis in stored samples before they are included in research projects. In this study we present a simple method for estimating hemolysis and investigate the effect of centrifugation speeds and temperatures on sample turbidity that commonly interferes with measurements.
Methods:
Using a variation of the Beer–Lambert law, we quantified the hemoglobin concentration in 75 long-term stored samples at a wavelength of 414 nm with a NanoDrop™ 8000 spectrophotometer. Owing to interference from turbidity, the samples underwent different treatments post-thawing: centrifugation at 10,000 and 20,000 g at two different temperatures (4°C and 19°C) for 15 minutes. In addition, freshly collected serum samples (n = 20) underwent a single freeze–thaw cycle, with hemoglobin measured prefreeze, post-thaw, and postcentrifugation. Kruskal–Wallis rank sum test groups and pairwise Wilcoxon rank test were used for statistical analysis.
Results:
A strong effect of centrifugation on the turbidity was shown for the long-term stored samples, however, this effect was independent of the temperature or centrifugation speeds. Centrifugation at 20,000 g for 15 minutes at 19°C reduced the turbidity up to 50%. A single freeze–thaw cycle in the fresh samples increased the optical density at 414 nm slightly, indicating a false increase of hemoglobin concentration. The following centrifugation reduced the concentration to less than the initial sample measurements, suggesting the presence of interference immediately after sampling.
Conclusion:
We describe here a simple and cost-effective NanoDrop-based method for measuring hemolysis levels intended for use in biobank facilities. We found that centrifugation, but not temperature, is a crucial step to reduce interference from turbidity.
Introduction
In recent decades, biobank material has become increasingly important in medical and clinical research. A number of large population-based biobanks, including the Janus Serum Bank in Norway, have been established, which monitor the health status of participants over time to assess the natural occurrence and progression of common diseases. 1 The use of biobanks in research requires high-quality samples collected in accordance with standard procedures. However, since blood sampling is a manual process, hemolysis may be induced. Hemolysis can interfere with other analytical methods, leading to inaccurately measured values. 2
Usually, biobanks have no initial information on hemoglobin levels in specimens, which can be a challenge, especially when projects include measurements of components that are known to be affected by hemolysis. Establishing a simple yet effective hemolysis measurement method, adapted to biobanks, will be a great asset in dealing with that challenge.
The rupture of erythrocytes causes hemolysis in blood samples. During this process, hemoglobin and other cellular components leak into the surrounding fluid and can, depending on the degree of this process, change the original properties of the sample. 3 Hemolysis can be caused by in vivo and in vitro conditions; the former being caused by hereditary, acquired, or iatrogenic hemolytic anemia, 4 and the latter by incorrect sample handling during collection or processing. Preanalytical procedures such as incomplete filling of test tubes, vigorous shaking of samples, short or prolonged coagulation time, high centrifugation speed, transportation, storage, and temperature variations may induce or accelerate hemolysis.
Among all preanalytical factors that can affect serum sample quality, hemolysis is the most common one and can lead to rejection of the samples at clinical laboratories.5,6 Plasma and serum are considered hemolyzed at free hemoglobin levels >0.02 and 0.05 g/L, respectively, but hemolysis does not become visible until hemoglobin concentrations reach 0.30 g/L. 7 The serum indices, however, provide semiquantitative levels of hemolysis, icterus, and lipemia, based on absorbance measurements, and can be used to determine the degree of potential analytical interference in spectrophotometric analyses. Hemoglobin and bilirubin have maximum absorbances at 415 and 460 nm, respectively, whereas lipemia may be detected in the range of 300–700 nm. 8
The gold standard for hemoglobin measurement has been the direct cyanomethemoglobin method, also known as Drabkin's method. 9 This method has major disadvantages; it is time consuming and requires the use of hazardous cyanide reagents. 10 Currently the most common method used in hospital laboratories is spectrophotometric measurement at 340 nm (primary wavelength) and 700 nm (secondary wavelength). 11 Various methods are commercially available, which measure hemoglobin at 414 nm, or at ratios of 500/524, 570/600, and 410/480 nm, depending on available instruments. 12 All of these methods are sensitive to turbidity and require a relatively large sample volume, which is challenging for biobanks with valuable material in limited quantities.
Biobank samples are typically stored for years and may be subjected to freeze–thaw cycles and, therefore. often appear more turbid than freshly collected samples. Turbid samples can report falsely increased levels of serum components. 13 Interference caused by turbidity is a common challenge for serum analyses using spectrophotometric-based methods and after hemolysis, lipemia is the most frequent endogenous interference that can influence the results of various laboratory methods.
Serum turbidity may be caused by protein precipitation, however, lipemia is the main source of the problem. 14 Lipoprotein particles cause light scattering and increased spectral absorbance. This is a recognized problem in laboratory analyses and may account for up 14% and 49% of registered preanalytical errors among inpatients and outpatients, respectively. 15
Ultracentrifugation has been the recommended method for removing turbidity, 16 however, high-speed centrifugation has been suggested as an acceptable alternative. 17
In this study, we aimed to investigate the performance of a simple method (especially adapted for serum biobanks) for estimating serum hemoglobin levels. We systematically tested the influence of temperature, high-speed centrifugation, and freeze–thaw cycles to account for the effect of turbidity in hemoglobin measurements.
Materials and Methods
Serum and sample preparation
In this study, we included both long-term stored samples and freshly collected samples (i.e., <6 hours), exposed to one freeze–thaw cycle, to investigate the impact of turbidity.
Samples (n = 75) were retrieved from the Janus Serum Bank, a population-based cancer research biobank, which contains serum, from nonfasting individuals, collected between 1972 and 2015. The samples have been stored at −25°C for up to 37 years and represent the full spectrum of turbidity found in the biobank. Further details about the biobank have been published elsewhere. 1 We retrieved 50 μL of each long-term stored sample and divided them into three groups. Two groups underwent centrifugation at 10,000 g at two different temperatures (4°C and 19°C) for 15 minutes, and the third group was centrifuged at 19°C and 20,000 g for 15 minutes (Fig. 1A). The supernatants for each donor were distributed in 4 × 2 μL aliquots used for measurements.
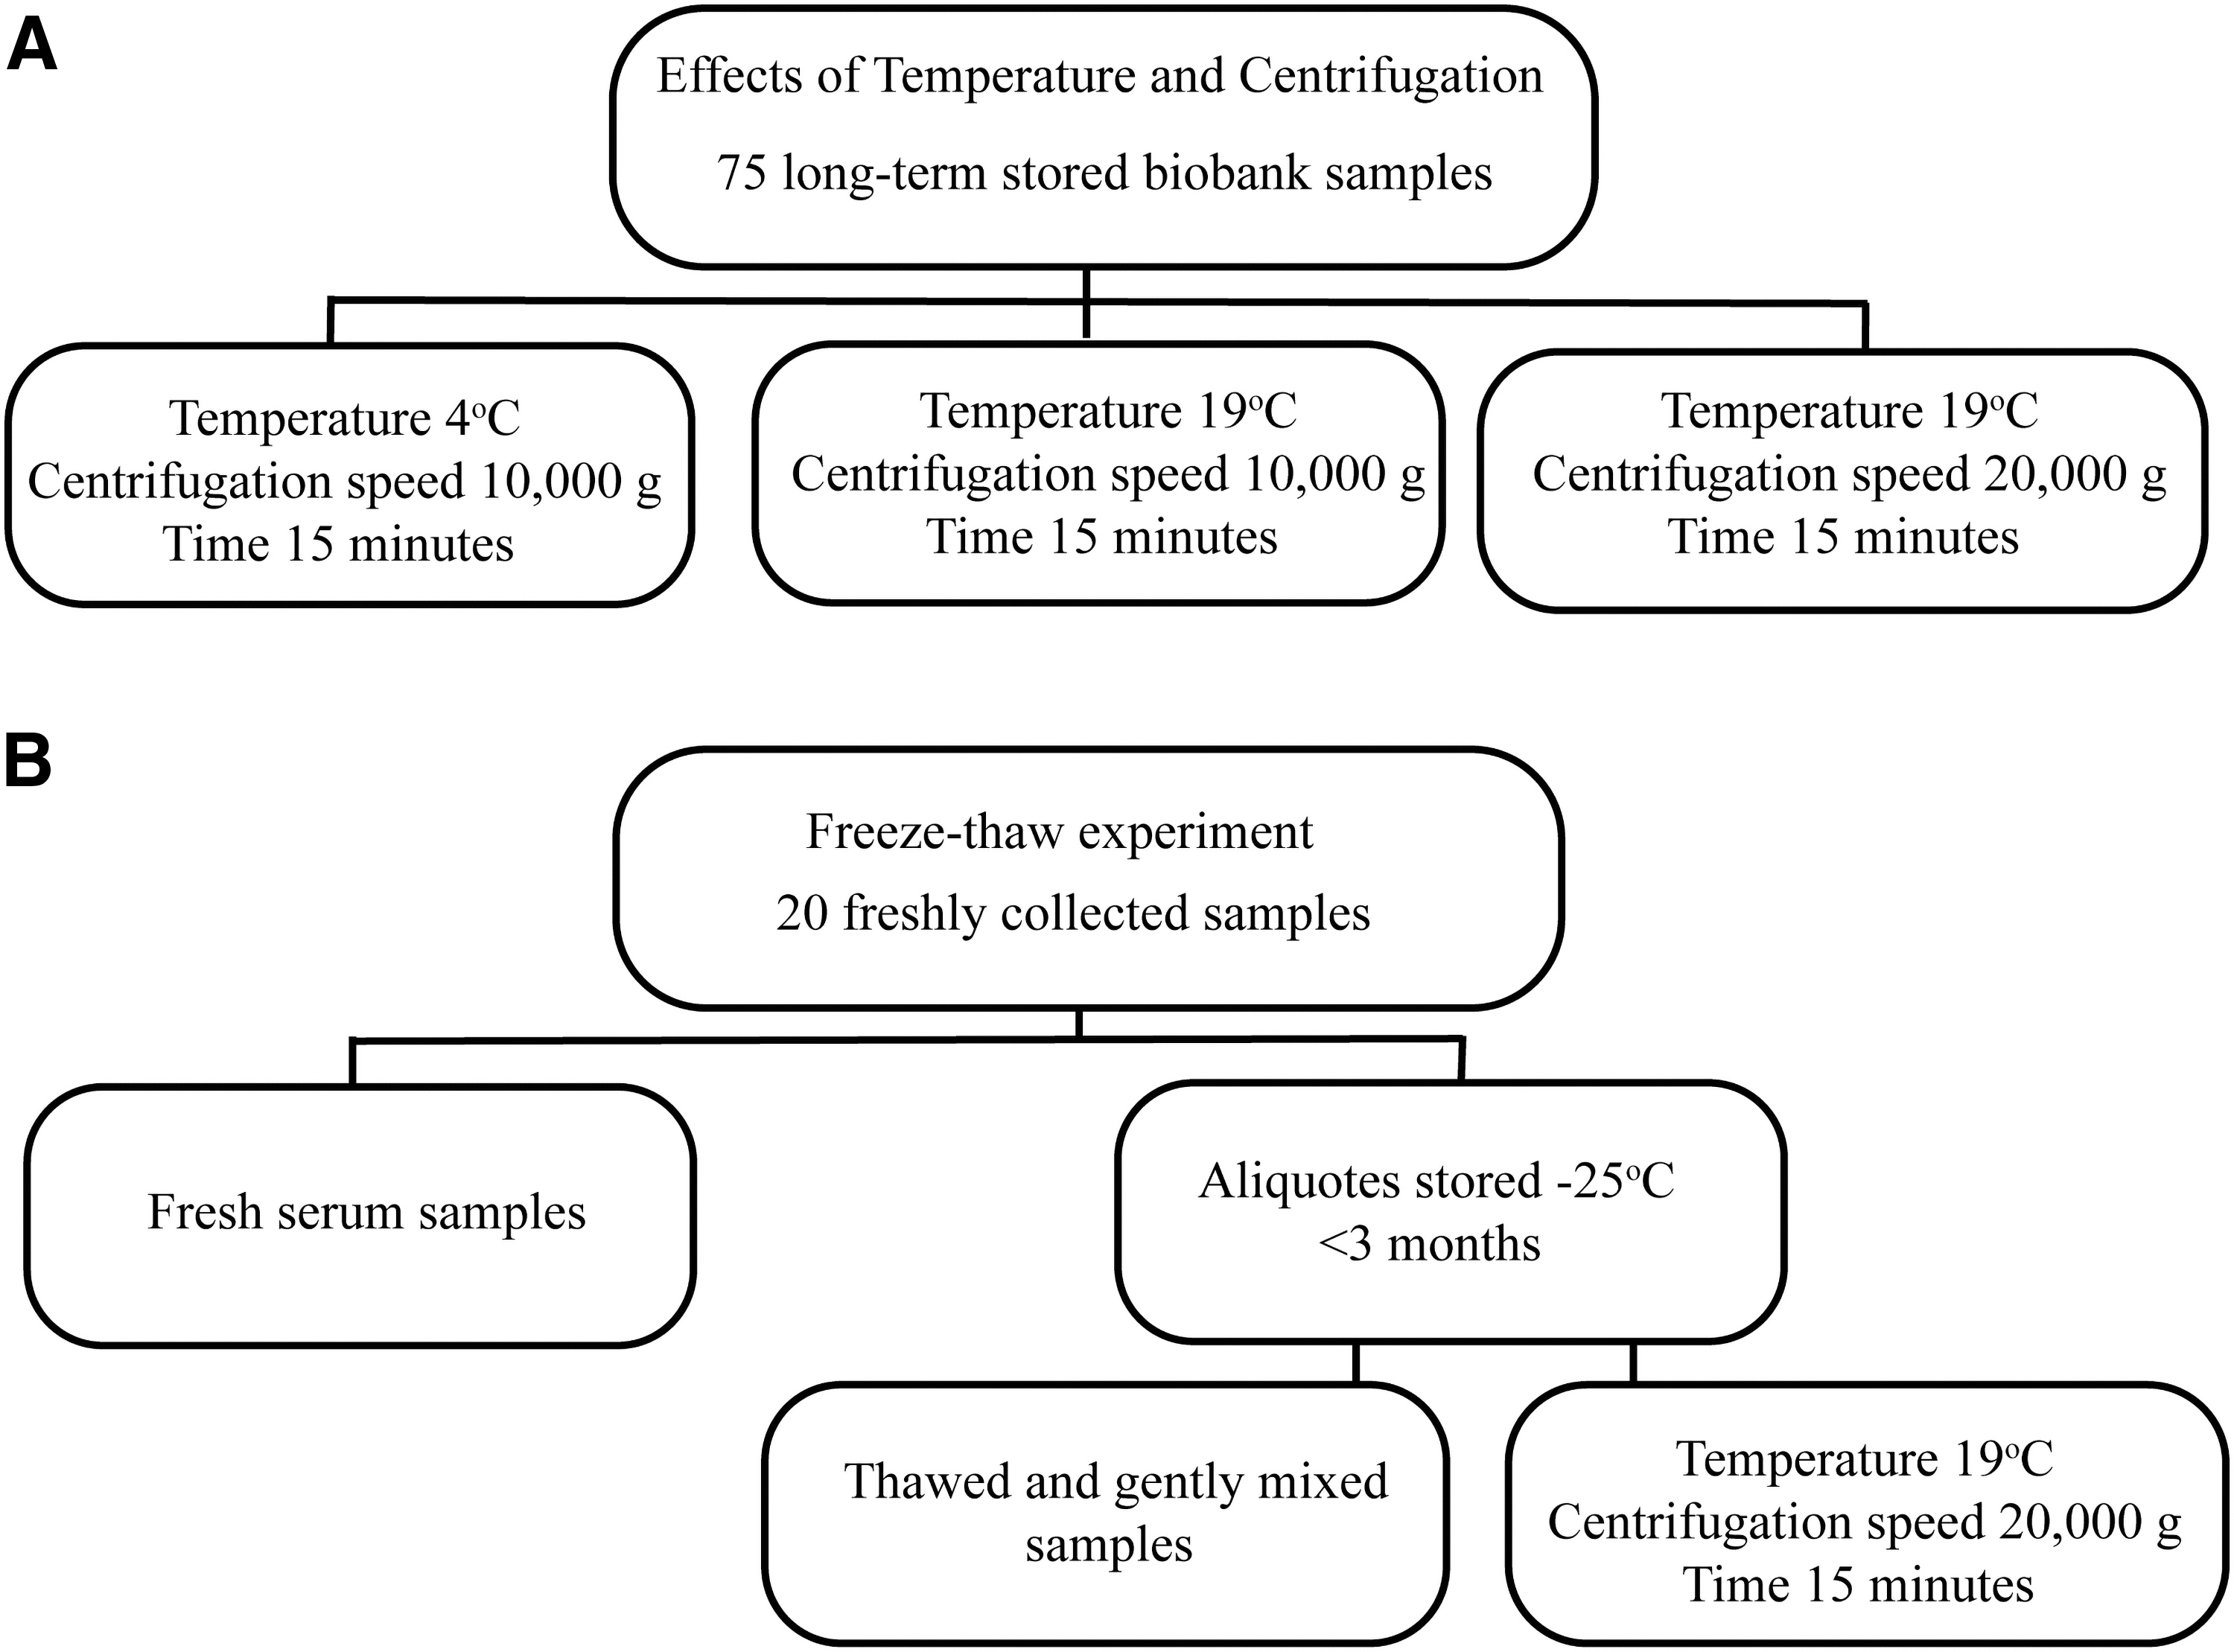
Experimental design for
Blood from 20 nonfasting voluntary donors (four vacutainer glass tubes for each donor) aged 20–60 years and of both genders was sampled in vacutainer glass tubes with no additives (BD Vacutainer 13 × 75 mm, 5 mL, REF 367614). The blood samples were left to coagulate for 1 hour, and centrifuged for 10 minutes at 1200 g. The collected sera from individual donors were then pooled together, homogenized by gentle mixing, and finally aliquoted in multiple storage tubes for further storage. One aliquot was measured directly after sampling, and the others were stored for up to 3 months at −25°C (Fig. 1B).
The frozen samples were thawed at room temperature, mixed for 15 minutes in a roller mixer, and absorbance at 414 nm was measured. Furthermore, the samples were centrifuged for 15 minutes at 20,000 g and 19°C before absorbance was measured at 414 nm.
Hemolysis measurements
The levels of hemolysis in serum samples were obtained by measuring the absorbance of the dominant form of hemoglobin (oxyhemoglobin) in serum at a wavelength of 414 nm using the NanoDrop™ 8000 spectrophotometer.
18
The estimation of hemoglobin concentration was based on the Beer–Lambert equation ( that returns the molar concentration of hemoglobin. The concentration is given in g/L with the equation: (
The samples were analyzed in triplicates and the method showed a day-to-day variation of 6.5% at 0.24 g/L, which was considered acceptable given the low concentration of hemoglobin. The extinction coefficient reported by the literature and used in our study was validated by a standard hemoglobin concentration of 20 mg/L (Sigma Aldrich H0267) diluted to eight different concentrations of hemoglobin and measured at 414 nm. A fitted line between the molar amount of hemoglobin used and the sample absorbance showed a slope equal to the extinction coefficient (509,312 /Mcm), which was close to the literature-reported coefficient.
Instrumentation
An Eppendorf 5702 centrifuge was used for separation of serum and blood cells. A Heraeus Fresco 21 centrifuge was used for high-speed centrifugation. Hemoglobin concentration was measured by a NanoDrop 8000 spectrophotometer.
All methods and procedures were carried out in accordance with relevant guidelines and regulations including ethical standards. All experimental protocols were approved by the Janus Serum Bank steering committee at the Cancer Registry of Norway. The study is based on informed broad consent obtained from all donors. The project was evaluated by the Norwegian Regional Ethical Committee (Ref 235304).
Statistics
For data analyses we used R: a language and environment for statistical computing. 20 Our data violated assumptions of linear models (including paired t-tests), and, therefore, nonparametric tests were used. To assess differences between the groups, we used the Kruskal–Wallis rank sum test. Furthermore, we used the pairwise Wilcoxon test to assess the contrast between different treatments and the Benjamini–Hochberg method was applied to correct for multiple testing. 21
One sample that was associated with extremely high absorbance at 414 nm, most likely caused by scattering light, was treated as an outlier and excluded from further analysis. An outlier was defined as a value surpassing 4 standard deviations from the mean value.
Results
Effects of temperature and centrifugation speed on hemoglobin quantification in long-term stored samples
The thawed samples from Janus Serum Bank (n = 74) showed a median of 0.53 g/L (interquartile range: 0.31) of hemoglobin and this concentration was reduced to almost half of its value after any applied centrifugation regime (Table 1). The Kruskal–Wallis rank sum test showed an overall significant difference between the groups (chi-squared = 109.37, df = 3, p < 0.001). The contrasts between different treatments by the pairwise Wilcoxon test showed a strong effect of centrifugation, however, this effect was independent of the temperature or centrifugation speeds (all were p < 0.001 compared with prior centrifugations) (Table 2).
Effects of Temperature and Centrifugation Speed on Hemoglobin Quantification in Long-Term Storage Samples
Median and IQR for hemoglobin level (g/L).
IQR, interquartile range.
Pairwise Comparisons Between Median Differences for Treatments Using Wilcoxon Rank Sum Test, p-Value
Bold values indicate p-value < 0.001.
Effects of a single freeze–thaw cycle on hemoglobin levels in fresh serum samples
A single freeze–thaw cycle increased the optical density at 414 nm slightly, indicating a false increase of hemoglobin concentration, whereas the following centrifugation reduced the hemoglobin concentration to less than the initial sample measurements. The median values are presented in Table 3 and all raw data are presented in the Supplementary Data S1.
Effects of a Single Freeze–Thaw Cycle on Hemoglobin Levels in Biobank Specimens
First quartile, median, third quartile, and IQR for hemoglobin level (g/L) are shown. n stands for number of samples. IQR is shown as a difference between the upper and lower quartile.
The Kruskal–Wallis test showed an overall significant difference between the groups (chi-squared = 6.72, df = 2, p = 0.035). The pairwise Wilcoxon test showed a significant contrast between thawed samples and samples that had both been thawed and treated with high-speed centrifugation (Table 4).
Pairwise Comparisons of the Median Differences Between Treatments Using Wilcoxon Rank Sum Test, p-Values Indicated
Bold values indicate p-value < 0.05.
Discussion
Blood-based biobanks are an important resource for medical studies, which require high-quality samples. However, blood sampling is a manual process that can introduce several preanalytical errors, including hemolysis, which can influence the measurement of serum components.22,23 Hemolysis is a well-recognized problem in analytical methods of serum samples, and information regarding the degree of sample hemolysis in research biobanks can be very valuable.
This study presents a simple and effective method to measure hemolysis in biobank samples and evaluates the performance of the measurements depending on interference in the samples. We believe this method can be used further for determining the percentage of hemolysis, however, a comparative calibration of this method is required with state-of-the-art approaches (especially use of certified standards with known levels of hemolysis independent to our standards). We have not explored this possibility here, but have indicated that this is straightforward to recalculate.
The samples used represent the whole spectrum of their visual appearance in the Janus Serum Bank and were treated as one group in the statistical analyses. This rests on the assumption that a selection of samples for a research project would contain serum samples with varying degrees of turbidity. The wide range of samples most likely explains why our data required nonparametric tests.
The first part of the study focused on the impact of temperature and centrifugation on serum samples (n = 74) that had been stored long term and thawed. A strong effect of centrifugation was observed and was independent of the temperatures investigated (4°C and 19°C) or the centrifugation speed (10,000 and 20,000 g). All groups treated with centrifugation showed a significant (p < 0.001) decrease in hemoglobin measurements at 414 nm, compared with the group that was not centrifuged, likely due to decreased turbidity from the centrifugation treatment. The median hemoglobin concentration was decreased by 49.0% and 50.9% postcentrifugation at 10,000 and 20,000 g, respectively, indicating that centrifugation of 20,000 g gives a slightly better result for removing turbidity; however, this was not significant.
The results suggest that centrifugation is a necessary step before any measurement of hemoglobin. The feasibility of high-speed centrifugation should further facilitate the use of this method in ordinary laboratories, and especially those in biobank facilities. The centrifugation could possibly negatively impact the measurement of other components in a biosample, such as hormones, drugs, or other hydrophobic substances, which has been shown previously in the literature. 14 Therefore, caution is advised if such measurements are desired. In addition, bilirubin and C-reactive protein have been shown to be affected by high-speed centrifugation. 24 However, for genomic applications, such as miRNA, estimating the impact of hemolysis is critical for robustness of the conclusion from such data. 25
Furthermore, we investigated the impact of a single freeze–thaw cycle on the turbidity by comparing the collected fresh serum samples according to treatment received (prefreezing, post-thaw, and post-thaw with high-speed centrifugation).
There was a significant difference in turbidity between thawed samples, and those that underwent high-speed centrifugation. This indicated a formation of interference after a single freeze–thaw cycle. The removal of turbidity gave hemoglobin values even lower than the baseline values in fresh samples. However, as the samples were collected from nonfasting individuals, it could indicate that the fresh samples were already affected by a certain degree of turbidity immediately after sampling. As we did not include in our design the samples directly centrifuged before freezing (which is unusual treatment in biobank preservation anyway), we cannot rule out that the initial interference might already be introduced at this stage. This is, however, unlikely, as none of the collected samples were cloudy.
Using the NanoDrop 8000 spectrophotometer to measure hemoglobin concentration has several advantages. The assay is fast (a few seconds) and needs no other sample pretreatment other than high-speed centrifugation. The method provides an accurate estimation of hemolysis, is inexpensive, simple, and safe, and only small amounts of the biobank samples have to be used. When biobank material is used in research projects, the hemoglobin levels should be a standard covariate, delivered quantitatively as a quality indicator. Reducing the interference in samples with centrifugation is simple to perform and a high-speed centrifuge is likely available in most biobank facilities.
It is important to be aware that the method is sensitive to interference. Measurements were made only for a major form of hemoglobin (oxyhemoglobin) and the effectiveness of this method for detecting other forms was not tested. Finally, the extinction coefficient, calculated for hemoglobin, can potentially vary depending on the properties of the serum, which may skew the results slightly.
In conclusion, we present a simple, economical, fast, and sensitive spectrophotometric-based method for measurement of hemolysis in serum. The method requires only a small volume of samples and can detect hemolysis even in highly turbid samples. We recommend that biobank facilities report hemoglobin concentrations in samples used for research projects that measure components known to be affected by hemolysis.
Footnotes
Authors' Contributions
All authors contributed to the study conception and experimental design. The first draft of the article was written by R.E.G. and M.W.W. All authors commented on the previous versions of the article. U.B. performed the laboratory work and M.W.W. performed the statistical analysis, and produced figures. Final version was revised by M.W.W., U.B., and R.E.G. All authors read and approved the article.
Acknowledgments
The authors thank the anonymous voluntary donors for their blood samples used in this research. The authors thank three anonymous reviewers for their valuable comments during preparation of this article.
Author Disclosure Statement
No conflicting financial interests exist.
Funding Information
Study was funded by The Research Council of Norway, Biobank Norway II, ID 245464/F50.
References
Supplementary Material
Please find the following supplemental material available below.
For Open Access articles published under a Creative Commons License, all supplemental material carries the same license as the article it is associated with.
For non-Open Access articles published, all supplemental material carries a non-exclusive license, and permission requests for re-use of supplemental material or any part of supplemental material shall be sent directly to the copyright owner as specified in the copyright notice associated with the article.