
Abstract
We explore a hypothesis in which the detection of classes of lipid-like molecules with similar abundance-averaged lengths would constitute a biosignature for other worlds. This is based on the functional requirements of membrane molecules: they must have enough hydrophobic length to not diffuse away from the membrane, be capped by one or two hydrophilic polar groups, and also maintain a semipermeable membrane. Our hypothesis is that once membrane thickness is set in a biological system, it is very difficult to modify it, due to the necessity to redesign all the other associated molecules; the membrane thickness will be constant across all molecular classes that constitute membranes resulting from a common ancestor. In such a scenario, similar thickness values would thus constitute a biosignature and cross-correlate between different molecular classes. We tested this hypothesis by developing a simple method to use modeled lengths of lipid-like molecules to estimate the thicknesses of membranes formed by these molecules. We examined abundance patterns of four different classes of membrane molecules used by terrestrial life: fatty acids, glycerol dialkyl glycerol tetraether lipids, carotenoids, and ladderanes from microbial isolates and environmental samples, as well as abiotic samples of fatty acids. We found that the modeled cell membrane thicknesses from each of these molecular classes were similar and gave results consistent with the observed values. From these results, we propose that our approach provides a framework to identify potential membrane component molecules as an agnostic biosignature. The power of our approach is that our method enables multiple molecular classes to be compared and provides increasing confidence of a biological detection.
Introduction
The search for life beyond Earth is one of the overarching goals for planetary exploration (Hand and German, 2018; National Academies of Sciences, Engineering, and Medicine, 2019). Many molecules and molecular measurement techniques have been proposed as key indicators of, and tools to detect, extraterrestrial life (Neveu et al., 2018). Several of these approaches look for abundances of molecular species resulting from synthesis that would not be expected given a presumed abiotic chemical background. The logic in that approach is that unexpected molecules or patterns of molecules suggest active biosynthesis or metabolism using catalyzed or directed pathways that preferentially create (or degrade) these molecules (Lovelock, 1965). Another approach states that, for cellular life to exist, there must be specific lipid hydrocarbon compositional patterns that can only be produced by biological processes. Most significant patterns are hydrocarbon chain length, unsaturation, and branching, as they are a universal requirement related to lipid bilayer fluidity and membrane stability (Georgiou and Deamer, 2014).
Our approach is to examine the functional requirements of a cellular membrane—a defining requirement for cellular life—and develop a molecular identification and measurement strategy based on intrinsic requirements for membrane-spanning molecules in aqueous environments. This approach enables correlation across multiple chemical families, generates an estimate of transmembrane thickness, and provides an indicator of membrane structure and morphology. In this work, we explore a hypothesis in which the detection of molecules or several classes of lipid-like molecules with similar abundance-averaged lengths would constitute an agnostic biosignature for other worlds.
We assume that alien living cellular systems in an aqueous environment will contain a cellular membrane. We use the term “agnostic” to imply that, while the molecules used by an alien biochemistry in its cellular membranes may not necessarily be fatty acids, glycerol dialkyl glycerol tetraether lipids (GDGTs), carotenoids, or ladderanes, they will share some of the key features: an extended hydrophobic region and one or two polar end capping groups (Georgiou and Deamer, 2014). These structures form diagnostic indicators. Thus, if an alien aqueous cellular system has a membrane, it is likely to need molecules that fit these characteristics.
As a basic requirement, cellular membranes need to separate the cellular interior (cytosol) from its external environment (Mulkidjanian et al., 2009). It is also critical that the cell is able to control the passage of certain ions across the membrane in order to (1) maintain osmotic pressure and energy-driving gradients, (2) acquire nutrient and energy-providing molecules, (3) prevent buildup of waste products, and (4) provide some level of structural integrity to prevent membrane disruption and diffusion of interior contents away into the surrounding aqueous solution. Other embedded molecules in this membrane structure can also provide properties that allow controlled, or uncontrolled, selective or non-selective passage of key molecules. In addition, the component molecules must be large enough that they stay in the membrane structure and do not diffuse away into the aqueous environment. For fatty acids, this generally requires a carbon chain length longer than 8 carbons (C8) (Budin et al., 2014).
The overall structure of a cellular membrane can be based on either molecular bilayers or monolayers (Fig. 1). To maintain a semi-permeable barrier, the membrane molecules need to be able to shift and repack to maintain integrity around larger membrane-bound structures (membrane-bound proteins, porins, ion channels, etc.). In general, membranes are composed of a set of molecules with a hydrophilic end that faces the aqueous exterior side and a hydrophobic core region that determines the central interior section of the membrane (see Siliakus et al., 2017; Fig. 1 in their text). If the membrane has a bilayer structure, then the molecules that compose the two layers need to have an exterior-facing hydrophilic end and an interior (with respect to the membrane)-facing hydrophobic end; the two hydrophobic ends of the hydrophilic-hydrophobic molecules match up to create a bilayer. If the membrane is a monolayer, then the component molecules will have a membrane-spanning hydrophobic aliphatic region with hydrophilic polar groups on both ends that face the outer and inner side of the membrane. The hydrophobic effect, which holds membranes together, excludes not only water but also hinders ion passage and allows ionic gradients to occur (Meyer et al., 2006; Wagner and Schreiner, 2014). It is postulated that the development of energy production from membrane-ionic gradients is a critical feature of life and co-evolved with development of ionic impermeability of the membrane (Mulkidjanian et al., 2009); in other words, membrane structure drove early evolution.
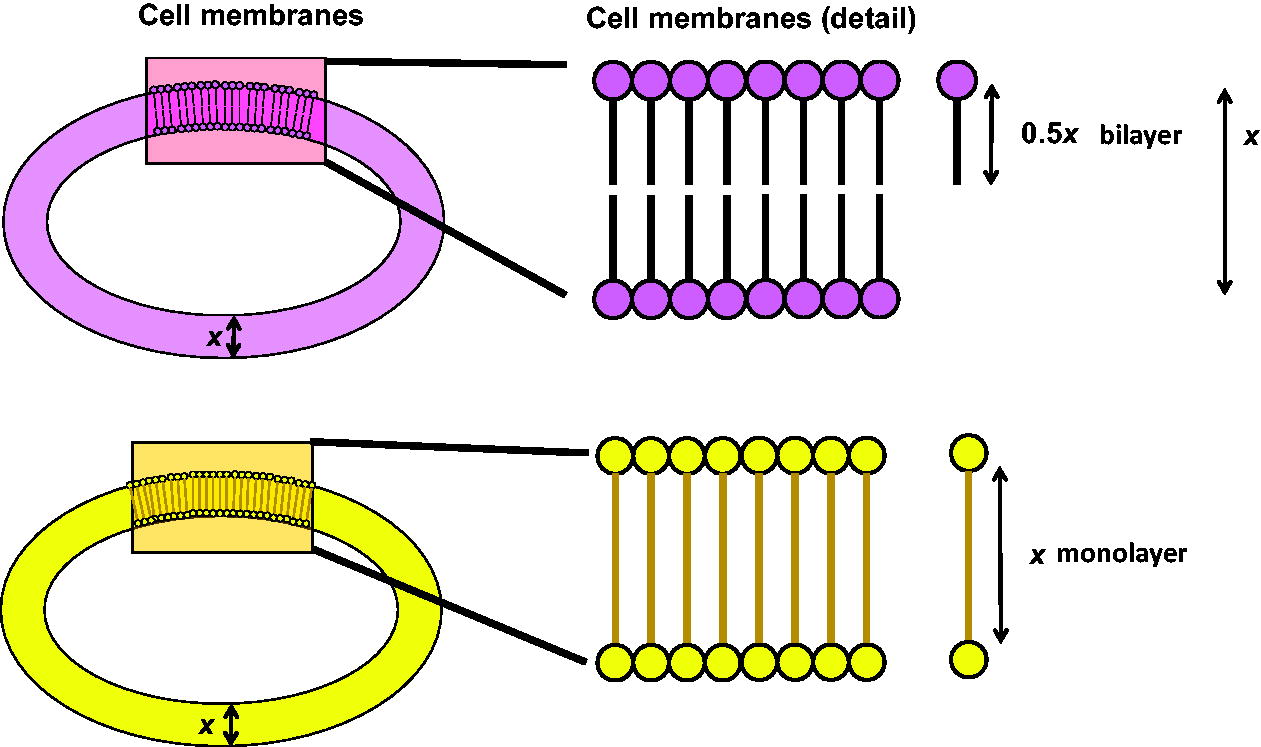
Simplified general scheme of two types of cell membranes: one with a bilayer (top, magenta) and one with a monolayer (bottom, yellow) (left). The colored squares represent membrane areas detailed in the right side of the graphic. The bilayer membrane detail (in magenta, top right representation) shows molecules with a hydrophilic polar end and a hydrophobic non-polar region. The monolayer membrane (in yellow, bottom right representation) is composed of molecules with a hydrophobic non-polar region terminated on both sides by polar hydrophilic functional groups. In both graphics, the hydrophobic regions of molecular subunits are represented by a line, while the terminal polar sections are represented by a colored circle. x represents the membrane thickness. For a monolayer, the molecules in the layer will have an average length equal to x; for a bilayer, the molecules in the bilayer will have an average length of approximately 0.5x.
For most terrestrial membrane molecules, the aqueous-interacting functional groups are hydroxyl groups attached to sugars, phosphate groups (usually appended through a hydroxyl group as part of a phosphoester), carboxylate residues, or even sulfate residues (Siliakus et al., 2017). The non-polar lipid membrane-spanning sections include saturated and partially unsaturated long chain hydrocarbon sections, linked isoprene units, or in some cases, complex fused-ring saturated carbocycles (Schouten et al., 2000; Boumann et al., 2009a Dawson et al., 2012; Siliakus et al., 2017). The membrane component molecules are principally held together though enthalpic-entropic hydrophobic effects; molecules with longer hydrophobic chains increase the hydrophobic effect through decreased solubility of the chains in water. For fatty acids, increasing the chain length exponentially decreases the experimentally determined minimum concentration required for self-assembly into micelles (Budin et al., 2014). In effect, fatty acid chains shorter than C8 require concentrations in the molar range to create a micelle (Budin et al., 2014); this sets a practical size limit for membrane formation under the conditions studied. Depending on the chemical reactivity of the environment, other hydrophilic core scaffolds may be theoretically possible, including alkynes, cumulenes, aromatic core sections, extended halocarbons (such as sulfochlorolipids found in Ochromonas), hydrophobic polyethers, or even more complex non-polar molecules (Chen et al., 1976; Deamer et al., 2002; Deamer and Dworkin, 2005; White et al., 2016). Membranes primarily composed of other non-canonical molecules (e.g., hydrophobic alpha-helix) are possible, as long as any intermolecular “gaps” between these molecules can be filled with molecules smaller in cross-section than the gaps in order to prevent ion leakage.
The molecular structure of membrane components, their interactions, and properties of the chemical surroundings (chelating ions, pH), along with pressure and temperature, are all factors that combine to determine the formation and functionality of membranes. Most terrestrial membranes exist as a complex mosaic of sections of various physical states or phases (for a review, see Nicolson, 2014); the interplay and control of these states determines fluidity and permeability (Siliakus et al., 2017). Terrestrial life has developed several strategies to sense, control, maintain, and modify the viscoelastic state of the cell membrane in response to changing conditions (Chintalapati et al., 2004; Gruszecki and Strzałka, 2005; Shivaji and Prakash, 2010; Rattray et al., 2010; Usui et al., 2012; Singh et al., 2017; Bale et al., 2019). For example, having membrane molecules with shorter extended hydrophobic lengths decreases intermolecular interactions, which allows membrane fluidity at lower temperatures. However, if the component molecules are too small, they may diffuse quickly out of the membrane. In contrast, if the membrane components are too large, their size can lead to partial solidification and slow membrane mobility and permeability. Increased pressure can cause solidification and membrane rigidity (Oger and Cario, 2013; Cario et al., 2015), while high ionic strength environments can influence membrane mobility through coordination of the outer anionic head groups, although bacterial responses to this are less clear; see Prakash et al. (2015). What constitutes an “ideal” balanced hydrophobic chain length is a combination of many factors, but the combination is particularly sensitive to temperature and pressure (for details on the biochemical cascades and controls involved in the low-temperature membrane adaptations of bacteria, see Shivaji and Prakash, 2010).
Aside from modification of hydrophobic chain length, other structural modifications include the addition of double bonds, cis in particular, poly-unsaturation, rings, and branching in order to modulate membrane properties (phase changes) and ion permeability (Chan et al., 1971; Kaneda, 1991; Usui et al., 2012; Wagner and Schreiner, 2014). Some additive membrane-bound molecules are able to modulate both structure and other effects as well: the addition of carotenoid molecules in membranes can locally modify membrane properties, effectively thinning the membrane (McNulty et al., 2007; Johnson et al., 2018). The balance of all the component molecules and their properties is important for maintaining optimum membrane fluidity and will be dependent on the local environmental conditions of temperature, pressure, and ionic concentrations.
Membrane component molecules are not the only molecules in the membrane. Other functional molecules exist as part of the cell that must interact with or be embedded in the membrane—these include receptors, ion channels, molecular transporters, and any enzymes that have transmembrane domains. These embedded molecules need to be able to interact or effectively “float” in the membrane by having molecules or sections of molecules that can interact with the hydrophobic zone (Mouritsen and Bloom, 1984). If the membrane thickness were dramatically changed, for example, then those embedded molecules or structures would also need to be modified to accommodate the new thickness without a loss in functionality (Montecucco et al., 1982; Mouritsen and Bloom, 1984; Stieger et al., 2021).
Life is presented with a balancing act to adapt membranes to changing physical conditions. While modifications such as shorter, more bent molecules can change the average viscoelastic properties of a membrane, the overall average “effective” transmembrane thickness needs to be maintained. We refer to average “effective” thickness as the average bulk distance x perpendicular to the local upper and lower surfaces of the membrane (Fig. 1) that the molecules span when embedded in the membrane’s hydrophobic environment.
Given these constraints, while the individual components can be modified to change the viscoelastic properties to maintain fluidity, the weight-averaged estimated membrane thickness (referred to as x) needs to be maintained to accommodate embedded transmembrane constructs. For this reason, we hypothesize that for life that evolved from a common precursor, the transmembrane span x will need to remain roughly constant. We propose that weight-averaged estimated membrane thickness x (Fig. 1) determined from a particular molecular class can be used to cross-correlate membrane-spanning molecular classes, and that this can serve as an agnostic biosignature for cellular membranes in an aqueous environment. In addition, it provides an initial indication of the membrane thickness of the cells.
We test this hypothesis using extant terrestrial life by determining the membrane thicknesses x derived from terrestrial molecular abundances of membrane components such as fatty acids, GDGTs, carotenoids, and ladderanes (Fig. 2). These chemical classes are four types of molecules that have been used to build membranes for terrestrial life (although carotenoids are not a primary component of cell membranes, they are used to modulate membrane properties in different organisms).
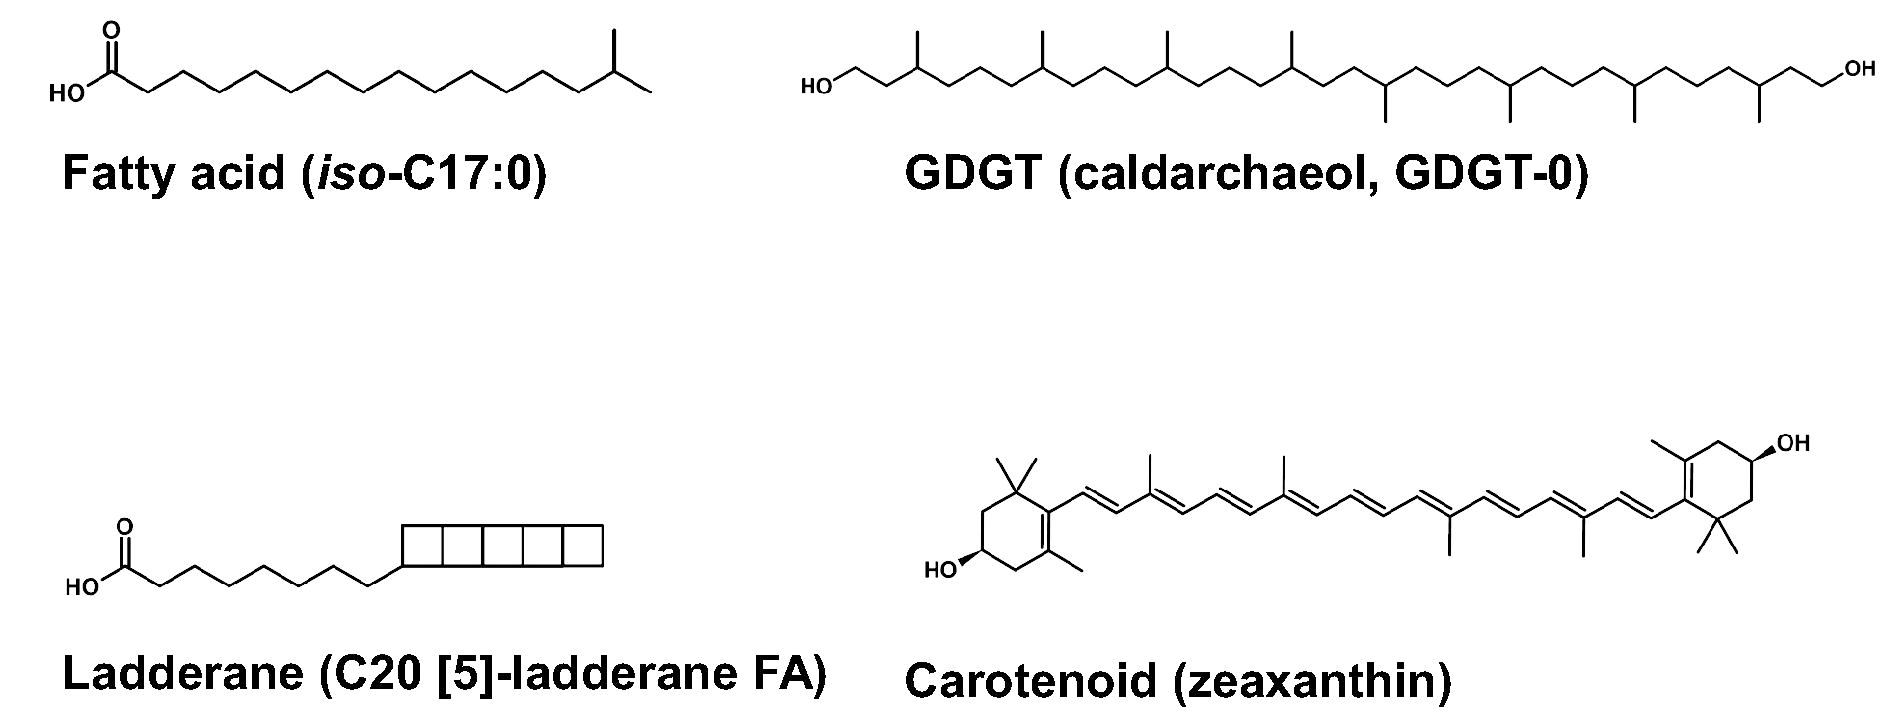
Structural representations of examples from four molecular classes of membrane-spanning molecules found in terrestrial organisms: fatty acids (iso C17:0), GDGTs (archaeol, GDGT-0), ladderanes (C20[5]), and carotenoids (zeaxanthin). For fatty acid nomenclature, we use the convention that the number of total chain carbon atoms is shown before the colon, and the number of degrees of unsaturation is after the colon. For the double bond locants, we use the “delta” nomenclature, which starts from the carbonyl carbon as position 1 and counts toward the terminal end. For GDGT nomenclature, we use the naming convention presented in Wang et al. (2012) and Hannah et al. (2016), and for ladderane nomenclature we use the convention presented in Rattray et al. (2010) where the number in brackets indicates continuous fused cyclobutanes.
Fatty acids are the dominant molecules for bilayer cell membranes found in bacteria and eukaryotes. GDGTs create a membrane monolayer and are found in archaea. GDGTs are often found in sediments and have been used to determine paleotemperatures (Hanna et al., 2016). Carotenoids are found in microbial cells (including both bacteria and archaea) and can play many functional roles. In membranes, carotenoids can be a key adjuvant as they help “tie” the membrane together. Ladderanes are found in anammoxosome (lipid bilayer membrane-bound compartment inside ammonia oxidizing bacteria where anaerobic ammonium oxidation takes place) membranes as well as the cell walls of ammonia oxidizing bacteria. A more detailed description of each chemical class can be found in the Supplementary Data (Supplementary Data S1).
Abiotic sources of some of these molecules are also possible. Fatty acids have been found in meteorites (Shimoyama et al., 1989; Naraoka et al., 1999; Herd et al., 2011; Pizzarello et al., 2012; Aponte et al., 2014) and have been generated in the laboratory from CO2 and H2 (McCollom et al., 1999). Laboratory simulation of interstellar synthesis as well as extract of organics from meteorites has shown that some of these molecules may be capable of forming pre-biotic micelles or vesicles (Deamer, 1985; Dworkin et al., 2001) and may have been involved in the early origin of cellular membranes on Earth (Deamer et al., 2002). In general, abiotic synthesis produces smaller and simpler molecules compared with directed biological synthesis (Lovelock, 1965). Any technique developed for astrobiological exploration needs to distinguish potential biologically derived molecules from an abiotic background.
For each of these chemical families, we transcribed molecular abundances from the literature for diverse microbial isolates and varying environmental samples as well as from abiotic sources (meteorites and laboratory experiments). From the list of all component molecules, we then used molecular modeling to estimate the lengths of each molecule. From the relative molecular abundances and component lengths, we estimated the membrane thickness for each sample. To test the generality of membrane-spanning molecular lengths and the resulting estimated membrane thicknesses as an agnostic biosignature, we compared the results for biological systems with those of abiotic systems.
After modeling and calculations, our results confirm that the estimated membrane thicknesses from different molecular classes are similar and provide insight into the observed cell membrane thicknesses from microscopy. We also find that the estimated membrane thickness from biologically derived molecular abundance distributions can be distinguished from those of abiotic (laboratory or meteorite) molecular abundance distributions.
We transcribed from literature sources the relative molecular abundances for fatty acids, GDGTs, carotenoids, and ladderanes from cultured microbes, environmental samples, mineral samples, and laboratory-synthesized abiotic samples. We biased our choice of cultures and environmental samples toward terrestrial analogs and conditions of putative martian permafrost and ocean world environments (Priscu and Hand, 2012; Garcia-Lopez and Cid, 2017; Vance et al., 2018). Our isolates favored psychrophiles (D’Amico et al., 2006; Bakermans and Skidmore, 2011), halophiles (Upasani et al., 1994; Yatsunami et al., 2014), and piezophiles (Nogi et al., 2002; Liu et al., 2018). Our isolates and environmental samples were biased toward samples from polar deep ice (Mader et al., 2006; Price, 2009; Margesin and Miteva, 2011) and deep cold ocean environments (Nogi et al., 2002; Liu et al., 2018) to explore the membrane modification strategies life has used to adapt to these conditions and reveal potential molecular modification strategies for life on other worlds (Bakermans, 2017; Hassan et al., 2020b; Jebbar et al., 2020). We also included in our dataset some thermophiles and hyperthermophiles with 40 cultures grown at or above 318 K (45°C), with the highest temperature culture grown at 369 K (96°C). From these and other literature sources (see Supplementary sections S6, S7, S8, S9, S10, S11, S12, S13, and S14), we compiled a comprehensive list of molecules found in each molecular class. The molecules identified in our literature sources are in Supplementary Data S2, S3, S4, and S5 for fatty acids, GDGTs, carotenoids, and ladderanes, respectively.
Nomenclature of the molecules follows standard conventions. For fatty acids, we use the nomenclature system where the number of total chain carbon atoms is shown before the colon, and the number of degrees of unsaturation is after the colon. For the double bond locants, we use the “delta” nomenclature, which starts from the carbonyl carbon as position 1 and counts toward the terminal end. In this nomenclature system, palmetoleic acid (IUPAC: (9Z)-Hexadec-9-enoic acid) would be referred to as C16:1 del 9 cis. Iso- and anteiso- branched fatty acids are designated by the appropriate prefix. For GDGTs we use the nomenclature system based on iso-GDGTs and br-(branched)-GDGTs that is presented in Wang et al. (2012) and Hanna et al. (2016), respectively. In general, lower numbers have the fewest rings or branches. We used the shortest chain to determine modeled hydrophobic section length (l) for the membrane thickness calculation. For ladderanes, we use the nomenclature system presented in Rattray et al. (2010), which incorporates an abbreviated nomenclature scheme for ladderane fatty acids based on total number of carbons and the number of rings at the terminal end. Those with “[5]” have five cyclobutane rings in alternate cis-ring fusion, while “[3]” consists of a cyclohexane ring cis-fused alternately with three cyclobutane rings.
Modeling of hydrophobic molecules
We used theoretical chemistry methods to obtain model estimations of lipid lengths in membranes. We did so by structurally optimizing the maximally extended conformer of each molecule in vacuum. The maximal extension represents the largest possible distance that a membrane spanning molecule could stretch while in a stable conformation. Because the membrane is a dynamic environment, we used the maximal extension of the molecule to obtain an upper estimate of the molecule length (l) and membrane thickness (x). The maximally extended lipid was identified by visual inspection and molecular modeling. We then generated preliminary molecular structures by structurally optimizing the most-extended “gauche” conformations using the generalized AMBER force field (Wang et al., 2004) as implemented in Avogadro (Hanwell et al., 2012). Subsequently, structures were refined through geometry optimization using density functional theory. We used the B3LYP exchange correlation functional, which is based on the hybrid Hartree-Fock formulation of Becke (1993), together with the Grimme et al. (2011) dispersion (D3) correction and a 6–31 + G(d,p) basis set. The quantum chemical calculations were performed using Gaussian 16, revision B.01 (Frisch et al., 2016). Dynamic stability of all conformers was evaluated through frequency analyses at the same level of computational theory. In the few instances where stretched conformers were unstable, as indicated by imaginary vibrational modes, a close-lying stable structure was identified by moving atoms slightly and reoptimizing the structure.
Following geometric optimization, the maximum hydrophobic lengths (l) were determined in two different ways that depended on whether the molecule consisted of one or two polar end groups (see Fig. 3). For molecules with one polar end group, the through-space distance was measured from the most-distant hydrogen on the terminal CH3 unit to the first “linkable” heteroatom (which was usually oxygen) bound to the nearest carbon along the chain. We defined “linkable” as a heteroatom that could be covalently bound to a polar group, such as a sugar, or a phosphate, or as a hydroxy. Thus, a free carboxylate, or alcohol, is a linkable heteroatom, while an ether (such as methoxy) is not considered a “linkable” heteroatom. For lipids with more than one hydroxyl group at the polar end, we considered the oxygen that is closest to the terminal methyl as the linkable heteroatom with the minimum distance. For extended molecules with two polar end groups, the length of the hydrophobic region was instead defined by the distance between oxygens in hydroxyl groups at opposing ends. For molecules with two polar groups and more than one polar group at either end, we selected the polar group (usually oxygen) closest to the center of the extended molecule to define the minimum extended hydrophobic span. For ladderane fatty acid molecules, we used the same protocol described for fatty acids, except we determined the distances using the most distal cyclobutane-bound hydrogen instead of the terminal CH3 hydrogen. Modeled distances were recorded to the nearest 0.01 Å.
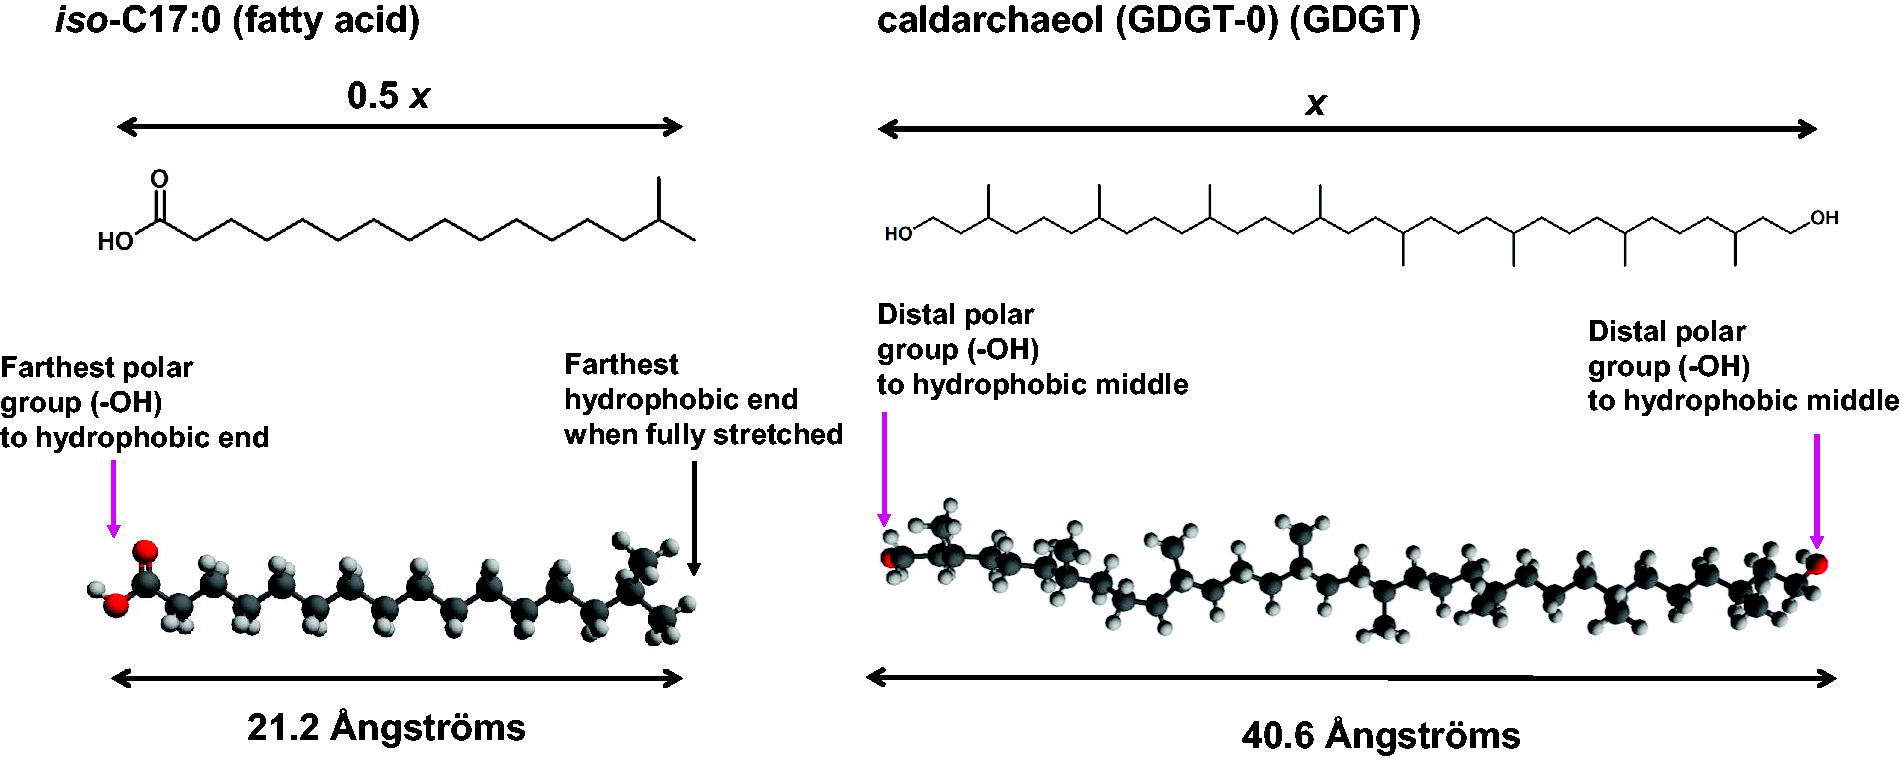
Examples of distance calculation of energy-minimized extended structures: the left side of the graphic shows a structural representation of iso-C17:0 (a fatty acid, part of a bacterial membrane bilayer). The calculated distance between the terminal hydrogen of an isopropyl group and the carboxylate oxygen corresponds to 0.5x, half the hydrophobic zone of an intact cell membrane. The right side of the graphic shows a structural representation of the membrane spanning section of caldarchaeol (iso-GDGT-0, a component of an archaeal membrane monolayer in the GDGT chemical class). For this molecule, the calculated distance between the two terminal oxygen atoms corresponds to x, the span of the hydrophobic zone of an intact cell membrane.
For GDGTs there is an additional consideration to determine length. GDGTs contain two transmembrane hydrophobic chains linked on two ends by capping glycerol molecules (Fig. 3). To determine appropriate lengths for the hydrophobic section of the linker, we calculated the distances from the terminal oxygens of the bridging hydrophobic section. For calculating distances where the two linkers are dissimilar, we selected the span with the shortest distance. This represents the maximum extension possible for that modeled length. (The maximum extended length cannot be longer than the minimum span). For example, for a C38 spanning subunit in addition to a C42 subunit spanning the same two glycerol end caps, we would select the shorter C38 spanning subunit as the minimum spanning distance for recording estimated membrane thickness.
The full set of molecular structures and their estimated hydrophobic distances can be found in Supplementary Data S2, S3, S4, and S5 for each molecular class.
We extracted molecular abundance distributions for each molecular class from literature sources and used these patterns to determine the weight-averaged estimated membrane thickness. There were rare cases in the literature where degeneracies existed and the exact molecular structure could not be determined between two (rarely, three) different similar structures. In those cases, we assigned the structure based on related molecules that occurred in the same taxonomic clade or environmental sample type. For each reported distribution pattern, abundances were all normalized so that sum for that particular entry was equal to 100%.
For both monolayer and bilayer-membrane component molecules with the polar-hydrophobic chain motif (Fig. 3), the weight-averaged estimated membrane thickness x was calculated as
Table 1 presents an example calculation using the fatty acid pattern of Bacillus subtilis (entry 82 in Supplementary Data S6) presented in Fang et al. (2017) using abundances reported in Gatson et al. (2006). This microbe contained six fatty acids as determined by gas chromatography (GC) analysis of fatty acid methyl esters (FAME analysis). Those fatty acid components were reported as iso-C14:0 (0.99%), iso-C15:0 (30.6%), anteiso-C15:0 (38.8%), C16:0 (4.69%), iso-C17:0 (7.45%), and anteiso-C17:0 (7.55%). However, these percentages extracted from the original literature sum to only 90.08%. Using equation 1, we normalized to 100% total abundance, then summed the modeled lengths (using values from Supplementary Data S2) and multiplied by the adjusted percentages to arrive at a weight-averaged estimated thickness of the monolayer of 19.1 Å. Because fatty acids have a single polarized side and an aliphatic side, and thus would form a bilayer, we then multiplied the calculated monolayer thickness by 2 (Equation 1, with f = 2 since bilayer), which provides an estimated membrane thickness of 38.2 Å.
Example Membrane Thickness Calculation from Bacillus subtilis Fatty Acid Pattern
Our dataset consists of 1039 reported molecular abundances of fatty acids, GDGTs, carotenoids, and ladderanes. Our dataset of fatty acids from bacterial isolates contains 229 abundance distributions collected from 58 references in the scientific literature (Supplementary Data S6). The fatty acid isolate dataset has representatives from 5 bacterial phyla, 10 classes, 24 orders, 37 families, and 55 genera. Details of the literature and how those abundances were transcribed can be found in Supplementary Data S1, specifically text sections S1.2 and included subsections, while text section S1.4 details the structure of the different data tables in Supplementary Data S2, S3, S4, S5, S6, S7, S8, S9, S10, S11, S12, S13, and S14.
From the reported environmental samples, we generated a dataset of 138 fatty acid molecular abundance patterns (Supplementary Data S7). The entries included 68 samples from polar regions, including 3 ice cores (Kawamura et al., 1996; Nishikiori et al., 1997; Pokrhel et al., 2015), 15 moraine samples (Yoshitake et al., 2006), 25 samples from an Antarctic lake (Mancuso et al., 1990), 25 samples from Arctic sea ice (Kohlbach et al., 2020), 15 marine deepwater sediments (>5 km below the sea surface), and 12 patterns from deepwater methane seeps (Hinrichs et al., 2000; Zhang et al., Elvert et al., 2003). We also included a series of 9 abundance patterns from marine samples that were bulk-cultured in the presence of high amounts of hydrocarbons in a pressure reactor during a monitored time course (Syatki et al., 2006). Because the microbes were not isolated as a pure culture, we treated this as a series of field samples. (Following analysis, these samples were unremarkable in comparison to similar sea bottom samples.) Our transcribed data also included entries from hydrothermal areas, such as 19 patterns from Icelandic hot springs (Williams et al., 2021) and the Dallol hydrothermal field (Carrizo et al., 2019). We included reported fatty acids that were shorter than C8.
We extracted a dataset based on 16 fatty acid abundance distributions reported in the literature from abiotic sources (Supplementary Data S8). These included 2 purely synthetic laboratory Fischer-Tropsch type (FTT) synthesis experiments by McCollom et al. (1999) and 14 meteoritic samples that had been extracted and analyzed for fatty acids. Our dataset includes both CR and CM meteorites (references provided in Supplementary Data S8) and also data from multiple Tagish Lake meteorite fragments (4 samples from Tagish Lake, entries 3–6, Supplementary Data S8) (Herd et al., 2011). When reported, we included fatty acids that were shorter than C8.
We extracted 39 GDGT abundance distributions from isolated cultures (Supplementary Data S9). All of these were archaeal, consisting of 3 phyla, 5 classes, 5 orders, 5 families, and 8 genera. Six cultures were performed at elevated pressures. In addition, we extracted 432 GDGT patterns from environmental samples (Supplementary Data S10). We biased our dataset toward polar/cryosphere (284 sample locations were from higher than 60 degrees latitude) or mountain/high altitude samples. We included samples from lake sediments (129 entries), marine sediments (72 entries), and permafrost (combined 108 entries). Our dataset also included mud volcanoes (including undersea) (24 entries) as well as 2 cold seeps (2 entries). Some of the samples came from salt lakes (6 entries) and a hypersaline lagoon (1 entry).
We extracted 52 molecular abundance distributions of bipolar carotenoid molecules from archaeal and bacterial isolates (Supplementary Data S11). Of these, 7 were from Archaea (all from archaeal phylum Euryarchaeota, and archaeal class Halobacteria) and represented 7 archaeal genera. Forty-five patterns were from bacteria, with 7 bacterial phyla, 9 bacterial classes, 12 bacterial orders, 15 bacterial families, and 29 bacterial genera represented. There were 35 different bacterial species. There were 19 cultures that were from 278 K to 283 K (5°C–10°C). There was 1 sample (Supplementary Data S12) with detailed quantitation of carotenoids recovered from extracts from recently deposited 1–5 cm deep marine sediments from the Gdańsk Deep, Baltic Sea (Krajewska et al., 2017).
We extracted 39 ladderane abundance distributions from annamox isolates (Supplementary Data S13). These all came from the same class (Planctomycetia) in phylum Planctomycetes. There were three genera represented. We transcribed 82 ladderane patterns from environmental samples (Supplementary Data S14). There were 52 seawater samples, 25 marine sediment samples, some from as deep as 3 km below the surface, and 5 hot spring samples. Ambient temperatures at the sampled locations ranged from 275 K (+2°C) to 338 K (65°C). Additional details regarding each of these datasets can be found in Supplementary Data S1. Details for the entries for the various types of samples and molecular classes, including provenance, taxonomy, and literature reference, and estimated transmembrane thickness are listed in Supplementary Data S6, S7, S8, S9, S10, S11, S12, S13, and S14.
Estimated uncertainties from instrument measurements of abundances
Details of our estimated uncertainties from our calculations can be found in Supplementary Section S1.2.5. Briefly, we propagated instrumentation uncertainties on the molecular abundances reported in the literature. We estimate that this could create uncertainties on our weight-averaged thicknesses of roughly 10% for the fatty acids examined in Supplementary Section S1.2.5. In the figures and text that follow, we calculate standard deviations based on statistical analysis of the estimated value without taking into account these abundance uncertainties.
Results
Our results are organized in four separate investigations. First, we evaluated estimated transmembrane thicknesses of four families—fatty acids, GDGTs, carotenoids, and ladderanes—to determine whether individual estimates and estimates in different molecular classes provided consistent values in the same molecular class for the same type of samples. These selected molecular classes are dominant components of most cytoplasmic membranes in terrestrial life. Second, we estimated membrane thickness values for a given molecular class (for example, all fatty acids) to determine whether thicknesses were consistent between isolates and environmental samples. Third, we compared the estimated values derived from each molecular class to determine whether a consistent value was generated across the different molecular classes. Finally, we examined the relationship between our estimated values and observed membrane thicknesses.
Fatty acids
Estimated membrane thickness from fatty acid pure bacterial cultures
Figure 4 presents the estimated membrane thickness x from examination of fatty acid abundance patterns from the dataset of pure bacterial cultures. The symbols represent different bacterial classes, with phyla and species presented in alphabetical order. We did not notice a significant difference between Gram-positive (Actinobacteria and Firmicutes) and Gram-negative (Bacteroidetes and Proteobacteria) bacteria. Gram-positive bacteria have a thicker peptidoglycan outer cell well, which is located outside the cytoplasmic membrane bilayer; the presence of a peptidoglycan outer cell wall does not appear to affect the estimated thickness x of the cytoplasmic membrane. The estimated thicknesses are roughly consistent across all the pure culture samples, with values of 38.9 ± 1.9 Å. This estimation agrees with the typical thickness for a bacterial cytoplasmic membrane (usually given as ca. 4 nm = ca 40 Å, see (Phillips et al., 2018) for a specific example with Shewanella oneidensis). Subtle variations can be observed at the phyla and class level in Figure 4, although these variations are near the estimated instrument error (±0.4 Å) of the modeled lengths that could come from instrument effects (see Section 2.4). Many of the bacterial fatty acid distribution patterns are used to help phylogenetically map bacteria into a given class. If these specific patterns carry throughout the clade, then by extension the estimated membrane thicknesses may also be similar.
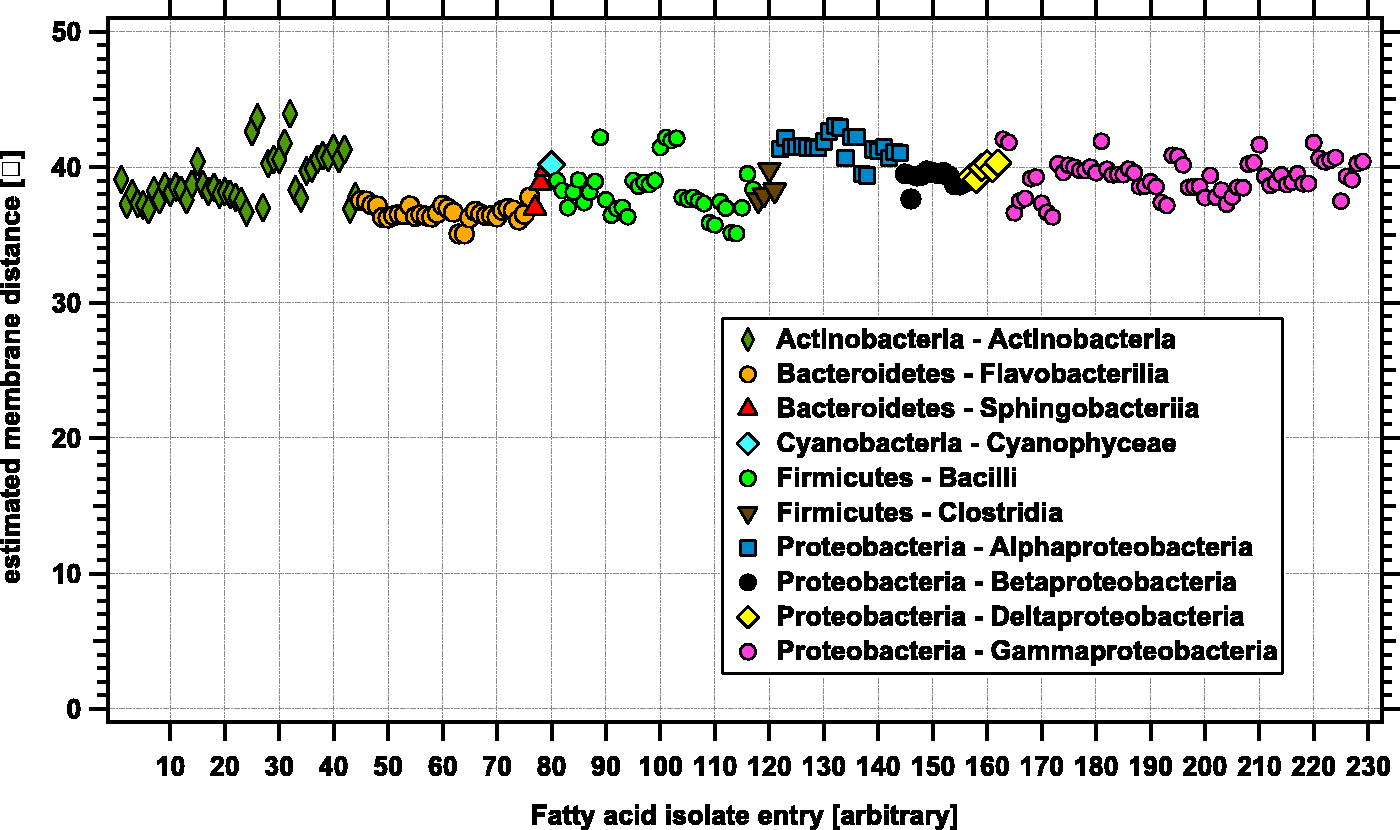
Weight-averaged estimated membrane thickness in Ångströms inferred from fatty acid distribution patterns for a variety of bacterial isolates. The different symbols represent different bacterial classes. The legend lists phyla and class for each symbol. The estimated thicknesses average 38.9 Å for a diverse range of bacterial classes.
We used equation (1) to estimate the average membrane thickness x for the fatty acid pattern from diverse environmental samples. These estimates are for the bulk average derived from the combined population of organisms (i.e., includes archaeal, bacterial, plants, fungal, and animal matter) contained in a given environmental sample. The estimated thicknesses for each sample entry are plotted in Figure 5. We grouped the entries based on terrain and sample type; for a given group, we ordered from left to right samples with increasingly more sediment, either in collected ocean water or in drilled sediments. The full correspondence of entry number to sample reference data can be found in Supplementary Data S6.
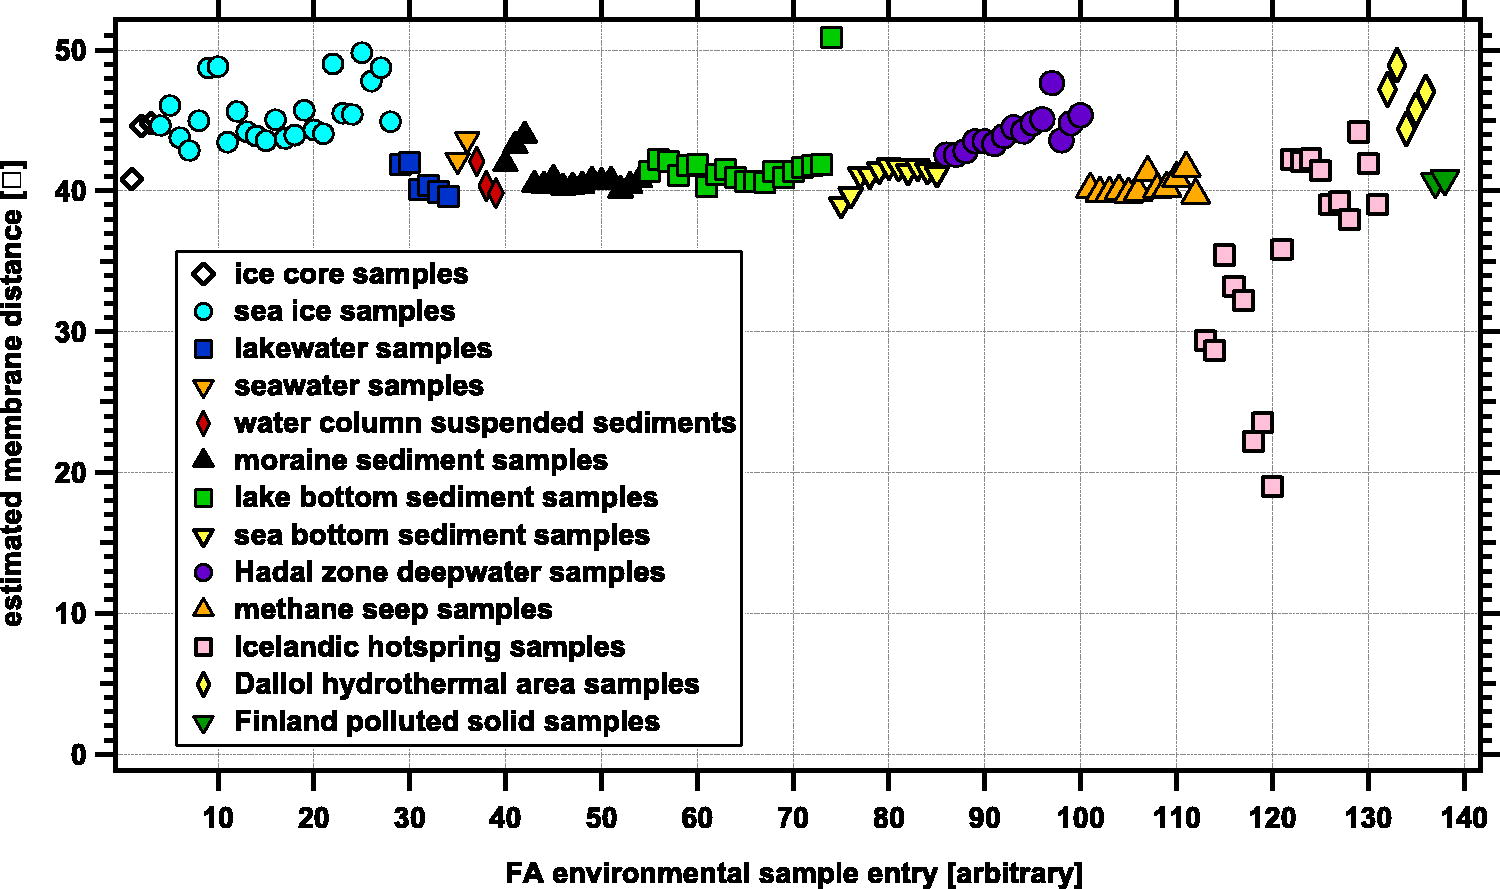
Weight-averaged estimated membrane thickness (y-axis) in Ångströms from various entries (x-axis) of extracted fatty acid patterns from a variety of different environments. The different symbols represent different types of environments; the legend provides a short description of each type of environment. The average estimated thickness from all entries 41.7 ± 4.5 Å, although samples from one of the Icelandic hot springs (Gunnehver) show significantly shorter fatty acids than other samples Williams et al. (2021) (see section 3.1.4).
Our samples ranged from ice core extractions, to marine water and sediments, to hydrothermal areas; an average estimated membrane span for these 138 field samples was 41.7 ± 4.5 Å. This is near but slightly above the values of the pure bacterial culture data; however, it is important to note that the environmental samples included fatty acid inputs from all species: bacteria, fungi, plant, and animal, including exogenous sources as well. Many of the marine and lake samples, according to the authors (Columbo et al., 1996; Wakeham, 1999; Hartgers et al., 2000), showed clear evidence of terrestrial plant inputs, including the longer chain unbranched alternate-pattern fatty acids typical of vascular plants. For environmental samples that contained a mix of different inputs, the length of these plant-derived fatty acids can drive the overall estimated membrane thickness to longer values. This may be one reason for discrepancy between average values for the pure bacterial cultures in Figure 4 and the values for mixed bacterial-phytoplankton-vascular plant inputs in the field samples (Fig. 5).
As an example, one outlier for the lake sediments (green square representing entry 74 in Fig. 5) is a sample from the Lake Ciso anoxic sediments (Hartgers et al., 2000). In that sample, larger two-carbon alternating fatty acids (>C20), ascribed to inputs from terrestrial plants from the surrounding landscape, were detected. Analysis of stable isotope measurements demonstrated the presence of some fatty acids from bacteria in the anoxic lake, but also established that longer fatty acids were delivered from surrounding vascular plants (Hartgers et al., 2000). The plant-derived longer fatty acids biased the estimated thickness of the Lake Ciso sample to larger values (roughly 10 Å or 25% larger) than would be estimated if only the anoxic lake biota were considered.
The sea ice samples (cyan circles representing entries 4–28 in Fig. 5) had estimated thicknesses larger than the average values for all environmental samples. This is due to the inclusion of longer fatty acids from dinoflagellates, diatoms, and calanoid copepods (notable inputs for C20:5, C22:6, and both 20:1 and 22:1, respectively, see Kohlbach et al., 2020) in the sea ice.
The obvious shorter-than-average outliers in Figure 5 are the Icelandic hot spring samples (pink squares representing entries 113–120) described in Williams et al. (2021). Several of the samples included shorter than expected fatty acids for a biological system, such as butanoic (C4), caproic (C5), and hexanoic (C6) short-chain fatty acids. In three of the samples, these acids comprised more than 70% of the overall fatty acid percentage. These outlier samples all came from the Gunnehver Modern Inactive Spring System. Whether these short chain fatty acids result from de novo abiotic fatty acid synthesis or a breakdown-degradation of longer chain fatty acids was not reported. We explore these outliers further in Section 3.1.4. In contrast, another hydrothermal system, the Dallol hydrothermal field (Carrizo et al., 2019), showed a slightly elevated estimated average, driven by longer even-chain alternate fatty acids typical of vascular plants (i.e., C22:0 to C28:0) were detected in these samples.
We also examined fatty acid profiles for samples of abiotic origin, including those generated via FTT reactions and those extracted from meteorites. In general, abiotic synthesis favors shorter chain acids: as chain length increases, the relative abundance of the next higher homolog decreases exponentially based on the probability of chain propagation (Satterfield and Huff, 1982). Due to this effect, the overall average chain length is short, often less than C6.
Carboxylic acids shorter than C6 were not reported in the FTT experiments by McCollom et al. (1999), which were assessed in this study (Fig. 6). Their absence may be an analytical artifact, given that the GC trace was initiated after the presumed elution time (∼7 min under their conditions) for these materials. Thus, the results of the FTT experiments may be artificially biased to longer >C6 carboxylic acids. Despite this bias, the estimated hypothetical membrane thickness values derived from the abiotic fatty acid data (both meteorite data and FTT experiments) are significantly shorter than those from the pure culture and environmental samples (Fig. 6).
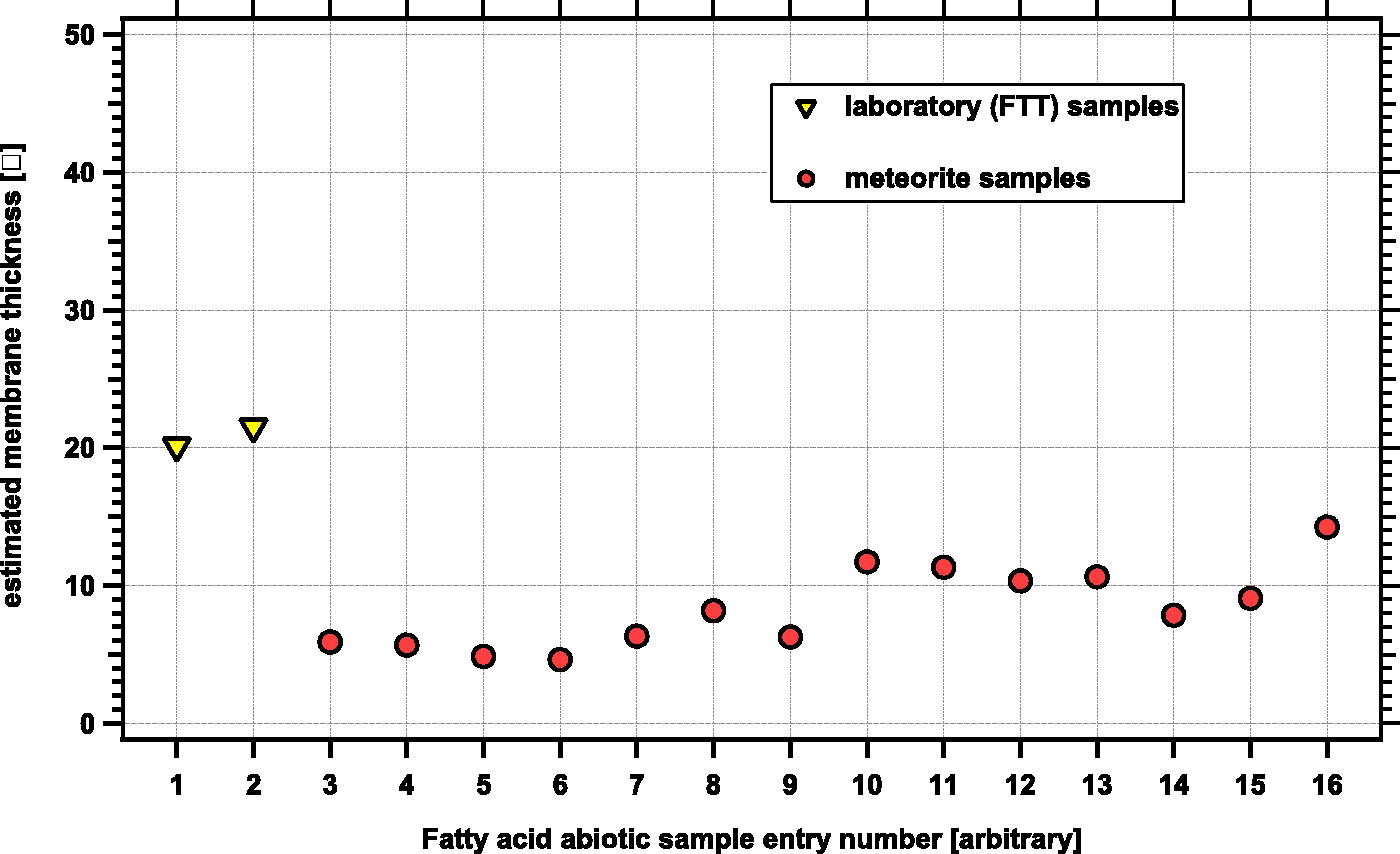
Weight-averaged estimated membrane thickness in Ångströms from extracted fatty acid patterns from meteorites and laboratory synthesis experiments aimed at studying abiotic synthesis. The yellow triangles on the left (entries 1 and 2) are values derived from laboratory synthesis experiments (McCollom et al., 1999); the red circles (entries 3–16) represent values derived from meteorite extraction results (see Supplementary Data S7 for references). For meteorites, the average estimated thickness for all the entries is 8.4 ± 2.8 Å. For laboratory FTT experiments the average is 20.8 ± 0.7 Å, although this may be a bias due to GC recording protocols in experiments by McCollom et al. (1999) (see text).
We performed similar analyses for other molecular classes. These are detailed in Supplementary Data S1. In summary, by examining molecular patterns of GDGTs from pure cultures and environmental samples, we estimated an average membrane thickness for all the isolates as 40.0 ± 1.4 Å. For GDGTs from environmental samples, the average estimated thickness is 37 ± 0.8 Å. Details and graphs can be found in Supplementary Material 1.3.1. For carotenoids, the estimated membrane thicknesses for both microbial isolates and environmental samples are relatively consistent with average values of 32.4 ± 3.3 Å. Details and graphs can be found in Supplementary Material 1.3.2. Ladderanes from microbial isolates have an estimated average thickness of 37.5 Å ± 0.3 Å, while those from environmental samples have an estimated thickness of 34.8 Å ± 0.9 Å. Details and graphs can be found in Supplementary Material 1.3.3.
Comparison of different chemical families found in the same sample
Several samples (including isolate samples and environmental samples) in our literature survey reported molecular distribution patterns that spanned two different chemical families (fatty acids, GDGTs, carotenoids, or ladderanes). We compared the estimated membrane thicknesses for several of these different classes that were found in the same sample. From these comparisons, we noted overall trends between different molecular classes. In general, in the same sample the estimated membrane thicknesses were larger for conformationally flexible molecular classes (such as fatty acids and GDGTs) than those for more rigid molecules (ladderanes, carotenoids). The possible overestimates for conformationally flexible molecules are discussed further in Section 4.3. This suggests that the more conformationally rigid molecular classes may provide a better estimate of the true membrane thickness.
Comparison of estimated membrane thicknesses from fatty acids and carotenoids from the same sample
There were nine samples with both fatty acids and carotenoids from the same isolate and culture conditions. A summary is presented in Table 2. The data spanned six bacterial classes. All the cultures were from Gram-negative bacteria except for Rhodococcus rhodochorus, which stains Gram-positive. (As previously noted, the presence of the peptidoglycan outer cell wall does not appear to significantly influence estimated membrane thicknesses.) Table 2 shows that the estimated membrane thicknesses derived from fatty acid abundance patterns are consistently larger than the values derived from carotenoids. On average, the thickness estimates from fatty acid abundances are roughly 39% larger than those predicted using carotenoid abundances (see Section 4.3).
Estimated Membrane Thickness from Corresponding Fatty Acid and Carotenoid Molecular Abundance Patterns
Estimated Membrane Thickness from Corresponding Fatty Acid and Carotenoid Molecular Abundance Patterns
Unfortunately, in our collected dataset, there were no direct comparisons between archaeal GDGTs and archaeal carotenoids.
There is one instance in our collected dataset where we can indirectly compare estimated membrane thicknesses from fatty acids and those from GDGTs from bulk environmental samples. Both samples came from Ace Lake, Antarctica, although they were measured in two different studies (Mancuso et al., 1990; Schouten et al., 2000). The samples that were analyzed for fatty acid content were presented in Mancuso et al. (1990) and came from 2 m to 23 m depth throughout the water column and lake bottom sediments from 0.5 cm to 198 cm below the sediment-water interface. Our averaged estimated membrane thickness values for fatty acids in the water column and sediments are 40.6 Å and 41.3 Å, respectively (Supplementary Data S6, entries 29–34, and 55–73, respectively). The GDGTs of an Ace Lake sample were part of a broad lake survey presented in Schouten et al. (2000), and our estimated membrane thickness for that sample is 40.6 Å. (Supplementary Data S10, entry 133). While the estimated membrane thickness values derived from both fatty acids and GDGTs are similar for this location, this may be because only one type of GDGT—the non-ring containing chain GDGT-0 (caldarcheol)—was detected in the Ace Lake samples. Samples containing this longer acyclic GDGT-0 have a larger estimated membrane thickness value compared with that of other environmental GDGT samples (the average value of all other environmental GDGT samples is 37 ± 0.7 Å).
Comparison of estimated membrane thicknesses from fatty acids and ladderanes in the same sample
An indirect comparison can be made between fatty acid and ladderane environmental samples from the Black Sea. Wakeham (1999) reported Black Sea fatty acid samples from 30 m, 1000 m, and 2000 m depth (Supplementary Data S6, entries 37–39), for which we derived estimated membrane thickness values of 42.1 Å, 40.4 Å, and 39.8 Å, respectively. Ladderane abundances were presented in Rattray et al. (2010) for a Black Sea location at varying depths from 62 m to 400 m (Supplementary Data S13, entries 41–52). From these data, we calculated an average membrane thickness of 34.9 ± 0.5 Å with a maximum value of 35.5 Å and a minimum value of 34.4 Å (there was no clear trend with depth in this particular transect). The membrane thicknesses derived from the fatty acids in these samples are 20% higher than those from the co-existing ladderanes. This difference is discussed further in Section 4.3.
Comparison of different molecular classes
Table 3 presents the average of estimated membrane thicknesses for all the samples (entries) of the different datasets. These values are presented graphically in Figure 7. Overall, the average values of the different datasets of biologically derived membrane molecules fit the general trends outlined in Sections 3.1–3.3 above. The estimated membrane thicknesses derived from fatty acids and GDGTs are similar both in pure culture and environmental samples. Average estimated membrane thicknesses derived from ladderanes are lower than those derived from fatty acids and GDGTs, while average membrane thicknesses derived from carotenoids are the shortest of the four molecular classes examined. These differences may be due to the conformational rigidity of the molecules (see Section 4.3). The shorter thicknesses of biotic derived samples is from carotenoids is not surprising because carotenoids are known to help “pin” membranes together (Grusecki and Strzałka, 2005, Subczynski et al., 2012; Johnson et al., 2018).
Estimated Length of Different Molecular Classes of Results
Estimated Length of Different Molecular Classes of Results
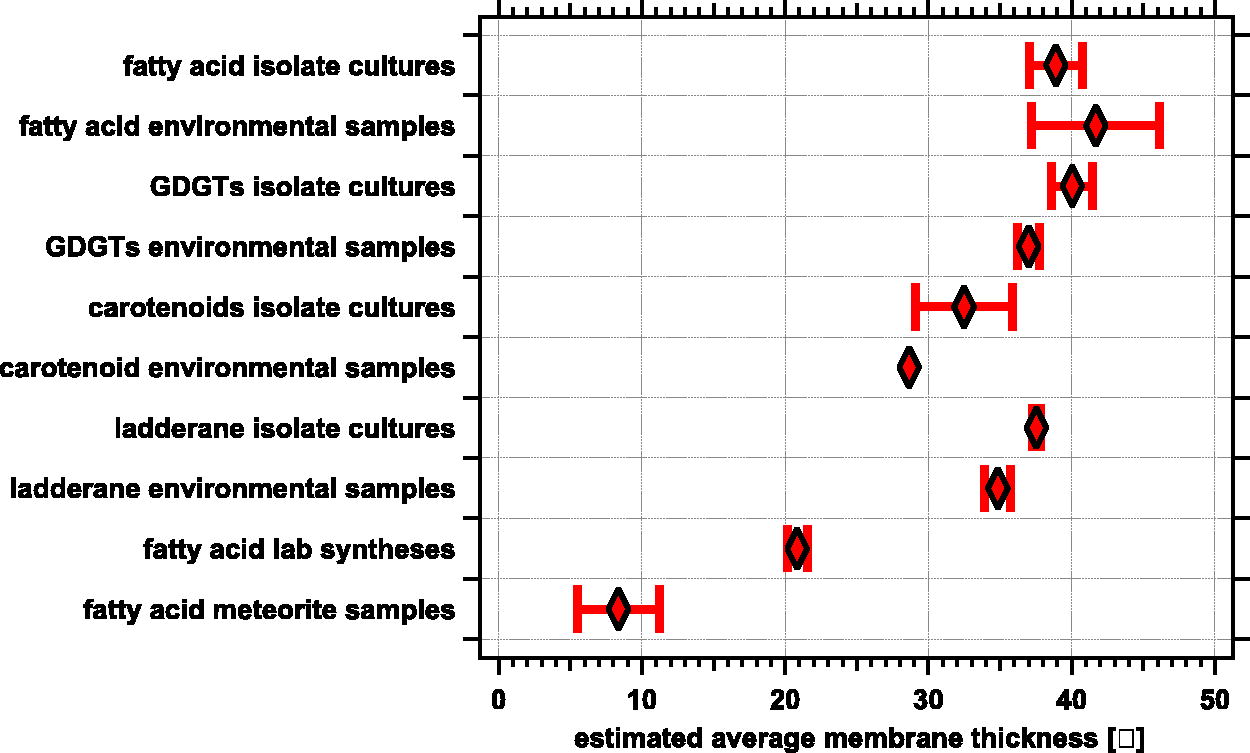
Comparison of estimated membrane thicknesses for multiple classes of molecules. This graphically presents the data in Table 3. In this plot the weight-averaged estimated membrane thickness
Membrane molecular lengths as agnostic biosignatures
We evaluated a protocol for detecting and analyzing membrane-component molecules in a search for evidence of extraterrestrial life. Our results presented in Table 3 and Figure 7 demonstrate the consistent estimated membrane thickness values found across terrestrial membrane component molecules: fatty acids, GDGTs, carotenoids, and ladderanes. While the chemistry and exact molecular structure of an extraterrestrial membrane may be different from those of its terrestrial counterparts, the fundamental physics and chemical principles underlying membrane formation will be similar (Deamer and Dworkin, 2005). We thus expect that transmembrane components of any biological system in an aqueous environment will have large hydrophobic sections of molecules that are functionalized with either mono- or bis-hydrophilic groups. We also expect that component molecules that make up cellular membranes will need to be large enough to prevent the individual component molecules from diffusing away into the aqueous solvent yet not too large to cause a membrane to become rigid and impermeable. To form micelles in liquid water, the aliphatic chains must be longer than 8 carbon atoms (using an abbreviation C8, to indicate the number of carbon atoms in a chain), roughly a distance of 11 Å from the hydroxyl group oxygen and the aliphatic terminus (Budin et al., 2014). Using this minimum size of a mono-functionalized aliphatic molecule as one half of a bilayer membrane implies a minimum estimated thickness of 22 Å. We assume that for synthetic simplicity a nearly symmetrical layer structure will be present, meaning the upper exterior-facing member of a bilayer will be similar to the lower cytosol-facing membrane of the bilayer. The molecules in both bilayers may be mixed, composed of multiple types of molecular classes, but the average overall thickness in that living system will need to be maintained. As with terrestrial life, we expect the estimated thickness in an alien system to be preserved across the alien membrane component molecules, although the exact thickness values may be different from the terrestrial values.
Given a collection of molecules in an unknown sample, the subset of molecules we would target during astrobiological exploration are either (i) molecules with a hydrophobic tail and a polar group or (ii) molecules with long hydrophobic sections that have polar groups on both ends. As noted above, in order to prevent diffusion out of a stable membrane, the molecules would need to have a minimum size larger than C8. These molecules would thus be found by identifying diagnostic large (>C8) hydrophobic regions (for example, extended hydrocarbon chains or extended fused rings) among the molecules detected in a sample. Once subsets of molecules are identified or isolated, the effective estimated membrane thickness measurement could be used for each molecular class and cross-correlated for confidence that a sample was of biological origin.
Our analysis reduces the overall aggregate molecular abundance data to a single value that can be used to distinguish a biotic from an abiotic molecular abundance pattern. From the data presented in Table 3 and Figure 6, abiotic molecules are clearly shorter than the biotic molecules, with measured molecules from FTT laboratory experiments possibly skewed to longer values due to analytical bias. However, even given this bias, the theoretical membrane thickness calculated from the FTT products is 20.8 ± 0.7 Å. Given our instrument error tolerance of ∼10%, we would estimate that the shortest possible biologically derived membrane thickness from environmental carotenoids would be 25.8 Å (Table 3), and that 20.8 Å falls outside this range. The abiotic fatty acids found in meteorites have an average length that is very short (corresponding to C6:0, n-hexanoic acid)—far shorter than could be expected to fit or be maintained in a membrane, at least under ambient conditions. Thus, using our method, a sample containing only abiotic fatty acids would be identified as too short to fit a biological membrane.
Deconvolution of a mixture of both abiotic and biotic patterns in sample
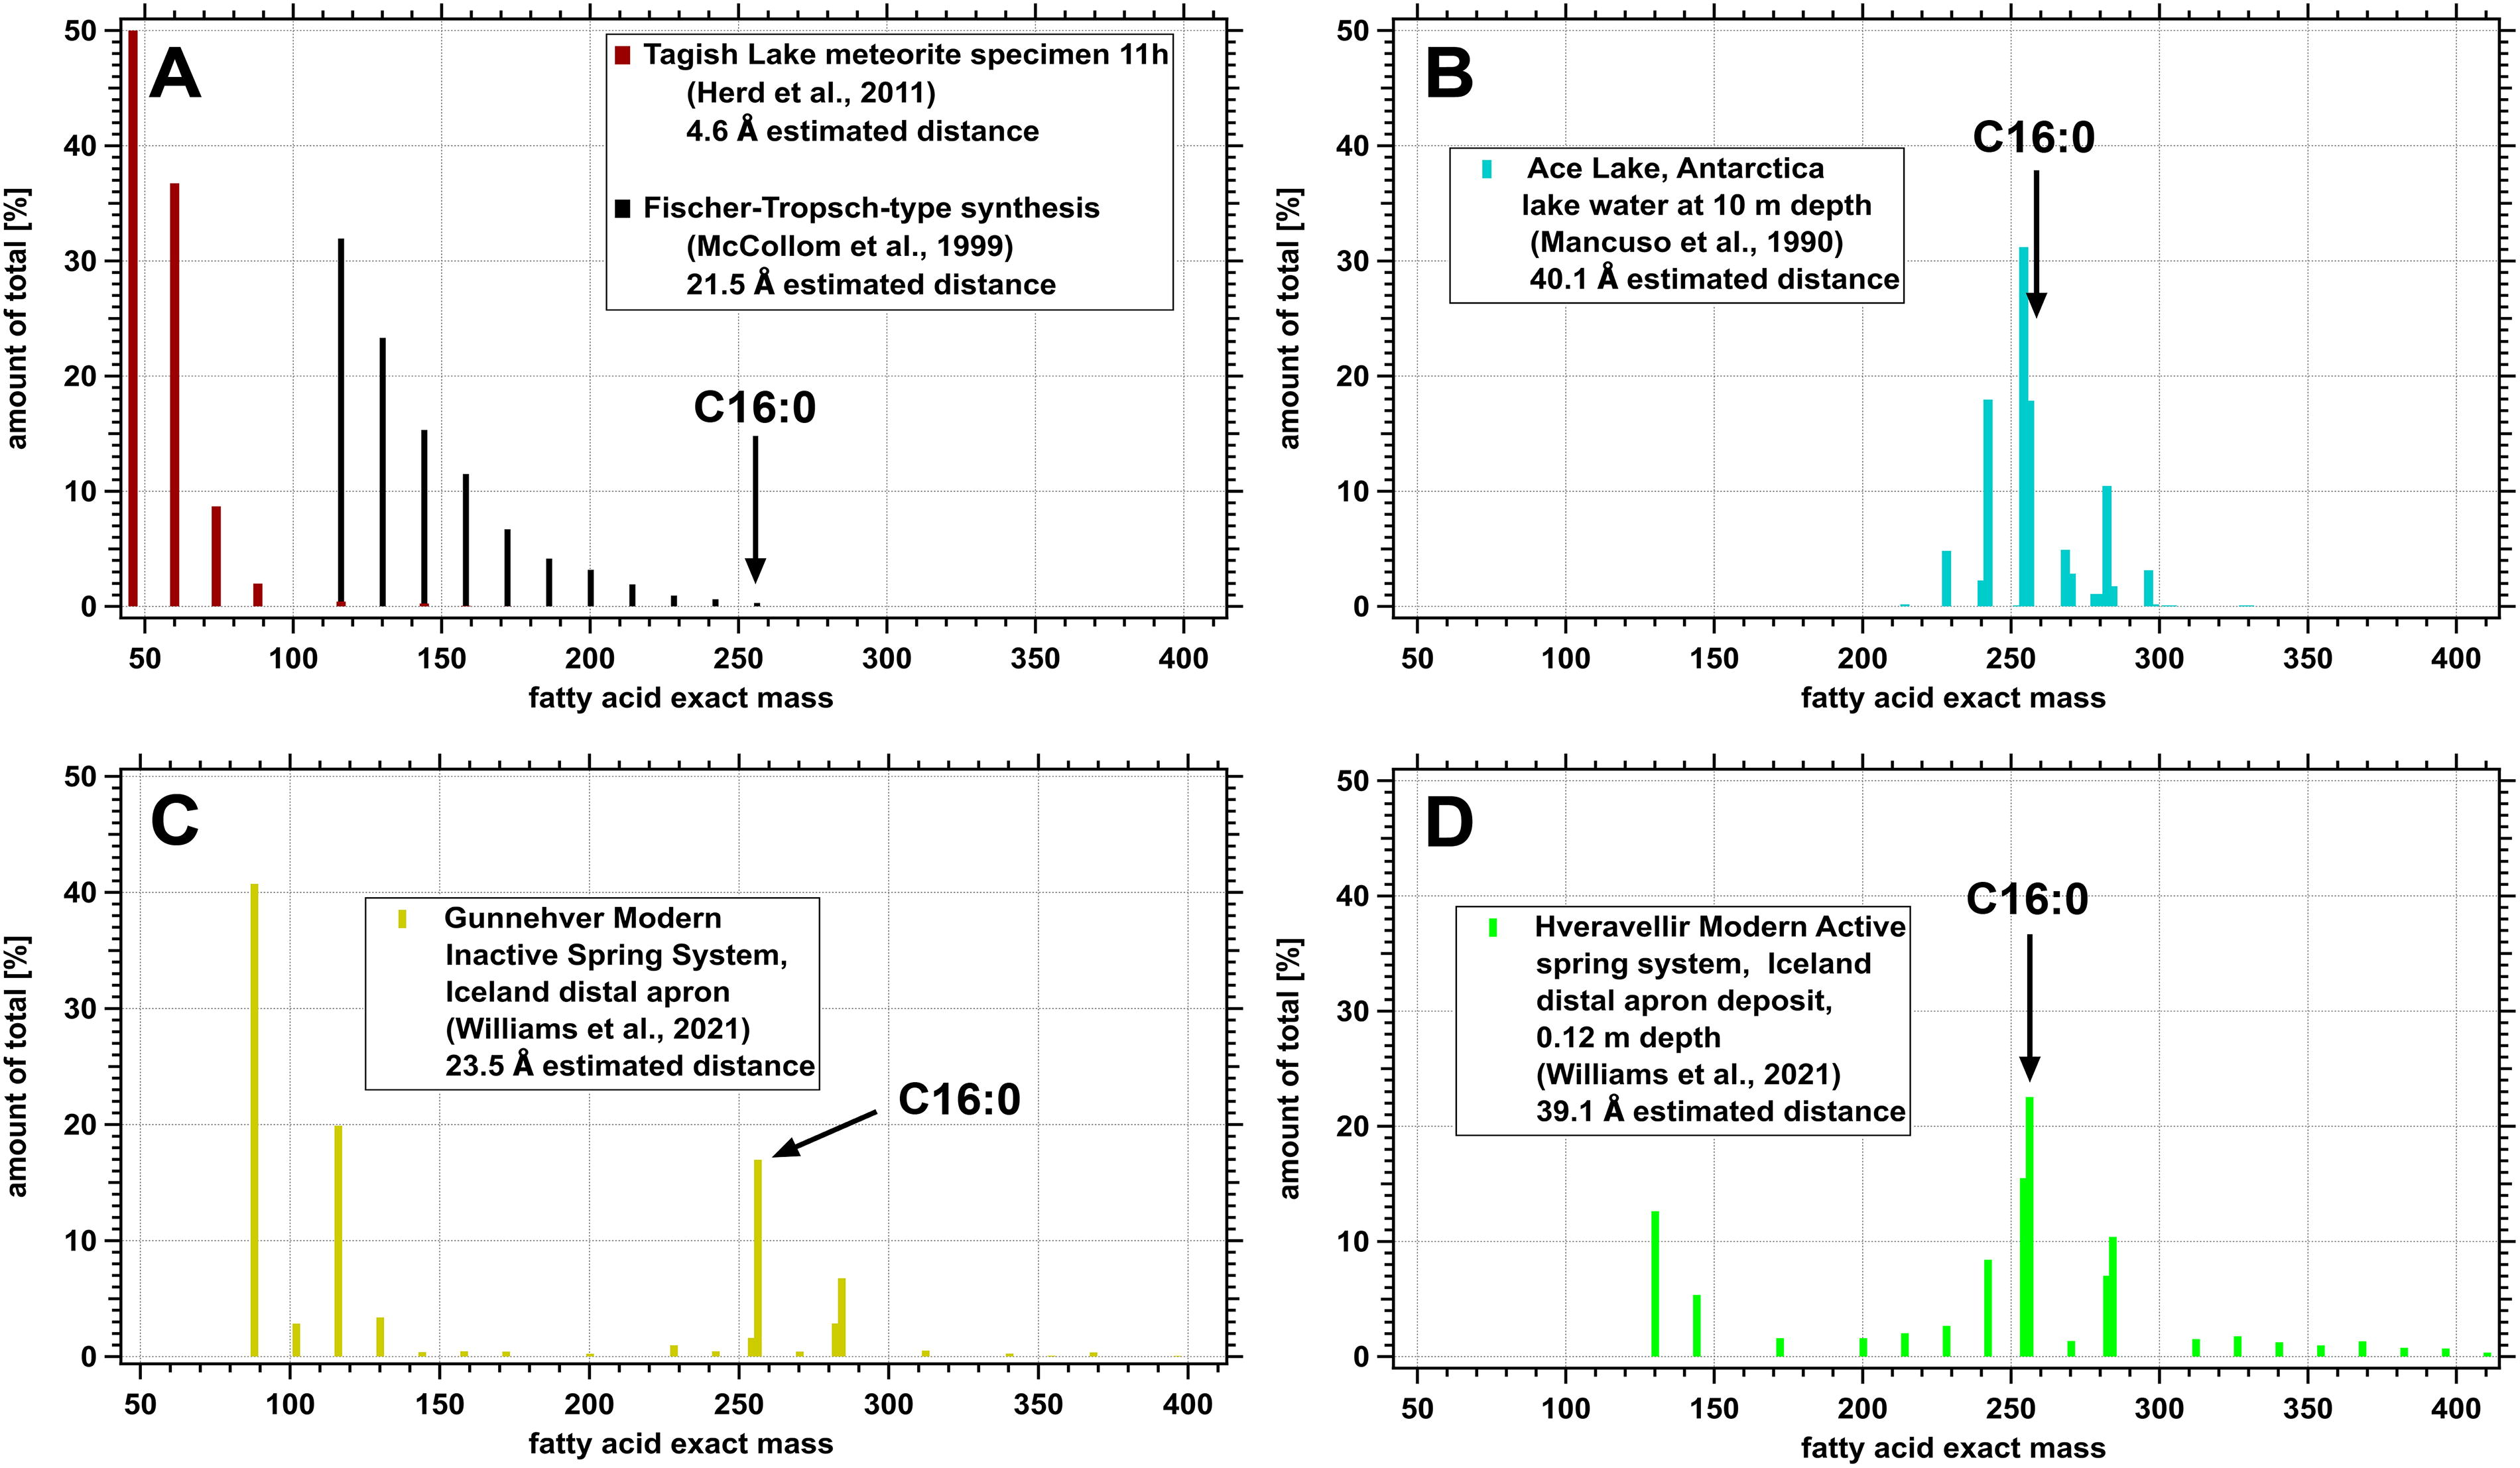
We tested our ability to identify a biological pattern which was overprinted with an abiotic molecular pattern to assess the possibility of a false negative in a life detection experiment. Abiotic/biotic discrimination is crucial because, in nutrient-limited extraterrestrial environments, the amount of abiotic background may be significant. Figure 8 shows different fatty acid patterns from abiotic and environmental samples. These are plotted as the percentage of all molecules with a given exact mass. The abiotic samples (Fig. 8A), presented here as a relatively pristine meteorite sample from Tagish Lake (specimen 11 h, Herd et al., 2011) and laboratory FTT synthesis (McCollom et al., 1999), both show exponential decay with increasing molecular weight. Because of this decay, much smaller and lighter fatty acid chains predominate. As a result, the weight-averaged estimated membrane thickness is low: 4.6 Å and 21.5 Å, respectively.
Fatty acid relative abundance patterns as percentage of total for
A typical microbial sample from Ace Lake in Antarctica is shown in Figure 8B. This sample has no detected fatty acids shorter than C13. The fatty acid molecular pattern clusters around C16, with a weight-averaged estimated membrane thickness at 40.1 Å. It should be noted that this analysis, as in the other panels, includes all fatty acids and not just straight-chain saturated fatty acids.
Figure 8D presents an environmental sample pattern from sediment taken at 18 cm depth from the inactive distal apron (assumed temperature of formation of 44–30°C) of the Hveravellir hot spring system as described in Williams et al. (2021). Longer chain unbranched saturated fatty acids from C22:0 to C27:0 can be observed from 340 to 410 u in the plot. Higher molecular weight fatty acids likely come from terrestrial vascular plant inputs (see Carrizo et al., 2019). For this particular sample, the alternate 2C homologation pattern for these longer fatty acids is not evident. Interestingly, shorter fatty acids are also observed in this hot spring sample: the peak at 130 u represents C7:0, and the peak at 144 u represents C8:0. These are atypical fatty acids in both microbial and most environmental samples, but they are found in many of the hot spring samples in Williams et al. (2021). Their presence hints at abiotic synthesis or degradation pathways of longer chain samples in these locations. (We also note that C8:0 and C9:0 fatty acids—but not shorter—were detected at Dallol hydrothermal systems (Carrizo et al., 2019). In our other transcribed environmental samples, fatty acids shorter than C12 were typically not observed, with the exception of the hydrothermal systems previously mentioned and two ice core samples from Greenland and Antarctica, respectively.) Despite the presence of these shorter fatty acids, the bulk weight-averaged estimated membrane thickness for the Hveravellir sample is 39.1 Å, which is in line with microbial culture and other environmental samples and suggests that minor contributions from shorter fatty acids may not affect the resulting analysis.
A representative sample from the distal apron deposit (also at an assumed temperature of formation of 44–30°C) of Gunnehver hot spring in Iceland (entry 119 in Supplementary Data S7) has an atypically short (for biotic samples) estimated average membrane thickness of 23.5 Å. Other samples from Gunnehver hot spring, including vent and apron deposits, are also atypical. The fatty acid pattern at this location is presented in Figure 8C. At higher exact masses (above 158 u, corresponding to fatty acid C9:0), the pattern matches that for the Hveravellir hot spring. However, there are anomalously high relative abundances of short chain fatty acids. For this sample (and many of the other Gunnehver hot spring samples), the short n-butyric acid (C4:0) accounts for over 40% (on a molar basis) of the total fatty acid content. For some samples around Gunnehver hot spring (entries 120, 119, 118, 117, and 115 in Supplementary Data S7), as high as 68% of the entire fatty acid content is n-butyric acid. The atypical presence of short fatty acids was suggested by Williams et al. (2021) to result from microbial degradation or diagenetic transformations of longer fatty acids. Another possibility would be the abiotic synthesis of fatty acids in the hydrothermal system, although the key factors driving abiotic synthesis remain unclear (McCollom and Seewald, 2007); however, the slight preference for even-numbered fatty acids versus odd-numbered fatty acids argues against this possibility. Thus, while other Icelandic hot spring samples presented in the data from Williams et al. (2021) show atypical short fatty acids as part of their overall makeup, those at Gunnehver hot spring fall in the extreme. We therefore treated the Gunnehver fatty acid pattern in Figure 8C as a combination of both abiotic and biotic patterns. Although the overall weight-averaged estimated membrane thickness was determined to be 23.5 Å, we found it was possible to deconvolute the abiotic and biotic patterns.
From examination of the short chains in the Gunnehver sample, we estimated the likely exponential decay of abiotic synthesis based on the shorter (≪C8) fatty acids and determined that the amount of C8 and longer fatty acids was minimal. If we removed the influence of all acids <C8 for this calculation, we arrive at an estimated membrane thickness of 43.3 Å—close to other biotic values. (This thickness remains skewed to longer values likely due to long chain fatty acids from the debris of wind-blown vascular plants.) This exercise suggests that, in the case of potential abiotic contamination of a sample, it may be possible to empirically determine the expected decay series of an abiotic mix, deconvolute, recalculate, and determine an estimated membrane thickness value based on the biotic component.
When compared with experimentally determined values, we find our estimated membrane thickness values may be overestimated for some molecular classes. This can explain some of the relations observed for membrane thickness measurements in Table 3 and Figure 7 for the biologically derived molecular classes (both from isolates and environmental samples): fatty acids have the largest estimated thicknesses, followed by GDGTs, ladderanes, and then carotenoids. These larger thickness estimates correlate to molecular classes with more conformational mobility. These may be overestimates due to our method and may have a structural and thus predictable basis: the greatest degree of overestimation occurs in the most conformationally flexible molecules: fatty acids and GDGTs (Fig. 2).
Carotenoids are conformationally rigid and fully span the membrane in a monolayer (refer to Fig. 2 for chemical structures). If carotenoids were significantly shorter than the membrane thickness, then the polar groups would become embedded in the hydrophobic region of the membrane, and this would lead to unfavorable interactions (Hara et al., 1999). Because they form a monolayer, carotenoids also cannot interdigitate. We can therefore use the weight-averaged estimated membrane thickness x of carotenoid molecules as an estimate for the shortest membrane thickness. Using a combination of carotenoids from pure culture and environmental samples, we estimate an average membrane thickness of 32.5 ± 3.4 Å, while the average from our combined dataset of formal membrane major component molecule types (i.e., fatty acid, GDGT, ladderanes—for both isolates and environmental samples) is 38.1 ± 2.8 Å. These values statistically overlap at the 1 sigma level, which suggests that even without accounting for conformational effects, our overall estimates are similar.
Our approach measures the molecules in the maximally extended conformation (Fig. 3). However, in a membrane, bond rotations and conformational adjustments over the length of an extended chain can effectively shorten a molecule. Other membrane-thickness shortening factors include interdigitation, where membrane molecules in a bilayer can have some overlap of the distal hydrophobic termini: Boumann et al. (2009b) suggested that interdigitation of ladderane molecules can account for up to 8 Å (from their estimates, 20%) of the variation that occurs between observed and modeled distances. Other factors include bulk tilting, where the molecule is not oriented normal to the membrane surface. We also do not account for the conformational effects of the polar “head group” that could increase the length of the overall chain; we only modeled the central section of the hydrophobic region to the initial heteroatom linker.
In a bilayer membrane, fatty acid groups are both conformationally flexible and capable of interdigitation. Table 4 lists a series of experimental determinations of artificial membrane distances using glycerol phosphatidyl choline di-derivatized with the same fatty acid (Kučerka et al., 2011). We also include our theoretical estimated lengths to experimental data presented in Cornell and Separovic (1983). These measurements, which were determined by neutron scattering approaches, provide the full bilayer thickness as well as the hydrophobic region thickness. While their experimentally derived thickness values do not match our modeled values for the hydrophobic region, they both increase proportionally on increasing fatty acid length. In their experiments, each additional methylene in the chain adds 3.9 Å to the experimentally measured thickness, while in our modeling it adds 5.1 Å. This suggests that our molecular modeling overestimates the effect of each methylene by 31%. This is an oversimplification: on increasing length, the fatty acid effective volume is increased rather than the membrane thickness with a smaller “step” size as the carbon count is increased (Cornell and Separovic, 1983). Our thickness overestimate of fatty acids could be due to the combined effects of conformational flexibility and interdigitation.
Comparison Between Experimental Measurements and Modeled Hydrophobic Lengths
Comparison Between Experimental Measurements and Modeled Hydrophobic Lengths
values extracted from linear relationship presented as linear relationship in equation (2) of Cornell and Separovic (1983).
values from for di-derivatized end cap. The thickness data are reported for the first non-gel temperature from Tables 2 and 3 in Kučerka et al. (2011).
As another example, measurements of isolated GDGTs as a molecular layer generally show a consistent thickness from 25 to 30 Å (Van de Vossenberg et al., 1998). In contrast, our modeling estimates an average length of 36.9 Å for the different GDGTs presented in Supplementary Data S9 and S10. Thus, when compared with experimental values for isolated GDGTs, our modeling approach overestimates the thicknesses by 34%. Because GDGTs form a monolayer, they do not interdigitate; the likely source of our overestimation is due to the conformational flexibility of the long hydrophobic region. It is likely that the “natural” configurations of the average GDGTs are shorter than our fully stretched-out molecule that we used for our modeling.
In Section 3.3.3, we compared both fatty acids and ladderanes coexisting in the same samples, and the estimated thickness based on fatty acids was 20% higher than those based on ladderanes. Similar to carotenoids, the ladderane structures are fairly rigid, at least for the fused ring section of the molecules. However, as noted by Boumann et al. (2009b), ladderanes (as well as fatty acids) can interdigitate. These larger thickness values derived from fatty acids would be consistent with fatty acid membrane thicknesses being over-estimated due to their flexibility. Our molecular modeling stretched them to the maximum dimension, but in the membrane itself they can conformationally relax to a slightly shorter length. In contrast, the ladderanes are rigid and thus have limited conformational flexibility.
We can use this analysis to create empirical adjustments for our method that could be extended to alien systems based on the molecular structure. The interdigitation effects of structurally rigid ladderanes cause an overestimation of roughly 20% (using the value from Boumann et al. (2009b)), while the conformational flexibility of GDGTs causes an overestimation of roughly 34% (using the differences with the experimental value in Cornell and Separovic (1983)). From our values, the likely interdigitation and conformational flexibility of fatty acids is roughly in the same range (we found a 31% overestimation). We can use these values to create empirical adjustments based on the structure of the molecule. For molecules that are monolayer-forming (bidentate) and conformationally rigid (such as carotenoids), the estimated thickness likely corresponds to the “true” value. For conformationally flexible molecules, such as GDGTs, the value is likely overestimated, possibly up to 34%. For rigid bilayer forming molecules that can interdigitate (such as ladderanes), the value could be overestimated by up to 20%. For bilayer forming-molecules that can interdigitate and are conformationally flexible (such as fatty acids), we use the 34% value.
We took the data in Table 3 (and Fig. 7) and applied these adjustments to illustrate the lower likely range limit of membrane thickness. These data are plotted in Figure 9. The adjusted extended ranges all overlap for all the biologically derived samples of different molecular classes. From this consensus, we would estimate a high likelihood of a membrane thickness value in the range of 30–36 Å. This extended method now allows us to compare multiple molecular classes and create an estimated range of membrane thickness.
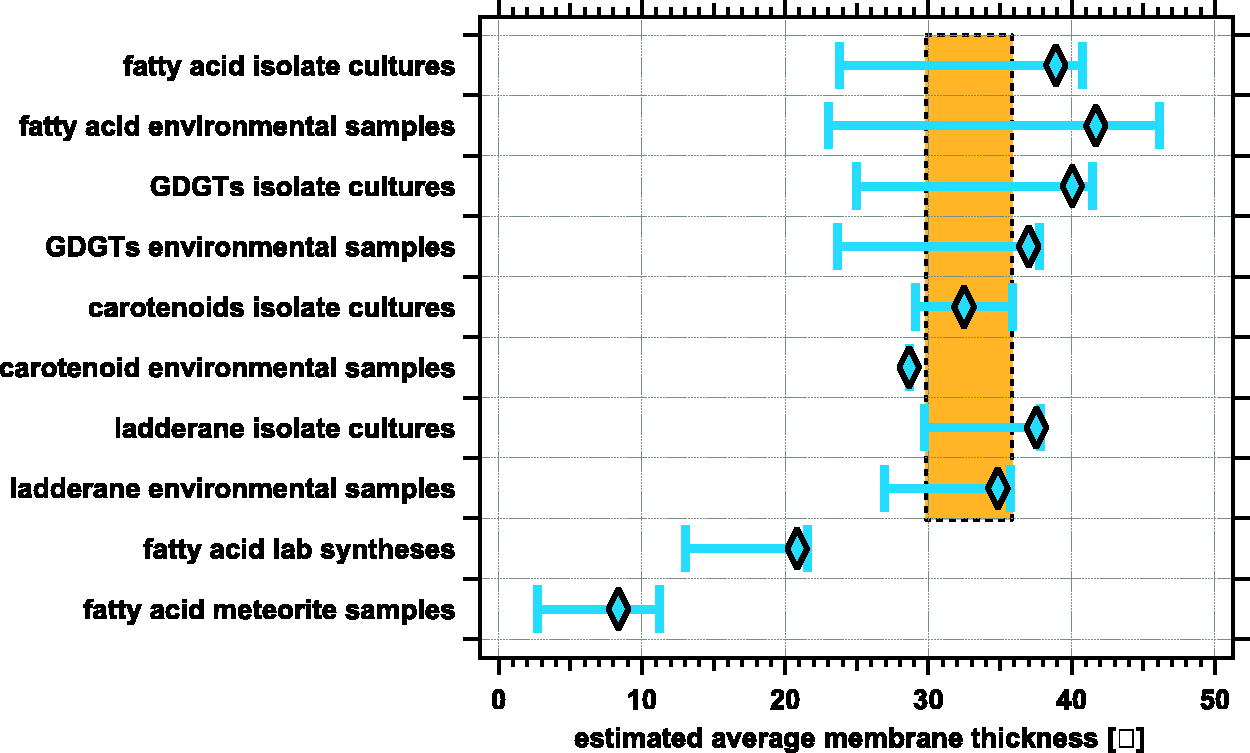
Comparison of adjusted weight-averaged estimated membrane thickness for multiple classes of molecules. This graphically presents the data in Table 3 but with the lower range empirical adjustments (including standard deviation) based on chemical structures. The orange zone represents the likely true value of the biological membrane size based on overlap. The abiotic fatty acid estimated thicknesses still fall outside the range of the carotenoids.
While actual membrane behavior is much more complex, these examples provide a rough check of our modeling approach. Even though our modeling approach may overestimate membrane thickness for some of the molecular classes, it does so consistently inside a given molecular class. As an example of applying these adjustments to our estimates, if a set of alien molecules were found that were bidentate and rigid with a central set of extended cis-fused alternate cyclobutanes (effectively a bidentate stretched ladderane structure), then we would use the modeled length as the likely membrane thickness value with some level of confidence because ladderane-like structures are conformationally rigid. In contrast, if a set of molecules were found that were bidentate and conformationally flexible (see Section 4.5 below), then we would allow up to a 34% downward adjustment in the lowest possible membrane thickness value. These changes are effectively modification to the factor (f) in Equation 1 and would be based on examination and evaluation of the chemical structures. These empirical adjustments extend our approach to unknown biological systems for which we may not have the luxury of experimentally measuring cellular components in situ.
We examined the difference between our estimated membrane thickness value and a measured membrane thickness determined by microscopy. From the fatty acid pattern from Shewanella oneidensis cultured at 298 K (25°C), we determined an estimated membrane thickness of 39.4 Å (Supplementary Data S5, entry 201). From the conformational adjustments of some of the families above (34%), the lower limit for the hydrophilic membrane thickness could be as low as 26 Å. According to an SEM micrograph image presented in Phillips (2018), the transmembrane thickness of Shewanella oneidiensis is approximately 41 Å. These values agree well, considering that the measured scanning electron microscope (SEM) thicknesses from Phillips (2018) also include attached polar head groups, which are not part of our estimate. From Table 4, a polar head group such as glycerol phosphatidylcholine adds roughly 11 Å to the hydrophobic length. Assuming other polar groups are in this range, then the corresponding SEM-observed hydrophobic membrane thickness could be as low as 30 Å; thus our adjusted estimated membrane thickness range agrees with observations.
Potential confounding effects
In addition to the hydrophobic chains, the membrane thickness could be influenced by polar headgroup modifications. In a feeding study, Thurmond et al. (1994) used 2D nuclear magnetic resonance (NMR) analysis with a semi-artificial forced biological system using Acholeplasma laidlawii to measure the membrane thickness for a variety of phosphatidylcholine diacids. Acholeplasma laidlawii has limited lipid synthesis capabilities, so the authors were able to vary the lengths of the fatty acids provided to the culture to see how the membrane thickness adjusted. They found that the membrane thickness of Acholeplasma laidlawii varied with the length of lipid provided from C14:0 to C20:0, with hydrophobic regions of the measured bilayers varying between 23.2 and 30.6 Å. For the diacyl-phosphatidyl C16:C16:1 diacid (cis geometry about the double bond, although the exact position was not specified), the observed hydrophobic region membrane thickness was measured to be 24.7 Å. Thurmond et al. observed that, as the provided fatty acids became shorter, the organism adjusted the polar headgroups that were linked to the acids. Their explanation for this was that the polar headgroup modifications enabled tighter packing of the attached fatty acid chains that then compensates for shorter chain fatty acids and decreased membrane thicknesses, which allows the cell to maintain function. In this case, the headgroup modification enables the membrane thickness to vary.
This thickness variability in Acholeplasma laidlawii provides a counterexample to the hypothesis of the constancy of membrane thickness presented by Montecucco et al. (1982), Mouritsen and Bloom (1984) and Stieger et al. (2021). (In their measurements, Thurmond et al. (1994) counted the hydrophobic region as starting at the alpha-methylene of the fatty acids in their derivation. If the acyl carboxylate moiety was included, as in our measurements, then the corresponding lengths would be 2.4 Å longer on either end, which would result in corresponding thicknesses between 28.4 Å and 35.4 Å.) Comparison of these values in Acholeplasma laidlawii with the measurements shown in the graphs in Figure 4 illustrates that the (although forced) varying fatty acid distribution pattern of this organism would have a larger range and lower estimated thickness value than most of the other isolates in our dataset. However, we note that the span of their corresponding measured thicknesses still matches well with the adjusted estimated thickness values in the orange box of Figure 9.
The complex effects of different polar headgroups coupled with different hydrophobic regions could be a confounding factor in our method. In theory, headgroup effects could (1) enable a larger range of membrane thicknesses to be accommodated and (2) allow shorter-than-expected fatty acids to be incorporated in a membrane, thus leading to a false negative—concluding that no biosignature was detected. In an extreme scenario, we would observe an abundance of short fatty acids and deem them abiotic based on their abundance distribution, but there might be a headgroup that can align the short fatty acids into a viable membrane. This would confound not only our method but also analyses that examined the distribution patterns of fatty acids. We attempted to estimate the likelihood of this effect by determining whether cultured isolates incorporated short fatty acids near the C8 cutoff. In our (biased) dataset of 229 isolates, there were only 5 isolates that contained fatty acids that were shorter than C10, and these were only present as minor components with a combined amount less than 3% of the overall total fatty acid content. From our data, we did not identify any evidence of confounding effects that enabled incorporation of short fatty acids that could be confused with an abiotic distribution pattern. Thus, while our method provides a good test for a biological construct, there is always the possibility of a confounding effect that would create a false negative.
Additional molecular classes
Our length-based-technique enables the prediction of key features of other membrane-bound molecular classes. Because the length of the molecule is rooted in the biological parameter of membrane width, it also is likely that other membrane-bound molecules in previously undiscovered chemical families could have similar hydrophobic zones. In other words, our technique enables the identification of membrane spanning molecules in unknown biological systems.
As an example, the detection of diabolic acids in the lipid content of certain groups of bacteria shows the predictive value of the weight-averaged method to find new chemical classes. While most bacteria have bilayers, some bacteria that live in extreme environments (high temperature, high pH) can have a monolayer of transmembrane spanning dipolar lipids. iso-Diabolic acid (Fig. 10) has been found in Acidobacteria in high levels, from 22% to 43% of the total lipid content, when atypical extraction protocols are performed (Sinninghe Damsté et al., 2011). We would predict a membrane spanning thickness of 36.8 Å or less for iso-diabolic acid based on its molecular structure. With two polar groups separated by a long hydrophobic zone, if this molecule were detected de novo, it would be identified as a suspected transmembrane molecule that is also conformationally flexible. The lower adjusted estimated membrane thickness would be 24.3 Å, which is in the range shown in Figure 9. Indeed, this molecule is a transmembrane spanning lipid and is thought to lie on the synthetic path for the non-isoprenoid-based construction of branched-GDGTs in Acidobacteria (Sinninghe Damsté et al., 2011). It therefore serves as a demonstration of identification of membrane-spanning molecules using our method.
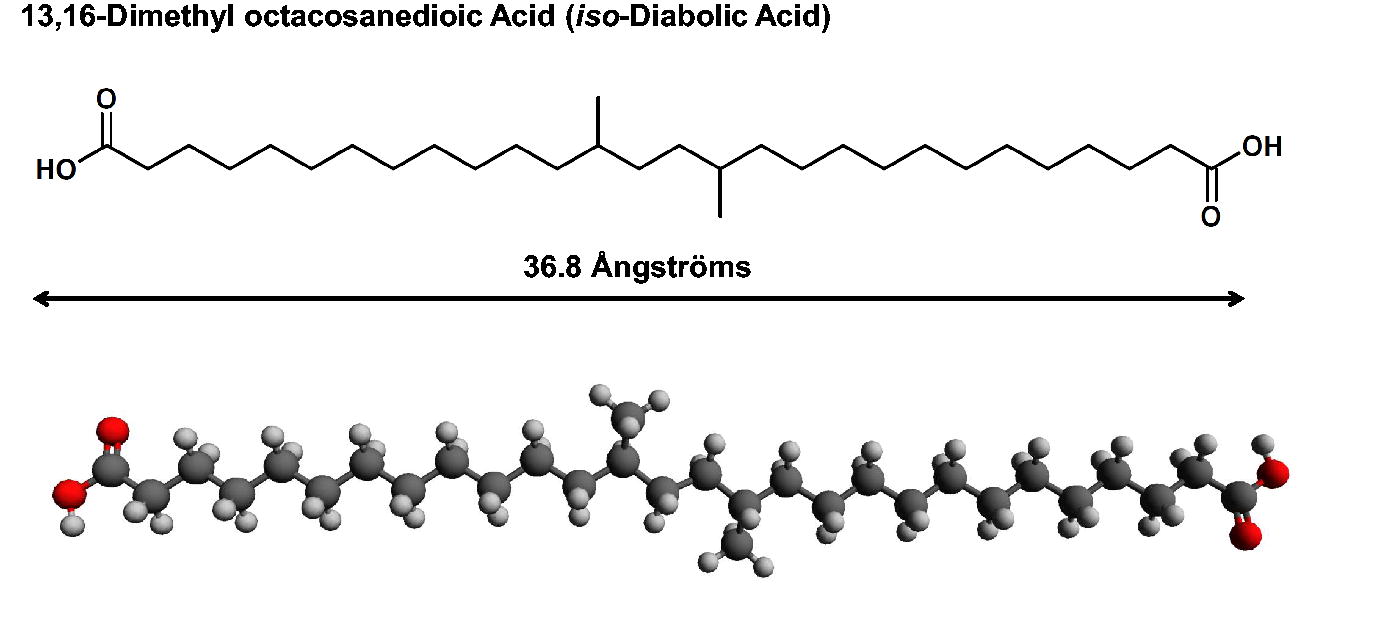
Structure and molecular modeling of iso-diabolic acid, a transmembrane lipid from a different molecular class.
Our method does not require absolute molecular identification. Previous astrobiological analyses that examine abundance distributions for fatty acids include the “LEGO principle.” In that paradigm, key molecules such as fatty acids are built up by appending smaller structural units together, such that the final abundance distribution reveals the synthetic history (Georgiou and Deamer, 2014; McKay, 2004). A classical example is the “even-odd” carbon chain distribution of fatty acids that results from 2-carbon homologation from acetyl-CoA. The “LEGO” paradigm assumes that post-synthetic modification, which can otherwise obscure the original pattern, can be segregated or otherwise quantified; however, this may not always be a valid assumption. For example, post-synthesis transformations of canonical biomolecules include cyclopropanation or desaturation of fatty acids (Choi et al., 2020) and methylation of backbone protein amides (Song et al., 2018). Recognizing the canonical “even-odd” carbon chain indicator of typical fatty acid synthesis requires identifying and quantifying acids that are straight unbranched (n-) and saturated. Any potentially confounding isomers with anteiso- and iso- or other branching must be identified and excluded along with any unsaturated (thus no double bonds or rings) fatty acid congeners. While degrees of unsaturation can be easily identified from empirical formulae (determined through ultrahigh resolution mass spectrometry, for example), there are many structural possibilities for a given saturated empirical formula. For example, the common membrane fatty acid oleic acid (C18:1) has over 512 structural isomers if only double-bond placement, cis/trans isomerization, and single methyl branching are considered (Wang et al., 2024). If multiple methyl branches, or longer chain branching (ethyl, propyl, etc.), or embedded or attached rings (which count as a degree of unsaturation that cannot be determined by empirical formula alone) are included, then the number of possible isomers increases dramatically. For a given empirical formula, hundreds if not thousands (even millions if a nitrogen atom were included, see Table 3 in Cleaves et al., 2014) of standards would need to be present in a database in order to match to an unknown molecule. For terrestrial biology, the n-saturated fatty acids are all known. But more complex branching patterns (for example, thexyl-end capped fatty acids) that may be present in an alien system may not have standards or be present in current databases.
For unknown molecules, de novo structural determination of complex molecules is challenging. The de novo elucidations in the early 2000s of the molecular structures of GDGTs and ladderanes are elegant examples of the rigorous analytical work combining chemical degradation, higher-order NMR pulse sequences, and detailed characterization to determine the parent structures (for GDGTs, see Sinninghe Damsté et al., 2000; for ladderanes, see Sinninghe Damsté et al., 2002). It will be difficult to replicate those steps with current flight instruments on an astrobiology mission. As an example, the ladderane C20[3]-ladderane fatty acid has an empirical formula of C20H32O2, which also corresponds to fatty acid all cis-C20:4 del (5,8,11,14) and fatty acid all cis-C20:4 del (8,11,14,17); thus, there are at least three known terrestrial biological molecules that must be distinguished through advanced analytical techniques.
For our length-based analysis, there is also a structural identification requirement, but it is slightly relaxed in that it only requires determining the absolute length of the structure; it does not require formal molecular identification. The exact placement of methyl groups or rings in a particular membrane molecule is inconsequential as long as the length of the molecule can be determined. An advantage of our approach is that it requires only the knowledge of the effective lengths and relative abundance of the membrane molecules of a given class to an error of roughly 0.1 Å and roughly 1% abundance. Formal structural identification followed by molecular modeling (as we have done) can be used to generate this, but there may be other measurements or instrumentation capable of obtaining the required information.
Given a large collection of molecules from non-targeted analysis of a potential astrobiological sample, initial triaging of the candidate membrane-component molecules could be done through the examination of a van Krevelen diagram using mass spectrometry (see: Kim et al., 2003), as the O/C ratio will be low and the absolute size will be >C8. Once a candidate subset has been identified, further structural elucidation and quantification or other measurements could provide the necessary information to assess the potential biogenicity of the sample.
We speculate that techniques and experiments could be developed to look specifically for the average molecular length without formal structural identification. GC techniques with a specially calibrated column have been used to relate a parameter referred to as equivalent chain length (which is based on molecular surface contacts, thus related to shape, width and length, and molecular weight) to compound retention time (Sasser, 1990). Extension and generalization of calibration data to other appropriate molecular classes might enable the desired measurements. Alternatively, artificial membrane experiments where target molecules diffuse into and modify membrane properties, such as measured rotation (or relaxation) in a membrane, may also be useful for identification and triage of candidate molecules. Finally, small molecule equivalents of sizing gels or experiments that can detect the passage of a small molecule through a nano-pore could also help distinguish molecules of biological interest without needing absolute structural identification. While many of these approaches are speculative, they may prove easier than full de novo structural elucidation and quantification.
Another advantage of our method compared with a pattern-based approach is that it does not require detection of all the molecules in a sample to identify a key pattern (in contrast to homologation pattern analysis). Consider the case in which only one dominantly abundant molecule could be detected and that the minor components would not significantly adjust the weight-averaged estimate. In that case, the detection of that one molecule should provide an estimate of membrane thickness. In a homologation pattern-based approach, if no other molecules were detected, then a molecular synthesis pattern could not be determined. An example of this is the fatty acid pattern found in Georgenia ruanii as presented in Li et al. (2007) (Supplementary Data S5, entry 2). For that isolate, the dominant fatty acid is 78.3% anteiso-C15:0 (anteiso-pentadecaenoic acid), while the next major component is 14.9% iso-C15:0; both molecules have the same empirical formula. The next major component is C17:0 at only 1.6% relative abundance, thus separated from the dominant component’s abundance by a factor of 53. Using a homologation pattern-based strategy dependent upon detecting similar structural conjugates, the closest homolog in the iso- series is C14:0 at 0.6% abundance. If this fatty acid pattern were (weakly) detected on an alien world, a 2C homologation pattern might not be identified unless the instrument had at least a 0.5% detection limit and 3 orders of magnitude dynamic range. However, using our method, if only the major anteiso-C15:0 peak was detected, we would obtain an estimated membrane thickness of 37.1 Å, which is close to the 37.3 Å membrane thickness from analysis of the full pattern. Thus, in this case, the membrane estimated thickness approach would indicate a biological system, while the synthesis pattern-based approach would not.
Summary of our approach
Our hypothesis allows us to propose a length-based protocol for testing the presence of plausible biologically derived membrane molecules. Using this technique, it is possible to differentiate distribution patterns from cultured isolate and environmental samples from those of abiotic systems. Our approach consists of six steps: Identify molecular classes in a sample with extended hydrophobic zones (>C8). Classify the molecules as either having mono- or bis- polar group terminated ends. Determine the molecular length (either experimental measurement or modeling). Calculate the weight-averaged membrane thickness based on observed percentage distribution in the relevant molecular class. Compare between molecules in different families, with structural-based allowance for overestimating based on interdigitation or molecules with conformation flexibility. Predict cell membrane thickness. Forward prediction of hydrophobic zone distances in mono- or bis- polar groups for other as-yet-unidentified molecular classes.
The identification of a single molecular structure that is sufficiently long (>C8) and present in a concentration not expected by the exponential decay series observed in abiotic systems provides an initial indicator of an anomalous distribution that may be due to a living system. The results of Step 5 furnish the key test. If multiple molecular classes from Steps 1–3 independently arrive at a similar value (when adjusted for interdigitation or conformational flexibility), that will increase confidence of the existence of a biological system.
Our work examined the molecular distribution patterns of modern and recently preserved terrestrial fatty acids, GDGTs, carotenoids, and ladderanes from isolates, environmental samples, and abiotic samples such as meteorites and laboratory FTT synthesis experiments. We demonstrated that, by initially classifying molecules as either containing one or two polar groups, we can estimate the thickness of corresponding cellular membranes in a diverse range of bacterial, archaeal, and environmental samples. Our approach models the hydrophobic region of these molecules in their extended conformation and treats that distance as an upper bound to estimate the associated cellular membrane thickness. Using this technique, it is possible to differentiate distribution patterns of biological samples from those of abiotic systems. We demonstrated that estimated thickness values for each molecular class corroborate and predict cell properties as well as forward predict properties of new molecular classes that are components of cellular membranes.
Our results show that the estimated membrane thickness can be compared and predicted across molecular families, a finding that was conserved for isolated pure cultures and environmental samples. While not tested in our study, we speculate that this conserved thickness would also extend backwards in time to a common ancestor or origin. The generality of this method across multiple membrane component classes enables identification of biological patterns versus abiotic patterns as well as extension to new chemical families. The consistency of these values provides an indicator of the effective membrane thickness, which provides insight into morphological measurements of the cell structure of an alien system.
Our technique levies instrument requirements different from those of previous synthesis-pattern based biosignature recognition methods. It requires less rigid structural identification (although effective length must be predicted or measured) and that only the major membrane components need to be detected. Our analysis provides valuable information about cellular properties, such as the expected thickness of a membrane, which could also be observed directly. In conclusion, our approach provides an agnostic method that—based on our survey of biological and non-biological materials—has the potential to distinguish component molecules that derive from extraterrestrial membranes from those that derive from abiotic reactions.
Acknowledgments
We thank two anonymous reviewers for comments that improved this article.
Author Disclosure Statement
No competing financial interests exist.
Footnotes
Funding Information
This research was supported by the
Supplementary Material
Supplementary Data S1
Supplementary Data S2
Supplementary Data S3
Supplementary Data S4
Supplementary Data S5
Supplementary Data S6
Supplementary Data S7
Supplementary Data S8
Supplementary Data S9
Supplementary Data S10
Supplementary Data S11
Supplementary Data S12
Supplementary Data S13
Supplementary Data S14
Associate Editor: Mary Beth Wilhelm
Abbreviations Used
References
Supplementary Material
Please find the following supplemental material available below.
For Open Access articles published under a Creative Commons License, all supplemental material carries the same license as the article it is associated with.
For non-Open Access articles published, all supplemental material carries a non-exclusive license, and permission requests for re-use of supplemental material or any part of supplemental material shall be sent directly to the copyright owner as specified in the copyright notice associated with the article.