
Abstract
In 2019, the Atacama Rover Astrobiology Drilling Studies (ARADS) project field-tested an autonomous rover-mounted robotic drill prototype for a 6-Sol life detection mission to Mars (Icebreaker). ARADS drilled Mars-like materials in the Atacama Desert (Chile), one of the most life-diminished regions on Earth, where mitigating contamination transfer into life-detection instruments becomes critical. Our Contamination Control Strategy and Implementation (CCSI) for the Sample Handling and Transfer System (SHTS) hardware (drill, scoop and funnels) included out-of-simulation protocol testing (out-of-sim) for hardware decontamination and verification during the 6-Sol simulation (in-sim). The most effective five-step decontamination combined safer-to-use sterilants (3%_hydrogen-peroxide-activated 5%_sodium-hypochlorite), and in situ real-time verification by adenosine triphosphate (ATP) and Signs of Life Detector (SOLID) Fluorescence Immunoassay characterization of hardware bioburden and airborne contaminants. The 20- to 40-min protocol enabled a 4-log bioburden reduction down to <0.1 fmoles ATP detection limit (funnels and drill) to 0.2–0.7 fmoles (scoop) of total ATP. The (post-cleaning) hardware background was 0.3 to 1–2 attomoles ATP/cm2 (cleanliness benchmark background values) equivalent to ca. 1–10 colony forming unit (CFU)/cm2. Further, 60–100% of the in-sim hardware background was ≤3–4 bacterial cells/cm2, the threshold limit for Class <7 aseptic operations. Across the six Sols, the flux of airborne contaminants to the drill sites was ∼5 and ∼22 amoles ATP/(cm2·day), accounting for an unexpectedly high Fluorescence Intensity (FI) signal (FI: ∼6000) against aquatic cyanobacteria, but negligible anthropogenic contribution. The SOLID immunoassay also detected microorganisms from multiple habitats across the Atacama Desert (anoxic, alkaline/acidic microenvironments in halite fields, playas, and alluvial fans) in both airborne and post-cleaning hardware background. Finally, the hardware ATP background was 40–250 times lower than the ATP in cores. Similarly, the FI peaks (FImax) against the microbial taxa and molecular biomarkers detected in the post-cleaned hardware (FI: ∼1500–1600) were 5–10 times lower than biomarkers in drilled sediments, excluding significant interference with putative biomarker found in cores. Similar protocols enable the acquisition of contamination-free materials for ultra-sensitive instruments analysis and the integrity of scientific results. Their application can augment our scientific knowledge of the distribution of cryptic life on Mars-like grounds and support life-detection robotic and human-operated missions to Mars.
Introduction
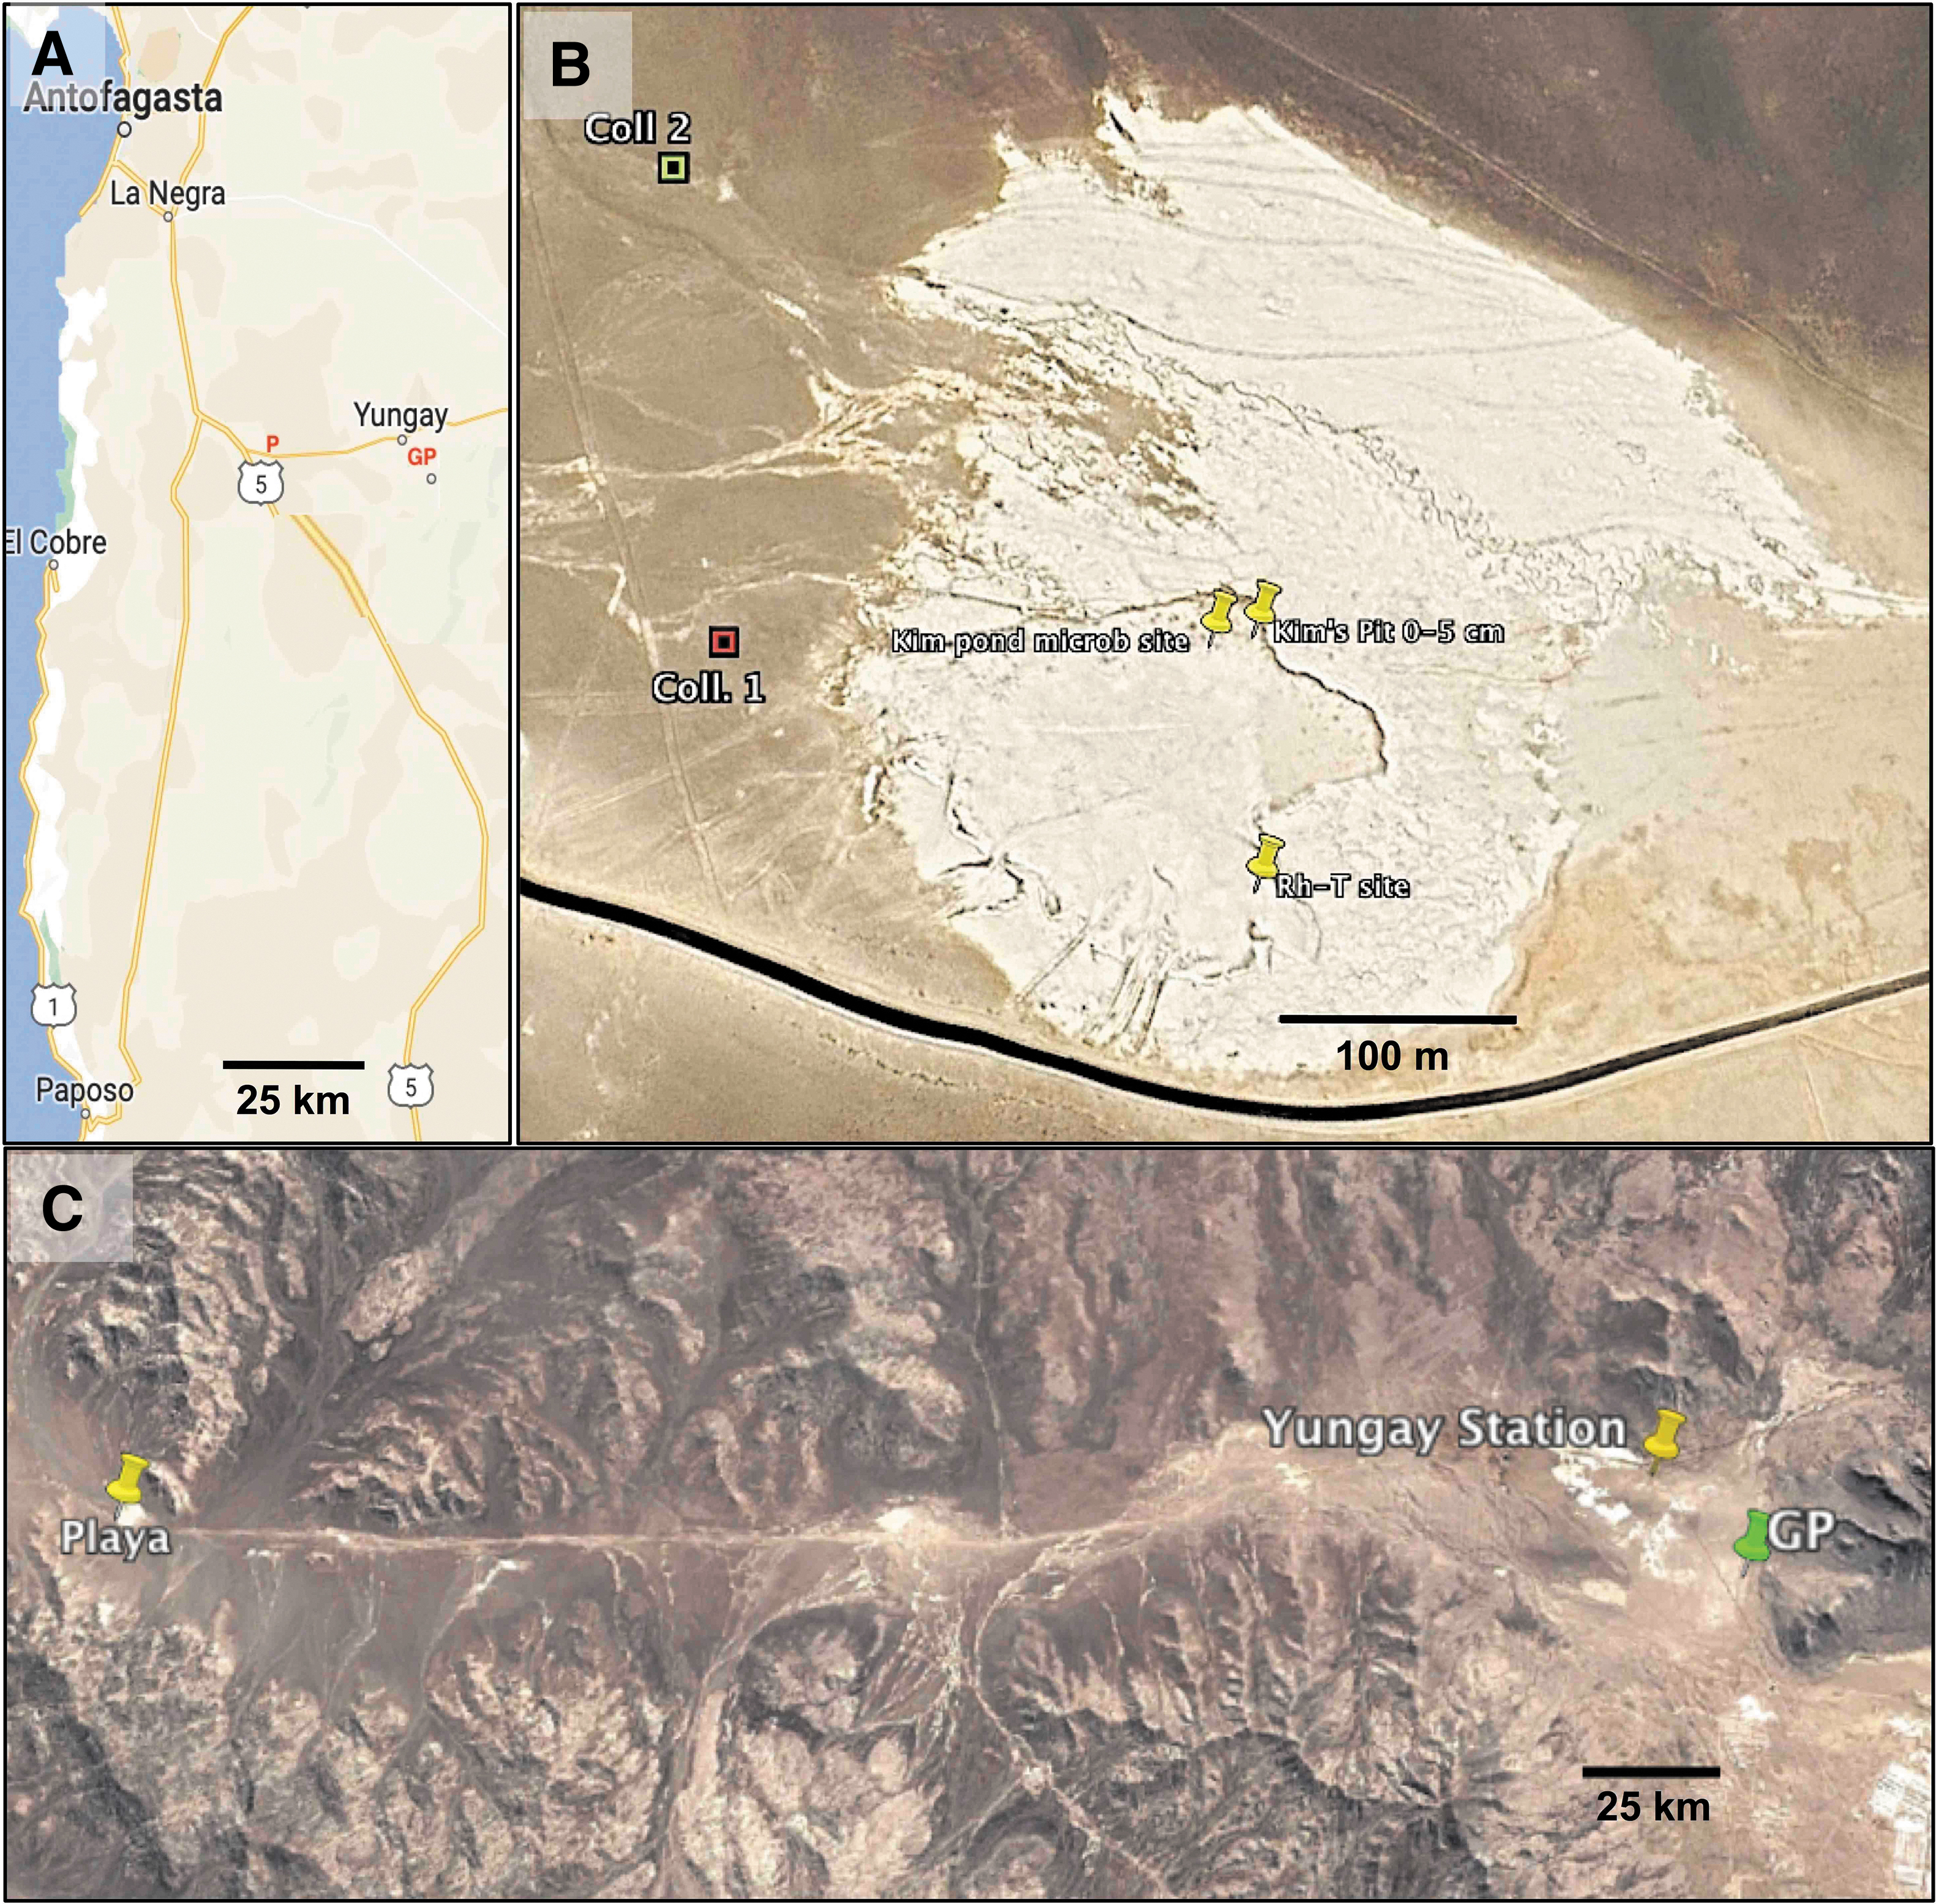
Unlike Earth, the martian surface appears lifeless, with the subsurface proposed as the best target for detecting life. The Atacama Rover Astrobiology Drilling Studies (ARADS) system is a prototype for a future life detection drill mission to Mars, namely the currently planned Icebreaker Mission (Davé et al., 2013; McKay et al., 2013; Glass et al., 2014; Mann, 2018). ARADS performed field trials in the hyper-arid region of the Atacama Desert in the Antofagasta Region from 2016 to 2019 (Fig. 1), culminating in a 6-Sol end-to-end mission simulation.
Astrobiology robotic drilling missions on Mars will face broad issues both in forward planetary protection (PP) from terrestrial microbes surviving sterilization of the spacecraft's hardware, which is the primary concern (e.g., NAS, 2020; NAS, 2019; NAS, 2018; NRC, 2006) and in the integrity of sample analysis. The Committee on Space Research (COSPAR) PP policy for landed missions in a Martian Special Region (Category IVc PP, probability contamination: <10−4) is the most strict requiring hardware bioburden contamination control of forward contamination (COSPAR, 2020).
Spores can remain long-term viable in space (e.g., Horneck et al., 2010, 2012; Hallsworth, 2021), be shed on the surface (Marshall and Mancinelli, 2011), and enter the underground, becoming metabolically active under increased water activity (Rummel et al., 2014; Smith et al., 2017).
A secondary concern is mitigating the risk of terrestrial contaminants transfer (spores, amino acids) into sample analysis generating false positives—life appears to be detected when there is not—(Kminek et al., 2019), or protecting science data integrity. Human-operated contamination remediation is a primary step for robotic drilling mission planning, beginning with clean room operations during Spacecraft Assembly, Test, and Launch Operations (ATLO).
The human involvement continues during robotic drilling mission mock-ups, as the hands-off mission technology readiness is not yet mature, requiring field engineers to supervise decontamination (Glass et al., 2023, Astrobiology this issue). Thus, developing and field-testing human-tended cleaning regimes of payload prototypes addressing PP knowledge gaps is mandatory even for a robotic mission (e.g., NASA, 2011) and can be advanced by field trials such as ARADS.
We developed our Contamination Control Strategy and Implementation (CCSI) over the 4-year project and integrated lessons learned from several astrobiology and technology fields drilling simulations, for example, the 2005 MARTE Project at the Rio Tinto Peña de Hierro, Spain (Glass et al., 2006; Bonaccorsi and Stoker, 2008; Miller et al., 2008; Parro et al., 2008; Stoker et al., 2008; Eigenbrode et al., 2009; Amador et al., 2014; Cockell et al., 2018). These tests provided opportunities to assess and mitigate long- and short-term bioburden built-up at ∼6 and 12 months and evaluate cleaning protocols for re-contaminated deep-cleaned hardware hardware after 1 day of use.
This paper describes field-feasible and effective practices for contamination risk reduction during the ARADS mission and consists of seven sections.
Section 1 introduces ARADS sample drilling handling and transfer hardware. Section 2 informs spacecraft hardware contamination control. Section 3 outlines anthropogenic, environmental, and cross-contamination. Section 4 describes (1) the general contamination remediation (during off-hours rover, instrument maintenance, etc.); (2) multi-step cleaning, microbial reduction, and verification of the drill, scoop, and funnels; (3) multi-step protocols implementation for in-sim operations; and (4) source-to-sink contamination of airborne, sedimentary, and anthropogenic biomass to the drill sites.
Section 5 reports the 2019 ARADS results. Section 6 discusses false negatives in cleaning verification and environmental and cross-contamination issues unique to terrestrial trials or a life-detection drilling mission to Mars. Section 7 highlights innovative elements stemming from ARADS: (1) an effective simplified decontamination protocol, (2) a source-to-sink contamination approach, (3) a re-assessment of contamination risks in the Atacama Desert, (4) the novel use of the immunoassay-based life detection tool (Signs of Life Detector [SOLID]) for identifying forward-contaminants on Mars, and (5) hardware design of the arm-mounted scoop analog of the Phoenix soil acquisition device to mitigate cross-contamination.
The ARADS project was part of NASA's Planetary Science and Technology Through Analog Research (PSTAR) Program. This project explores the science, instrumentation, and automation in performing a near surface (to 1 m depth) drill operation on Mars, using the hyper-arid Atacama (Cabrol et al., 2007; McKay et al., 2003; Navarro-Gonzalez et al., 2003; Cabrol et al., 2007) as an analog drill site (e.g., Glass et al., 2019, 2022; Moreno-Paz et al., 2019; Stoker et al., 2023). The final ARADS field campaign concluded in September 2019 with a 6-day simulated mission at a novel “landing site” the “Playa” (Fig. 1), selected for multiple ground-truth field studies (Glass et al., 2023, this issue). The ARADS CCSI constituted an integral part of the rover field deployment in both in-sim and out-of-sim operations.
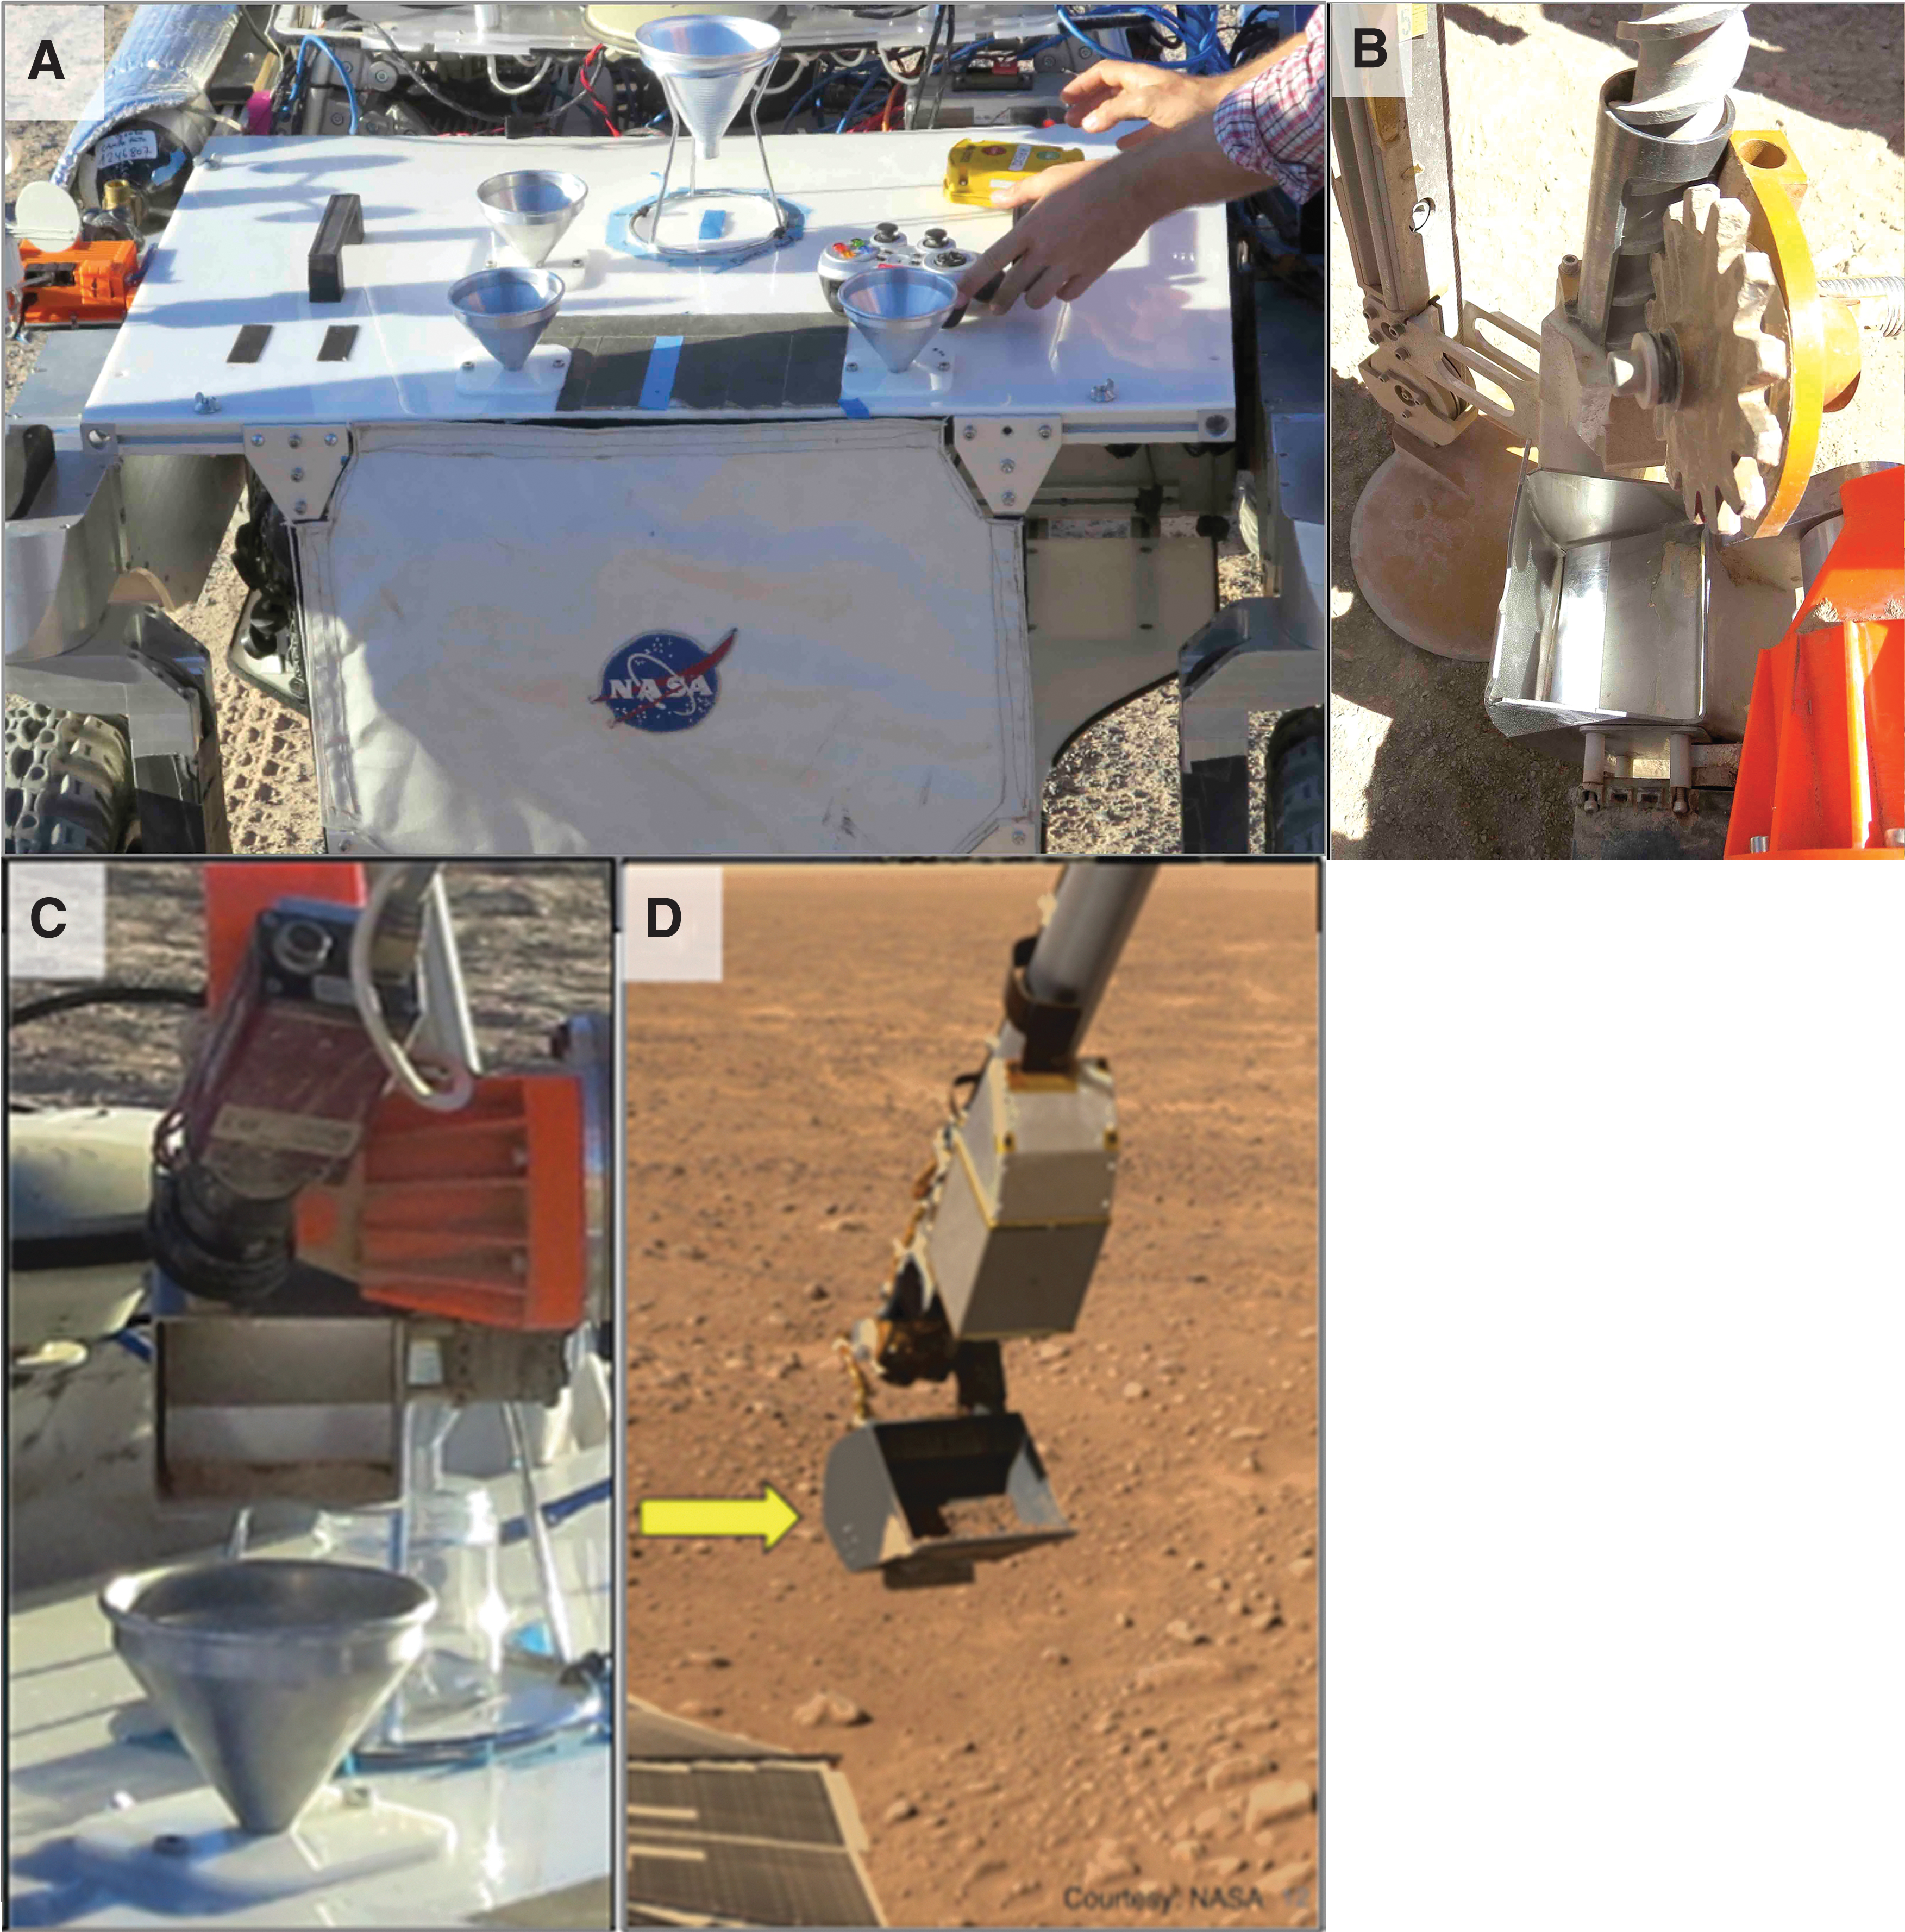
There are four major subsystems to the ARADS payload: The NASA Ames' self-navigating midsize rover (KREX-2) as the mechanical integration platform for the 1 m TRIDENT (The Regolith and Ice Drill for Exploration of New Terrains) drill and the other subsystems hosted by the Rover payload deck (Fig. 2A). The Honeybee Robotics' rotary-percussive Drill, whose string spiral coils can retrieve ca. 10–60 g of geological cuttings from every 25 cm of drilled subsurface (Fig. 4C). The Sample Handling and Transfer System (SHTS) includes an arm-mounted scoop analog to the Phoenix Icy Soil Acquisition Device (ISAD) shown in Fig. 2D (Bonitz et al., 2008; Glass et al., 2023) and four funnels on the top of the rover payload deck, protecting the science payload underneath (Fig. 2A): three ∼12 cm diameter instrument-feeding funnels, and one 13 cm diameter one (aka “Big_Fun”) to deliver overflow samples into a storage unit for post-field analysis (Fig. 2C). The science instruments included (i) The Signs of Life Detector (SOLID) or prototype, built by the Spanish Centro de Astrobiologia (CAB) (Parro et al., 2008) using fluoresce microarray immunoassay detection of 450 biomolecular compounds (amino acids, nucleic acids, proteins, and polysaccharides) at 1–2 parts per billion [ppb (ng/mL)] and whole cells, that is, 104–105 cells/mL (Rivas et al., 2008); (ii) the JPL's Chemical Laptop- formerly Microfluidic Life Analyzer (MILA) (Willis et al., 2015; Mora et al., 2020); (iii) a brassboard version of the Phoenix's Wet Chemistry Laboratory (WCL) for salt chemistry analysis; and (iv) the NASA Goddard Space Flight Center's Linear Ion Trap Mass Spectrometer, or LITMS for organic compounds detection and identification, which was field tested March 2019 (Castillo et al., 2023). Next, we describe the sample handling and transfer to these instruments.
SHTS.
The ARADS's fully automated rover/drilling/sampling/analysis system aimed at driving to locations of scientific interest and acquiring geological material for geochemical and biological study. The sample capture occurs in three steps. The stainless-steel drill string, nested inside the system's primary drill, accesses the depth of science interest and retrieves ca. 10–60 g of powdered cuttings. Before the sediment is brought to the surface, the arm-mounted scoop lowers to the ground to receive the drilled material (Fig. 2B).
Once sufficient powdered sediment from the target depth enters the scoop, this rises above the rover deck (Fig. 2A) to deliver material into the instruments' funnels (Fig. 2C). Each funnel drops the cuttings into 1 cm diameter holes aligned with the entry port of the analytical tools beneath the rover payload deck (not visible). Finally, the powder left in the scoop is dropped into the fourth, larger funnel (aka “Big_Fun”) and transferred into a pre-cleaned borosilicate glass jar as in previous ARADS campaigns (Wilhelm et al., 2018). The funnel-jar unit latches onto the rover payload deck top (Fig. 2A).
The rover instrument suite immediately analyzes the dropped samples. Alternatively, the instrument is detached, brought into the laboratory trailer, and analyzed immediately by the science team. Only one instrument team scientist can work at the dedicated sanitized lab bench to minimize contamination during sample analysis.
Finally, samples in jars are stored in a clean box for later sub-sampling and analysis of the archived cored materials on request by the science team. For this purpose, we operated on the clean bench top using sterilized stainless-steel spatulas in the dedicated science trailer (Fig. 9A). We excluded a few low-priority drilled intervals from the simulation to maintain mission fidelity. However, unlike on Mars, we did not discard these low-priority samples from the drill but manually collected them in labeled sterile Whirl-Pak™ bags for later use by the science team.
Relevance of contamination control
Cleaning, microbial reduction, and verification were fundamental to ARADS. Unlike the case for human and robotic exploration of Mars Special Regions, the forward contamination of the terrestrial poly-extreme Atacama Desert poses no real concern. However, because the hyper-arid surface of this region is predominantly devoid of microbes, instruments to detect molecular indicators of putative life must operate under low detection thresholds (high sensitivity).
Even minor bioburden contamination during sample acquisition and transfer into analysis could contaminate scientific results and confuse interpretations. Bioburden is the number of microorganisms on the non-sterile surface material. Sterilization refers to chemical or physical procedures that kill, deactivate, or remove all life-forms (i.e., MHRA, 2006).
A terminally sterilized surface device is “sterile” if the theoretical probability of a viable microorganism being present is equal to or less than 1 × 10⁻⁶ (Lambert et al., 2021). NASA protocols involve dry heat for microbial reduction (DHMR) and chemical methods when DHMR is not attainable. However, long-term absolute sterility is unachievable or is compromised after a few-minute exposure to a contaminating environment.
Further, hardy microorganisms can resist chemical treatment in clean rooms (Horneck et al., 2012; Moissl-Eichinger et al., 2015; Spry et al., 2021) and even use organic compounds in cleaning reagents as an energy source (e.g., Mogul et al., 2018). Field trials in extreme environments lack clean-room facilities, and continuous human-tended operations enhance the risk exposure of bioburden contamination to the hardware payload and sample analysis pathways.
The risk is enhanced under a time-constrained schedule for decontamination. Each Sol, the ARADS simulation initially allocated only a 20-min operational window for the microbial reduction and verification cycle, making critical the devising of a field-feasible and time-effective decontamination protocol (See details in Section 4).
Contamination Control Practices for Spacecraft Hardware
During the ARADS campaigns, we followed state-of-the-art contamination control procedures typical of those to prepare for Mars landed missions. The modifications fit the requirements posed by the terrestrial field trial. Carosso (2005) offered comprehensive background information on spacecraft decontamination and verification techniques shared with recent missions targeting planetary samples.
Examples include the 2007 Phoenix Mission and other missions to Mars such as the 2011 Mars Science Laboratory (MSL) (Mahaffy et al., 2004) and the 2020 missions centered on the analysis of molecular organic compounds, and the 2016 OSIRIS Rex to the carbonaceous near-Earth asteroid Bennu (Lauretta et al., 2017; Dworkin et al., 2018).
Although these missions were expected to advance decontamination procedures for sampling and sample handling mechanisms, they have yet to progress beyond the 2007 Phoenix Lander experience due to cost caps and slow advances in material technology (Miller et al., 2008). The Phoenix Mission, operated on Mars from 2008 to 2009, offers state-of-the-art contamination control for spacecraft hardware analog to ARADS.
The Lander's robotic arm-mounted digging scoop or ISAD collected and delivered ice-bearing regolith samples to the Thermal Evolved Gas Analyzer (TEGA) to determine indicators of habitable conditions in Mars ice-cemented ground, requiring strict contamination control (10 ppb) on the digging scoop to protect the scientific results from Mars.
Once assembled, the compartmentalized scoop surfaces were inaccessible for cleaning, challenging cross-contamination control between samples scooped from the martian soil. Unlike the 1975–1976 NASA's Viking landers, which were heat treated in their entirety (e.g., Soffen and Snyder, 1976), the Phoenix Mission sampling chain (blades and scoop) maintained only low organic contamination Level 75 A/10 requirement, that is, 100 ng/cm2 (Borson, 2005).
Control and assessment of contamination on the Phoenix TEGA included vacuum bake-out/dry-heat sterilization, containment for transport and testing, and contamination characterization on an engineering mock-up flight model. During Assembly, Test, and Launch Operations (ATLO) flight hardware in an ISO 14644-1 Class 8 controlled environment, bioburden requirement is ≤10 CFU/m3 (air samples), 2000 CFU/m2 (surfaces), and ≤1 CFU/5-finger glove print (ECSS, 2008a, b). During aseptic operations (Class <7), hardware assembly occurs on laminar flow under a stricter NASA Standard assay (NSA)-based bioburden level of <1 CFU/m3 (air), ≤300–400 CFU/m2 (surfaces), and <1 CFU (per gloveprint).
Assuming that the NSA can detect only 1% of the total viable and non-viable burden, 400 CFU/m2 corresponds to the threshold for aseptic operations of ≤40,000 microbial cells/m2 (or ≤3–4 cells/cm2) achievable by ARADS.
Sources of Contamination
Whether or not a foreign material is a “contaminant” depends on the objective of the planned analysis and only if the material interferes with the instruments' measurement. Foreign cellular materials and organic biomarkers detected in ARADS cores and hardware are contaminants. ARADS contamination control (Section 4) targeted anthropogenic, environmental, and cross-contaminations while addressing their risk level before and after mitigation.
Anthropogenic contamination by human-tended automated drilling tests is unavoidable and a significant concern for biologically depleted terrestrial and martian environments. In Atacama's biologically lean surface environment, airborne microorganisms are lesser concerning due to airflow dispersion. Conversely, anthropogenic microbiome contamination of soil and air via handling, clothing, and skin particles during daily operations can compromise results from the life-detection suite.
Environmental contamination is a unique problem in terrestrial trials, with three potential source entries into the sample path: (i) non-putative biological (viable spores, microbes, cellular remains); (ii) fossil molecular organics detectable by LITMS and SOLID; and (iii) airborne mineral dust and salts detectable by the wet chemistry instrument. There is a similar opportunity for airborne inorganic contamination on the martian surface, which is an unlikely source of biological contaminants. Airborne dust from the vast oligotrophic desert pavement to drill sites was initially not of great concern with bio barriers to protect sample-handling elements when not in use. Still, airborne biology resulted in an unexpected potential contaminant to ARADS (Section 6.2).
Cross-contamination could occur between different sedimentary strata drilled as powdered samples and mixed from the target depth; once in the scoop, a new sample could mix with sediment residue adhering to the inside from previously drilled intervals.
Methods of Contamination Control
We describe by-design, operational, and contamination control techniques we tested in ARADS.
Contamination remediation by design and operational methods
To remediate cross-contamination, we used stainless-steel or aluminum sampling hardware, avoided soft materials and polymers poorly conducive to field decontamination, and chose single-use pre-cleaned stainless steel funnels and clean-certified borosilicate glass jars. The sample acquisition and handling system design also enabled contaminant dilution by accepting a relatively large sample size, up to 60 g, compared with the expected residual cross-contaminants (Fig. 12).
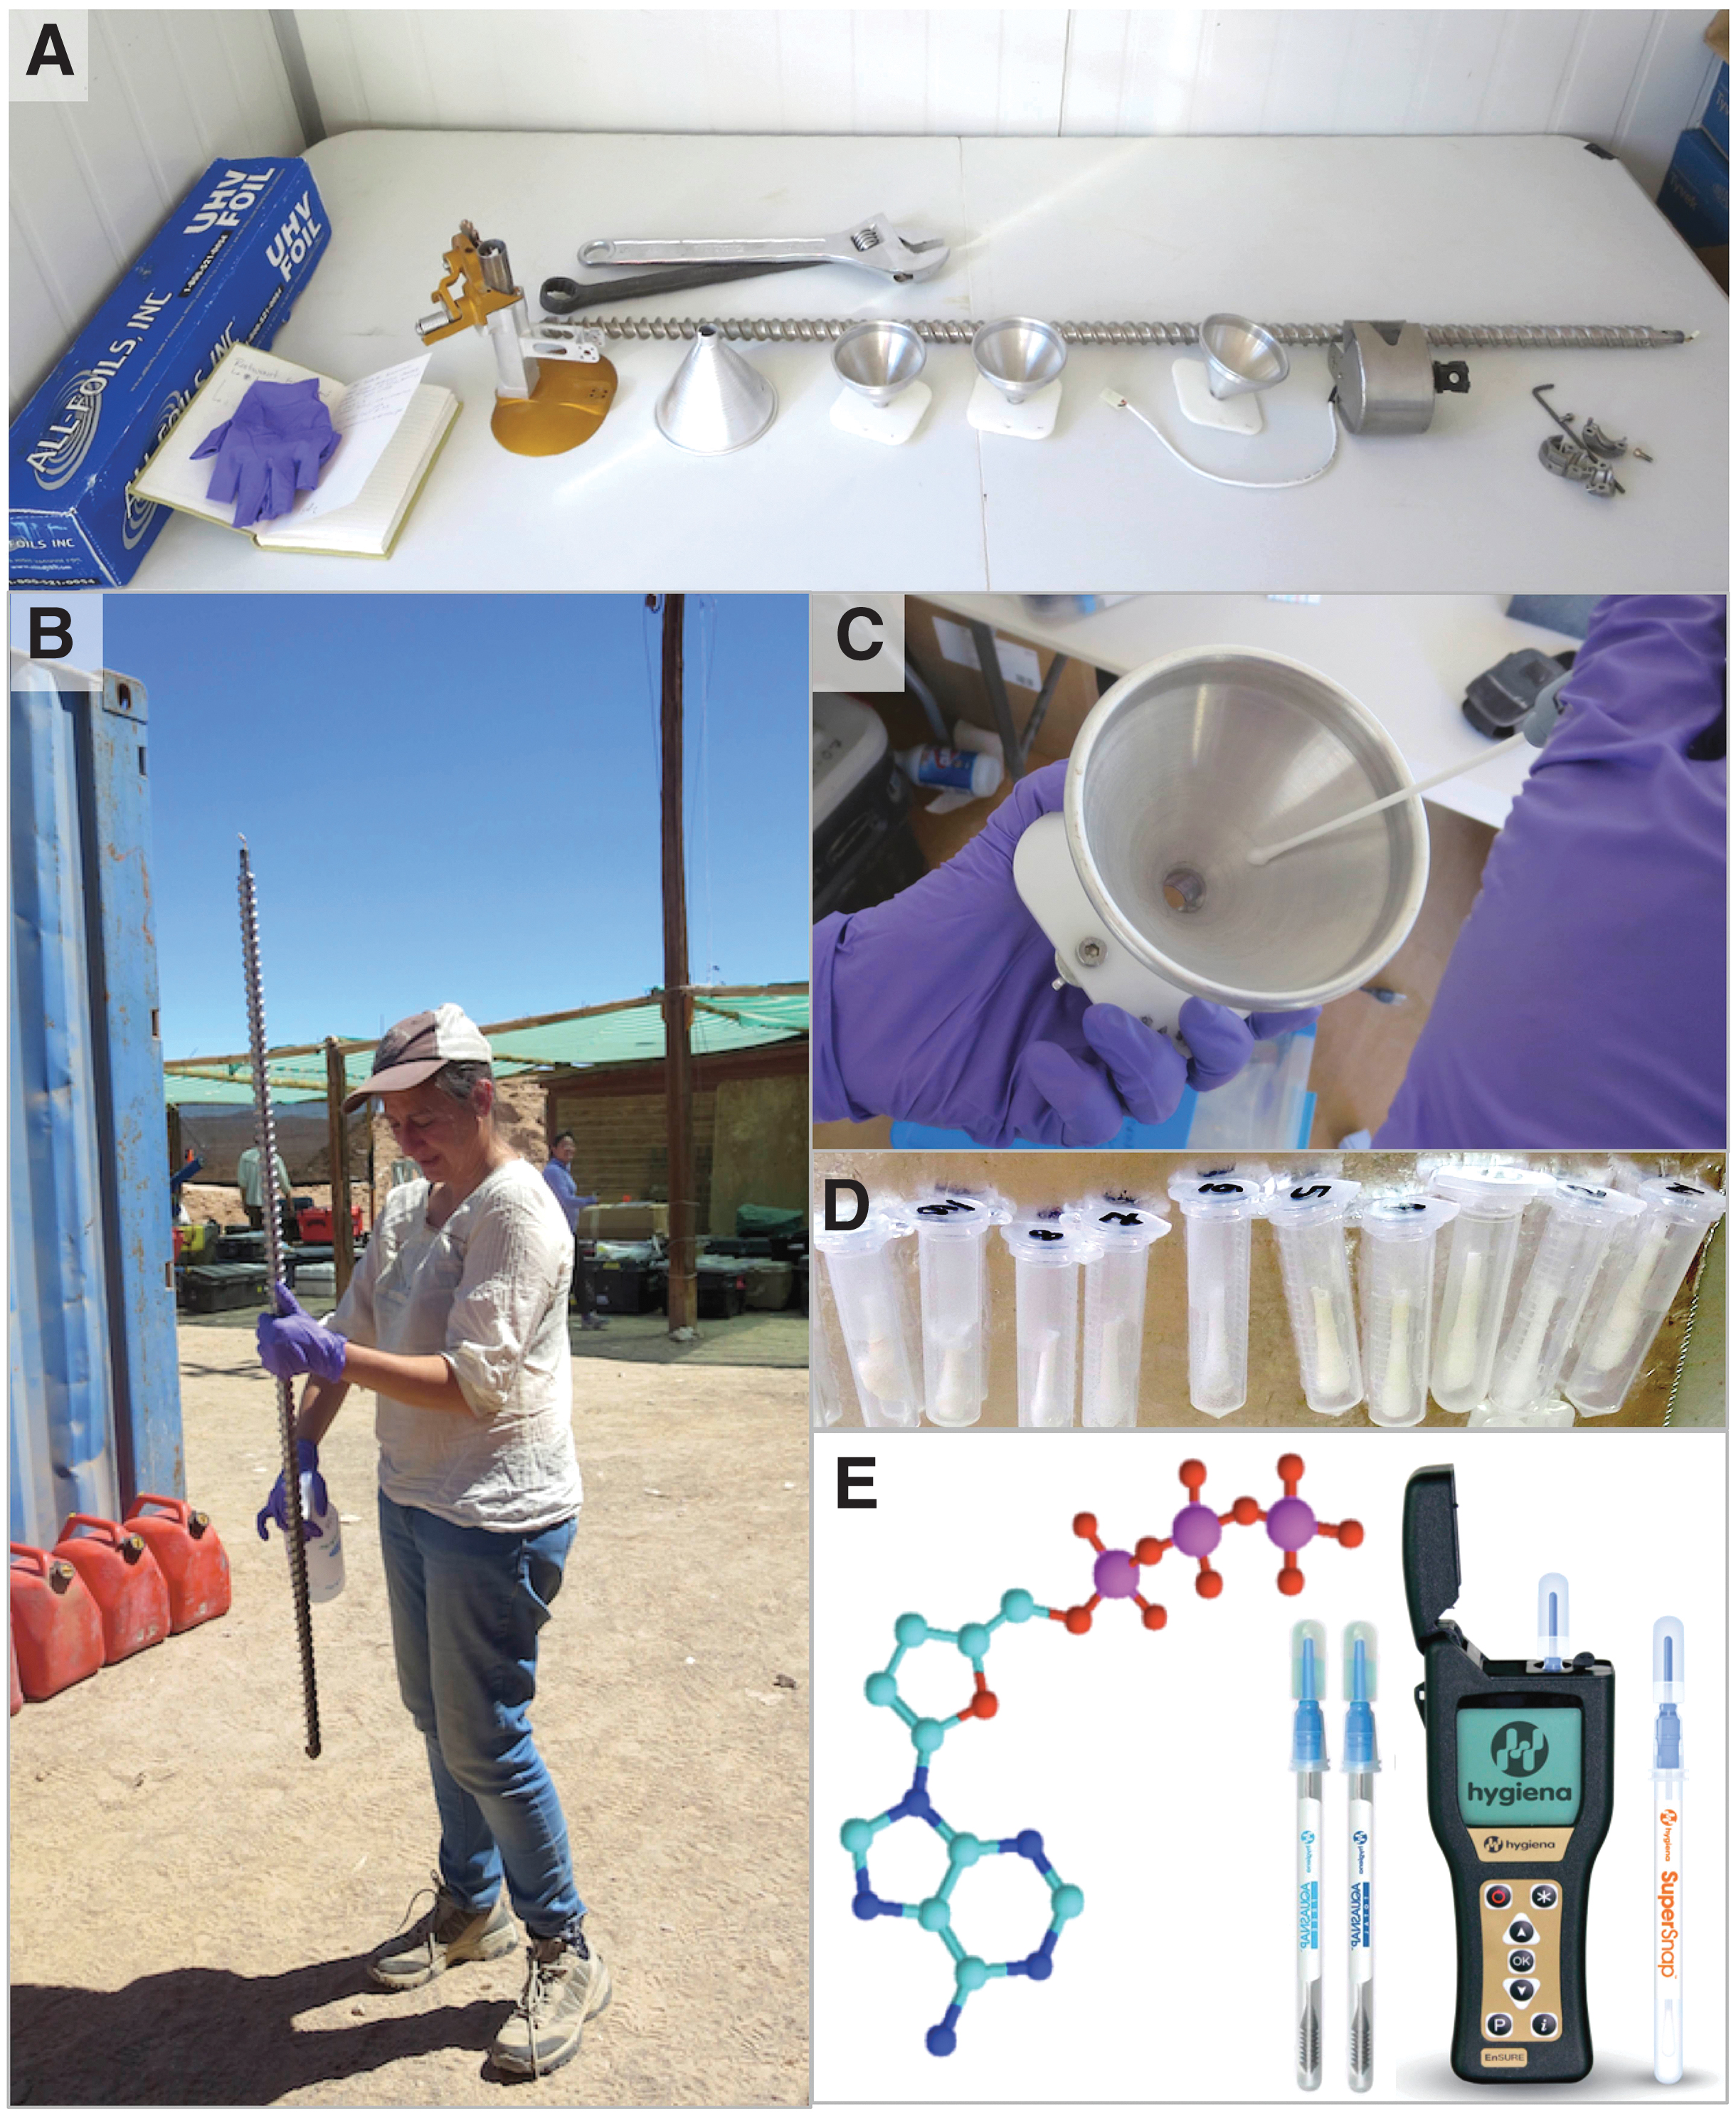
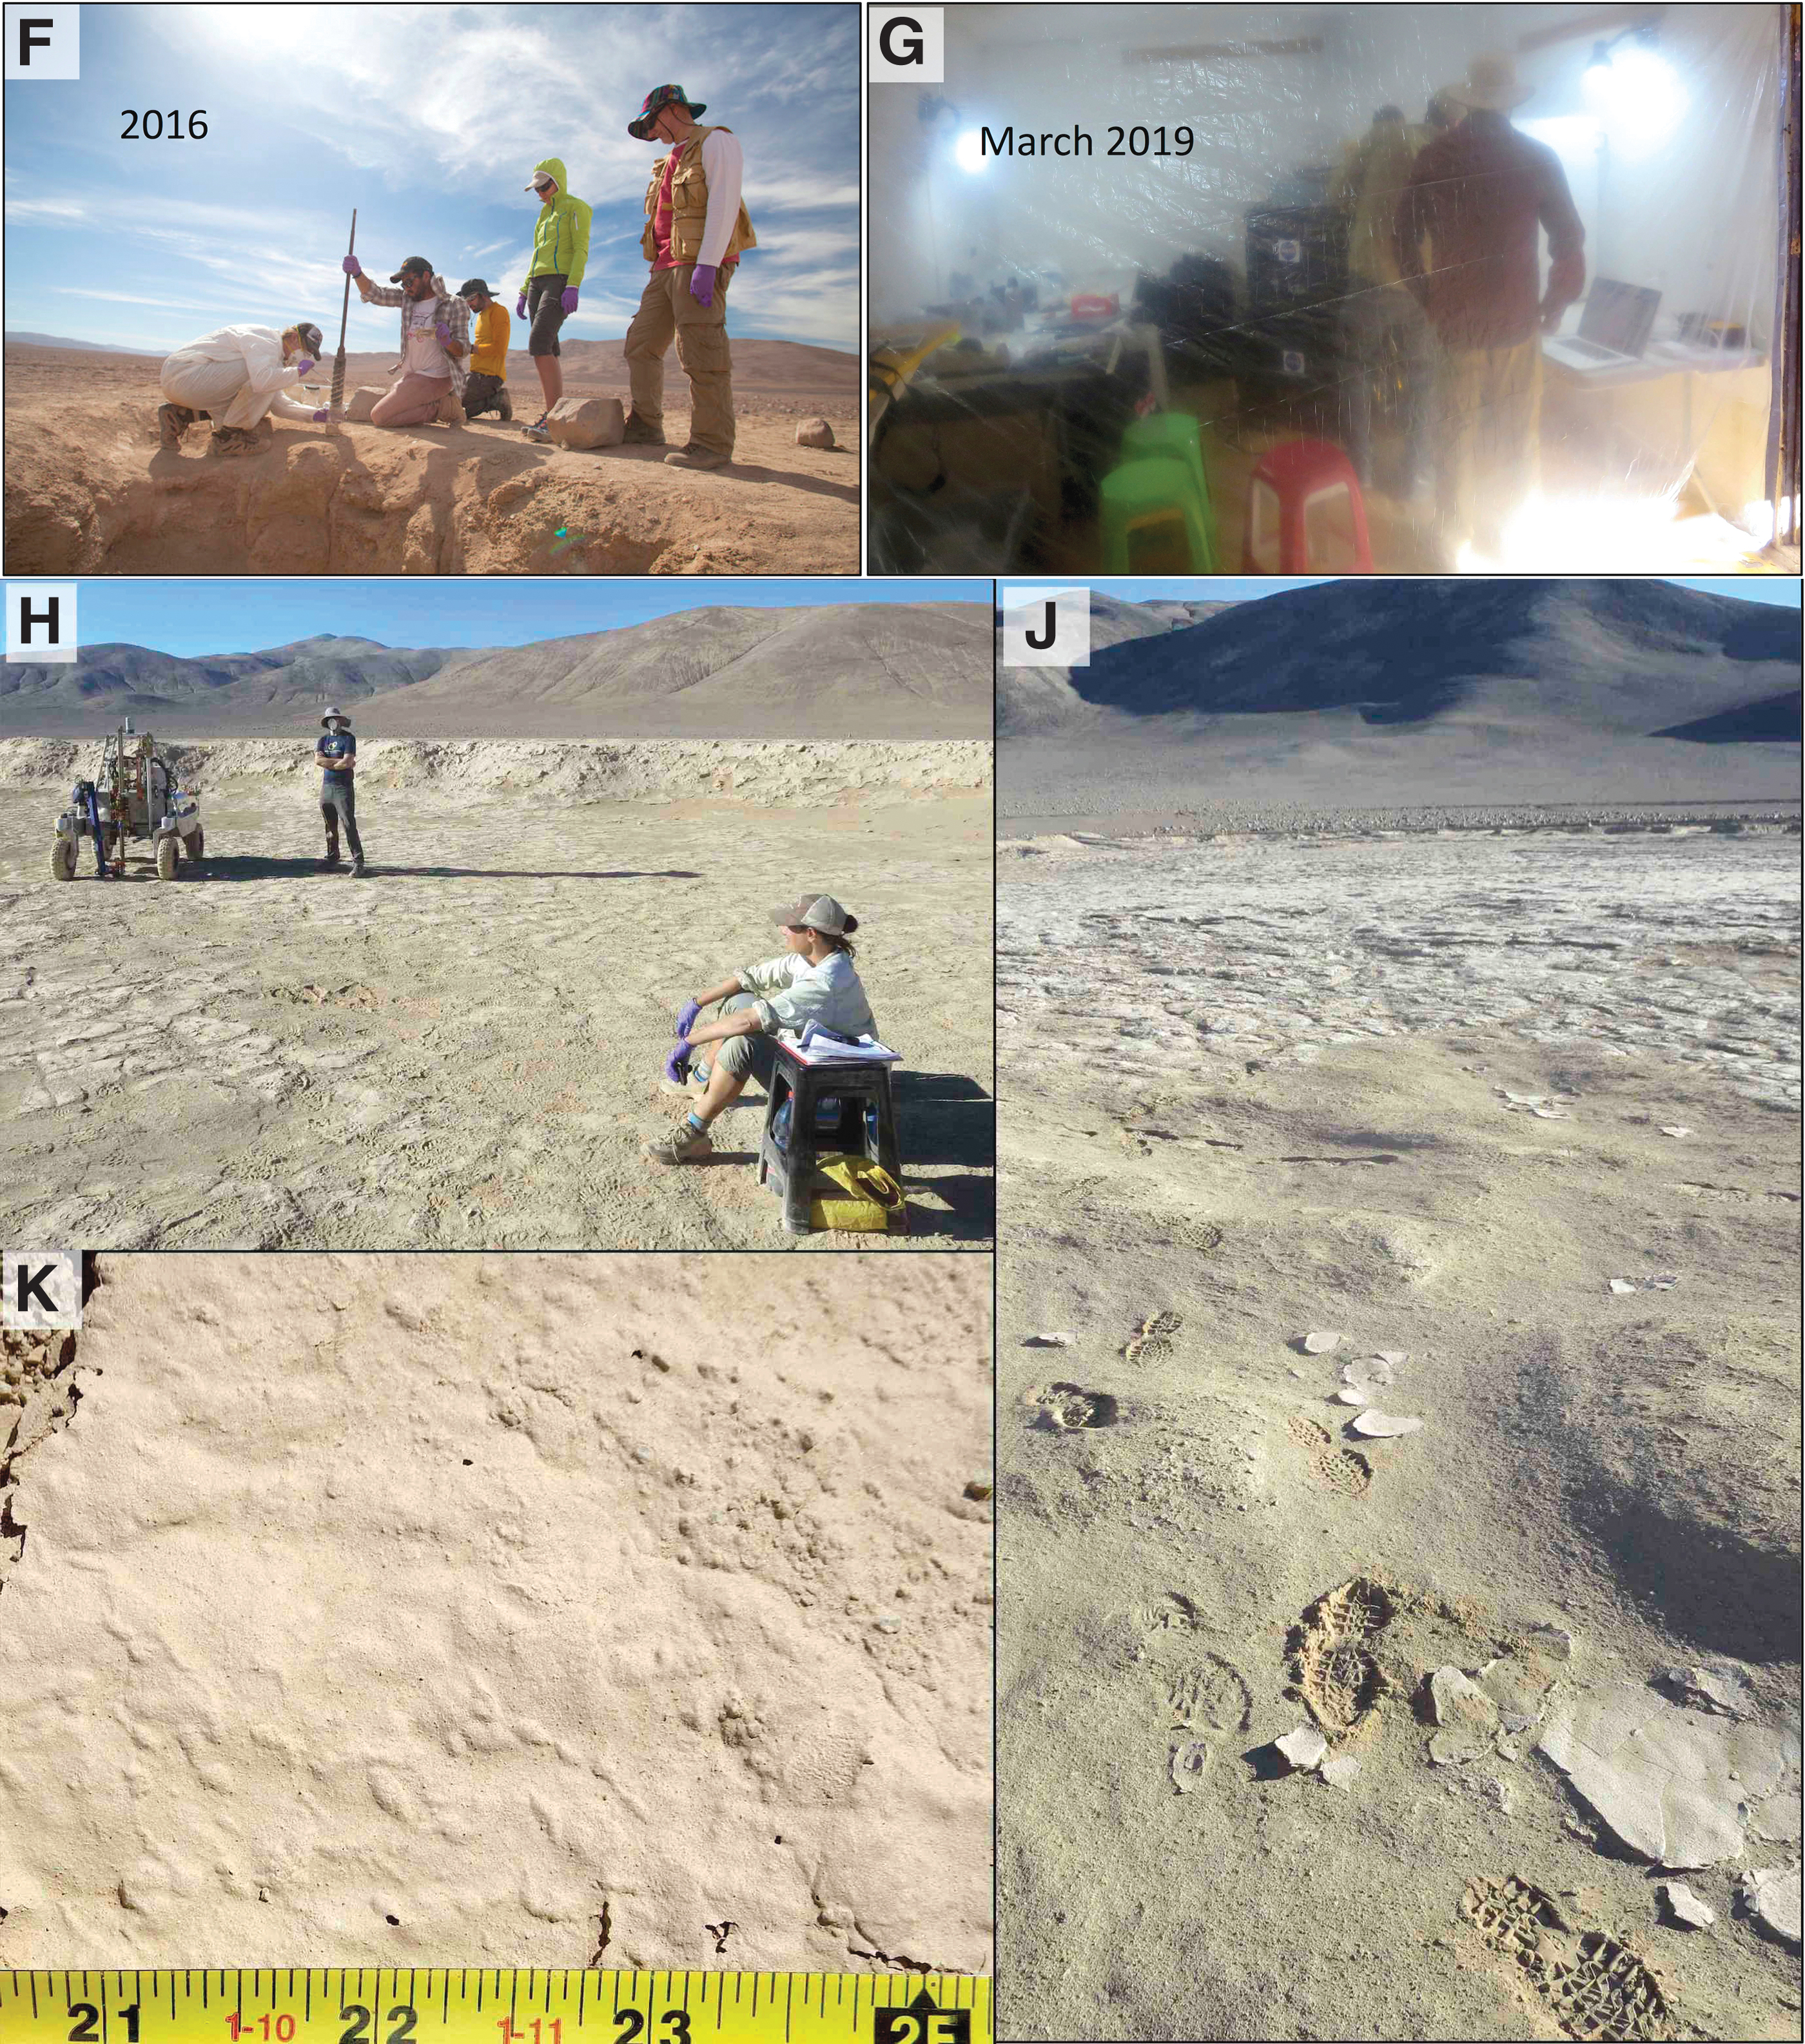
The general contamination remediation operations included protective shields usage and drill operators training guidelines that involved: (1) mindful walking in approaching the rover downwind to avoid stirring dust from the playa pavement (Fig. 3J); (2) only two operators tending the drill in-sim (Fig. 3H); (3) use of facemasks and sanitized gloves (ethanol [Et-OH]-wiped) when approaching hardware at close contact with samples or working on the instruments outlets; (4) hand-sanitization before wearing gloves; (5) touch not critical equipment surfaces and tools or contact with sampling surfaces with un-sanitized or contaminated gloves; (6) avoid contact between the clean gloves and body's surface, or any compromised surface; (7) use of clean/sterilized tools whenever possible; and (8) wear a protection suit when appropriate (Fig. 3F).
We used protective media for proactive contamination control before, during, and between operations. For instance, before assembly on the rover deck, we transported double-wrapped cleaned funnels in sanitized plastic containers (Sterilite TM) wiped down with high-purity isopropyl alcohol (IPA). While the rover moved toward the drilling site, we protected the cleaned drill, scoop, and funnels with heavy-duty Ultra High Vacuum (UHV) Aluminum Foil (AllFoil, Inc.), which was removed only before use.
Between each drilling cycle, we kept the bio-barrier in place until the drill was ready to operate (Fig. 4C), the scoop was about to accept drilled samples, and the funnels could receive and transfer samples for analysis. We maintained a contamination-free sample path to each life detection instrument. For instance, the SOLID's inlet valve opened only before the sample's release into the analytical tool (Parro et al., 2008).
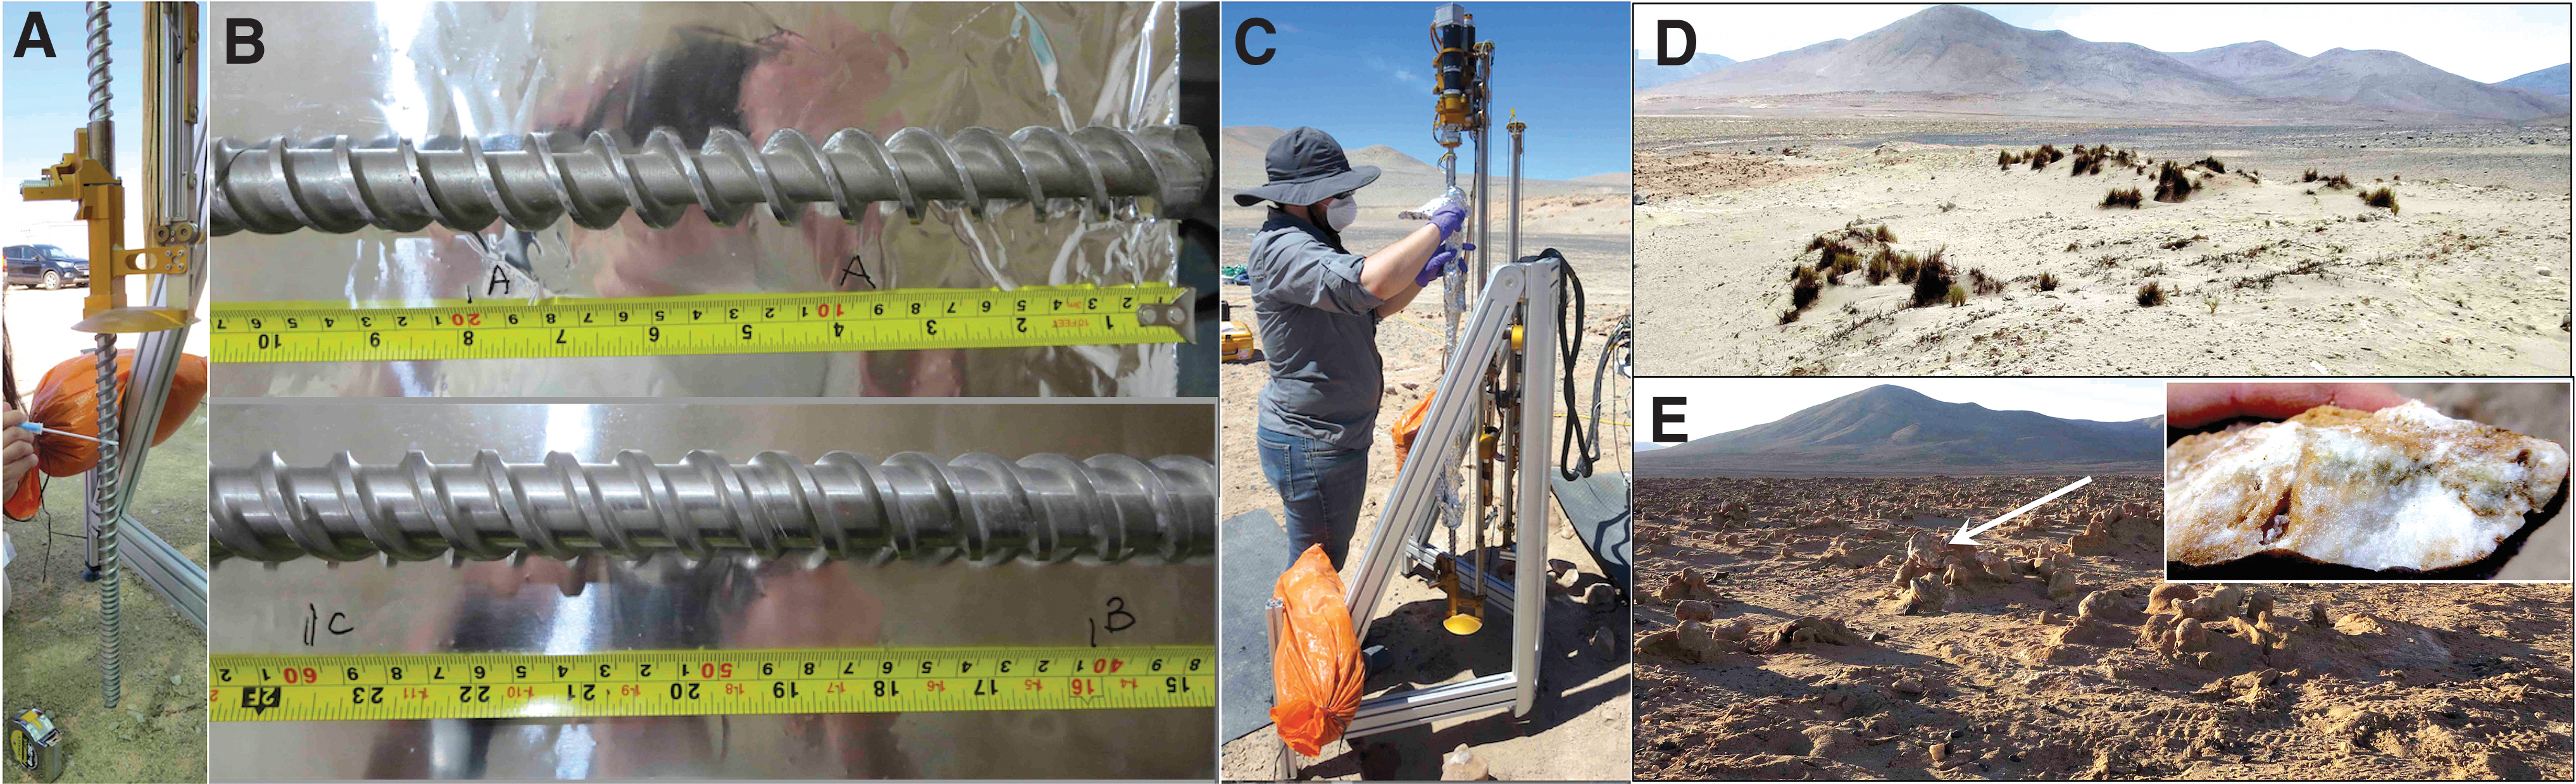
At the end of each Sol, the rover-mounted drill string and scoop were rinsed off with distilled water (DW), wrapped in Al foil, and left onsite overnight. The funnels were unclamped from the rover deck, wrapped in Al foil, and transported to the Yungay Station (Lat. 24°4′53.05”S, Long. 69°55′9.51”W) for a new cleaning cycle before the successive Sol's operations. Each day, the rover-mounted drill string was “touched up” and cleaned (done on previously deep-cleaned surfaces) before use.
We tested the deep-cleaning effectiveness on two Icebreaker drill segments: A (drill tip, 0–25 cm) and C (40–60 cm) in Test 2 (March) and segment B (20–40 cm) in Test 3 (September) together with the sample handling hardware elements (Test 4). We used chemical precision cleaning, a core component of both Quality Assurance for robotic landed missions to Mars and PP (e.g., Frick et al., 2014).
In 2019, we did not use heat sterilization because surfaces could be easily re-contaminated in the field, and decontamination cycles would require additional time. Further, heat sterilization would not remove organic contaminants. Tables 1 and 2 summarize the chemical cleaning and microbial reduction steps we applied; their specific effectiveness for ARADS is addressed in Section 5 and Figs. 6A–H and 7.
Multi-Step Protocol, as Described in Table 2
Multi-Step Protocol, as Described in Table 2
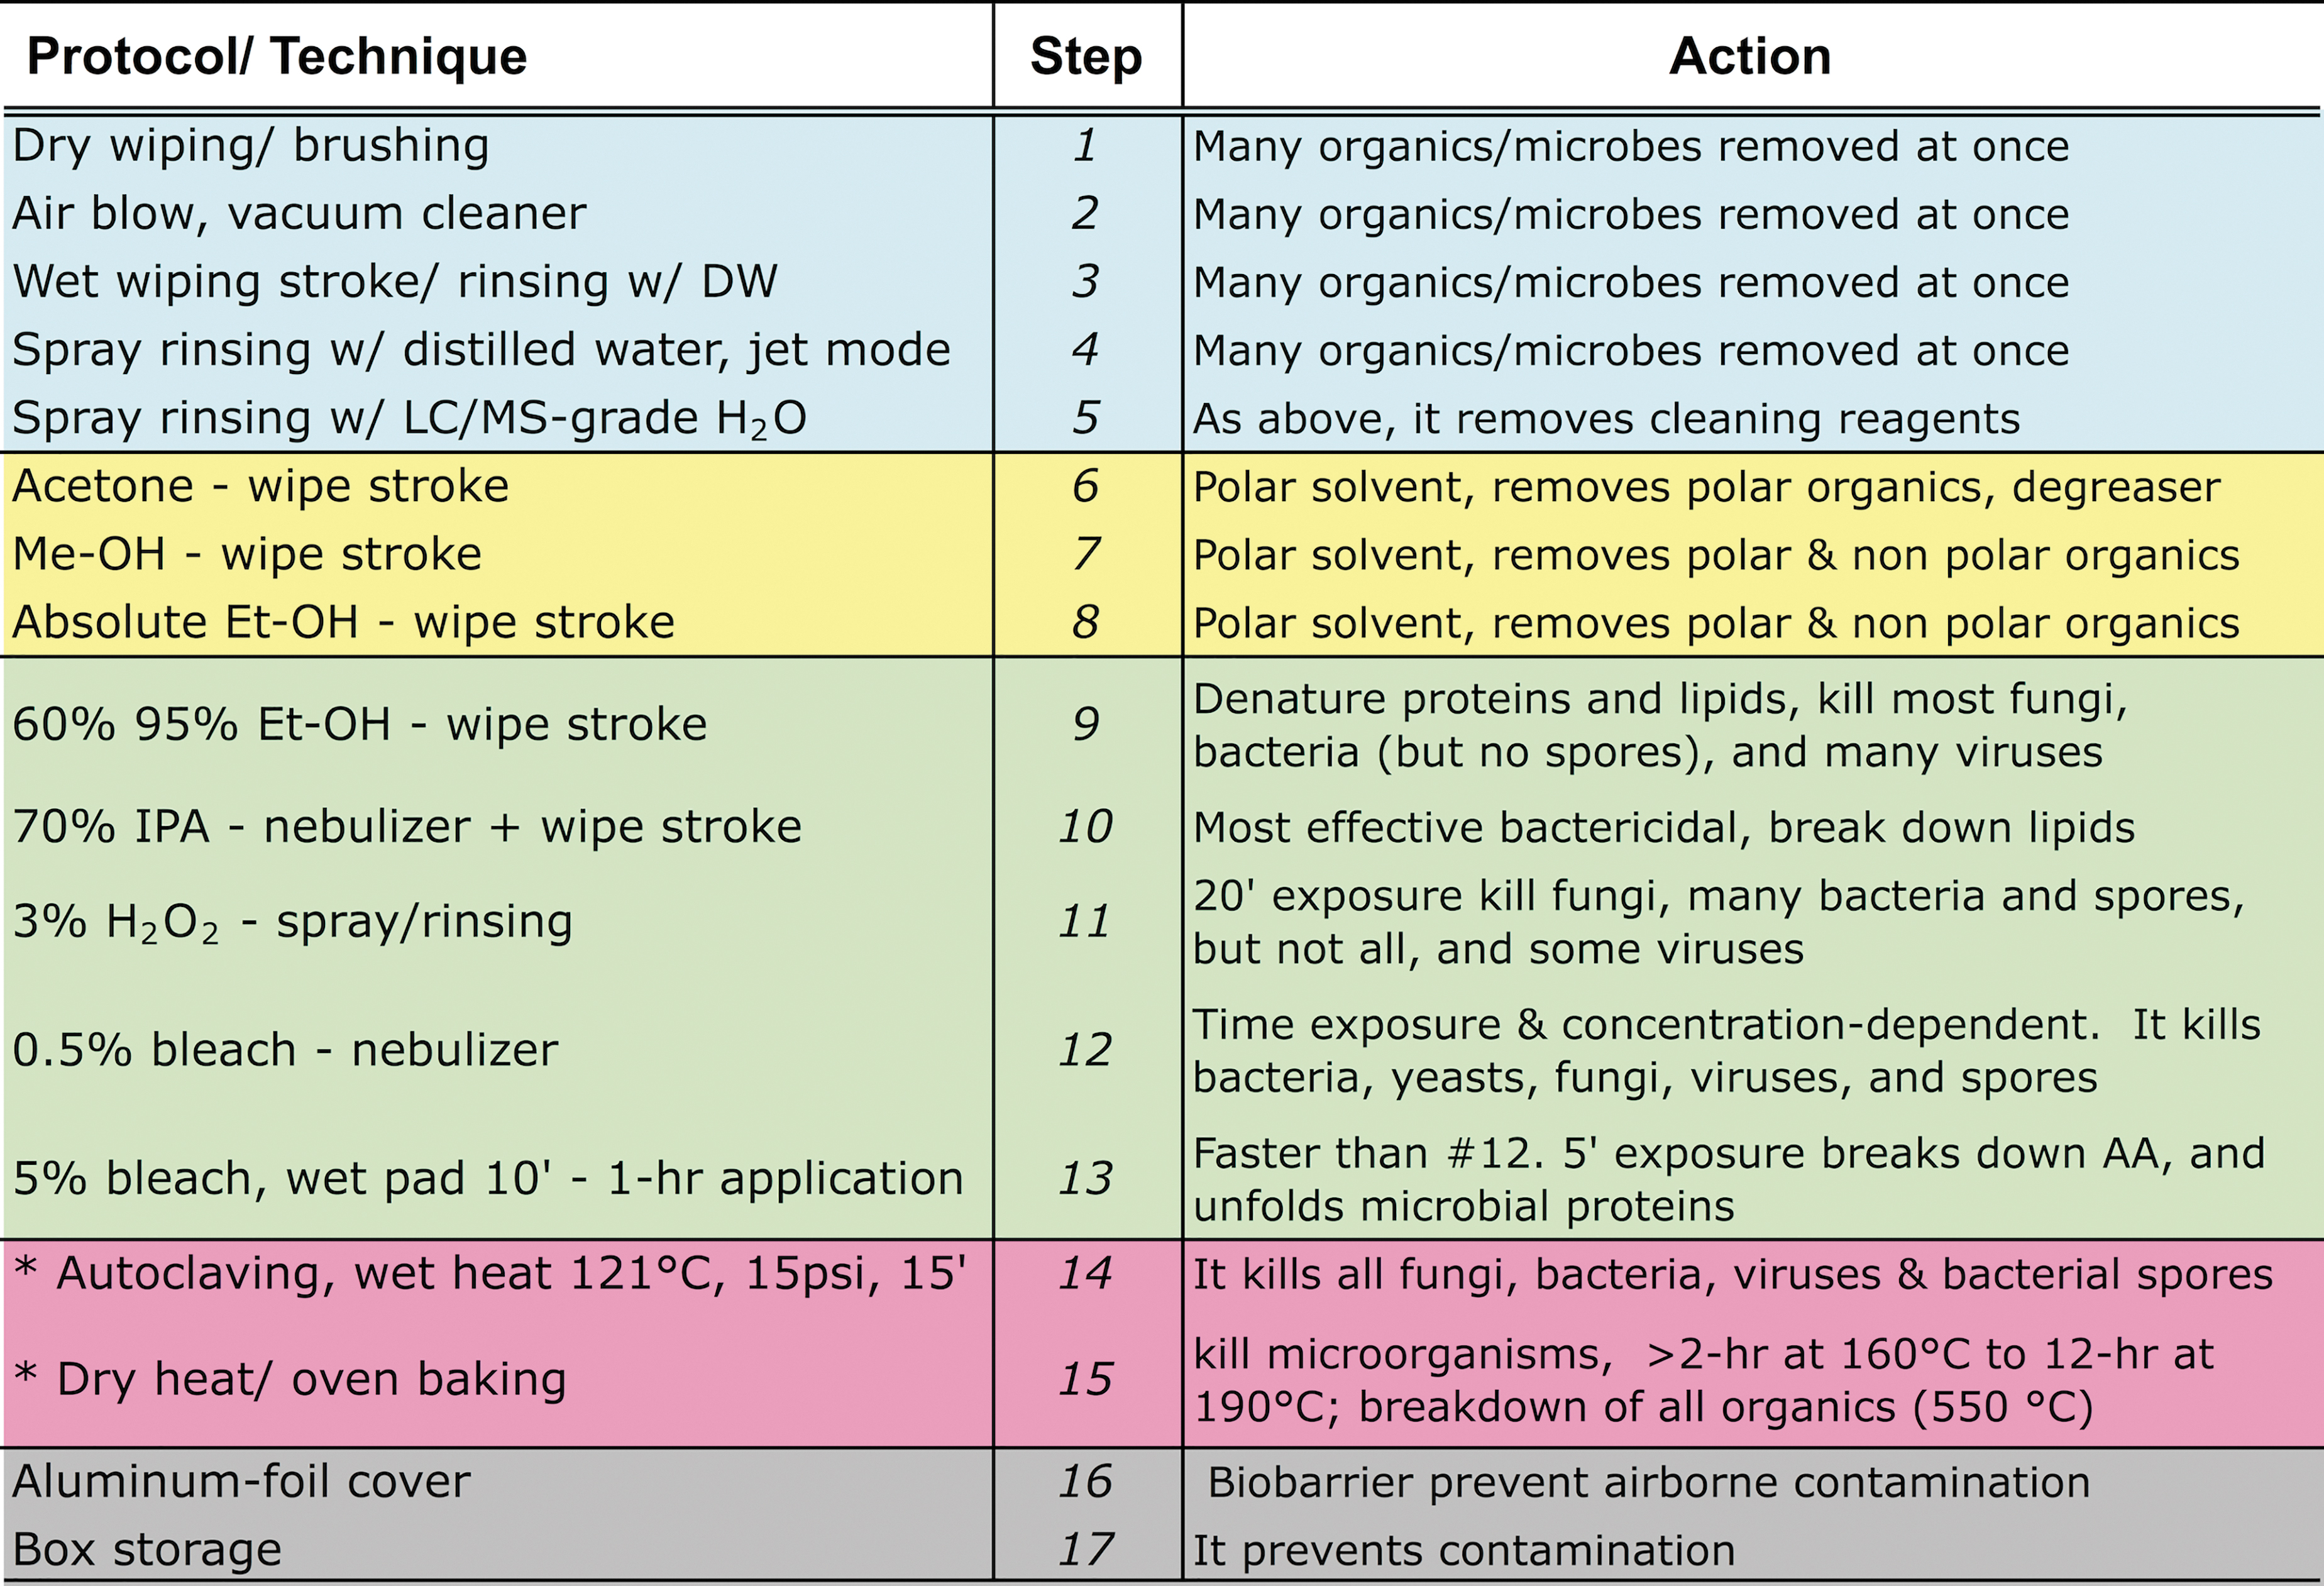
These steps involve mechanical cleaning (1–5), solvent-based molecular organics removal (6–8), physical and chemical microbial reduction/sterilization (9–15), and preventive actions (16–17). Household bleach is 5.25% sodium hypochlorite (NaClO).
DW = distilled/deionized water; Et-OH = ethanol; IPA = isopropyl alcohol; LC/MS = liquid chromatography/mass spectrometry; Met-OH = methanol.
Contamination Control Practices Used for the Rover Astrobiology Drilling Studies Subsystems
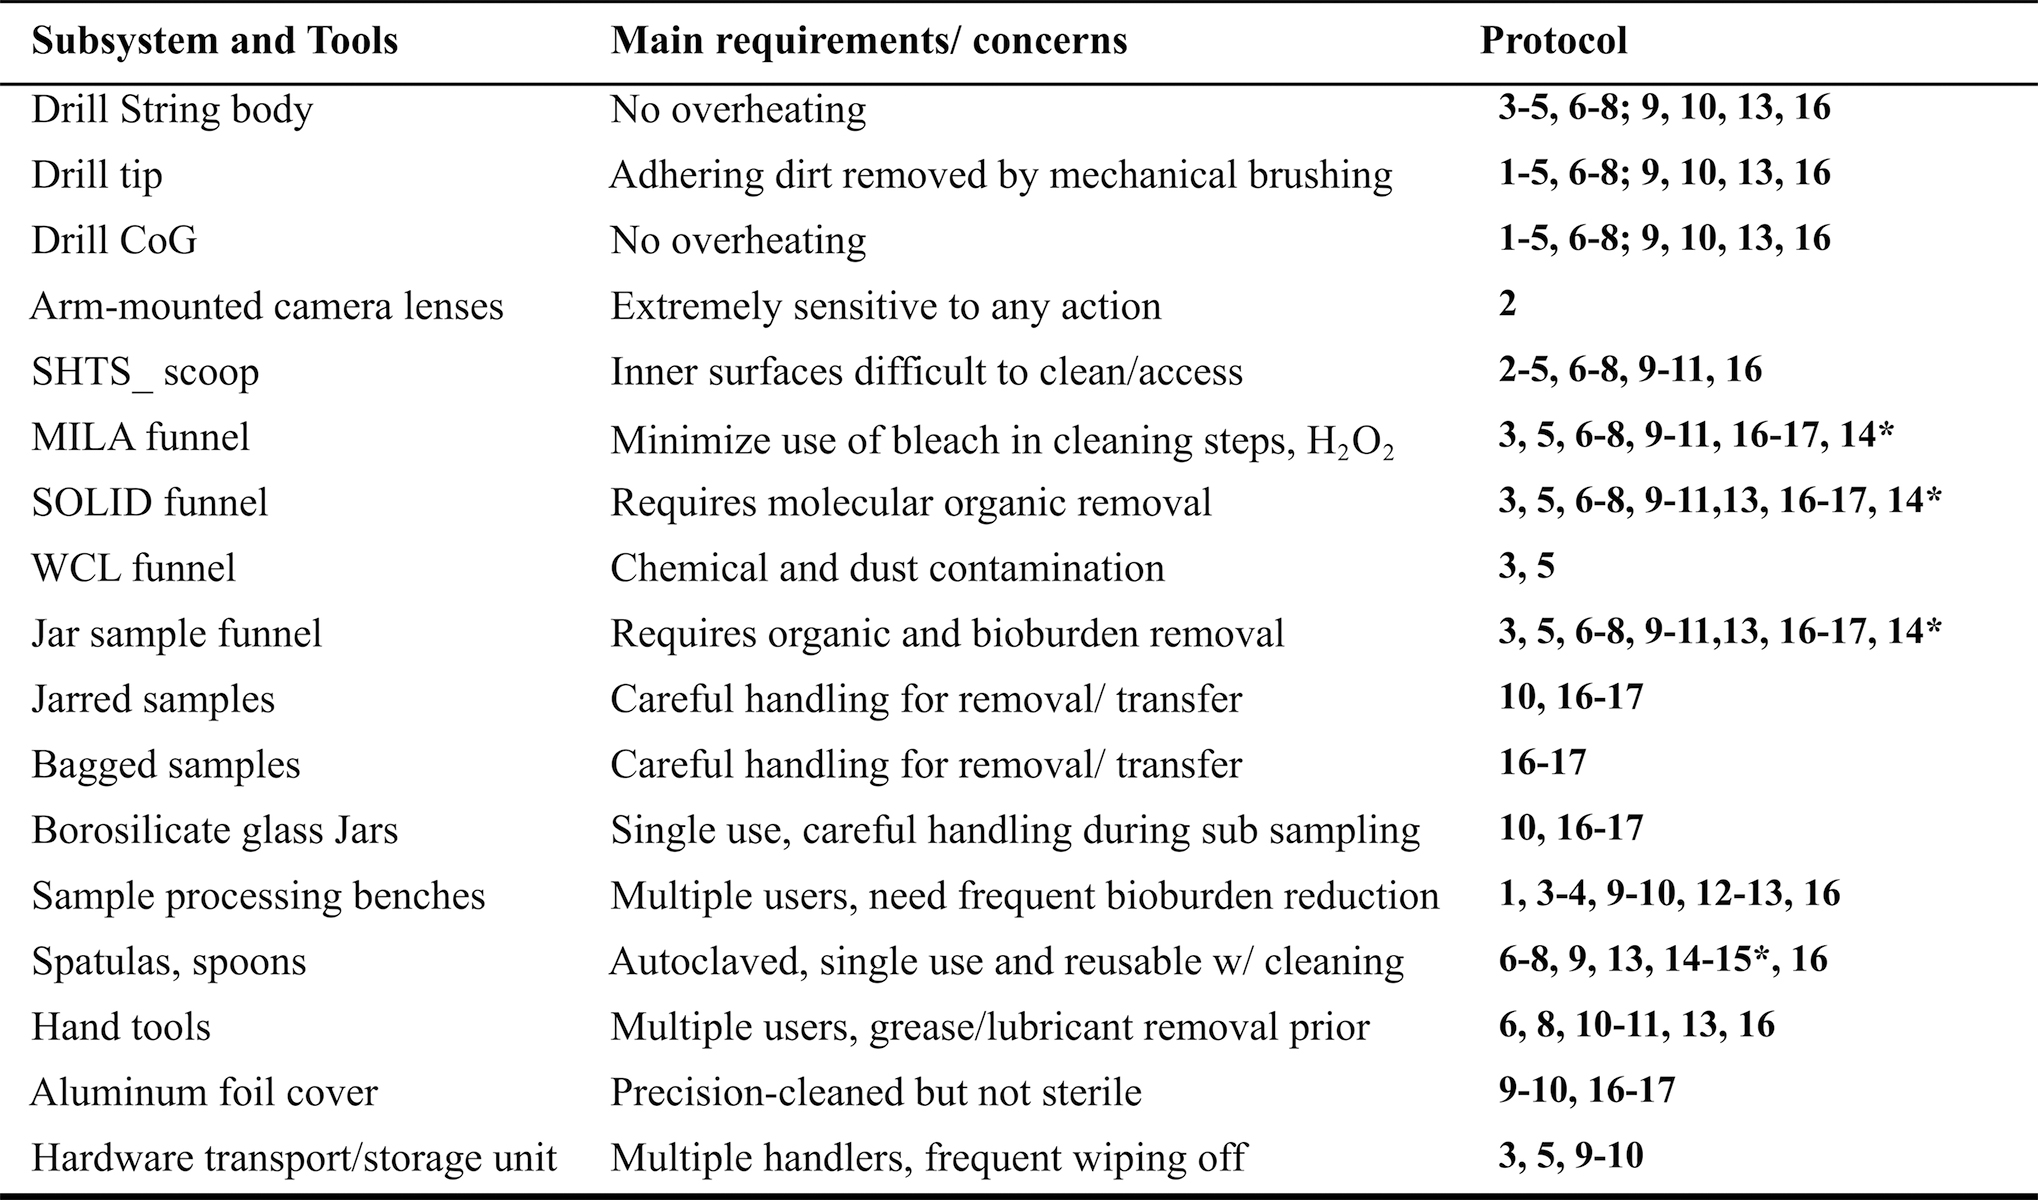
See Table 1 for an explanation of each protocol's coded items.
The precision cleaning involved (1) adenosine triphosphate (ATP)-free distilled water (DW) or liquid chromatography/mass spectrometry (LC/MS) grade water for removal of visible dirt (adhering clays and dust particles); (2) solvents with decreasing polarity (pure grade acetone, methanol, and Et-OH) to remove the aromatic and aliphatic molecular organics; and (3) microbial reducing agents, for example, 60–80% Et-OH, high-purity IPA, 0.5–5% household bleach (NaClO; fresh batch, unopened bottle as direct sunlight and organic matter inactivate NaClO), and 3% hydrogen peroxide (H2O2) for disrupting bacterial biofilms and to inactivate/kill microorganisms.
NaClO and H2O2 were applied individually or simultaneously. We used various dispensing methods and multiple applications to maximize the chemical exposure to the target hardware, for example, bleach-soaked (impregnated) polypropylene wipes wrapped around the string's surface, with wraps molded around the drill's spirals for 1 h. Afterward, the drill was wiped off, air-dried, and thoroughly rinsed with ca. 0.5–1 L of ATP-free DW.
Dispensing and wiping
We adapted techniques based on hardware topography; in some cases, we used professional spray bottles to mist, spray, and stream each chemical. Still, highly volatile solvents evaporate quickly from the target hardware, decreasing their cleaning effectiveness. In some cases (drill deep cleaning), we preferred stroke-wiping hardware with lint-free anhydrous solvent-impregnated wipes to remove contaminants instead of direct spraying onto the hardware.
The standard Quality Assurance for robotic landed missions to Mars requires periodic precision cleaning of exposed flight hardware surfaces with high-purity IPA-soaked lint-free swabs and wipes (e.g., Carosso, 2005). We impregnated wipes (by spraying sufficient reagents onto them) for the most efficient disinfection (Panousi et al., 2009).
In other cases (e.g., funnel's narrow outlets), we nebulized aqueous IPA several times to maximize exposure to the disinfecting agent. Finally, a last iteration with (IPA)-soaked low-lint Kimwipes (KIMTECH KimWipes Task Wipers) removed cellular remains from the surface to maximum disinfection. The wiping best practice we applied involved consistent pressure on every stroke, working from top to bottom (for the drill string) and “pull and lift” from the interior (cleanest) to the exterior (dirtiest) areas (for scoop and funnels).
When folded, the wipes provide up to eight clean, usable sides to prevent re-contamination across the cleaned surface.
Water rinse
A third step included thoroughly rinsing with a stream of ATP-free gas chromatograph–mass spectrometer (GC-MS) grade water for the complete removal of cleaning agents, any Kimwipes' fiber residue, dead/inactivated microbes, and cellular constituents.
Hardware contamination verification assays
We used two independent contamination verification methods: the ATP luminometry assay for viable total bioburden and the Fluorescence Sandwich Microarray Immunoassay (FSMI) for broader characterization of microbial taxa and their molecular and cellular contaminants. Both techniques, described next, involve a solvent swab assay of the post-cleaning exterior drill string segments and the interior surface of the scoop and funnel.
Best practices include a consistent swabbing technique (horizontal, vertical, and diagonal), directional pressure, and time ca. 5 min (see e.g., Barengoltz, 2005). Swab samples require subsequent wet extraction for contaminants analysis. Depending on the surface roughness, we used two swabs to retrieve the ATP from the hardware surface and combined the resulting values or assayed smaller surfaces if covered by mineral dust.
ATP luminometry assay
We relied on the ATP Swab assay for the in situ real-time, pre-screening contamination risk-reduction and disinfection certification because all living organisms use ATP as the universal energy carrier (Lundin and Thore, 1975a, 1975b), and this molecule quickly degrades after cellular breakdown (Holm-Hansen and Booth, 1966).
The assay is used for the bioburden monitoring of spacecraft hardware in cleanrooms (NASA Procedural Requirements 8020.12D; 2011, Venkateswaran et al., 2003). The Hygiena ATP assay system (Fig. 3E) includes a self-calibrating (25–28°C) handheld Luminometer (EnSURE) with a dynamic range of 0.1–2000 femtomoles, operating with an ultrasensitive ATP surface swab (SuperSnap), whose limit of detection (LOD) is 0.1 × 10⁻¹⁵ moles, or 0.1 fmoles ATP.
The luminometer measures the light emitted by the firefly's (Photinus pyralis) luciferin-luciferase (L-L) enzymatic reactions (pH 7.6-buffered) binding with the ATP released by living cells in the presence of oxygen and magnesium (Balkwill et al., 1988), proportionally to the ATP in the sample (Lundin and Thore, 1975a; McElroy and DeLuca, 1983). The photodetector converts the generated photons into Relative Luminosity Units, or RLUs (15-s readings), that can translate into ATP concentrations (1 RLU equivalent to 0.1 fmoles ATP) with dilutions of ATP standard (Na_ATP salt).
Fluorescence sandwich microarray immunoassay
The Quality Assurance for robotic landed missions to Mars (Phoenix, MSL, and 2020) requires follow-up standard molecular cleaning verification by Solvent Swab Analysis (SWA) of flight hardware's swabbed surfaces with a Freon-based solvent via Fourier transform infrared (FTIR) spectroscopy or GC-MS (Anderson et al., 2002; Mahaffy et al., 2004; Blakkolb et al., 2014).
A subset of post-cleaned hardware (Sol 5 and Sol 6) analyzed for ATP (Table 6) was also co-analyzed repurposing the SWA for use by the SOLID's FSMI targeting SOLID-relevant biological contamination in place of contaminating compounds detectable by FTIR or GC-MS. We used Teflon swabs moistened with ∼100–200 μL solvent (2-propanol, Et-OH, methanol, acetone) to sample the hardware (Fig. 3D) and manually analyzed the swab extracts with the Life Detector Chip LDChip200 immunosensor (Rivas et al., 2008; Parro et al., 2011; Blanco et al., 2012; Moreno-Paz et al., 2023, this issue).
The LDChip is an antibody microarray comprising 200 printed antibodies raised against various universal targets: archaea and bacteria cells, extracellular polymers (EPS, Peptidoglycan), amino acids, peptides, or proteins from well-preserved metabolic pathways (nitrogen fixation, sulfate reduction, nitrate reduction, etc.). The Microarray Immunoassay has been successfully tested in several field campaigns (Parro et al., 2008, 2011, 2019; Fernández-Martínez et al., 2019; Sanchez-García et al., 2020). See Moreno-Paz et al. (2023, this issue) for additional information.
Swabs were suspended in 500 mL TBST-RR buffer (0.4 M Tris-HCl pH 8, 0.3 M NaCl, 0.1% Tween 20) and sonicated with a hand-held ultrasonic homogenizer UP200Ht (Hielscher Ultrasound Technology). One-minute five cycles of maximal amplitude with cooling intervals yielded 50 μL liquid extract directly incubated in the multiarray analysis module cassette (MAAM) (Rivas et al., 2008). After a 1-h incubation at room temperature in a Titrimax 1000 shaker (Heidolph Instruments), a washing step with 5 mL of the TBST-RR buffer followed.
Then, 50 μL of 200 Alexa-647 labeled antibodies in TBST-RR buffer with 1% bovine serum albumin (BSA), added as antibodies tracer (or detector), was incubated for 1 h at room temperature. The microarray was scanned in a GenePix 4100A device for fluorescence at 635 nm laser excitation. We processed the resulting images using the GenePix Pro 7.0 Software (Molecular Devices, Sunnyvale, CA).
After subtracting the local background and the negative controls, each antigen-antibody pair's fluorescence intensity (FI) was the average of three internal replicates. We considered positive fluorescent signal intensities for each antibody-antigen reaction only after cutting off the FI signal values higher than 2.5 times the background level. Results of hardware and airborne contaminants analysis are in Tables 6, 7, and 9, respectively.
Deep-cleaning tests
Assessing the amount and distribution of hardware bioburden under mitigated and unmitigated field conditions is necessary for understanding the contamination process and cleanliness threshold limits.
The deep-cleaning experiments began in March 2019 and continued in September at the Yungay Station, operated by the University of Antofagasta. The hardware was processed on a clean bench inside our field laboratory set up in a trailer (Fig. 3A).
We expected the time required for effective cleaning to depend on how much bioburden was initially present on the hardware (how long biofilms took to form) and its distribution pattern on the hardware topography (Fig. 5). Thus, our objectives were to (1) assess the long-term built-up on a drill string—after ∼1 year (March) and 6 months (September) of storage and general handling (Test 1); (2) assess the short-term hardware contamination during a typical day of use (re-contamination of deep cleaned hardware); and (3) determine the most field feasible multi-step cleaning, microbial reduction (aka disinfection) protocols (Tests 2–4). Test 2 was repeated in September (Test 3 and 4) for integration in the 6-Sol mission simulation. The experiment's results are in Sections 5.1–5.2, Figs. 5 –8, and Tables 4 –6.
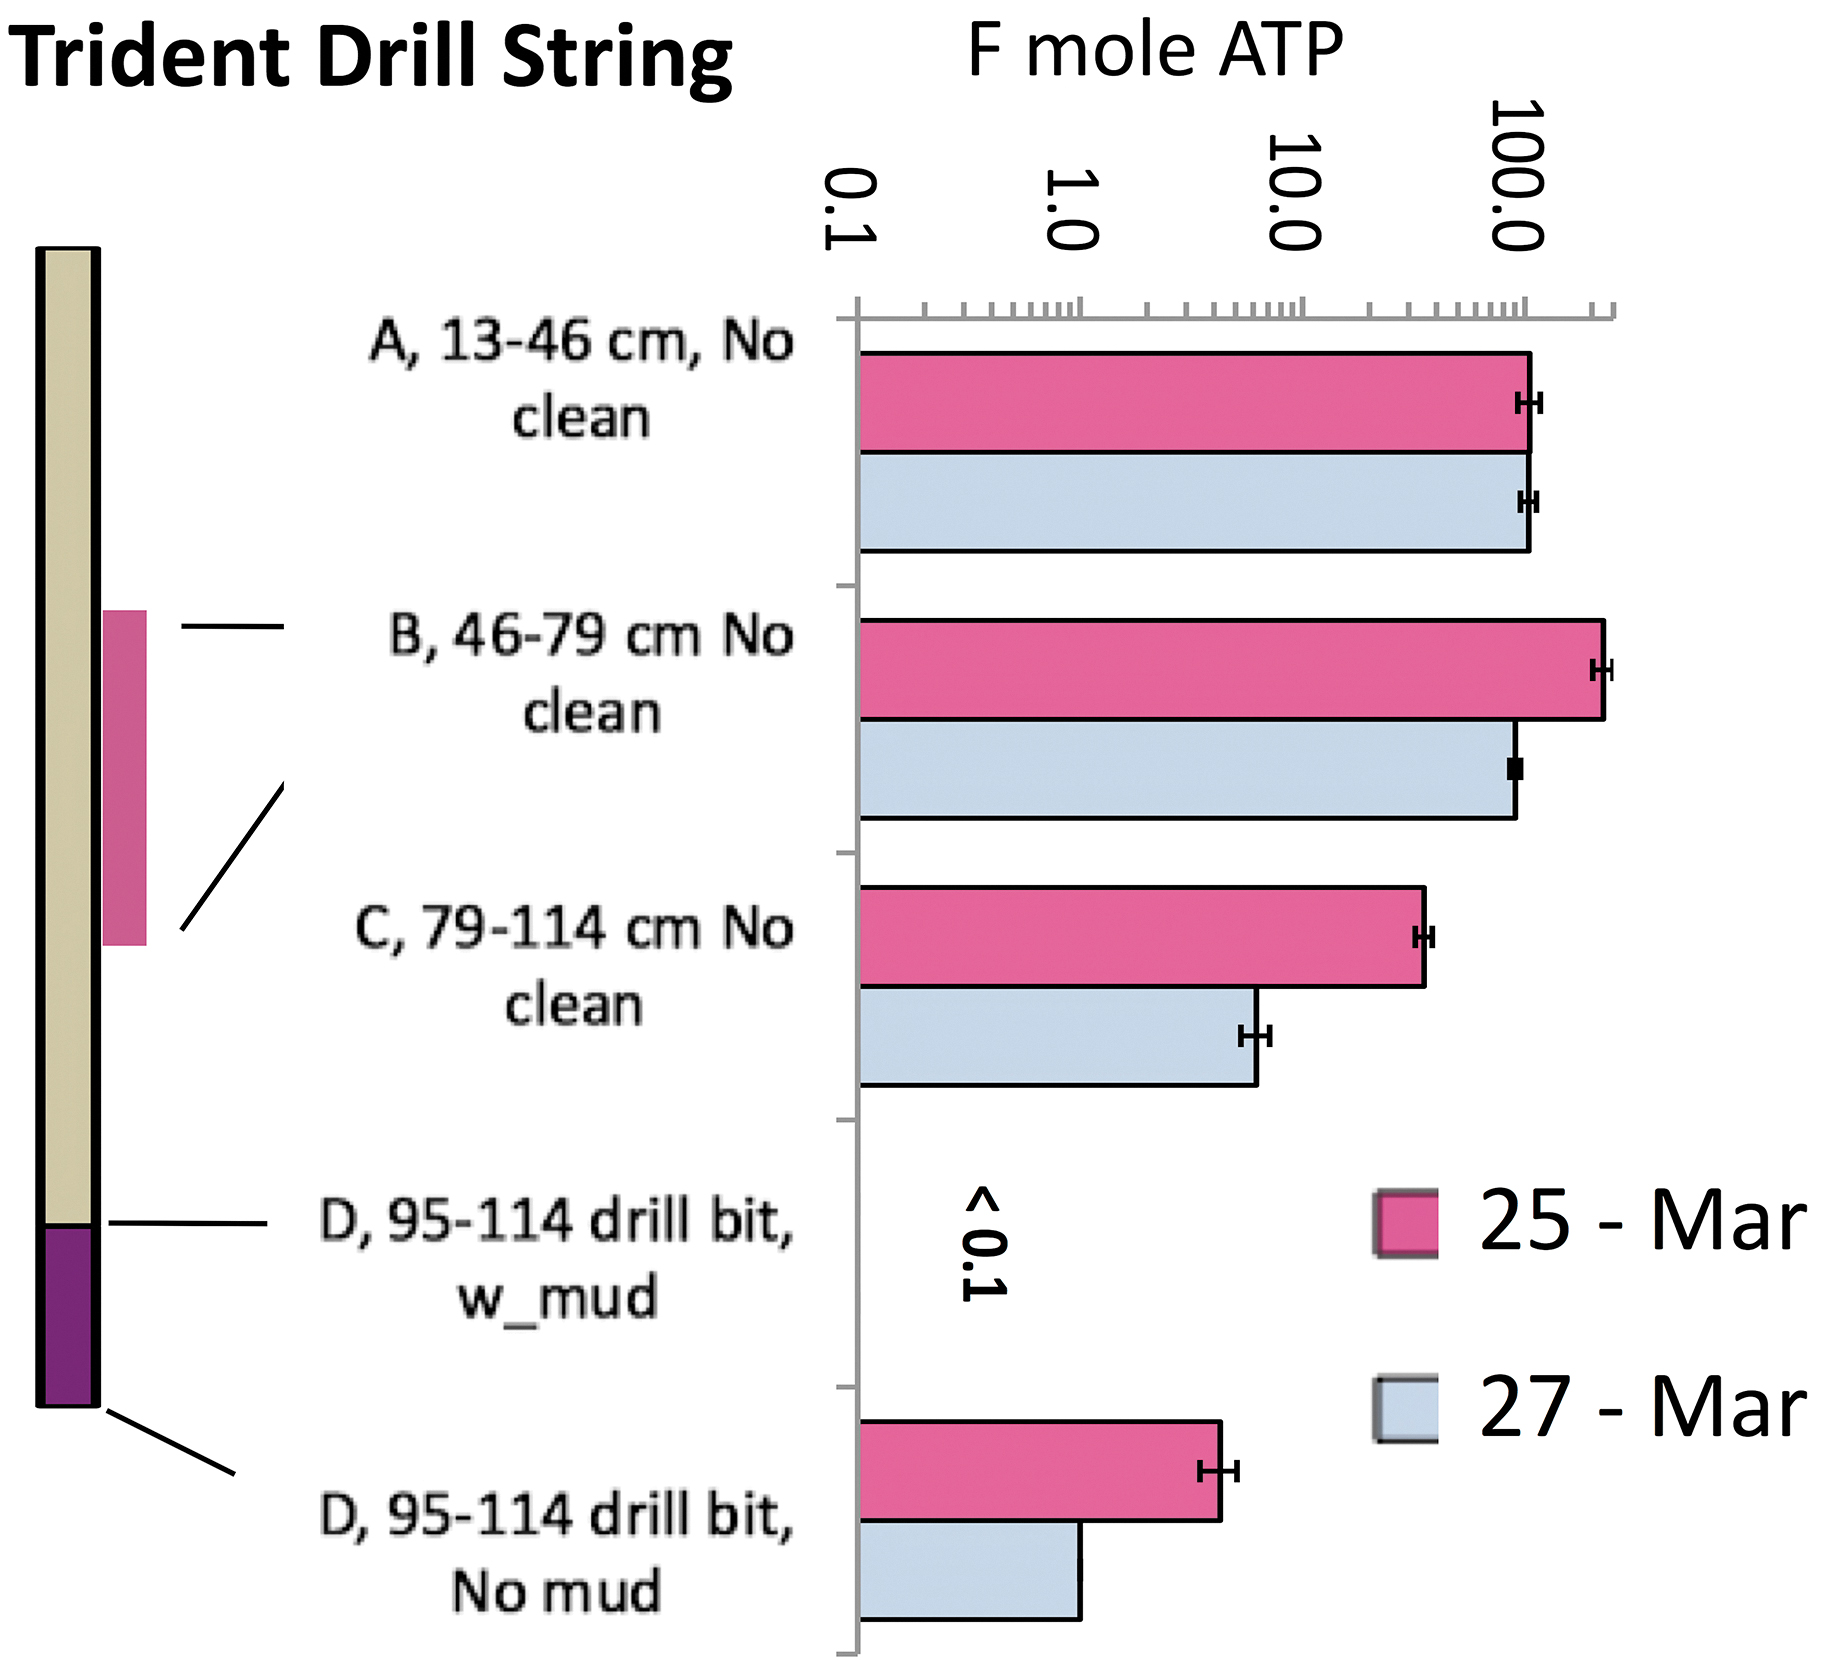
Distribution of unmitigated bioburden developed on the TRIDENT drills and assayed twice (Test 1) with a 3-log variation from the top (13–49 cm) to bottom (drill bit); note the highest bulk ATP of midsection B_46–79 cm (drill's thick purple line). The bottom bars show the drill bit background before (“w_mud”: undetected ATP, <0.1 fmoles) and after water-rinsing (“No mud”: ATP detected).
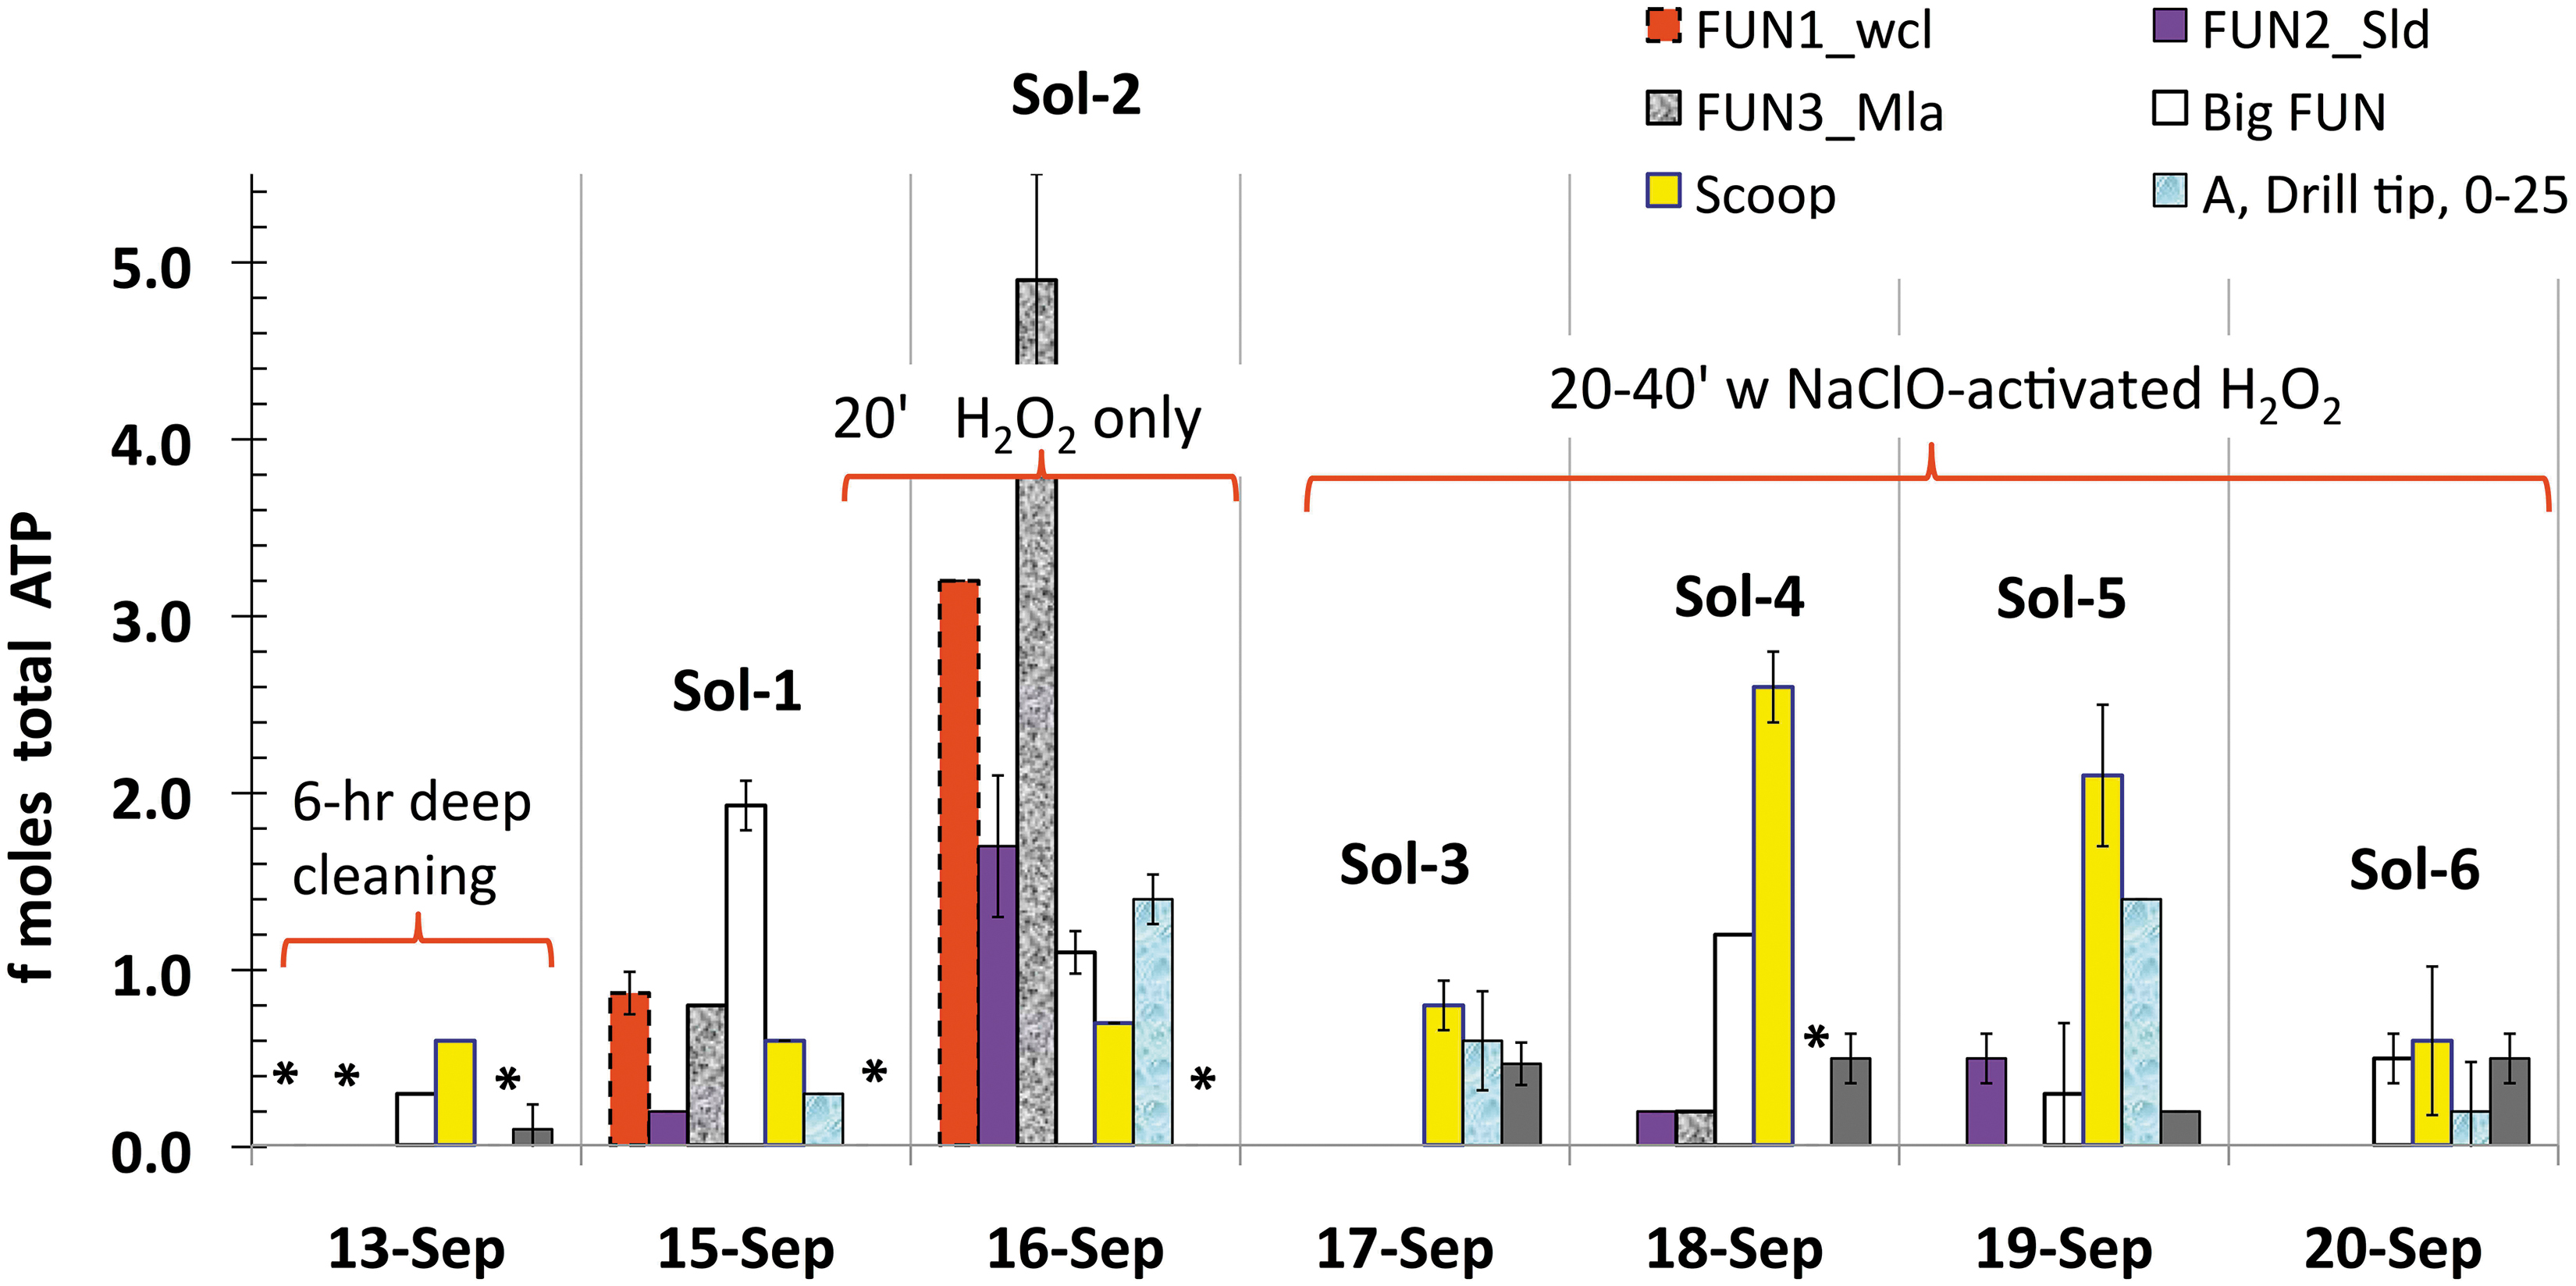
ATP background reduction across the 6-Sol simulation after “touch up” cleaning of ARADS hardware compared with out-of-sim deep-cleaning benchmark values (<0.1–0.7 fmoles) on September 13. Drill, Scoop, and instrument-feeding Funnels: WCL (Fun1_Wcl), SOLID (Fun2_Sld), MILA** (Fun3_Mla), and the multi-purpose funnel (Big_Fun). Asterisks (*) indicate ATP below the LOD <0.1 fmoles. Note Sol-2 highest ATP background values and the background contamination decrease after time augmentation for touch-up cleaning (Sols 3–6). See Sections 4.5 and 5.2 for further explanation. LOD, limit of detection; MILA, Microfluidic Life Analyzer; WCL, Wet Chemistry Laboratory.
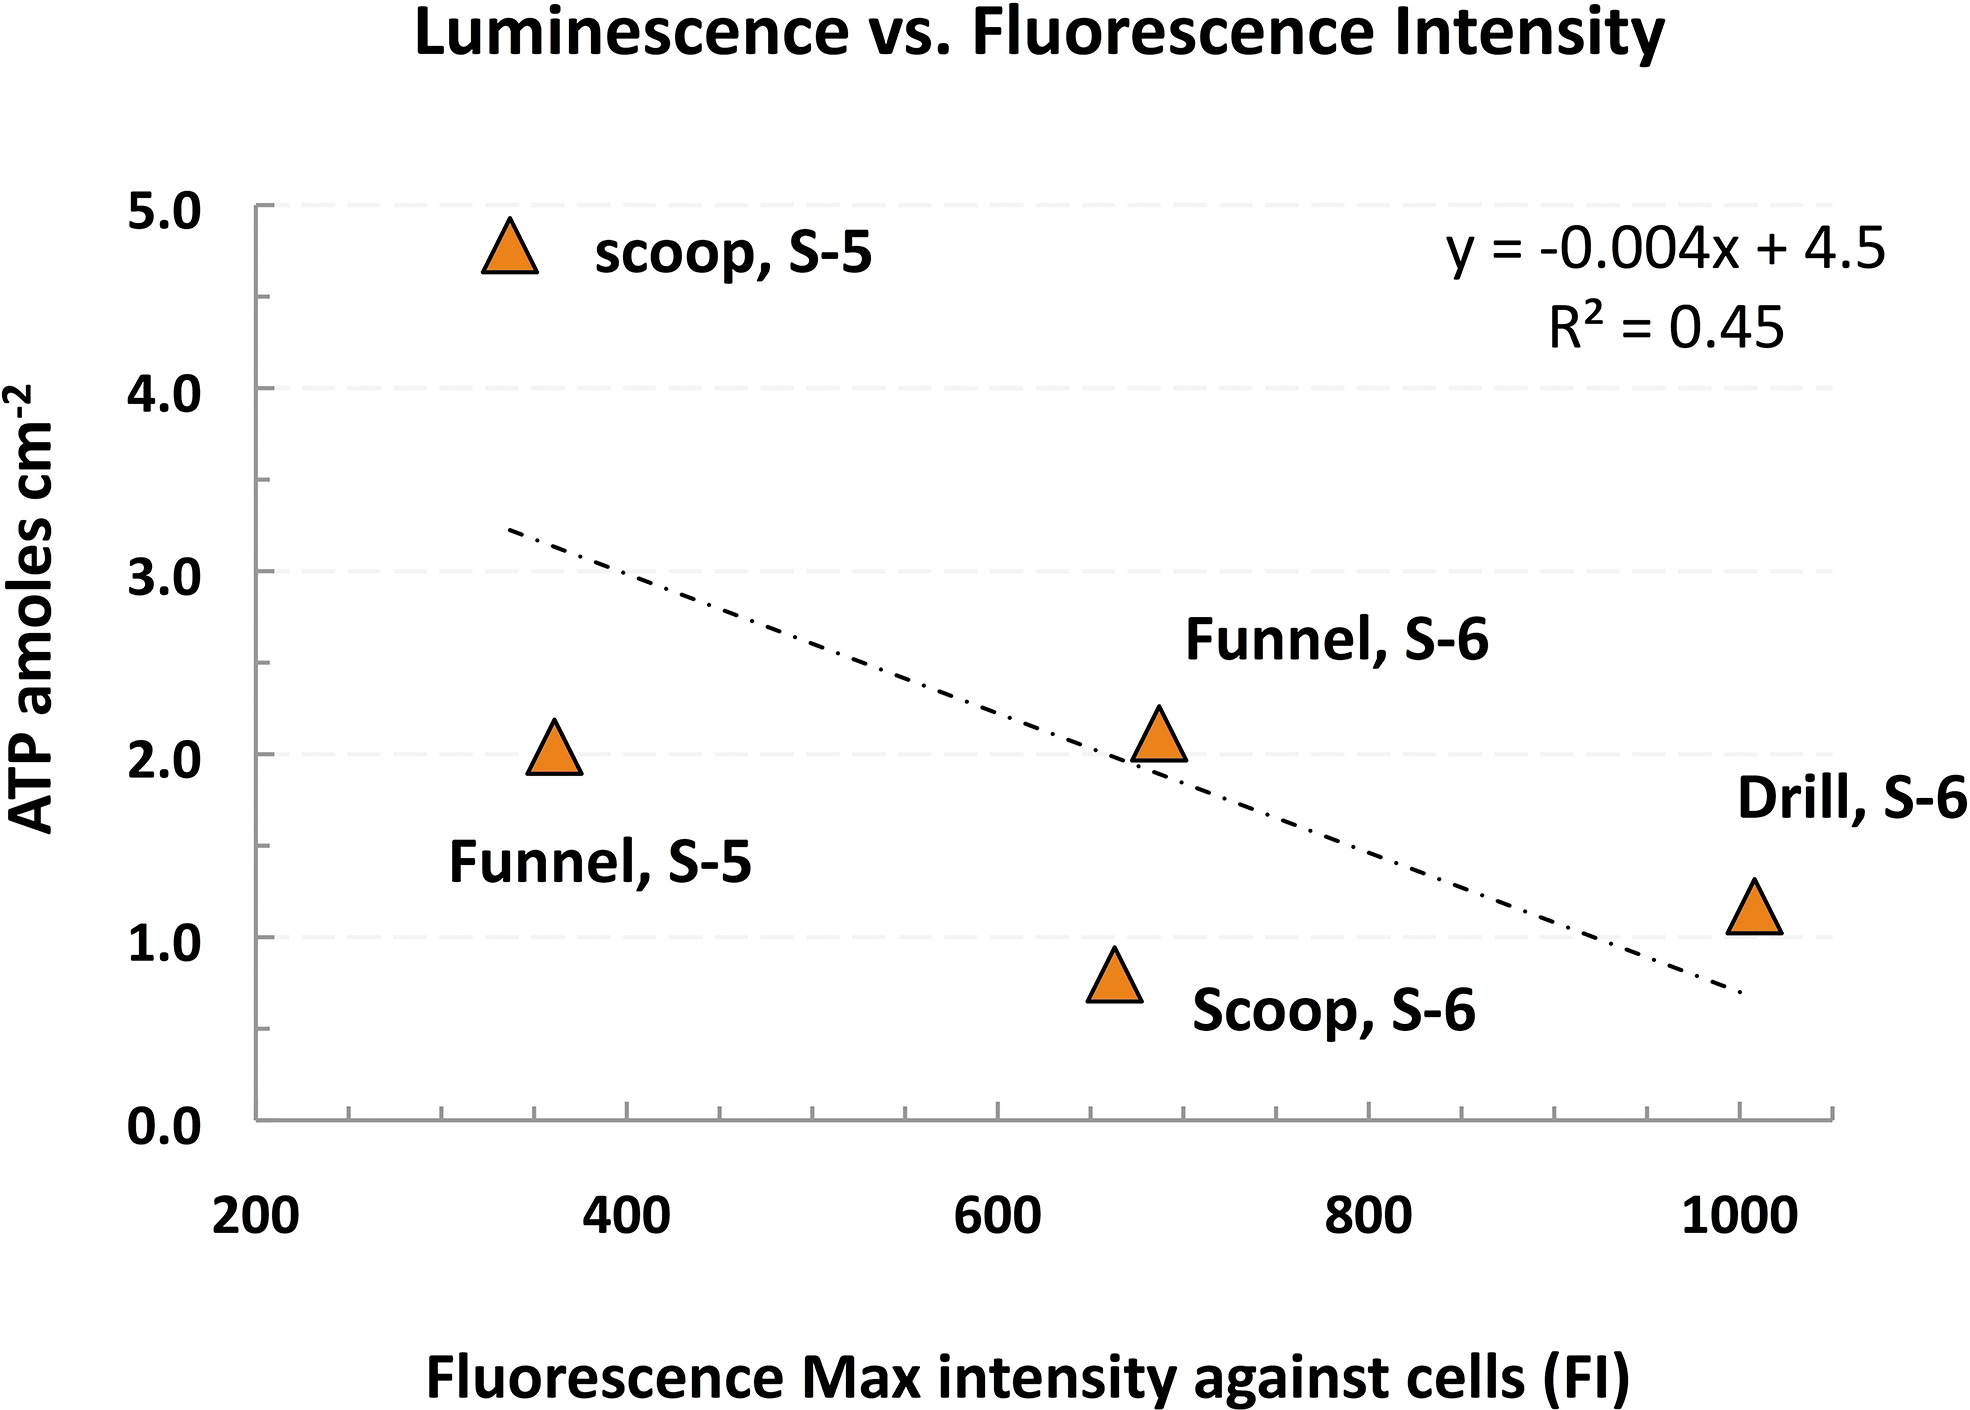
Linear plot with negative correlation (R = −0.673) between post-cleaning surface ATP background (ATP luminescence) and Immunoassay-based microbial taxa background (Fluorescence max intensity) for Sol 5 and Sol 6 hardware. Note the weak signals (FI: <700), except for the drill bit's positive signal (FI >1000), as detailed in Table 7. FI, fluorescence intensity.
Test 1 was performed on the TRIDENT drill string between drilling Honeybee tests on March 25 and 27 (Fig. 4A). Test 1 objective was to determine which segment of the drill string gets more contaminated by direct contact with ungloved hands during drilling; thus, the cleaning effort could be focused on the most contaminated parts. The entire string length was swabbed at 33 cm intervals, including the drill tip segment (19.5 cm). The next day, we repeated the ATP swab test on the same-length segments of TRIDENT drill (See results in Fig. 5).
Deep-cleaning protocols (Tests 2, 3 and 4)
The first deep cleaning (Test 2) preceded the Icebreaker drilling at the Green Parrot (GP) site on March 27 (Fig. 4B). The drill was left exposed overnight at GP and re-assayed on March 28 (Fig. 4C). In September, Test 2 was repeated on the drill string (Test 3) and extended to the scoop and funnels (Test 4) before the 6-Sol simulation.
Touch-up cleaning for Sol1-Sol6 operations
ARADS in-sim operations were time-constrained, with a fraction dedicated to contamination tracking within 25% of the time assigned to field operations—75% of the time used for sample analysis within each Sol. We allocated ∼20–40 min to touch-up cleaning and ATP assay verification of the deep-cleaned rover-mounted drill and scoop (Playa basecamp). Each Sol, we processed the four unclamped (rover-detached) funnels outside the main touch-up cleaning sequence (additional 20–30 min) a few hours prior at the Yungay basecamp.
Due to time constraints, we could ATP assay only the drill tip (0–25 cm) and the 20 cm segment above it. The five-step touch-up cleaning (like the deep cleaning) of the rover-mounted drill (full-length) and scoop involved intense wiping with acetone, Me-OH, and Et-OH (∼5 min), misting/wiping with 70% IPA (3 × ), and DW rinsing ∼3 min. The final disinfection step included dispensing HClO and squirting a few drops of 3% H2O2 (3 × ) onto the bleach-doused hardware to activate the sterilant reagents (e.g., Taewan et al., 2019) until completion of the oxygen-evolving reaction (∼1–2 min).
To prevent cross-interference between the cleaning agents and the ATP assay chemistry, we added several rinsing steps with ATP-free DW (tested daily with ATP liquid sampling devices) between the HClO-H2O2 step and the ATP swab (5 min). After the assay, the hardware was water rinsed again (2 min) and wiped with absolute Et-OH to remove residual lipids from fragmented cell membranes and ATP buffer residues. Ten minutes were necessary for processing the reachable surfaces inside the scoop and its blade.
We customized the protocol to meet specific requirements. For instance, to avoid the potential breakdown of putative amino acids (AA) entering the PISCES instrument analysis (pers. communication, R. Quinn, 2019), we discontinued the HClO-H2O2 step to the instrument-dedicated funnel (Sol 2) or the scoop (on Sols 4–5). In-sim ATP background reduction results are in Section 5.2 (Fig. 7 and Tables 4–7).
Airborne biomass flux contaminant setup
We deployed two flat surface collectors (Fig. 9A) to determine the contributed airborne contaminants during the 6-Sol drilling simulation. The first collector (Collector 1) was at basecamp ca. 10 m away from the science trailer's door outside, close to our power generator (Site 1 Lat. 24°6′5.48″S; Long. 70°8′26.85″W). Basecamp was the most frequented area by the field team. Thus, Site 1 was the ideal monitoring location to determining the daily flux of airborne anthropogenic contamination.
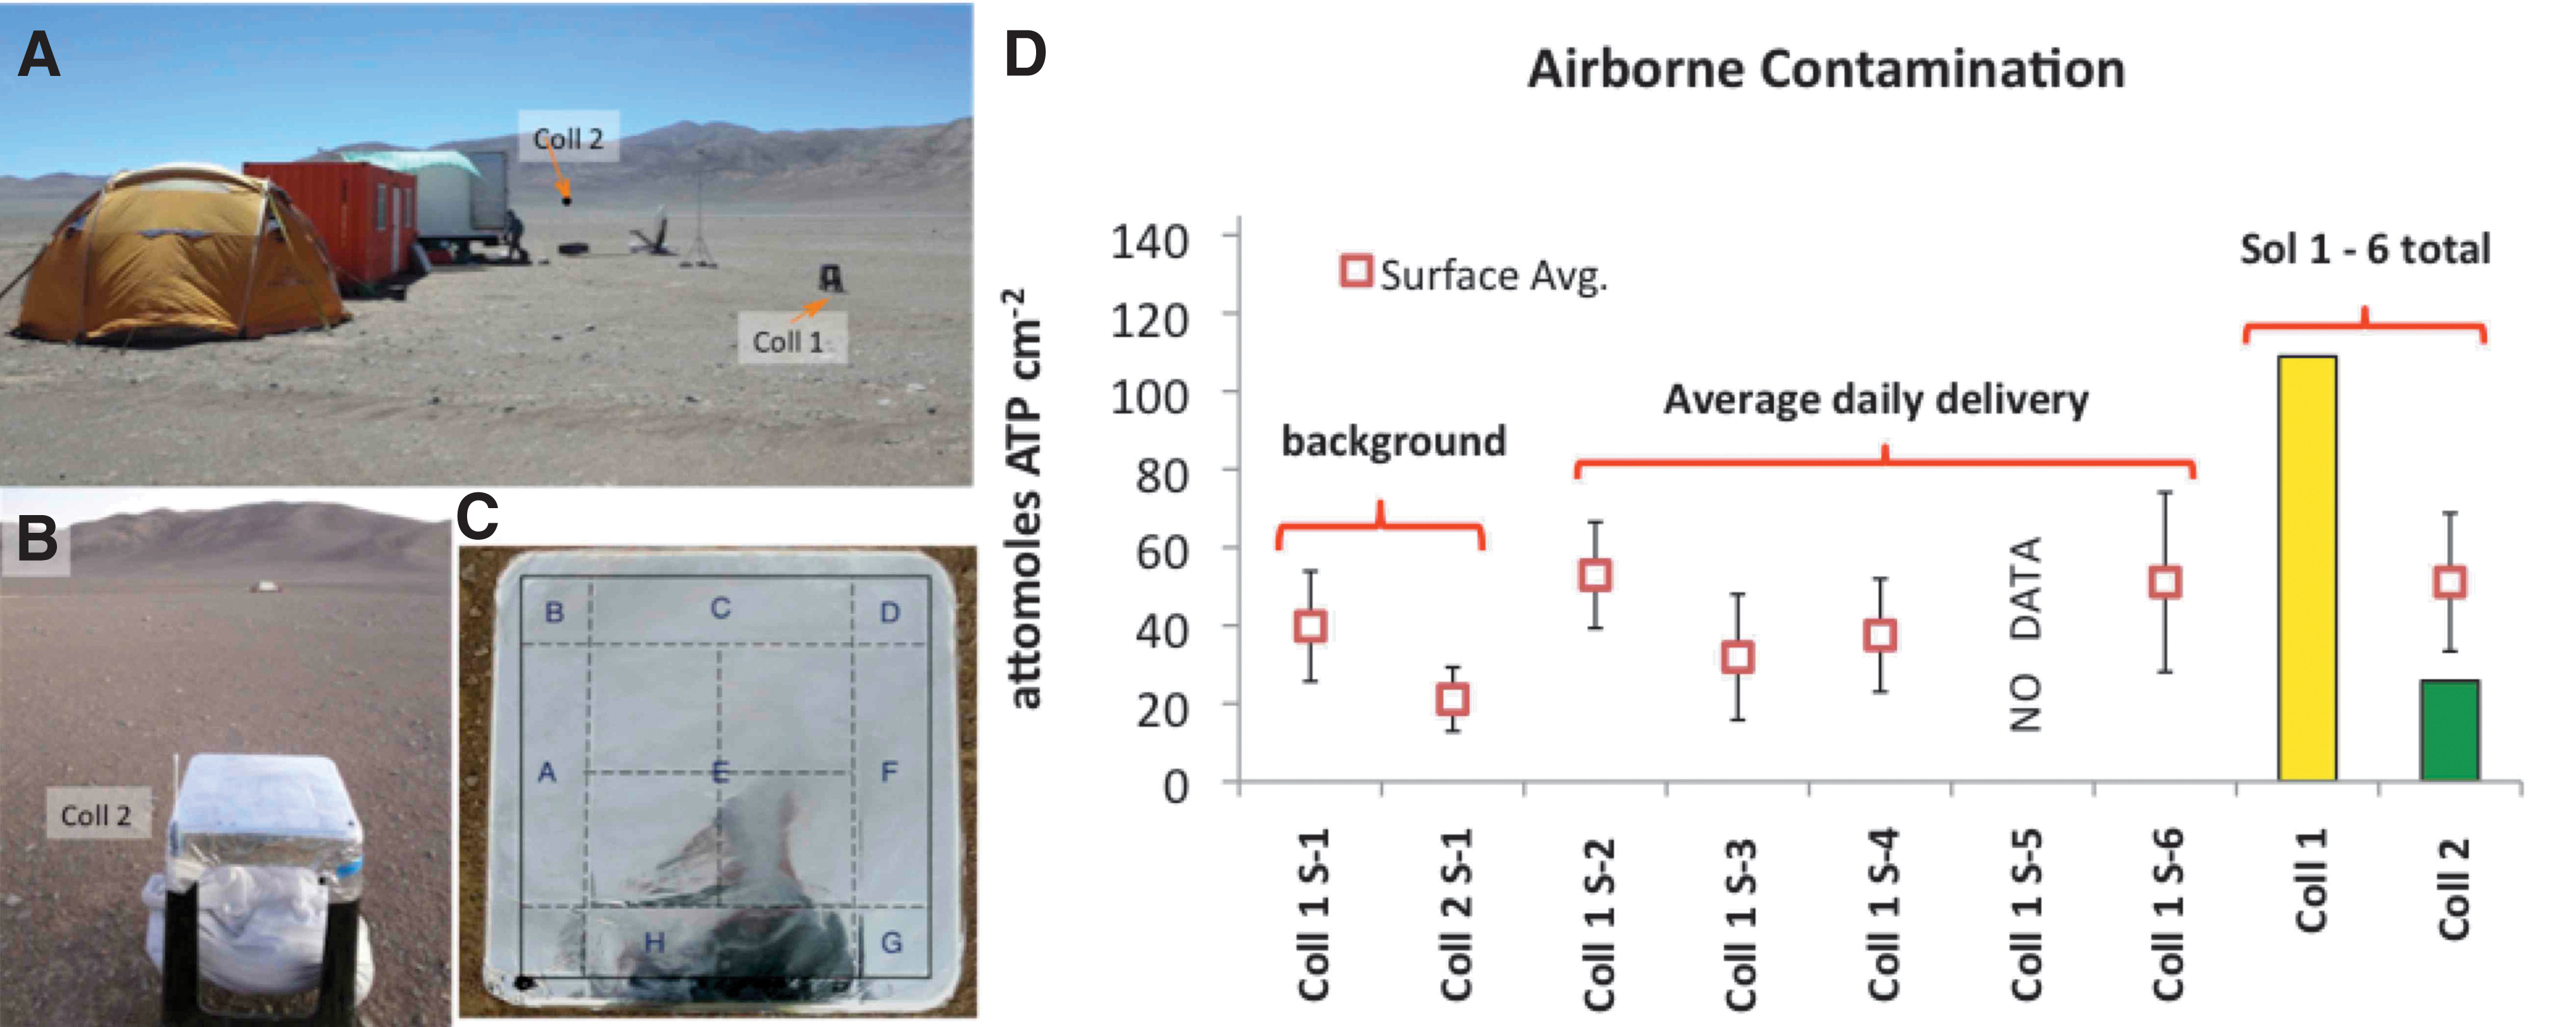
We assayed Collector 1 (Coll. 1) from Sol 1 (for Background) to Sol 4 and on Sol 6. To assess the flux of airborne environmental (natural) contaminants, we deployed the second collector (Collector 2) ca. 250 m upwind from basecamp (Site 2: Lat. 24°5′57.29″S; Long. 70°8′27.05″W). Thus, Collector 2 (Coll. 2) was proximal to one of the alluvial fans (facing the playa) and far away from the highway (Fig. 9B). We took Coll. 2 ATP samples only on the first (Sol 1) and last (Sol 6) simulation days (Table 3).
Timeline of Airborne Biomass Flux Measurement
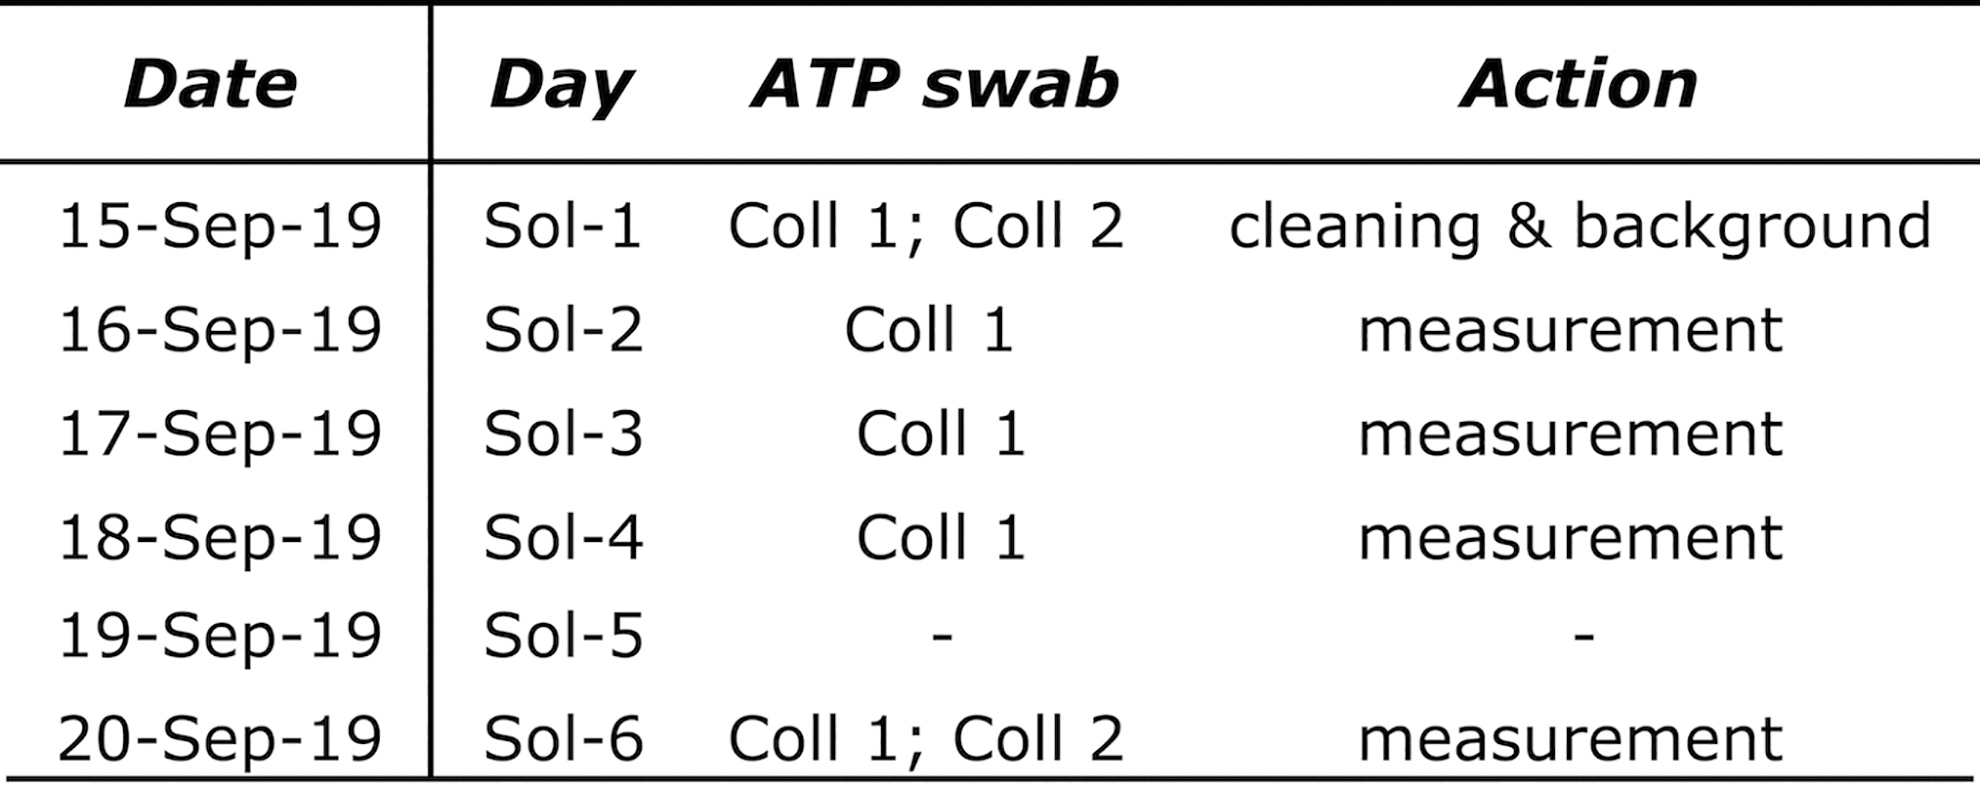
Both collectors were ca. 80 cm above the ground and received wind-carried dust from the Playa or other sources. In addition, an air sampler (a swab) for each collector gathered air particles during the 6-Sol mission. We analyzed the dust swabbed from both collectors with the ATP assay and the air sampler swabs with the immunoassay using the same swabbing methods (e.g., Forsyth, 2016) for hardware cleaning verification.
The collectors consisted of plastic stools covered with 23 × 23 cm heavy-duty pre-cleaned UHV Al foil, subdivided into identical sectors labeled #A through #E (Fig. 9C) for comparison between the two sites. The two collectors' surfaces were chemically disinfected, deployed, and their surfaces were touch-up cleaned again before determining their background.
The flat surfaces were left exposed to receive airborne particles during the simulation and swabbed for collecting ATP at the end of each Sol and infer the total airborne microbial/cellular biomass. Section 5.3 reports the experimental setups (Fig. 9B and Table 8) and derived results (Fig. 9A–D).
In this study, we assessed the biomass of drilled versus playa surface sediments as a positive control for potential contamination transfer of exogenous biomass to the cored material (see results in Fig. 12).
Collection and sub-sampling
Drilled material from the GP and Playa sites was initially stored in clean borosilicate jars, sub-sampled with pre-sterilized stainless-steel spatulas (oven-baked at >550°C for 24 h) and wiped with Et-OH immediately before use. For determining the microbial ATP biomarker in core samples (co-analyzed by SOLID), a sub-aliquot was transferred into sterile 50 mL polypropylene centrifuge tubes from the glass jars. Playa's surface samples were collected from four 10 m spaced spots with clean spatulas.
The four pooled samples, representative of ca.100 m2 desert surface, were mixed in Whirl-Pak Sterile Sampling Bags (Nasco) to obtain homogeneous sub-aliquots (secondary samples) and transferred into sterile 50 mL tubes for ATP Luminometry analysis.
To measure the microbial ATP, we processed 1–30 g of sediment using matrix-specific protocols described elsewhere (Bonaccorsi et al., 2010; Cockell et al., 2018; Pandey et al., 2019) and in Supplementary Information Fig. S2A–E and Table S3.
Microbial biomass estimation
The concentration of ATP biomarker is translated into semi-quantitative total biomass using the microbial ATP biomarker data and known concentrations of ATP cellular equivalent. We estimated the minimum and maximum total cell abundance based on the ATP cellular equivalent values of 4 × 10⁻¹⁷ (Egeberg, 2000) and 2 × 10⁻¹⁹ g ATP per microbial cell across various microbial ecosystems (Shama and Malik, 2013; and references therein).
Powers et al. (2018) applied the same values to soil collected in the Yungay region. The average content of a typical bacterial cell is 1–2 attomoles, or amole (10−18 moles), well within the sensitivity of modern bioluminometric detectors (e.g., Okanojo et al., 2017; and references therein) −1.6 to 3.3 amoles/CFU in Staphylococcus aureus and Escherichia coli, respectively, while Eukarya cells (yeast, animals, and plants) contain up to 100–10,000 times more intracellular ATP, that is, 0.1–10 fmoles, or 10−15 moles (Lundin et al., 1986; Stanley, 1986).
Results
Out-of-sim deep-cleaning experiments
Results of out-of-sim experiments on the two drills (Tests 2–3) and the sample transfer hardware (Tests 4) are summarized next.
Unmitigated bioburden (Test 1)
Figure 5 shows the most handled (ungloved hands) and contaminated surface of the mounted TRIDENT drill string (Fig. 4A) is mid-section 46–79 cm with the highest pre-cleaning ATP levels (35–225 fmoles of ATP), a repeatable outcome. From the drill top (13–49 cm) to its bottom (95–114 cm, drill bit), the bioburden drops from >100 to <0.1 fmoles (a 3-log reduction). As an example of a false negative, we initially concluded that bioburden was removed (self-cleaned) by heat and friction generated during drilling (no ATP recovery, <0.1 fmoles), overlooking the true drill bit bioburden (1–10 fmoles ATP). However, we positively detected ATP after removing the clay particles from the drill's rough surface by wire brushing and water rinsing.
Effectiveness of microbial reduction protocols (Tests 2–4)
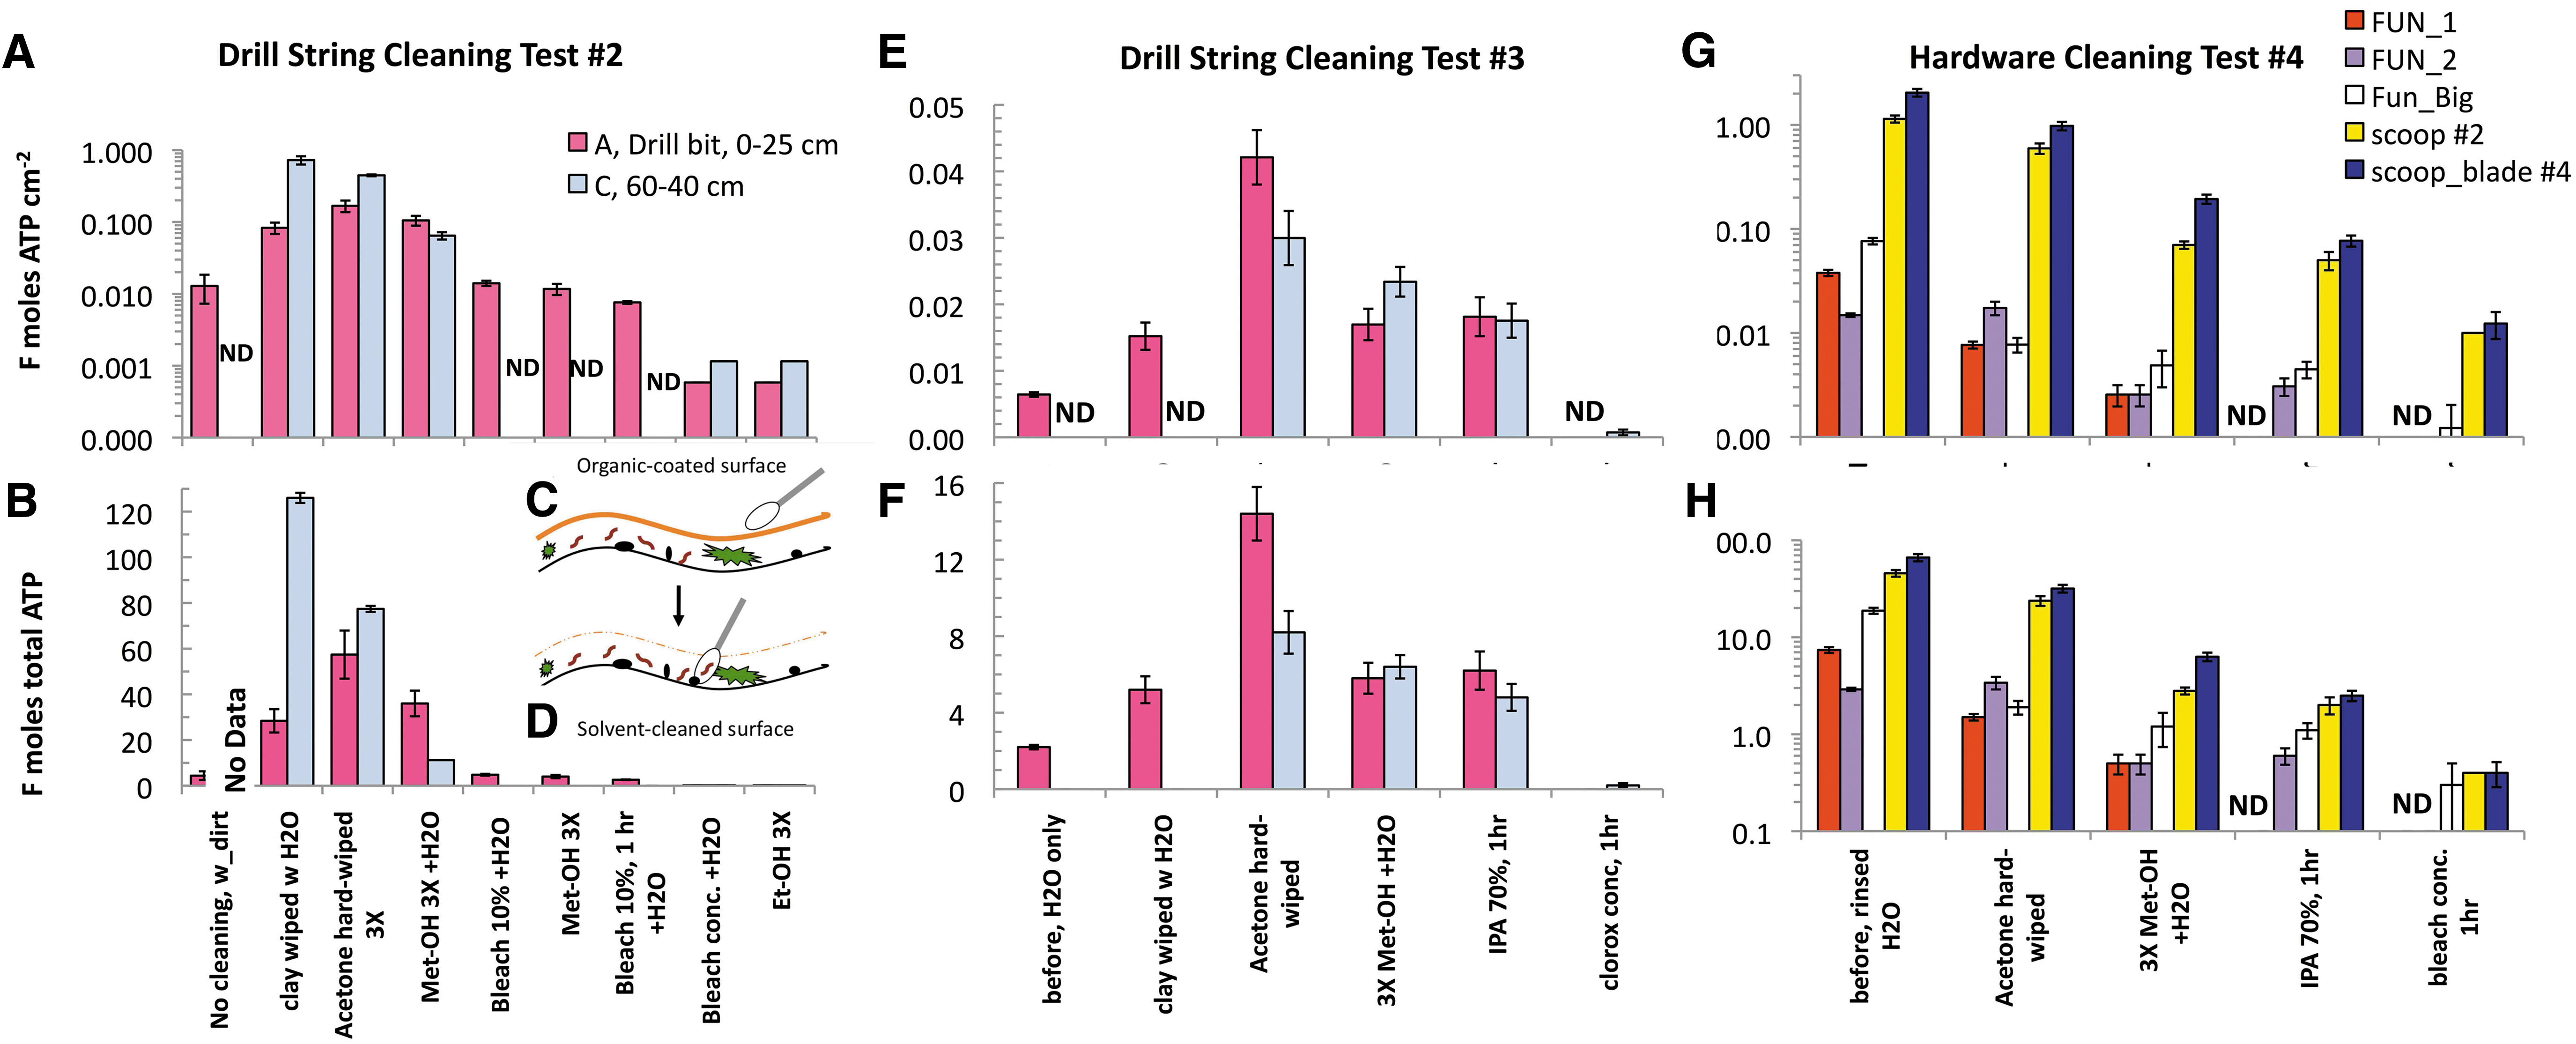
These tests aimed at establishing a touch-up cleaning protocol for aseptic drilling and sample handling for the 6-Sol simulation. After repeated cleaning cycles and up to 3 h of chemical exposure, four of the nine steps were ineffective for microbial reduction (Fig. 6A, B). Hence, we incorporated only the most effective five cleaning steps (Fig. 6G, H) into the 40-min touch-up cleaning protocol for the 6-Sol simulation (Fig. 7). See Supplementary Table S4A–C in the Supplementary Information on the data obtained after applying the nine-, six-, and five-step protocols.
Deep-cleaning test results (Tests 2–4) demonstrated enhanced detection of microbial reduction (thus enabling effective disinfection) by mechanical and chemical removal of organic material from the ARADS hardware (Fig. 6A–G).
- After the mechanical removal of clay particles from the drill bit, the detection of ATP increased from 4 to 28 fmoles in Test 2 and doubled (2–5 fmoles) in Test 3. The improved detection did not concern smoother surfaces of the drill sting such as segments B and C (see Fig. 6A, B, D, E “clay wiped w/H2O,” first data from left) or the scoop and funnels (Fig. 6G, H).
The acetone-wiping step was critical for bioburden detection, doubling the drill tip ATP recovery (28–57 fmoles) with a 2-log increase (0.01–1.0 fmoles ATP/cm2) in Test 2 and increasing by 60% and >90% in the drill tip and drill body segment B (<0.1–8.2 fmoles ATP), with a sevenfold (0.006–0.042 fmoles ATP/cm2) for Test 3, respectively. The acetone wipes (white wipe test) revealed a substantial presence of colored organic films (Fig. 6C, D), requiring over 40 min of wiping the drill until the wipe was white and the entire drill string was shiny. Still, the bioburden background increased to its maximum.
Only after the Me-OH-step, the ATP recovery began to decrease, ca. −40% and −66% for drill tip and segment C, respectively (Test 2), and ca. 55% and 15%, respectively (Test 3). The Me-OH step was preparatory for further disinfection steps.
After the 1 h 0.5% bleach-step, drill bit ATP dropped almost eightfold (36–4.8 fmoles total ATP). However, multi-step disinfection cycles (alternating Me-OH, 10% bleach, and water rinses) could not further reduce ATP background below 4.8–2.6 fmoles.
Only after 1 h 5% bleach-step, we removed the most resilient bioburden to ultra-low levels, for example, ≤0.1–0.2 fmoles ATP (Test 2) consistently with Test 3 and Test 4, resulting in a 4-log linear reduction of background (∼1.0 to <0.001 fmoles ATP/cm2) across the five-step protocol we adopted for the scoop and funnels (Test 4 in Fig. 6G, H). We used the ≤0.1–0.2 fmoles ATP (compared with ATP-free blank water (negative control)) as a benchmark value of effectiveness of microbial reduction for the ARADS hardware across the 6-Sol simulation. Results of Tests 2, 3, and 4 are illustrated in Fig. 6A, B, and E–H.
Our tests suggest the following:
Overall, ATP recovery was less efficient on rough than smooth surface finishing: (i) the drill tip versus distal segments, (ii) the scoop blade versus scoop interior, and (iii) the large funnel versus the small ones, thus impacting the efficiency of contamination control.
Bioburden buildup under unmitigated warehouse conditions. The Icebreaker drill pre-cleaning (unmitigated) bioburden assessed in March 2019 was 4–16 times higher (0.17–0.73 fmoles/cm2) and harder to remove than the unmitigated bioburden in September, that is, (0.042–0.047 fmoles/cm2). The more resilient bioburden likely developed under unmitigated warehouse conditions ∼1 year after the last cleaning of the drill (during ARADS 2018); a thinner biofilm formed over the shorter storage (6 months) after our previous drill deep cleaning in March 2019, thus informing how much bioburden is initially present and how long it took to build it up.
Based on the earlier cited data, an effective bioburden reduction depends on (i) the amount, complexity, and development time of preexisting bioburden and biofilms (the microbes type, abundance, and resistance), (ii) their surface distribution across the hardware topography (roughness, porosity), and (iii) concentration, time, and temperature exposure to disinfecting chemicals (Rutala et al., 2019). See Fig. 6 source data (Supplementary Table S4A–C in the Supplementary Information).
6-Sol simulation contamination control effectiveness
The combined ATP recovery and intensity fluorescence signal pertained to viable biomass, individual microbial taxa, and macromolecular cellular residues (such as protein biomarkers) detected in the post-cleaned sampling hardware (Fig. 8 and Tables 6 and 7). Together, they certify the efficiency of the five-step “touch-up” cleaning workflow across the 6-Sol simulation.
Data are presented in two ways: (1) Total ATP hardware background of the surface at contact with the sample (Fig. 7 and Table 4) informing on (bulk) contamination risk (drill to scoop to funnel) into sample analysis (or drilled subsurface). (2) ATP background, as microbial contamination equivalent per surface unit, to compare decontamination of hardware elements across the six Sols (Table 5).
Summary Statistics of Out-of-Sim (6 H) Versus In-Sim (20–40 Min) Cleaning Protocols for the Same Hardware Elements, For Example, Scoop (Rows)
Summary Statistics of Out-of-Sim (6 H) Versus In-Sim (20–40 Min) Cleaning Protocols for the Same Hardware Elements, For Example, Scoop (Rows)
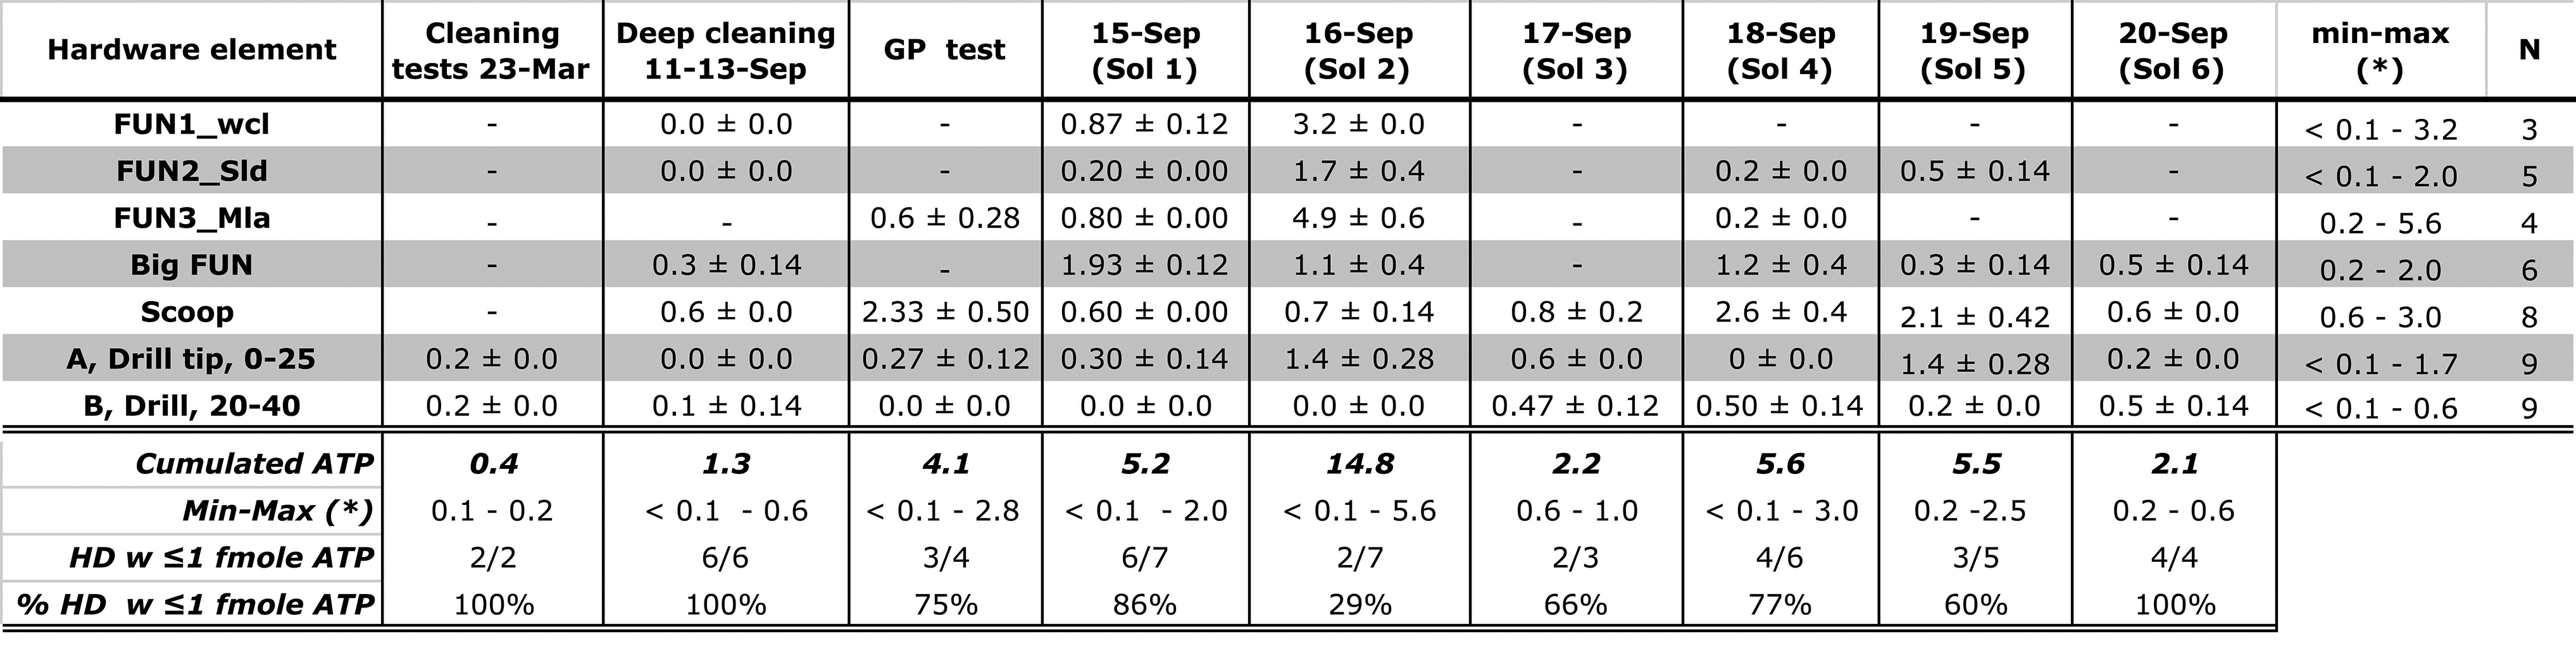
Values in columns refer to bulk contamination (“Cumulated ATP”) from the HD elements used in each Sol (not all HD elements used). The last two rows (bottom) report the percentage of total HD elements (N) with ATP background below 1 fmoles. (*): “0” indicate values below 0.1 fmoles ATP.
ATP = adenosine triphosphate; Avg. = average; GP = Green Parrot; HD = hardware; Min-max = minimum and maximum values; STD = standard deviation.
Hardware Adenosine Triphosphate Background Translated into Equivalent Microbial Contaminant, Adenosine Triphosphate Attomoles (10−3 fentomoles)/cm−2, Given 1 Amole Adenosine Triphosphate ∼1 Bacterial Cell
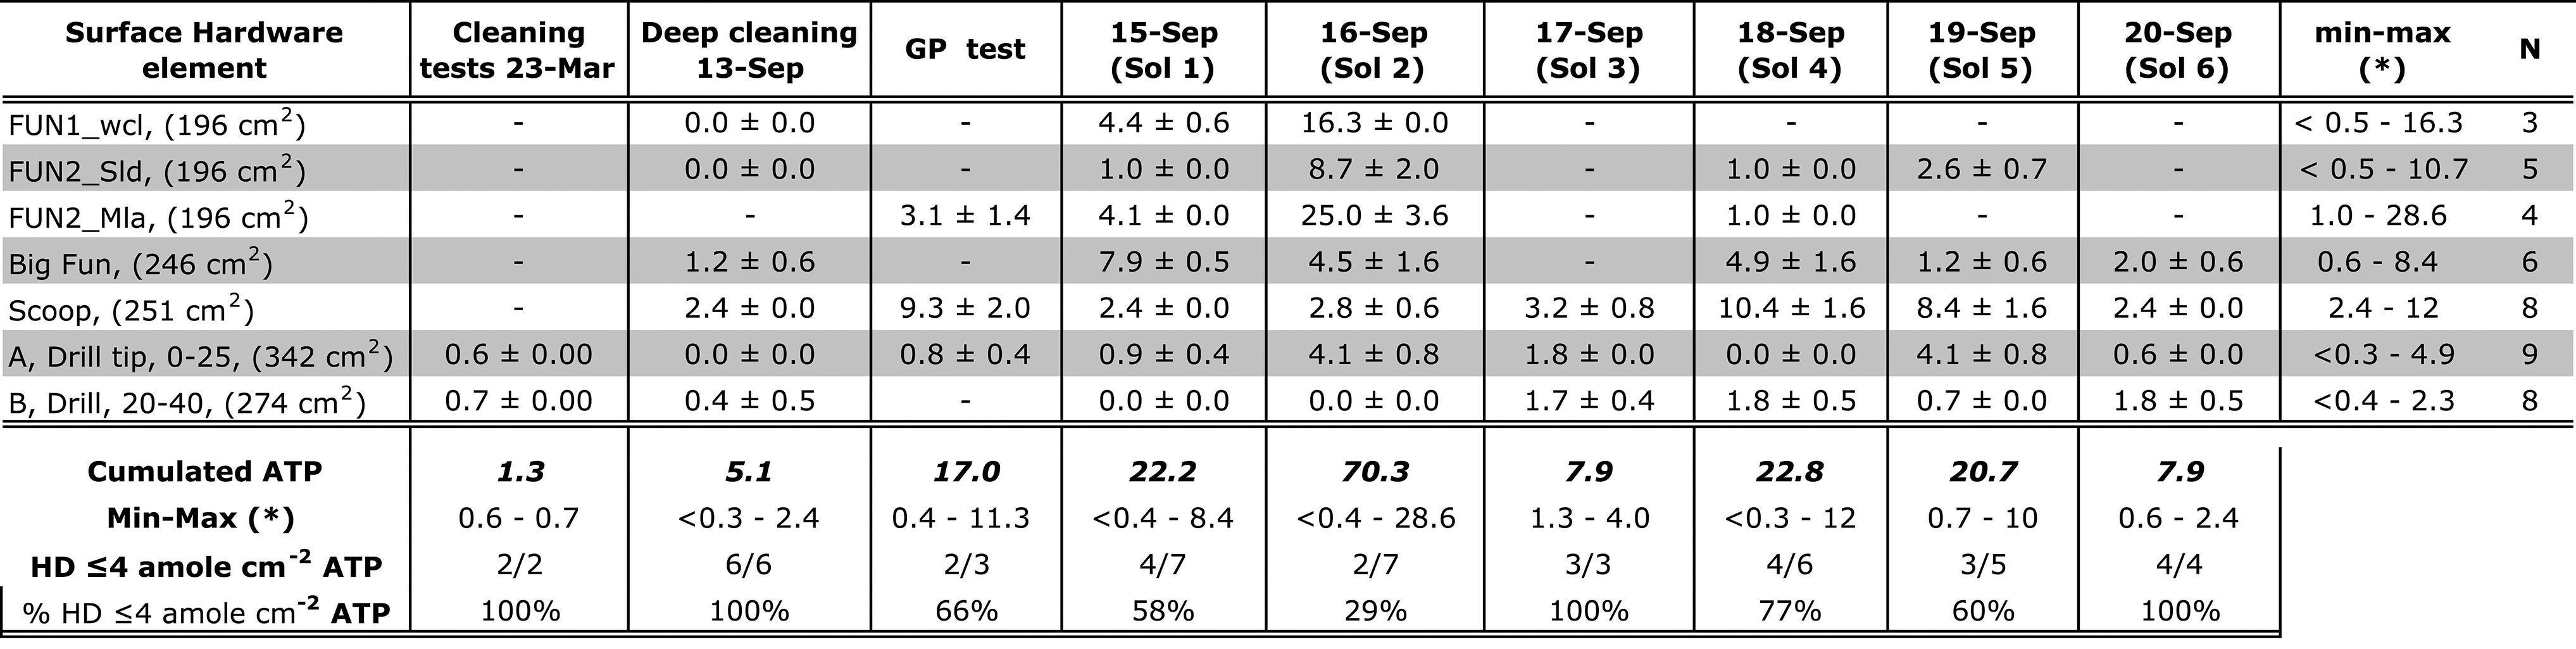
See also Table 4 caption.
Figure 7 compares bioburden reduction across the 6-Sol simulation after hardware “touch up” cleaning with deep-cleaning benchmark values from <0.1 fmoles (funnels and drill) to 0.6 ± 0.0 fmoles (scoop) for the same hardware.
Eighty-six percent of Sol 1 hardware bioburden background was below the 1 fmole ATP threshold. On Sol 2, we recovered the highest level of ATP (25 ± 3.6 attomoles/cm2) from the MILA funnel (Table 5) due to insufficient microbial reduction time and the exclusion of the bleach step from its customized protocol. On Sol 2, only 29% of the background was <1 fmole ATP with a cumulated contamination risk of 14.8 fmoles ATP, combined from the funnel (4.9 ± 0.6 fmoles), scoop (0.7 ± 0.14 fmoles), and drill bit (1.4 ± 0.28 fmoles ATP), contributing to the highest risk for Sol 2.
These background values warranted contamination risk mitigation. Hence, following the lesson learned during Sol 2, we modified the protocol in two ways: (1) decontamination time augmentation of 20–40 min; (2) routine application of two chemicals (NaClO-activated H2O2) synergistically. These corrective measures resulted in more rapid and effective hardware disinfection—down to deep-cleaning benchmark values—from Sol 3 through Sol 6.
The most effective mitigation was accomplished on Sol 3 (66% <1 fmole) and Sol 6 (100% hardware background <0.6 fmoles), whereas on Sol 4 and Sol 5, 77% and 60% of the background yielded <1 fmole ATP, respectively (excepting the scoop). The in-sim bulk ATP background (combined for all hardware) was 2.1–14.8 fmoles ATP compared with deep cleaning, that is, 0.4–1.3 fmoles ATP (Table 4).
Contamination reduction by hardware type
The most effective microbial reduction (lowest background) occurred for the drill string segment 20–40 cm (<0.1–0.6 fmoles ATP) in five out of eight cases, followed by the drill's tip (segment 0–25 cm, <0.1–1.6 fmoles ATP), reaching near-zero levels in four out of nine cases (Table 4). Instead, the scoop (0.6–3 fmoles ATP) proved difficult to access and clean.
Finally, the multi-purpose funnel yielded lower values (0.4–2 fmoles ATP) compared with one of the instruments' funnels (up to 2–5.6 fmoles ATP background) against the “zero” background benchmark value. Due to programmatic factors, we obtained immunograms only for hardware co-analyzed for ATP on September 19 (Sol 5) and September 20 (Sol 6). The summary results for the other molecular contaminants are provided in Table 7. See Supplementary Information on the whole data set.
Hardware background immunoassay analysis
Tables 6 and 7 report the results of the swabs solvent extract analyzed with the LDChip200 immunosensor for broader characterization of the Sol 5 and Sol 6 hardware background residue (ATP synthase and cellular protein biomarkers). The full dataset and immunogens' intensity peaks are provided in Supplementary Information Fig. S1, Table S2a and S2b.
Fluorescence Versus Luminescence Intensity Signal Values Detected in Hardware and Airborne Dust Samples Co-Analyzed for Swab Assays
Fluorescence Versus Luminescence Intensity Signal Values Detected in Hardware and Airborne Dust Samples Co-Analyzed for Swab Assays
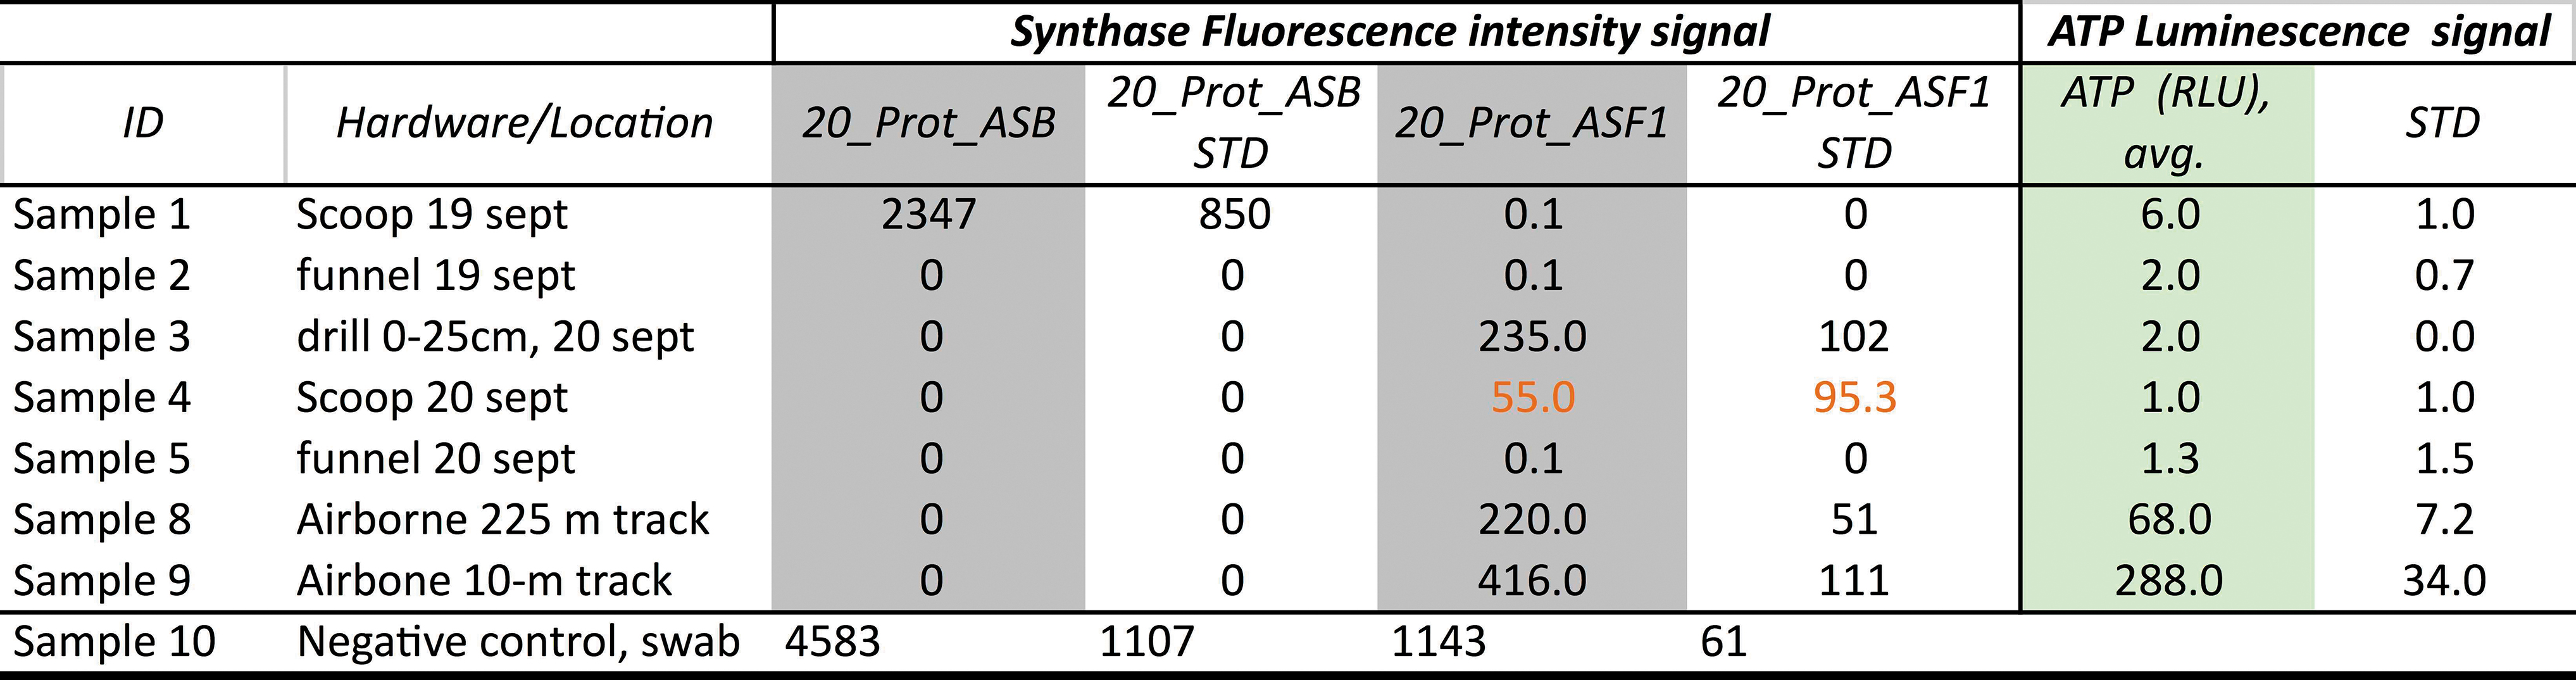
Columns in gray are values obtained after background subtraction using a negative control swab (Sample 10). High RLU corresponds to a high signal for the ATP synthase protein, whereas low RLU corresponds to negative detection. STD (N = 3) for each antigen-antibody pair's FI. Red numbers: two out of three replicates yielding 0 FI.
ASB = ATP synthase subunit 1; ASF1 = ATP synthase subunit 2; FI = fluorescence intensity; RLU = relative luminosity unit.
Post-Cleaning Microbial Cells and Protein Biomarkers Detected by the LDChip_200 in the Hardware Background and Co-Analyzed for Adenosine Triphosphate Biomarker by Adenosine Triphosphate Luminometry (Thick-Bordered Columns)
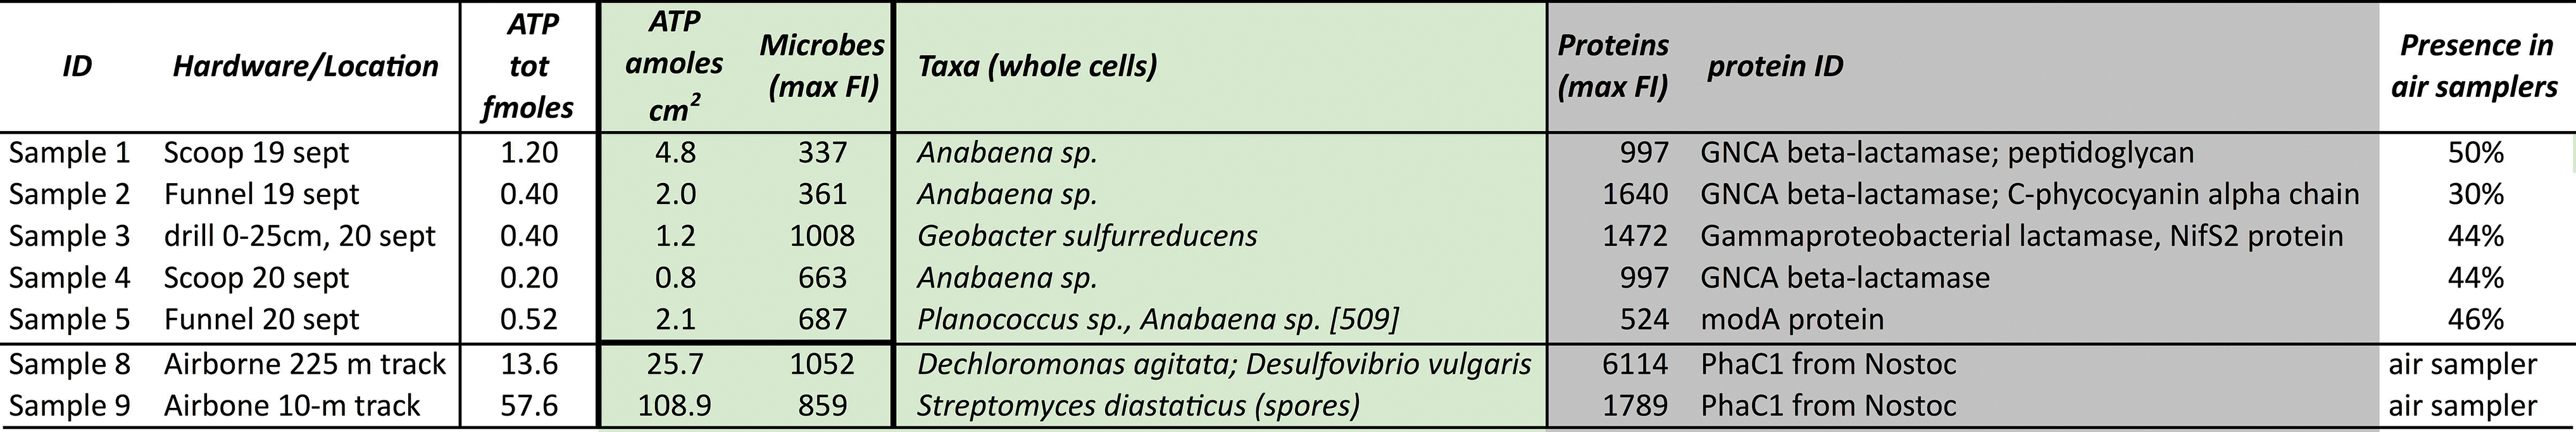
From left to right: total ATP swab Assay of in-sim cleaned HD; ATP per surface unit; maximum value of FI (peak) against microbial taxa (whole cell) and molecular biomarkers (proteins). “Presence in air samplers” indicates the fraction (%) of microbial taxa and protein biomarkers detected in one or both airborne samplers and the HD background. We calculated the percent of molecular biomarkers in air samplers from the antibodies raised against whole cells, proteins, biofilms, and sediment mixture cultures in the HD residue (Supplementary Table S2a and S2b) and those detected in the two air samplers (Table 9).
GNCA = gram-negative bacteria ancestral beta lactamase.
We could perform only one sample extraction and concentrate the volume to improve detection. In our experience, no differences in fluorescence values resulted when using the same extract twice. Error bars correspond to the standard deviations of three internal replicates of each antibody array we tested.
ATP synthase subunit 1 (ASB and 20_prot ASF1 [ATP synthase subunit 2]) is a protein that forms the intracellular energy storage molecule ATP in the mitochondria. We detected ATP synthase in all hardware surfaces co-analyzed with the ATP Luminomety Assay (Table 6). Although the signal in the blank swab (negative control) was high, after subtracting the negative control, the immunoassay yielded near-zero FI signals for ATP synthase (20_prot ASF1) in the scoop and drill (September 20 assay).
The only FI signal for the protein's other subunit ASB (FI: 2347 ± 850) relates to Sample 1 (scoop, September 19) and subunit ASF1 in airborne samples 9 and 10, in agreement with values of ATP above 6.0 RLUs (Table 6). High RLU luminescence matches the increased fluorescence signal of ASB 2, whereas low RLU corresponds to negative detection (FI: 0) or trace signals (FI: 55–235). The two signals appear positively correlated (R = 0.836) when including the two air samples, but the correlation drops when considering only hardware samples (N = 5), and more analysis is necessary for a robust correlation.
Cellular and protein biomarker antibodies
The FI peaks (max values) against the microbial taxa and molecular biomarkers detected by the LDChip200 were higher than those against ATP synthase in the post-cleaned hardware (Table 7 and Fig. 8). Further, we compared each biomarker detected in the hardware with those identified in the air dust samples (Supplementary Table S1a, b).
The comparison informs whether the background contaminant was from an airborne source or potential cross-contamination from drilled sediments residues transferred to the sample handling hardware and analysis. Fifty percent or less of taxa (trace residues) detected in the drill, scoop, and funnels were also in the dust. In comparison, more than 50% were detected only in the background residue transferred from drill to funnel to scoop (putative subsurface biome).
Very low signals (FI <400–600) against Anabaena sp. are ubiquitous in post-cleaned hardware and dust samples. The highest FI-positive values in the swabbed hardware samples are against proteins Gram-negative bacteria ancestral beta-lactamase (GNCA), Gammaproteobacterial ancestral beta-lactamase (GPBCA), and NifS2 (Leptospirillum ferrooxidans). The peptidoglycan (polymer sugars and amino acids forming bacteria cell wall) is found only in the 19-Sept scoop (FI <800 and 8.4 ± 1.6 amoles ATP/cm2) but not in the dust. Very weak signals against Bacillus subtilis and Streptomyces sp. are detected only in post-cleaned hardware from Sol 6 (September 20), whereas the peak intensity (<700) is against Planococcus sp., a Gram-positive psychrotolerant, halophilic bacterium.
The surface swab of the post-cleaned hardware yielded relatively low background contaminants (Table 7), indicated by traces (<300) or weak (<1000) FI signals, except for a few moderate signals (1000–3000). The intensity signals from protein biomarkers contaminants (FI peak ∼1000–1600) are also higher than those against cellular materials (FI peak: ∼300–1000). A few high signals (>3000) pertained only to materials from the air samplers (Fig. 10 and Table 9).
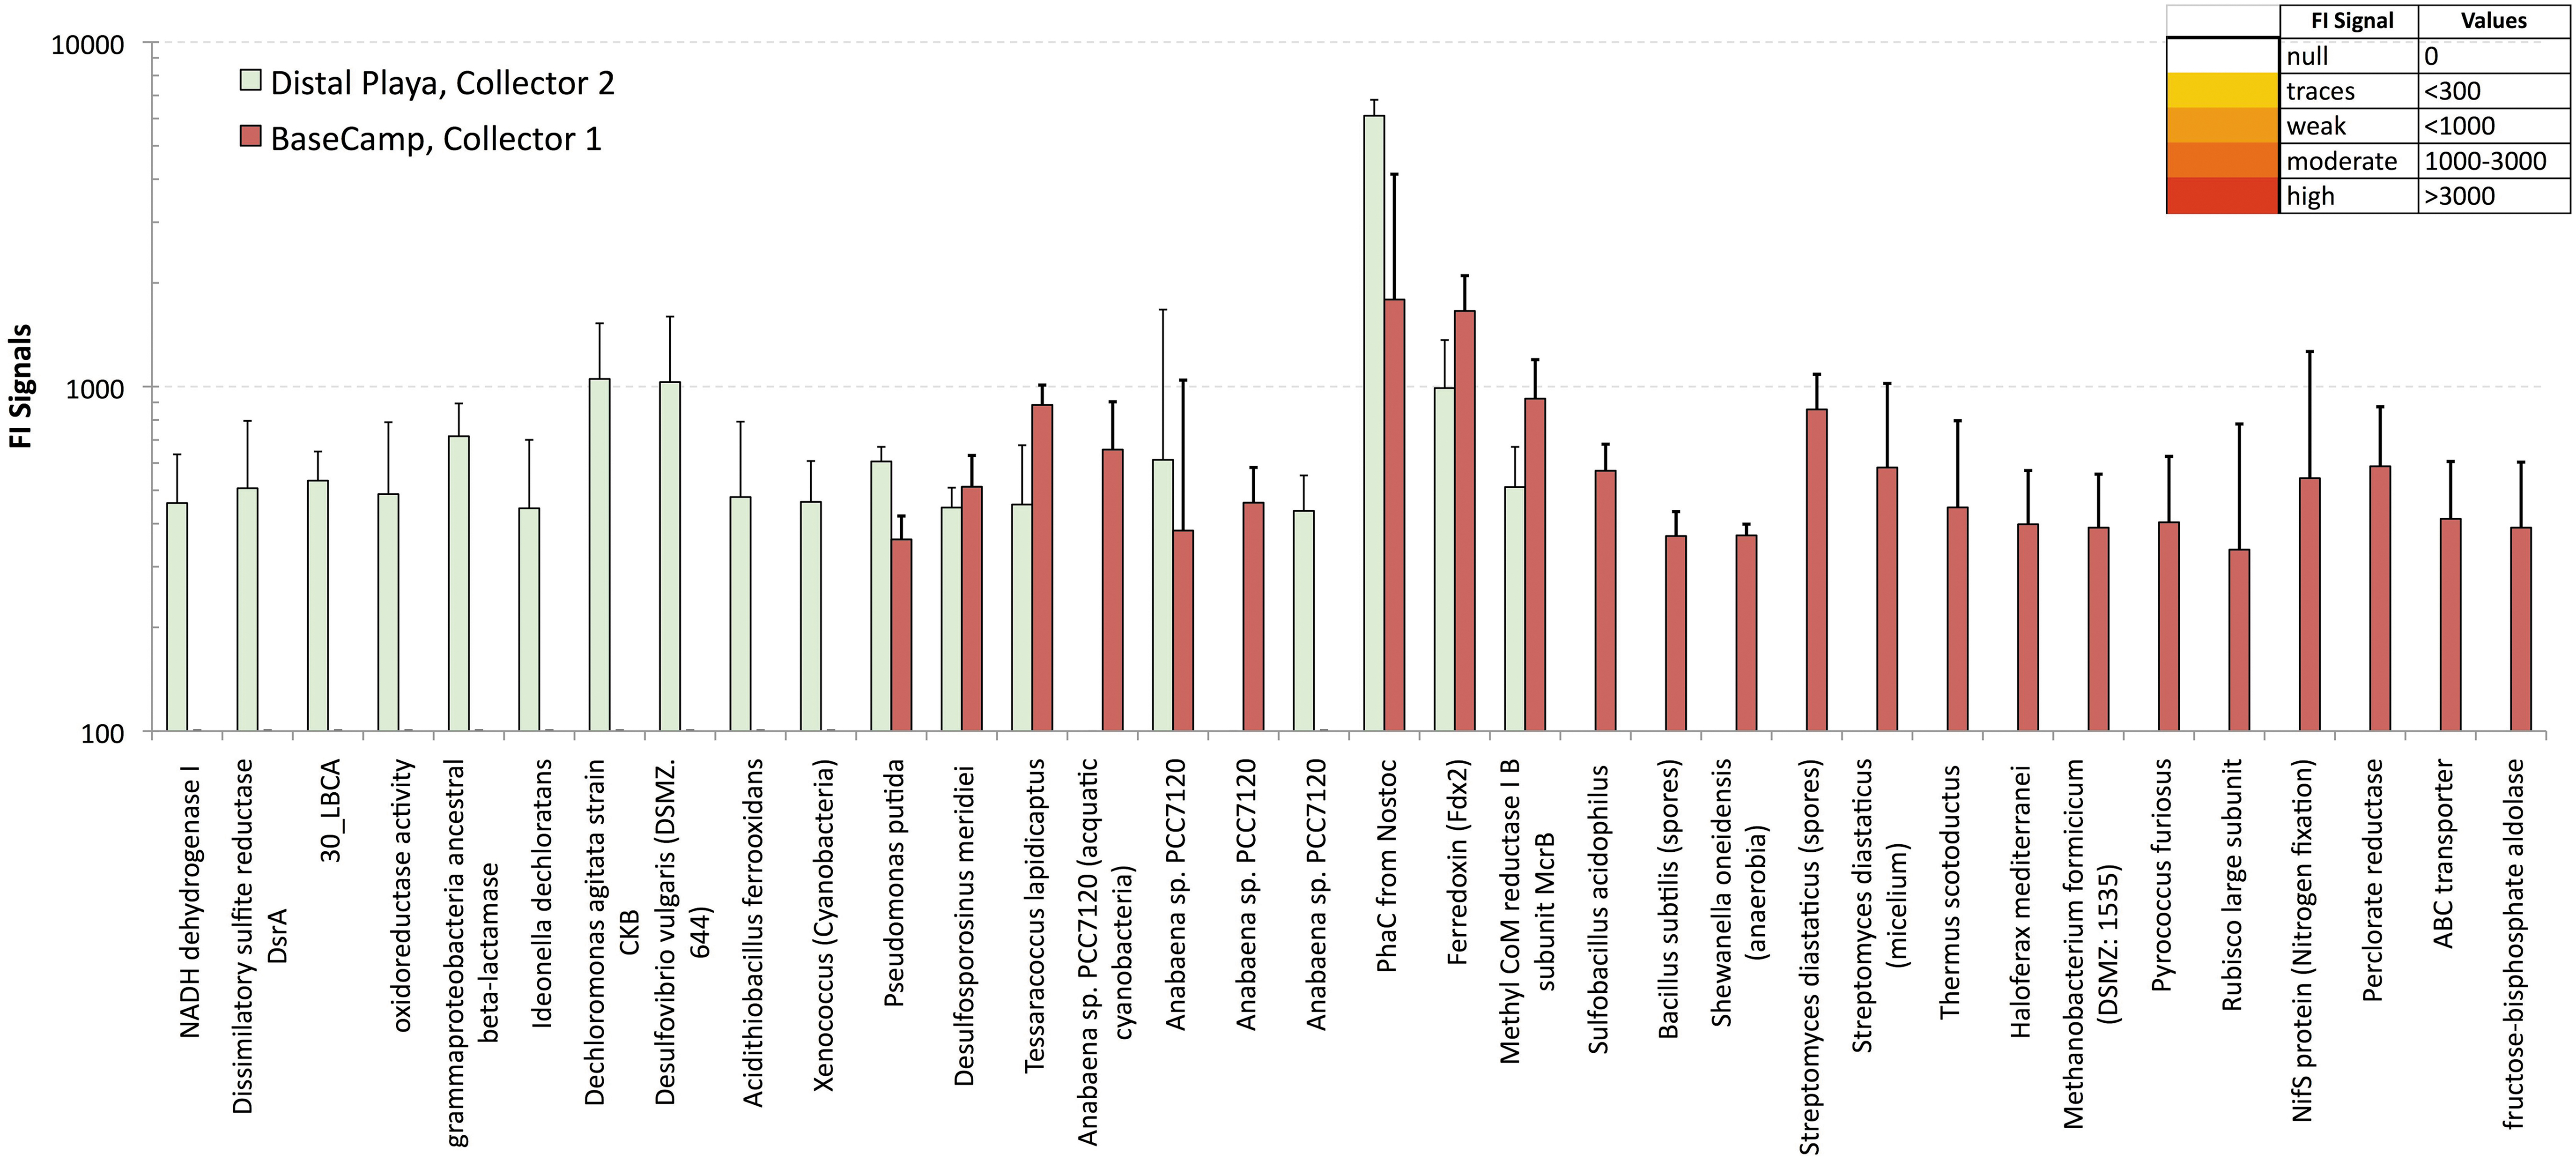
Immunogram with the relative FI for the LDChip200 positive detection of microorganisms and polymeric biological markers at the basecamp and distal collectors. Note that some immunogens are present only in either one of the two collectors, whereas others occur in both ones. See Section 5.3.2. for a description and Table 9 for the list of antibody names.
The results suggest that solvent-cleaning and microbial-reduction steps effectively mitigated residual and active bioburden contamination in the ARADS hardware, with a few exceptions. The chip detected a moderate FI signal against Geobacter sp. (FI: 1008) and the Gammaproteobacterial lactamase protein (FI: 1472) in the post-cleaned drill bit (Sol 6, September 20).
However, this highest background intensity signal corresponds to one of the lowest signals detected against ATP synthase (FI: <300), which correlates with the ATP biomarker (1.2 ± 0.6 amoles/cm2). The ATP background contamination was equivalent to traces of viable bioburden of ca. ≤1 cell/cm2, or a total of ∼100–200 cells in the drill bit (0.6 ± 0.0 amoles/cm2 ATP) based on ∼1–2 amoles ATP per bacterial cell (Okanojo et al., 2017).
Further, a negative correlation exists between the FI peak against microbial cells (gray columns) and the ATP background signal (r = −0.673) as shown in Fig. 8. The relationship suggests that only a negligible fraction (if any) of the residual microbes detected by the LDChip200 may be viable (ATP activity) and that the FI relates to residual traces of dead or partially fragmented cells. There is no significant correlation between ATP background and FI peak against proteins (r = −0.196), whereas no correlation exists between the cells' and the proteins' FI peak (r = −0.017). Correlation data are not presented.
Figure 9A–D and Table 8 illustrate monitoring setup for airborne biomass flux to collectors 1 and 2.
Flux of Airborne Environmental (Collector 2) and Anthropogenic (Collector 1) Biomass
Flux of Airborne Environmental (Collector 2) and Anthropogenic (Collector 1) Biomass
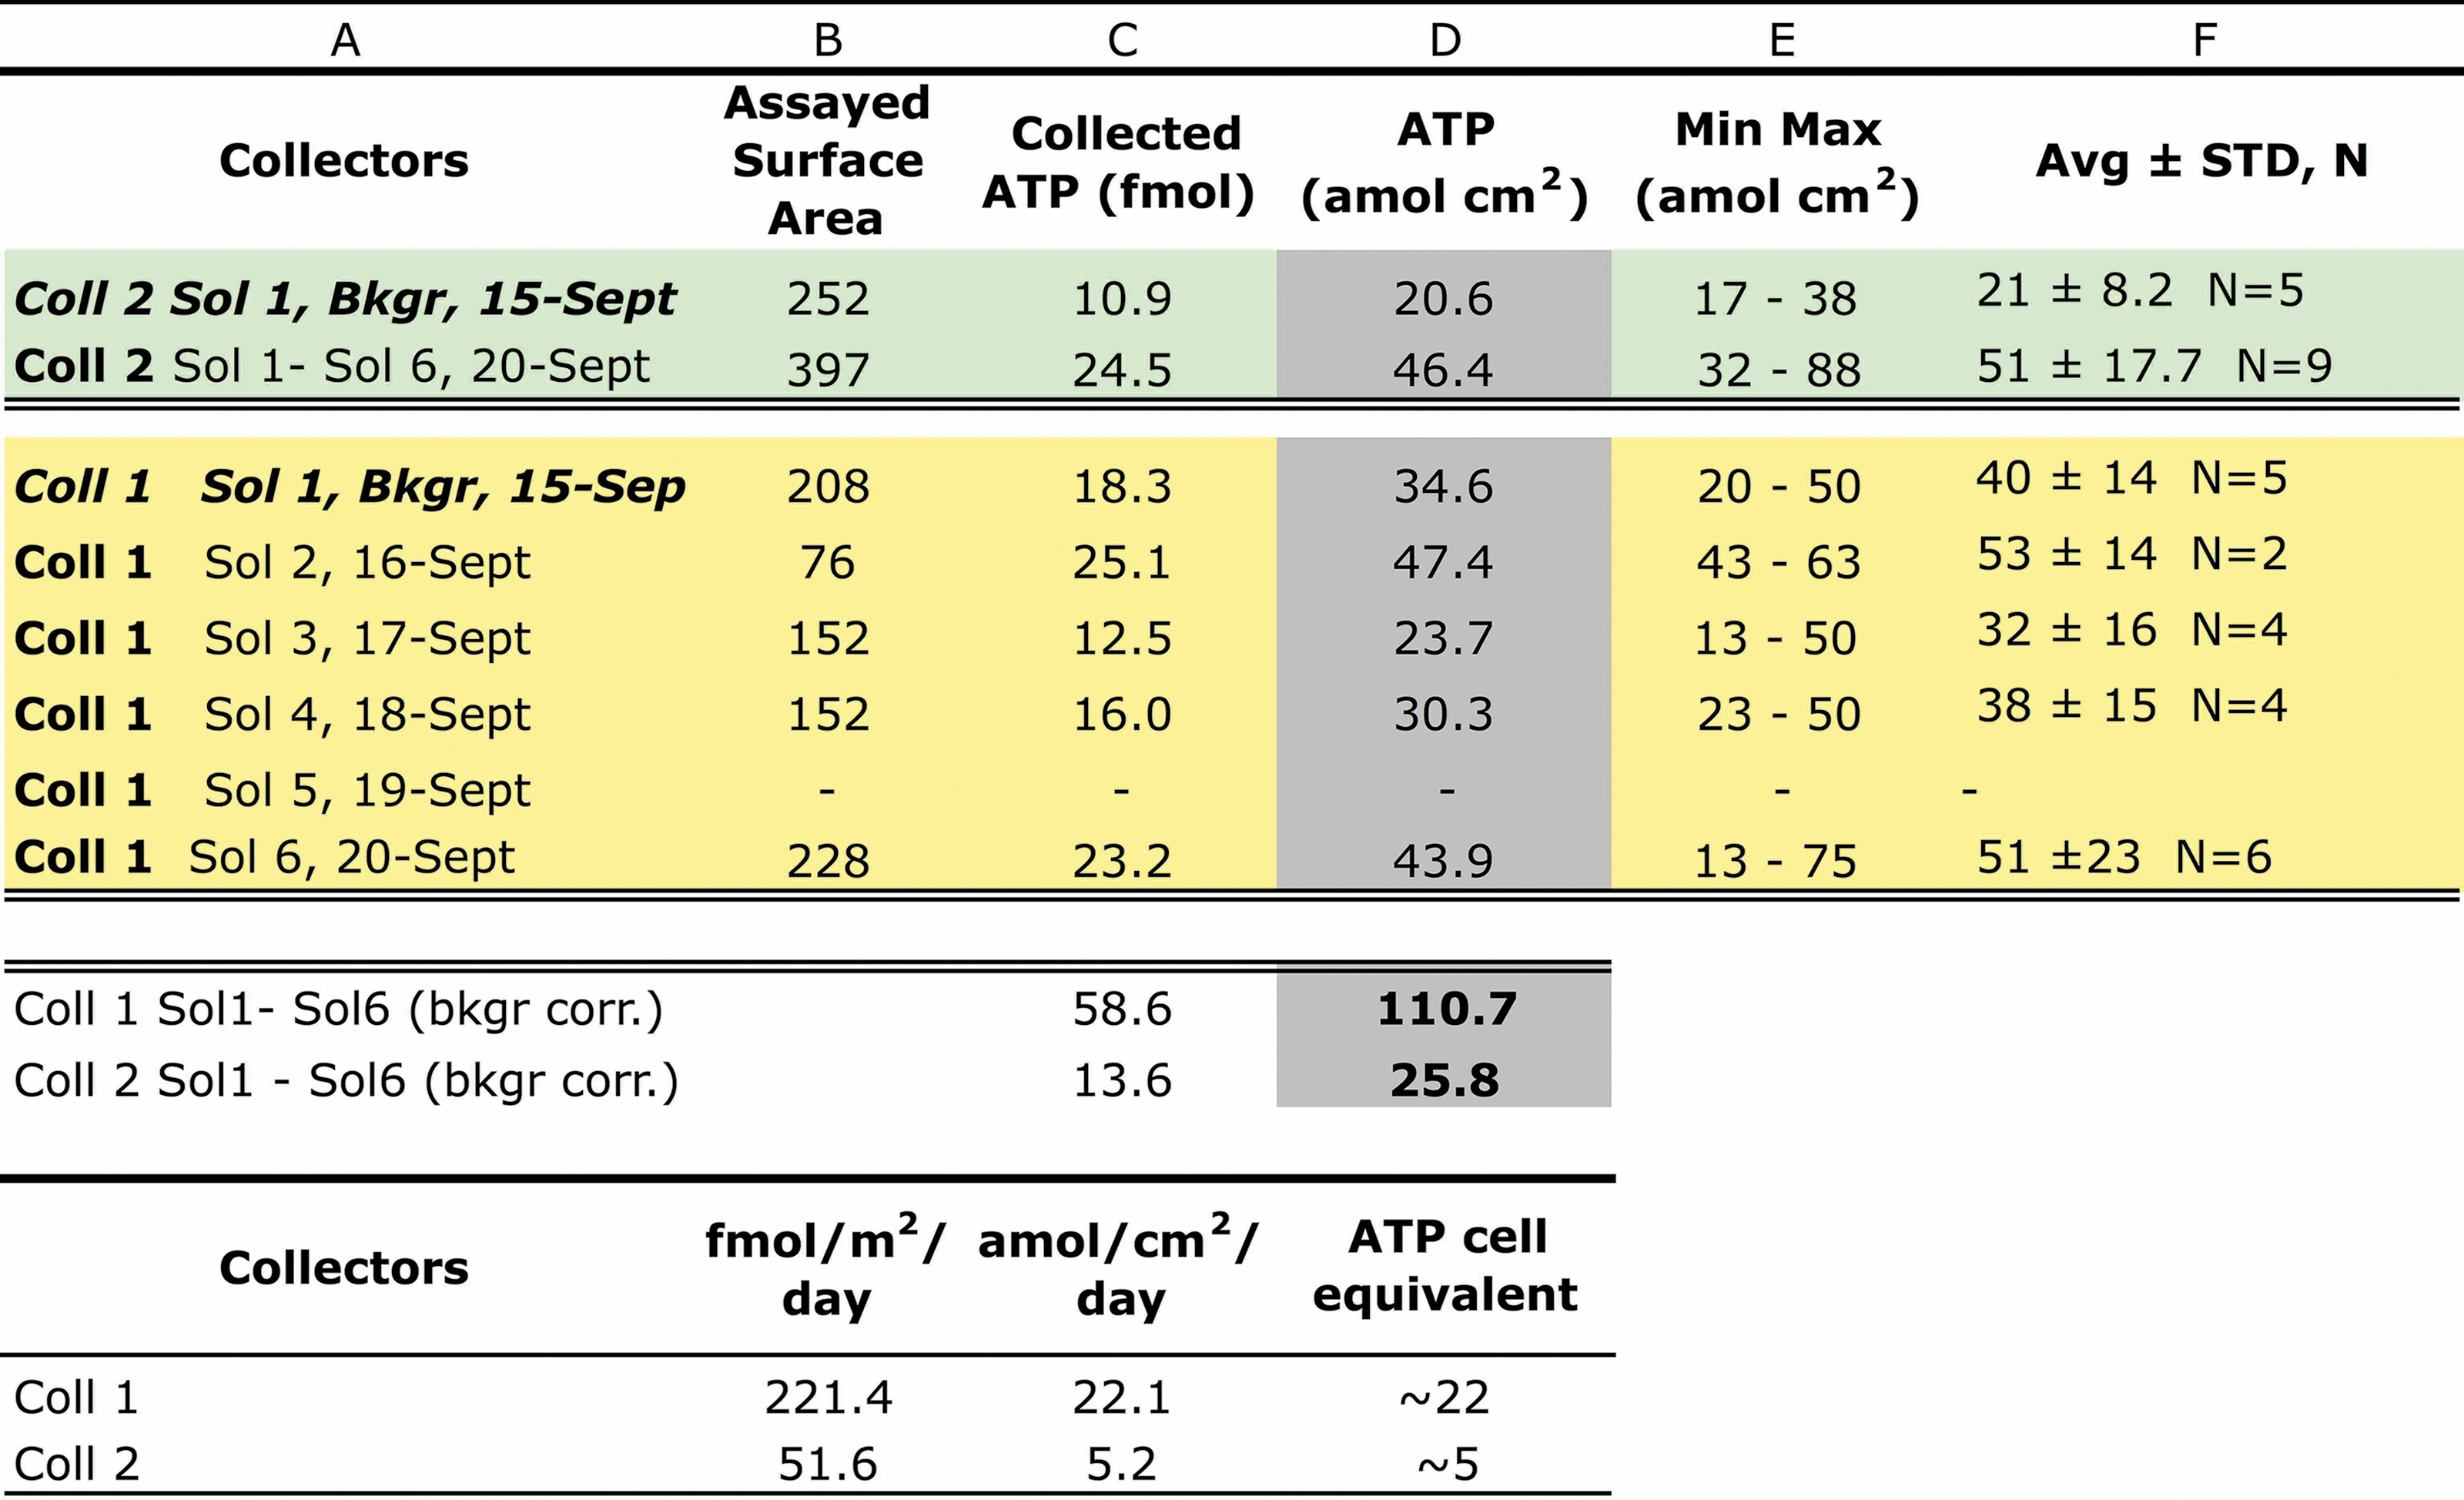
From left to right: Column B: Swabbed surface area out of the total collector surface (529 cm2); Column C: ATP swab values normalized to 529 cm2; Column D: airborne biomass in attomoles ATP per surface unit (amol cm2). Columns E and F: Summary statistics (min, max, Avg., and STD) for data relative to individual surfaces sub-areas A, B, C, D, etc. (not included, see Table S1 in the Supplementary Information). The last two rows report averaged ATP flux as femtomoles per square meter per day [fmoles/(m2·day)] and attomole/(cm2·day).
The ATP-based airborne biomass flux at Collector 1 ranged from 23.7 amoles to 47.4 amoles/cm2 across the 6-Sol simulation. The deposition rates of anthropogenic ATP at basecamp, average of 217.8 fmoles/(m2·day), were 4.2 times higher than the rates of environmental ATP, which averaged 51.6 fmoles/(m2·day).
The flux of airborne anthropogenic delivered over 5 days at basecamp (Coll. 1) was 110.7 amoles, averaging 22.1 amoles/(cm2·day), or 221 fmoles/(m2·day), whereas Playa Collector 2 received a total amount of 46.4 amoles/cm2 ATP over the same period exposure. After background subtraction (Bkgr: 20.6 amoles/cm2), the total flux of airborne environmental biomass to the playa (Coll. 2) was 25.8 amoles/cm2, equivalent to 5.2 amoles/(cm2·day) or 51.6 fmoles ATP/(m2·day).
Further, by assuming that basecamp Collector 1 would receive airborne dust in similar amounts to the Playa Collector 2, the theoretical net anthropogenic component could be calculated as the difference between the two airborne fluxes at the two collectors (Coll 1 Flux − Coll 2 flux), which is 166.2 fmoles ATP/(m2·day).
Table 8 reports the calculated airborne flux (environmental biomass) based on ATP swab data and normalized for the entire collector's surface (23 × 23 cm). For collectors 1 and 2 airborne flux calculations, see Supplementary Information for pre-deployment setups, post-sanitation ATP background determination (Supplementary Table S0a and b), and daily airborne biomass raw data (Supplementary Table S1a, b and Fig. S3).
Microbial taxa in airborne samples
The two collectors were located downwind from the Playa and received a higher flux of contaminants from the wind-scoured playa surface sediments (Fig. 13 [3, 4]). LDChip200 detected in situ bacteria, archaea, and molecular biomarkers at the two sites, with mostly very weak signals of the relative FI (FI <600–1000) across the two sites, but a few exceptions (Table 9 and Fig. 10). There are a few intensity signals (weak signals) in both Basecamp Collector 1 (sample #9) and the distal alluvial fan/Playa Collector 2 (Sample #8), although #9 has more positive ones.
Peak Numbers, Antibody Names, and Immunogens of Intensity Peaks for the Immunogram of Air Samples from Fig. 10
Peak Numbers, Antibody Names, and Immunogens of Intensity Peaks for the Immunogram of Air Samples from Fig. 10
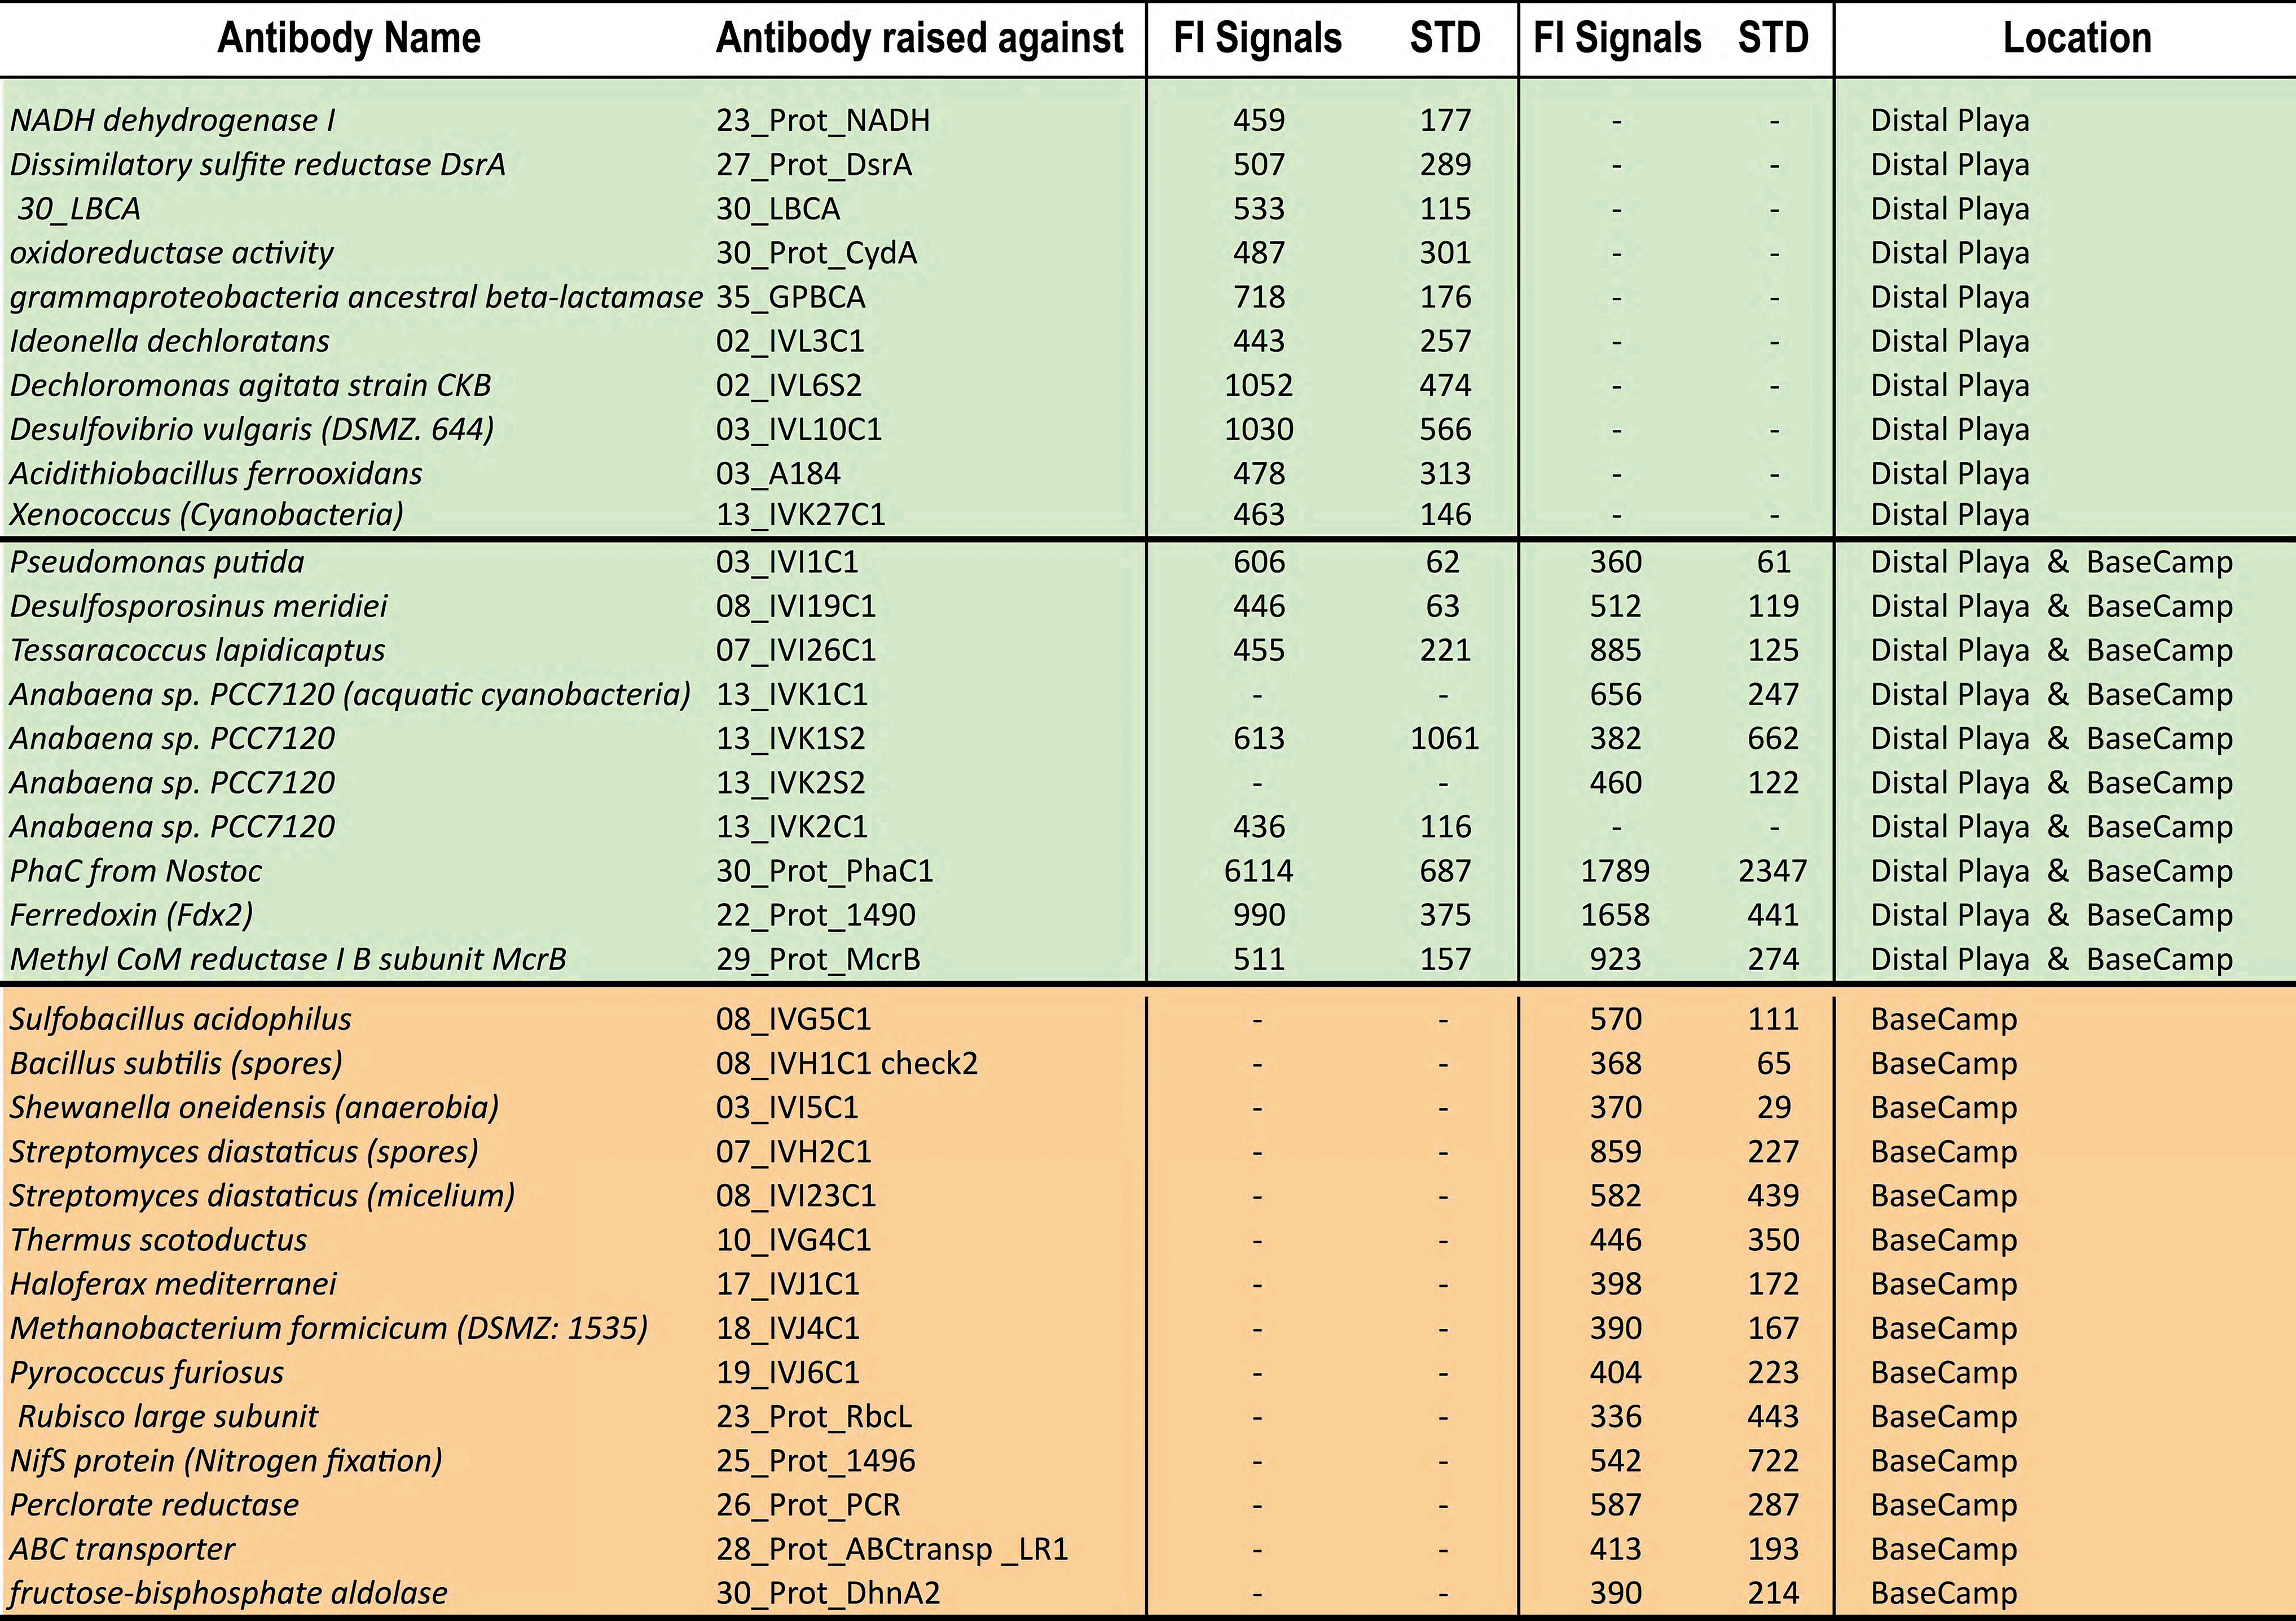
The 10 m track sample is a little more contaminated given the moderate signals (FI >1000) for antibodies against Dechloromonas, Desulfovibrio (Coll 1); the highest fluorescence peak (FI >6000) related to the PhaC1 (a protein from aquatic cyanobacteria, Anabaena sp., Nostoc sp.) and the Ferridoxin enzyme. The aquatic microflora was present in both collectors, but the cyanobacterium Xenococcus, characteristic of semi-arid hypolithic communities (the Atacama B sequence, Warren-Rhodes et al., 2006), occurred only in the distal Collector 2.
Overall, the positive immuno-reactions occurred with antibodies raised against: (1) Gram-negative acidophilic iron- and sulfur-oxidizing bacteria (Acidithiobacillus, Desulfovibrio); (2) perchlorate-reducing Betaproteobacteria (Dechloromonas, Ideonella), Gammaproteobacteria (Shewanella, Pseudomonas, Gammaproteobacteria ancestral beta-lactamase); (3) Cyanobacteria: aquatic (Anabaena, Nostoc) and hypolithic (Xenococcus); (4) Gram-positive Actinobacteria (Streptomyces) and Firmicutes (Bacillus, Desulfosporosinus); (5) strictly anaerobic sulfate- and metal-reducers bacteria (Desulfosporosinus, Shewanella); and (6) halophilic heterotrophic archaea and methanobacteria (Methanobacterium).
The immunogram data in Table 9 show that the microbes exclusively present at Collector 2 are Gram-negative bacteria, with Gram-positive (Firmicutes, actinobacteria) and Archaea in the basecamp's air sampler. The immunoassay data are not statistically relevant (only a collector for each area), whereas the immunograms match well the ATP data.
Figure 11 shows the downcore distribution of ATP biomarker from three Playa drilling sites. The average ATP biomarker is 100–250 fmoles/g and appears to decrease with depth in Hole 5 (60 to <0.2 fmoles/g, below detection limit [DL]) and Hole 2 (from 350 to 5 fmoles/g).
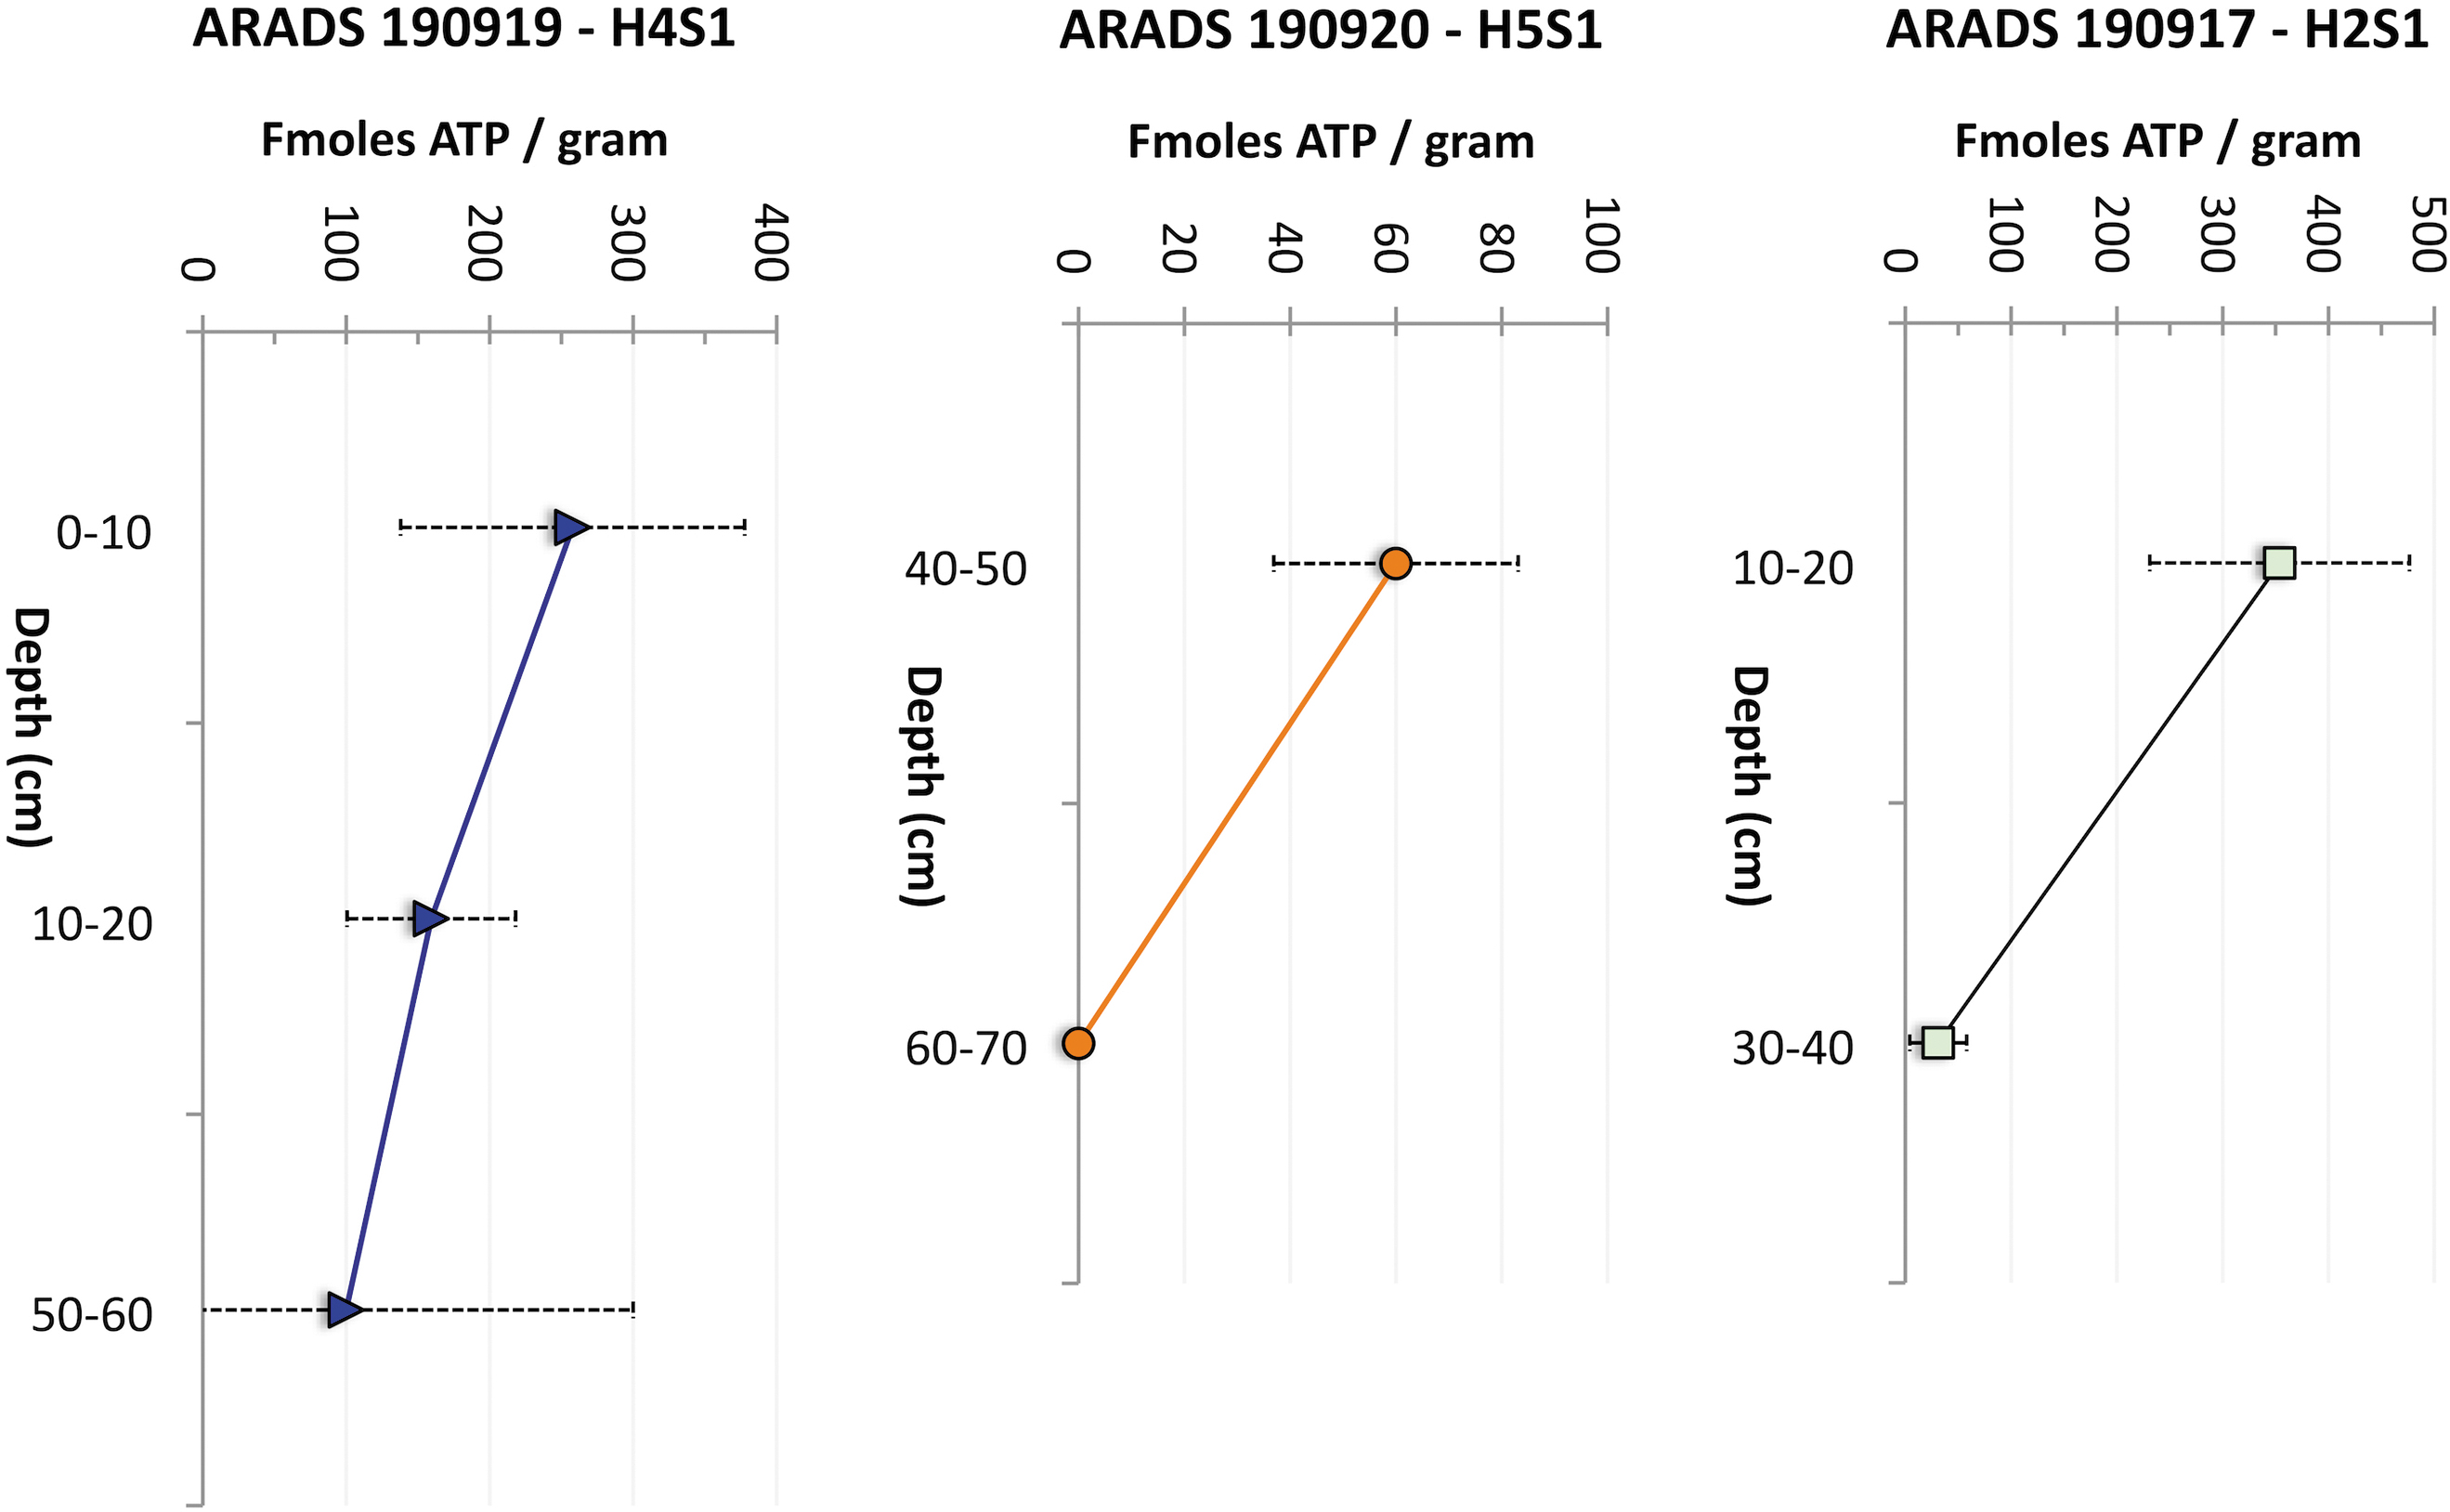
Depth distribution of microbial ATP in three holes expressed as fmoles of ATP biomarker per gram of sediment. Horizontal error is STD (Table S3 in the Supplementary Information).
The distribution of ATP biomarkers in these cores appears to be from complex putative life (e.g., Warren-Rhodes et al., 2019) rather than from contaminants transferred during drilling via hardware, post-drilling sample manipulation (e.g., hand skin reading 200 fmoles), or airborne biomass-rich sediment nearby (Fig. 13), with these contaminants being prevented by our strict contamination control practices during operations.
The unusually higher values of ATP in the upper-level samples (0–10, 40–50, and 10–20 cm) and the decreases of ATP with the borehole depth (50–60, 60–70, and 30–40 cm) might be due to naturally occurring metabolically active biomass present in these levels as the result of the latest ponding events.
For comparison, 15.1–32.4 ng/g, or ppb, of total amino acids (Leu, Val, Ser, Ala, and Gly) were detected by the MILA instrument in three subsurface samples acquired in 2019 (values calculated from Mora et al., 2020; Supplementary Table S2).
Finally, “Green Parrot” drilled dark brown clays (March 2019) yielded higher values (∼2 × 10³ to ∼7 × 10⁴ cells/g) against the coarse-grained surface pavement (∼102–103 cells/g), with no recovery of microbial ATP in five out of seven trials (Supplementary Table S3). Supplementary Figure S2A–E reports protocol test results, and Supplementary Table S3 provides Summary statistics for the ARADS surface and drill samples dataset.
We measured the surface distribution of total, free, and microbial ATP in smectite clay-rich playa sediments as potential contaminant indicators to the ARADS sites (Fig. 12 and Supplementary Table S3 in the Supplementary Information). Samples included (1) a 3 mm layer of the desiccated microbial mat as positive control, that is, 4.7 ± 0.58 × 10⁴ fmoles total ATP/g (N = 9); (2) excavated clay from a nearby pit (3–5 cm-depth), that is, 7.2 ± 0.7 × 10³ fmoles/g (N = 10); and (3) never-ponded surface clay (0–3 cm-depth), that is, 212 ± 268 fmoles/g (N = 6).
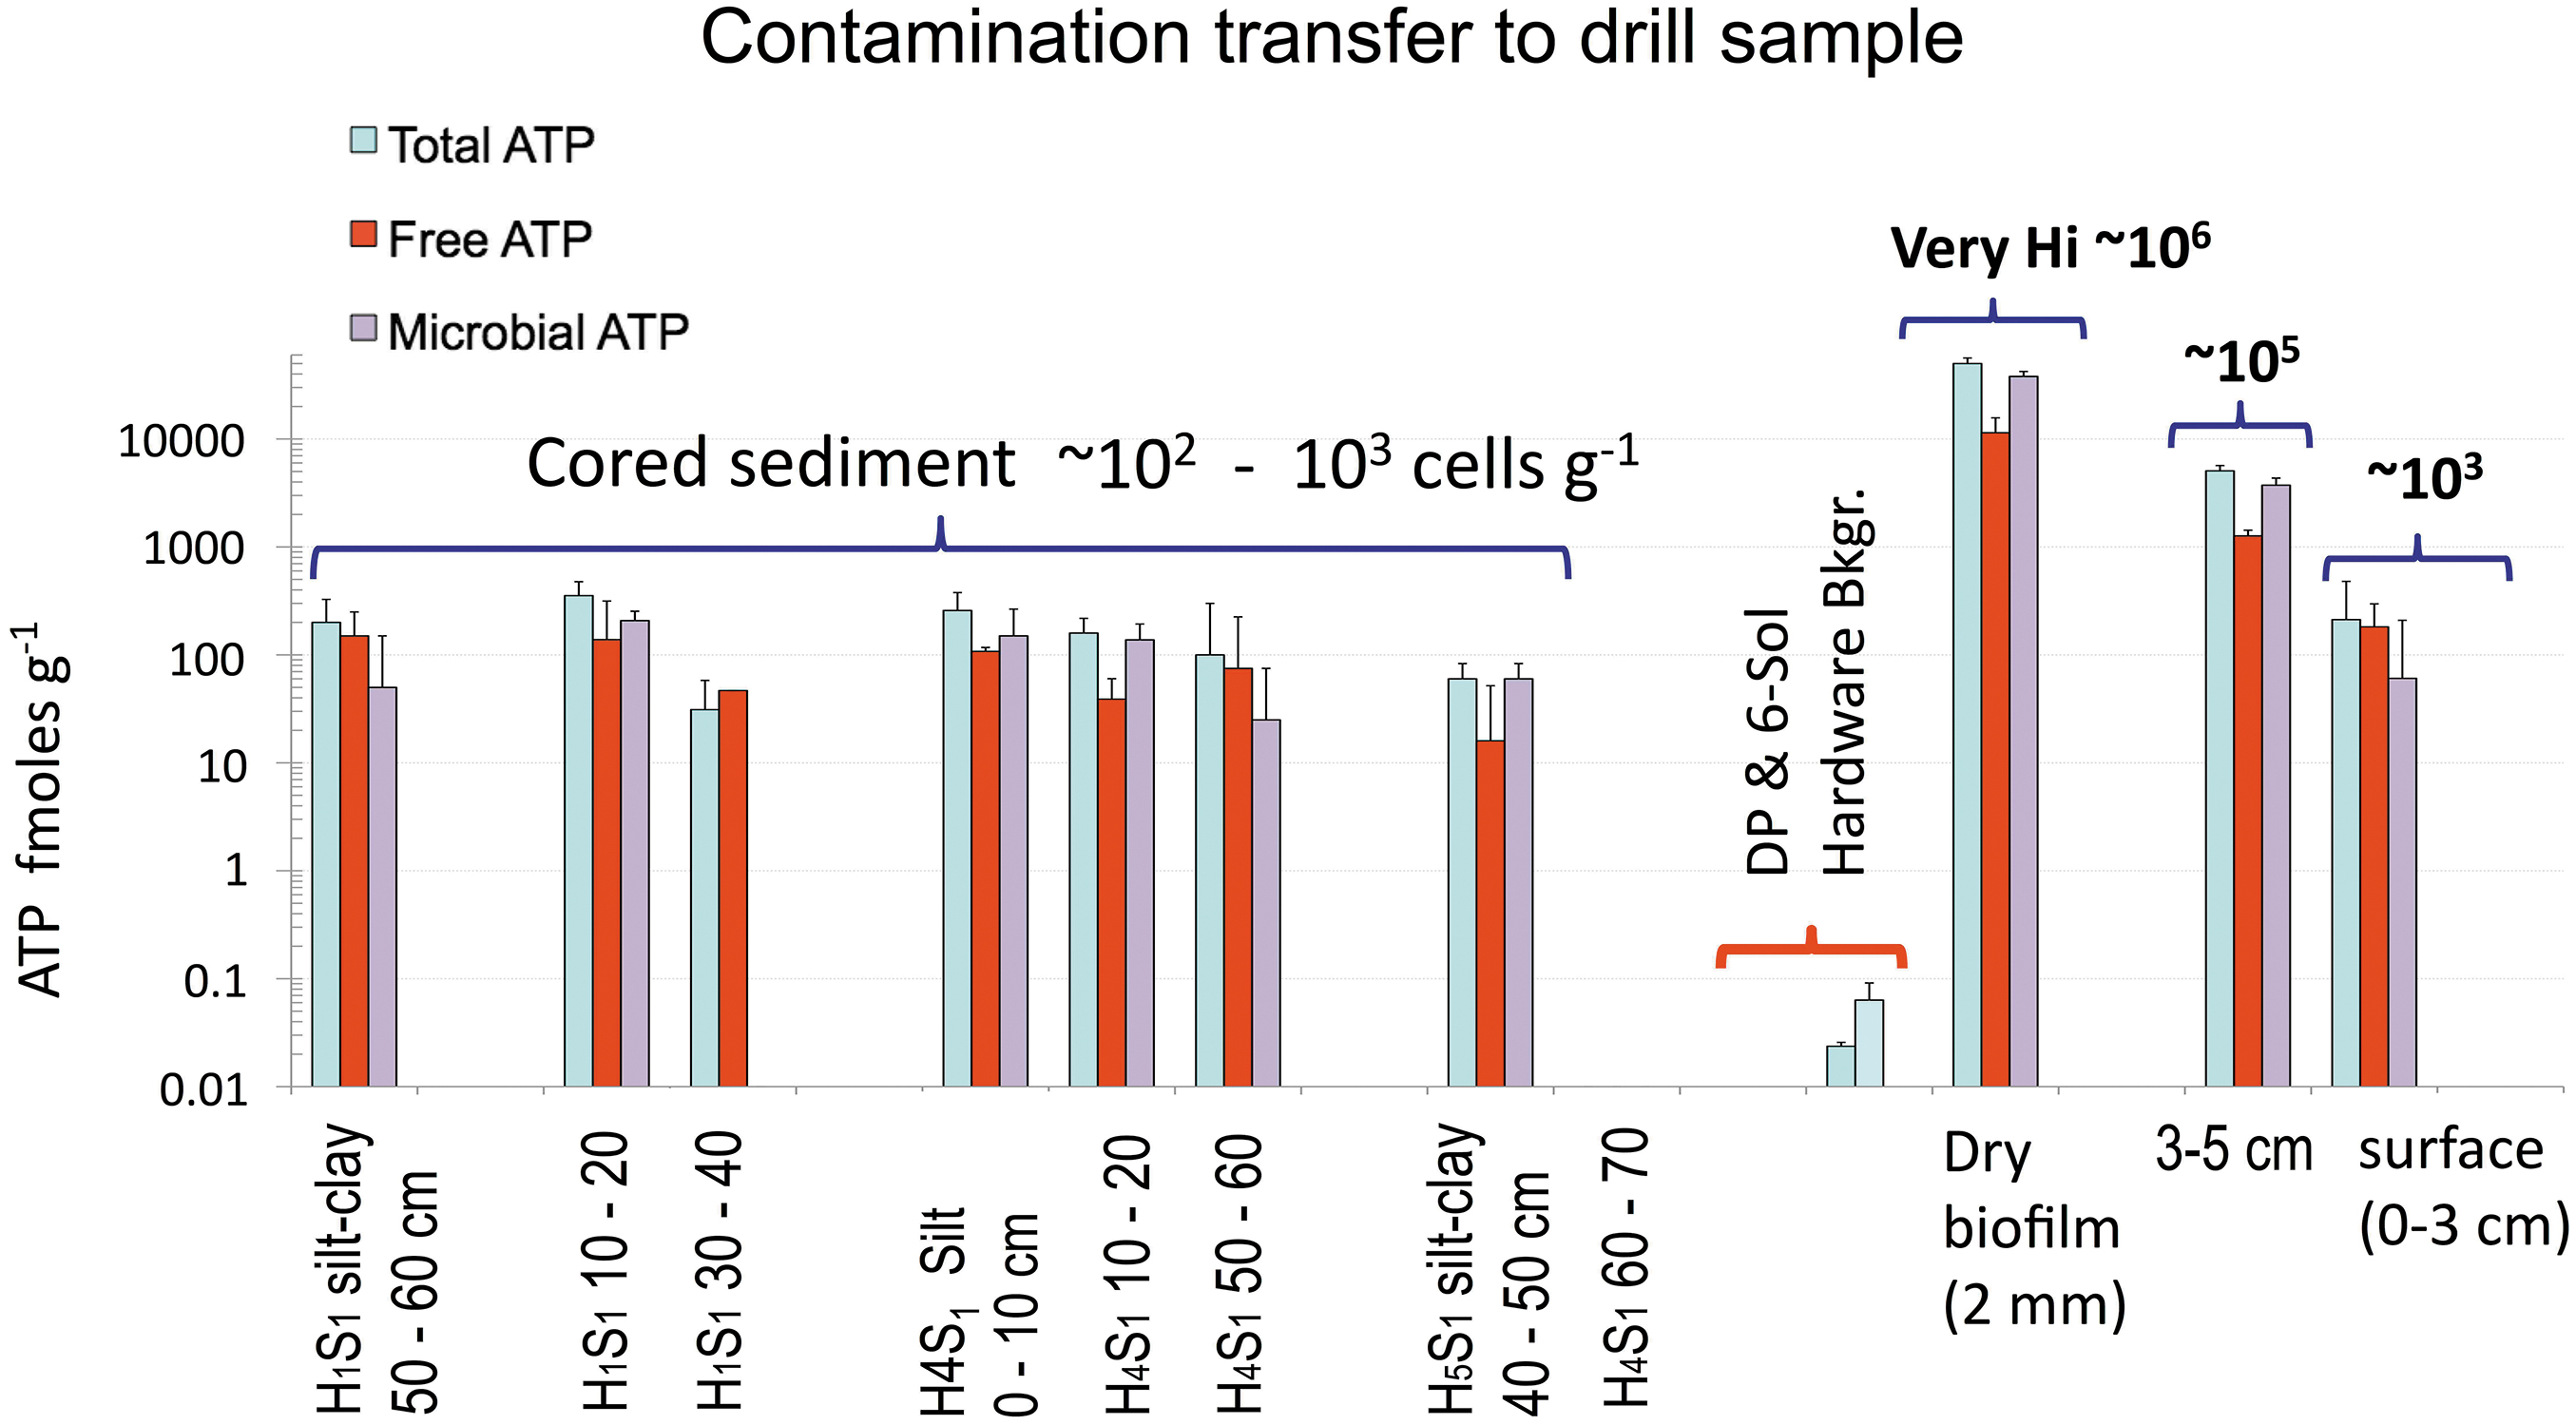
ATP biomarkers (total, free, and microbial) in cored versus surface sediments and derived values of microbial biomass as cells/g sediment. Note the negligible contribution of the potential contamination transfer from hardware (Total ATP, shortest bars) to drill samples. 23.7 ± 2.1 amoles/g for DP and 63.4 ± 28 amoles/g (6-Sol Bkgr) Bkgr: post-cleaning hardware background. DP, deep cleaning.
These values are equivalent to an estimated viable microbial biomass of 103 cells/g (0–3 cm-depth) and 105 cells/g (3–5 cm-depth) to very high levels (106 cells/g) in the 3 mm layer of the dried microbial mat (positive control samples) a 4-log or a 5-log higher microbial biomass than in drilled sediments or the majority of the Playa surface.
This unexpectedly highly active surface biomass related to a thin crust of desiccated microbial mat (Fig. 3K) we sampled from small areas of the post-flooded Playa and was still preserved after a short-lived pond formed at its margin during an extreme flood event in 2017 (Personal communication; Kim Warren-Rhodes, 2019), 2 years before our campaign. In ephemeral ponds, spore-forming cyanobacteria can proliferate and leave post-flooded desiccated yet viable biomass on the surface.
The desiccated, very brittle biofilm could be eroded, carried, and delivered by wind, increasing the contamination risk when entraining exposed cored material or the scoop and funnels during the sample transfer (Fig. 13). However, most surface biomass was 3- to a 4-log lower than boreholes sediments or the high biomass patches.
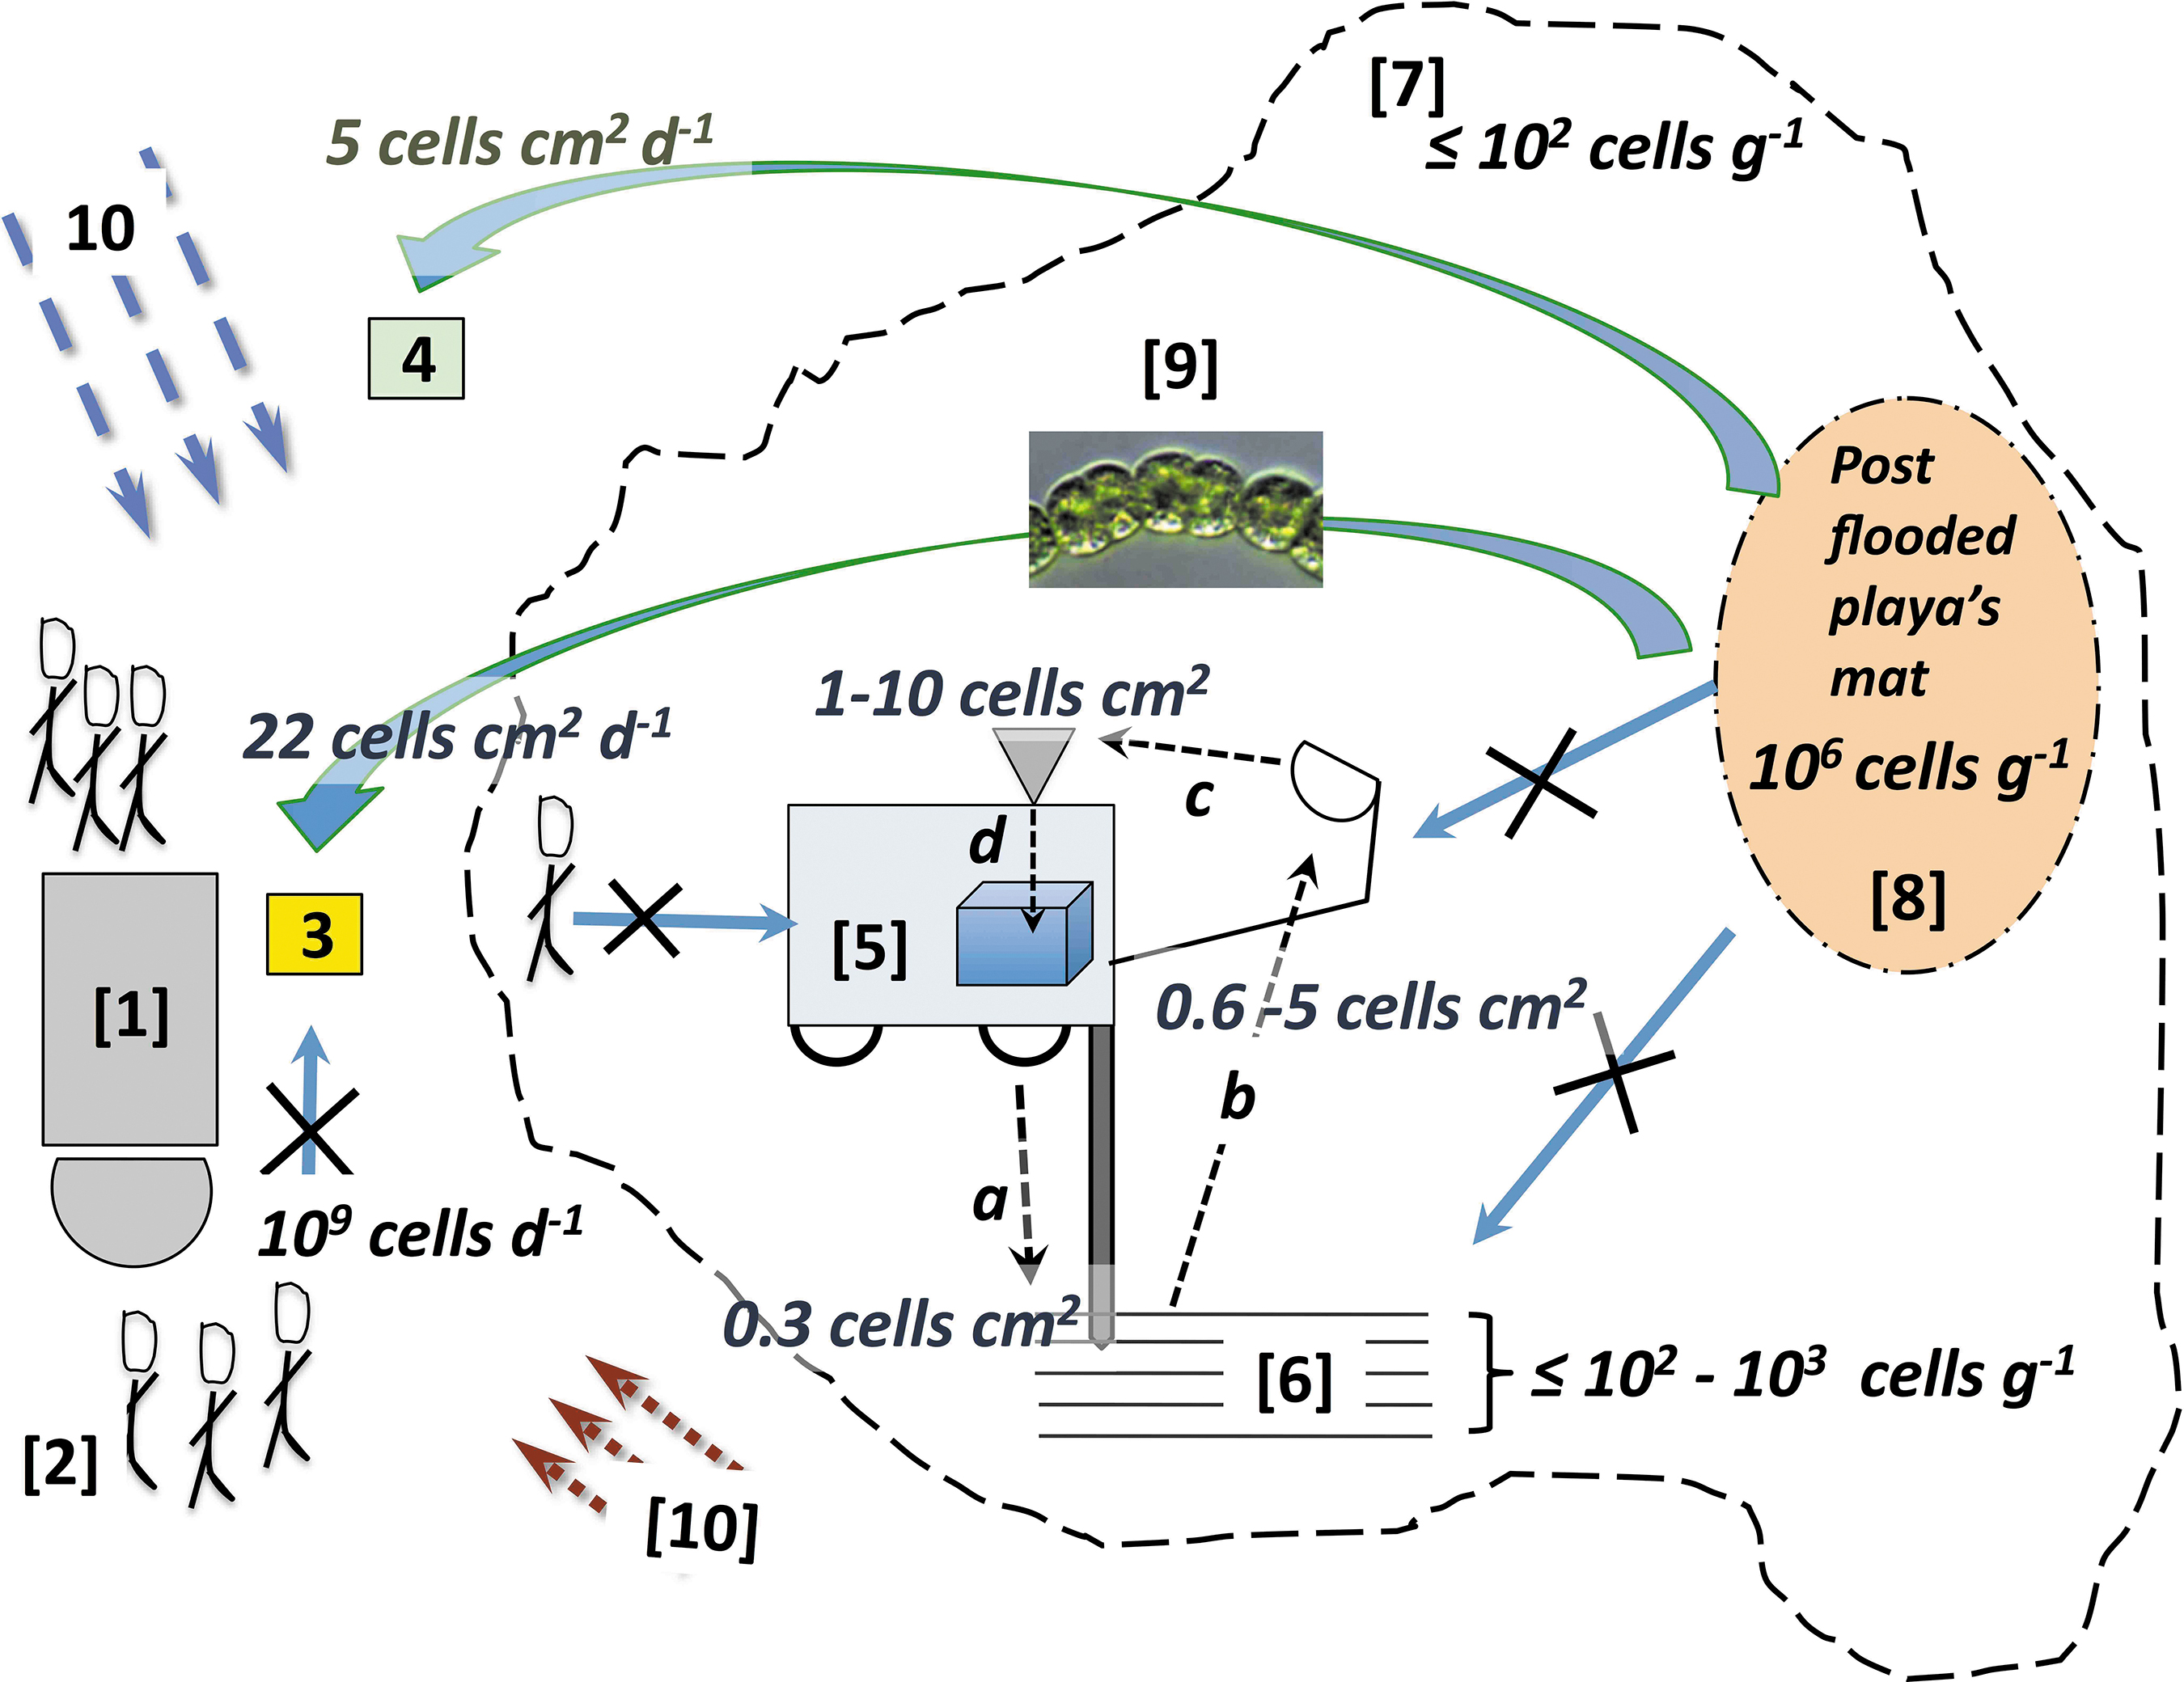
Conceptual model illustrating source-to-sink contamination. Figure not to scale. Semi-quantitative cell estimates [cells/g, cells/cm2, and cells/(cm·day1)] and numbers near each pathway. Basecamp [1] and anthropogenic contamination [2] in dust Coll. 1 [3] and Coll. 2 [4]. The thin dashed arrows indicate Rover [5] and cross-contamination pathways: (a) drill-to-subsurface [6] (a forward contamination analog); (a–d) drill-to-sample transfer and analysis: (a) drill, (b) scoop, (c) funnel, (d) life detection instrument. Blue solid-lined arrows with “X” indicate unlikely contamination pathways, for example, desiccated post-flood microbial mat [8] sourcing aquatic cyanobacteria [9] to sampling hardware (a–c) or subsurface sedimentary layers [6] and not flooded playa surface [7] delimited by the Playa shoreline (black dashed lines). Large green arrows indicate unexpected airborne biology, for example, Anabaena sp. [9] in collectors [3, 4]. Blue and red parallel dashed arrows represent heterogeneous (more distal?) sources of airborne biomass [10] to the collectors or sampling hardware. Coll., collector.
An integral component of the contamination plan included a source-to-sink assessment of potential contamination in the drilled samples (hardware-to-sample transfer, airborne biomass contamination on sampling hardware, etc.). Results from these tasks are infused into a conceptual model (Fig. 13) and integrated into the Discussion (Section 6).
Figure 12 shows the hardware-to-sample contamination transfer calculated using post-cleaning hardware background data (Table 4), and by assuming an average drilled sediment (60 g) getting into contact with a 50 cm segment of the drill string (616 cm2), 100% of the scoop (217 cm2), and funnel (196 cm2), and 100% contamination transfer (drill to scoop to funnel).
Discussion
Effectiveness of ARADS methods
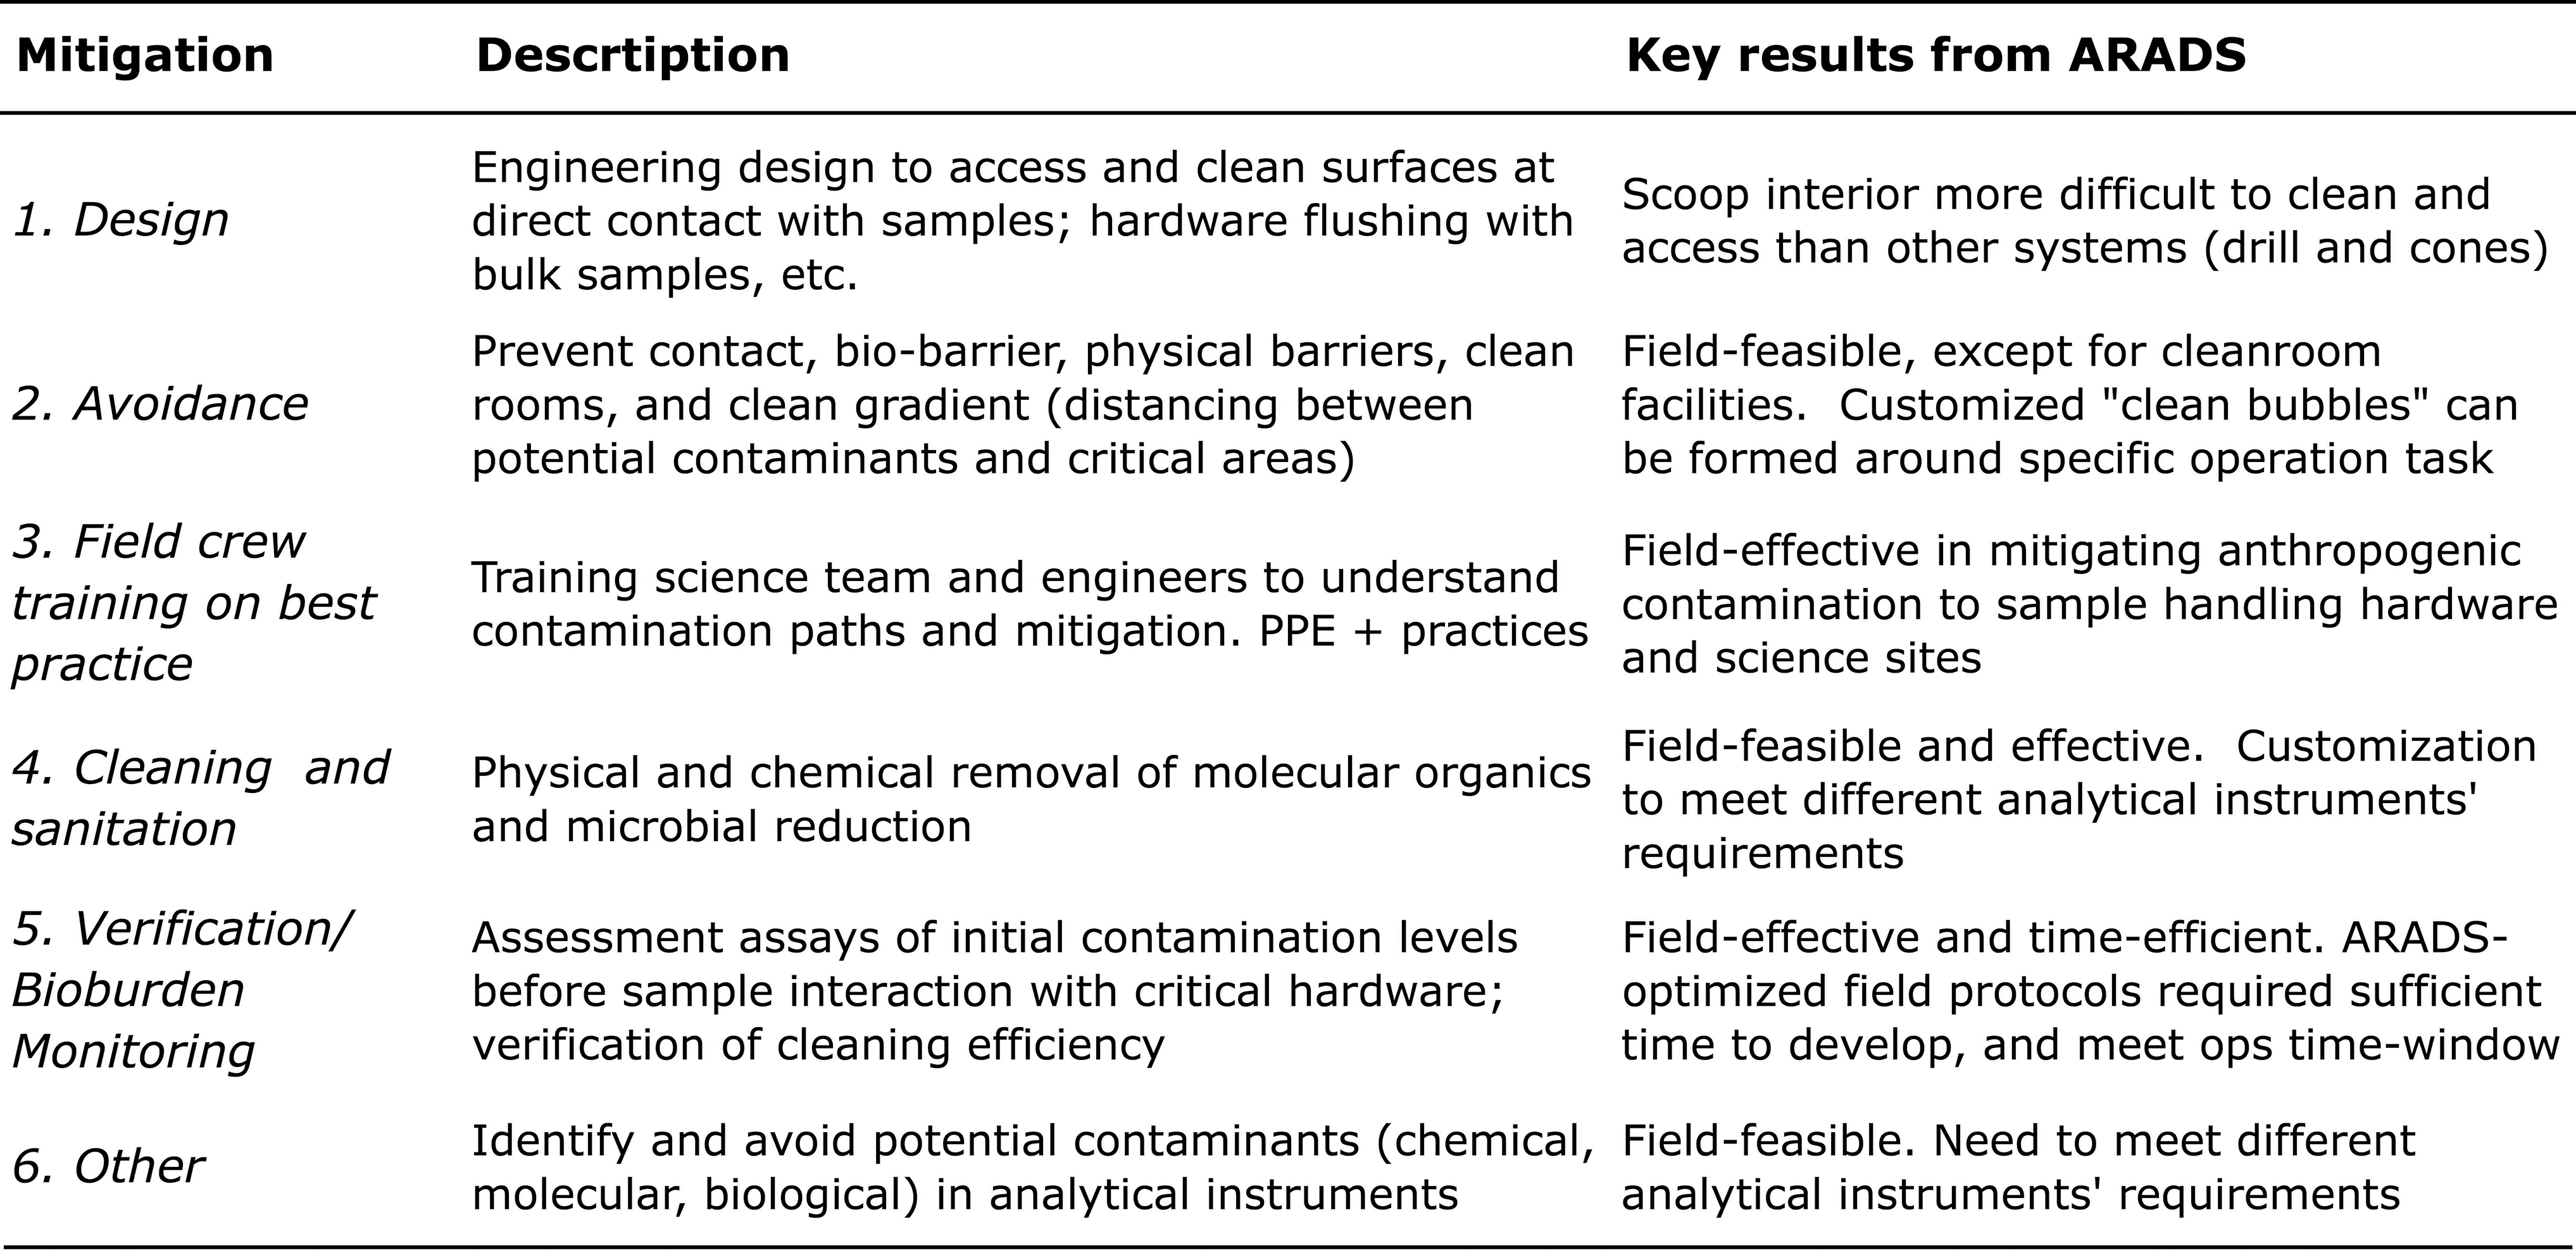
We developed integrated CCSI practices for ARADS to prevent and mitigate contamination of the SHTS and the acquired samples and learn about potential contamination pathways across the operating environments. Table 10 summarizes the mitigation tasks, key findings, and their applicability to field conditions. The ARADS practices are similar to those established to mitigate contamination during a landed mission to Mars (Spry et al., 2021).
Description and Field Application of Rover Astrobiology Drilling Studies Mitigation Practices (Items #1–6) and Critical Results
Description and Field Application of Rover Astrobiology Drilling Studies Mitigation Practices (Items #1–6) and Critical Results
PPE = personal protective equipment.
A very close relationship exists between microbial reduction and organics removal to protect science. Background contaminants in spacecraft hardware pose two risks to a life detection mission drilling into the martian ice-cement ground like Icebreaker (Heldmann et al., 2013; McKay et al., 2013) and the Mars Life Explorer (NAP, 2021).
First, forward contamination from terrestrial microbes surviving spacecraft's hardware sterilization is the primary concern (e.g., NRC, 2006; NAS, 2018, 2019, 2020). Spores can remain long-term viable in space, even without metabolic activity at the low temperatures of Mars' surface (e.g., Horneck et al., 2010, 2012; Hallsworth, 2021), be shed on the surface during landing (Marshall and Mancinelli, 2011), and enter the underground, becoming metabolically active under increased water activity (Rummel et al., 2014; Orosei et al., 2018); this will increase the forward contamination risk should more habitable conditions exist underground or near the surface Category IV bioburden level limits are ≤30 + (2 × 10⁵) spores from the landed spacecraft's surface, mated, and encapsulated hardy bioburden surviving decontamination.
Second, whole microbes or cellular fragments could release mission-relevant analytes such as amino acids—or any other target biomarker along the “ladder of life detection” (Westall et al., 2015; Neveu et al., 2018)—into the analytical suite. For instance, amino acids are a primary target of the Icebreaker life analyzers and other life detection missions.
Bacillus spores contain free (
We demonstrated that false negative detection of contaminants undermines microbial reduction and verification, resulting in more concern for ARADS than false positives, that is, the level of recovery of swabbed ATP decoupled from the actual bioburden background. False negatives can originate from many confounding factors. They are:
The hardware's surface characteristics (discussed in Section 6.1.3).
The amount, distribution, and complexity of hardware bioburden (biofilms-organics layering) and mineral coatings (dust or oxidized). When nonvisible organics and the mineral film were present on the drill, the ATP swab assay yielded false negatives for two plausible reasons. (i) Mud particles and oily residues obscured the L-L ATP reaction, and (ii) molecular organic layers encasing the microbes protected them against detection (Fig. 6C, D) and microbial reduction. The exposed active bioburden could be detected and reduced only after acetone removes inorganic and organic polymers (oils, grease, lipids) before microbial reduction. This problem did not concern scoop and funnels, whose bioburden decreased linearly after treatments (Fig. 6G, H). Unlike the drill, no complex organic bio(films) build-up occurred during the long-term storage of scoop and funnels.
The cleaning test results were consistent with the common wisdom that the cleaner a surface can get, the more successful microbial reduction and verification will be (e.g., Meszaros et al., 2005).
Given what has been stated earlier, we suggest performing microbial reduction and verification on an acetone-cleaned drill. Disinfection-resistant biofilm-organics layering can be a common issue because the drill system in gears, bearings, and sliding surfaces of the drill tube connections makes routine use of standard lubricants, for example, 3-in-1 SAE 20 motor oil containing petroleum, LubriMatic White Lithium Grease, and WD-40 (Miller et al., 2008).
Cleaning agents' residues on hardware. We first mitigated the false negative issue (a detection one) by conducting verification assays on solvent-rinsed hardware. Rinsing with water removes interfering cleaning and disinfecting agents and addresses one limitation posed to the ATP assay in clean rooms (see review by Shama and Malik, 2013).
Luminometry quenching effects by chromogenic pigments in samples decrease the light emission. Nanophase clays, FeOx, and salts can interfere with L-L reactions and chemiluminescence photodetectors.
Environmental field conditions. High diurnal temperatures (≥25–40°C) and direct sunlight can trigger very high RLU values generating false positives (Bonaccorsi and Stoker, 2008). The use of chemiluminescence photodetectors over photomultiplier tubes can mitigate the latter issue. Further, wind-generated triboelectric effects could produce unusually high RLU values even at night, as we experienced during field measurements. We included positive and negative controls to address the assay performance.
Effectiveness of microbial reduction and verification
Countless cleaning protocols exist for laboratory, cleanroom applications or aseptic drilling of icy materials (e.g., Christner et al., 2005; Kuhn et al., 2014; Goordial et al., 2017; Kayani et al., 2018; Coelho et al., 2022). Yet, only a few have been designed for complex astrobiology life-detection technology trials. Miller et al. (2008) applied a multi-step protocol for aseptic drilling (Milli-Q water, 10% Lysol aqueous solution, 70% Et-OH, flame sterilization) (Table 3) and immunoassay-based deep biosphere characterization in the Rio Tinto region (Parro et al., 2008), consistently with other multi-reagent cleaning protocol certified by immunoassay-based Limulus Amebocyte Lysate (LAL) and GC-MS swab analyses (Eigenbrode et al., 2009).
ARADS multi-reagent protocols combined immunoassay and ATP luminometry techniques to detect a broader range of viable and nonviable biological contaminants. Overall, the 6-h microbial reduction protocol enabled a 4-log drop of ATP background from unmitigated to aseptic conditions (1–2 amoles/cm2 reference background within the aseptic threshold of ≤3–4 bacterial cells/cm2); see Section 2.
During the six Sols, aseptic drilling was possible by extending the protocol time (after Sol 2) across the time-constrained drilling simulation flow (Fig. 7), and consistently with other multi-reagent cleaning protocols (Miller et al., 2008; Eigenbrode et al., 2009).
Across the 6-day simulation, we tested NaClO-activated H2O2 for more effective microbial reduction. After squirting 3% H2O2 on a drill tip sprayed with NaClO, the resulting singlet oxygen (1O2) sterilant agent—decontaminated the hardware 30 times faster than bleach alone to levels achievable during the extensive 6-h deep cleaning in the lab (Table 4).
The activation of H2O2 by bleach is an easy and relatively safe, field-effective procedure for reducing bioburden after only a 2-min exposure, compared with the long exposure required by concentrated bleach alone (10–20′), 10% bleach (3 h), 70% IPA (1 h), or 3% H2O2 alone (>3 h).
The redox reaction between the oxidizing hypochlorite ion (OCl−) and the reducing H2O2 agent forms water (H2O), chlorine ion (Cl−), and 1O2 (Held et al., 1978; Greer, 2006) such as:
The disinfection action was due to the excited state of 1O2, which contains more energy than ground oxygen (Held et al., 1978; Wirz, 2009). 1O2 unfolds proteins (e.g., Del Maestro et al., 1980; Davies, 2003) and kills bacterial and eukaryotic cells (Dahl et al., 1987; Djimeli et al., 2014; Taewan et al., 2019) with microorganism inactivation proportional to 1O2 exposure.
Low-temperature chemical sterilants such as 35% H2O2 Gas Plasma fumigation, Ethylene Oxide (EtO), and Ozone (O3) are all absolute biocides commonly used in clean rooms (e.g., Gordon et al., 2012). However, these techniques are inapplicable in the field because they are highly toxic and require complex equipment (e.g., containment chambers, deep vacuum draw zapping, gas monitoring systems) and several hours-exposure (Meszaros et al., 2005; Gordon et al., 2012).
Cleanliness verification and contamination knowledge
We used two methods for cleanliness verification, the ATP Assay, and the SOLID instrument microarray immunoassay technology, as a novel approach for contamination knowledge of the hardware background. We could not use the culture-based NSA, which enumerates (plate counting) dry heat-surviving aerobes endospores after a 72 h growth beyond the ARADS real-time timeline.
In addition, the NSA overlooks non-cultivable cells, underestimating the total microbial burden, spore-forming strict anaerobes (Clostridium), and extremophilic archaea microorganisms of PP concern (e.g., Moissl-Eichinger et al., 2015). For these reasons, Bernardini and Venkateswaran (2016) co-analyzed ATP and NSA data from the MSL spacecraft.
They proposed the ATP assay (per NASA-HDBK-6022, 2010) as the benchmark threshold for spacecraft surface cleanliness, that is, 2.3 × 10⁻¹¹ mmol ATP/25 cm2 (or <0.9 fmole/cm2). Several methods exist to detect and characterize hardware contaminants matrix-assisted laser desorption/ionization-time of flight, but complex setups limit their use in the field. Other real-time tools designed for field detection, such as Minion Oxford Nanopore for DNA and RNA sequencing (10 min) or the LAL assay for Gram-negative microorganisms, have been used (post-mission) in field trials (Eigenbrode et al., 2009; Cockell et al., 2018).
However, the LAL assay does not detect only viable microbes and requires more extended sample processing and analysis time than the ATP Luminometry assay, that is, 15–60′ versus 15 s −5 min, respectively. Their application is beyond the scope of the quick disinfection validation requirement across the six Sols.
In situ real-time and ultrasensitive ATP assay can detect 0.1 fmoles of ATP on hardware surface as an independent molecular proxy for active bioburden/microbial biomass, viable spores, or intact recently dead cells. Further, the ATP synthase FI signal was consistent with ATP's post-cleaning hardware background levels. This independent verification corroborates the effectiveness of in-sim cleaning and microbial reduction.
Further, the fluorescence signal against the protein biomarkers was higher than that against the whole cells. The two signals decoupled, likely because more fragmented cellular materials versus whole cells were present in the wind-carried dust (aeolian particles subject to photo-oxidation) and subsurface sediment.
SOLID immunograms of whole cells, proteins, and other cellular compounds provided an effective verification tool to self-check against false positives contaminating science measurements. One limitation is that the immunoassay does not differentiate between living or dead cells (a forward contamination risk), but ATP assay co-analysis addresses this gap.
Finally, GC-MS and high-performance liquid chromatography identify background contaminants in space hardware (contamination knowledge) with substantial time elapsed between sampling and analysis. For the ARADS hardware contamination knowledge, we used SOLID immunograms; such an approach could reduce time and costs for the simultaneous assessment of forwarding and science contamination.
Role of hardware surface features or geometry
The space hardware design, geometry, surface topography, porosity, and roughness can affect contamination control effectiveness. For the same reason, these features can determine bioburden retention, dislodgement, transfer, or dispersal to the environment. Specifically, the stainless-steel arm-mounted Phoenix-like scoop interior was difficult to access due to its 90° edges between the interior surfaces. The surface of the external scoop blade was more accessible but rougher than the scoop interior. As a result, the scoop's interior and edge exhibited a post-cleaning threshold background higher than the funnels.
Similarly, the TRIDENT drill bit's finishing was three-dimensional (3D) printed and etched to augment the recovery of drilled fines. This drill bit surface was rougher than the drill string (Fig. 2), resulting in high bioburden background (Fig. 6G, H and Tables 4 and 5). However, an augmented cleaning protocol reduced the background.
Mitigating solutions could include current good manufacturing practices such as “coving” and polished surface finishing. Coving minimizes geometry-related contamination by replacing 90° and 3D corners with curved surfaces and improves sterilization of clean rooms and hospital floors. Curved corners inside the scoop surfaces (inner walls) would prevent the accumulation of biological contaminants or drilled material (conducive to cross-contamination) and facilitate the pathway to cleaning and swabbing.
An additional implementation could use state-of-the-art mirror-like polished surfaces or the drill and SHTS. Electropolishing ensures ultra cleaning of embedded contaminants in Titanium alloys for tissue engineering and surgical implants, which must be sterile before use. In addition, electropolished microscopically featureless surfaces reduce microbial adhesion and surface contamination (Bagno and Bello, 2004; Oshida, 2007; Shimakura, 2007; Tajima et al., 2008).
Contamination pathways
We propose a conceptual model (Fig. 13) that includes the significant contamination pathways highlighted by data analysis and tests on ARADS materials (hardware, sediments, air samplers, etc.). Interestingly, the study of airborne materials delivered two surprising results: a higher-than-predicted environmental contamination (pathway 8–9 to 3–4); and a lower-than-expected anthropogenic one (pathway 1–2 to 3). The emerging picture is fascinatingly complex due to the intrinsic nature of the Atacama Desert.
Environmental sources of airborne contaminants
Wind-transported mineral dust can efficiently carry and disperse viable microbial life across the Atacama (Parro et al., 2011; and references therein). Whether this biomass constitutes an anthropogenic (human biome) or natural (environmental) contaminant, a cross-contaminant, or a “native” element is not always clear to us or understood (Azua-Bustos et al., 2019, 2022).
Our tests revealed that airborne biomass represented an unusually high source of potential contamination, unexpected for the hyperarid core of the Atacama Desert. The high-intensity signal (>6000)—raised against aquatic microflora (Anabaena or Nostoc sp. cyanobacteria) in air samplers—points to a primary source of airborne biomass consistent with ATP data from the post-flooded Playa (106 cells/g sediment, ATP cell equivalent) and the airborne biomass—5–22 amoles/(cm2·day) ATP, across the 6-Sol mission (Fig. 12).
This suggests an unexpectedly high viable biomass lateral transfer from an unusual upwind source, that is, desiccated ponds within the nearby Playa a few tens of meters away from the drill site and 300–400 m from Basecamp Collector 1. Such an airborne sedimentary biomass represents a potential source of high contaminant (also very close to one of the drill sites) that could have entered robotic sampling and analysis if not mitigated.
Ephemeral water-induced microflora population growth is uncommon and represents a novel phenomenon for the hyper-arid core of the Atacama Desert due to the recent onset (in 2015) of climatic change bringing yearly storms and floods to the Atacama region (Fernández-Martínez et al., 2019; K. Warren-Rhodes 2022, unpublished data). However, bursts of microflora growth can occur after extreme rain events in arid hot desert environments worldwide (e.g., Cirés et al., 2017; and references therein; Bonaccorsi and McKay, 2022).
The weaker-intensity signals (≤1000) with LDChip point to secondary low-intensity sources other than the Playa. For instance, transport from the Atacama soil microenvironments containing strong acids (Quinn et al., 2005) could explain the detection of bacteria from acidic habitats (Parro et al., 2011; and references therein). Similarly, the detected archaea Methanobacterium could have been wind-carried from the same source of the aquatic cyanobacteria, the post-flooded Playa.
Methanogenesis can occur at the water-sediment interface, in anoxic micropores of fine-grained clay-rich sediments during floods. Gammaproteobacteria (Pseudomonas) and their associated biomarker are found in extreme desiccated environments (Parro et al., 2011), including Atacama playas and alluvial fan samples (Fernández-Martínez et al., 2019), subsurface hypersaline habitats (e.g., Salar Grande). The anaerobic Shewanella inhabits heavy metal-contaminated (iron, lead, and uranium) environments (mine activity). All these environments such as the GP Site (Fig. 4D, E) exist in closed or distal proximity to the ARADs' drill sites and can provide biological contaminants of concern depending on their relative abundance and viability.
The hyper-arid Atacama's surface soil is mostly extremely low in viable microbes and associated biomolecular compounds (e.g., Cameron, 1969; Navarro-Gonzalez et al., 2003; Skelley et al., 2005; Warren-Rhodes et al., 2006; Cáceres et al., 2007; Cockell et al., 2008) with biomass increasing with some depth (e.g., Fernández-Martínez et al., 2019). A few exceptions can include extensive surface source areas such as salars, microflora-colonized halite fields (e.g., Davila et al., 2010; Parro et al., 2011; Wierzchos et al., 2006, 2011; Davila and Schulze-Makuch, 2016), groundwater-fed oases with sparse vascular plants (Fig. 4D, E), or microflora blooms in response to sporadic and transient rain events (e.g., Schulze-Makuch et al., 2018; Uritskiy et al., 2018; 2019).
Airborne dust from the sources cited earlier might carry contaminants to drilled samples or enter the analytical instrument, thus confusing the scientific results. A secondary but no less impactful contaminants are “fresh” and degraded fossilized biomolecules, for example, ATP, Phospholipid fatty acids (PLFA), DNA, lipopolysaccharides (LPS), which the hyper-arid surface soil of the Atacama Desert can preserve well (Lester et al., 2007; Bonaccorsi et al., 2010; Powers et al., 2018; Wilhelm et al., 2018).
Anthropogenic airborne contamination
We monitored the flux of airborne contaminants during the in-sim operations to evaluate the anthropogenic contamination risk (expected high) to the Playa environment and ARADS science. The biomass flux at the anthropogenic-dominated basecamp area was higher [22.1 amoles/(cm2·day) ATP] than that monitored by Collector 1, 250 m away from basecamp [5.2 amoles/(cm2·day) ATP; non-anthropogenic sources].
This flux of ATP-based biomass was higher than the average ATP background of the (post-cleaning) SHTS hardware, that is, 0.9 ± 1.1 to 3.6 ± 4.5 amoles/cm2 (Table 5), implying that we effectively mitigated the delivery of airborne contaminants to the hardware. However, at Basecamp, LDChip200 detected microorganisms naturally occurring in the Atacama Desert (airborne from proximal and distal potential source areas).
Only a few taxa detected with a weak signal (FI <1000) (B. subtilis spores; Streptomyces spp., spore, and mycelium) might be related to the human microbiome. However, B. subtilis and Streptomyces spp. are usual bacteria from soil (also common in the Atacama). B. subtilis spores can survive for up to 15 months in the hyper-arid core of the Atacama Desert with 15% survival (Dose et al., 2001). Streptomyces is a filamentous actinobacterium naturally present in the soil. This alkaliphilic and thermophilic genus is found in arid, hypersaline, or heavy metals-rich extreme habitats (Kampfer et al., 2014), including the hyper-arid Atacama (Santhanam et al., 2012; Goodfellow et al., 2017).
Streptomyces can also be found in a healthy human microbiome (a rarer occurrence), where culture-based techniques have overlooked its presence due to low growth, but recent molecular-based studies highlighted its presence in the gastro-intestinal (Bolourian and Mojtahedi, 2018) and respiratory tracts (Huang et al., 2015; Herbrík et al., 2020) and in the healthy skin (Gallo and Hooper, 2012). In particular, skin flakes are rich in somatic cells (5 × 10⁸ cells shed every day or 2 × 10⁷ cells every hour (Weschler, 1978)) and associated microbes.
For instance, the hand microbiota varies ∼4 × 10⁴ to 4.6 × 10⁶ CFU/cm2 (Leyden et al., 1987; Messager et al., 2004) and 1 × 10⁷ culturable bacteria per cm2 (Fredricks, 2001); yet these culture-based estimations are likely underestimates (Edmonds-Wilson et al., 2015; and references therein).
On a cautionary note, Bacillus and Streptomyces taxa could come from the environment rather than human biome contaminants. However, we cannot discard this hypothesis either.
An explanation for the weakness of the airborne anthropogenic signal could be inefficient sampling (under-sampling) of airborne particles, that is, the swab was vertically placed to collect dust particles directly from the air. Another possibility is that the anthropogenic contaminants (skin, clothing, and droplets) shed by the human crew during operations were non-deposited, removed after deposition, or dispersed by airflow and wind. Further, the airborne dust particles could stick to the swab's surface or bounce back (depending on wind speed, particle mass, and impact angle), going undetected.
Contamination risk levels
We evaluated the contamination risk type for the ARADS subsystems and operation based on field contamination tests' results (Figs. 5–8) and the effectiveness of the ARADS mitigation practices in reducing the risk. Contamination risk levels are semi-quantitative, ranked “Null” to “Very high” before and after applying mitigation practices (Table 11).
Result-Driven Contamination Risk Matrix Ranked (0–5) for Each of the Atacama Rover Astrobiology Drilling Studies Subsystems and Operations Before and After (Values in Brackets) Mitigation
Result-Driven Contamination Risk Matrix Ranked (0–5) for Each of the Atacama Rover Astrobiology Drilling Studies Subsystems and Operations Before and After (Values in Brackets) Mitigation
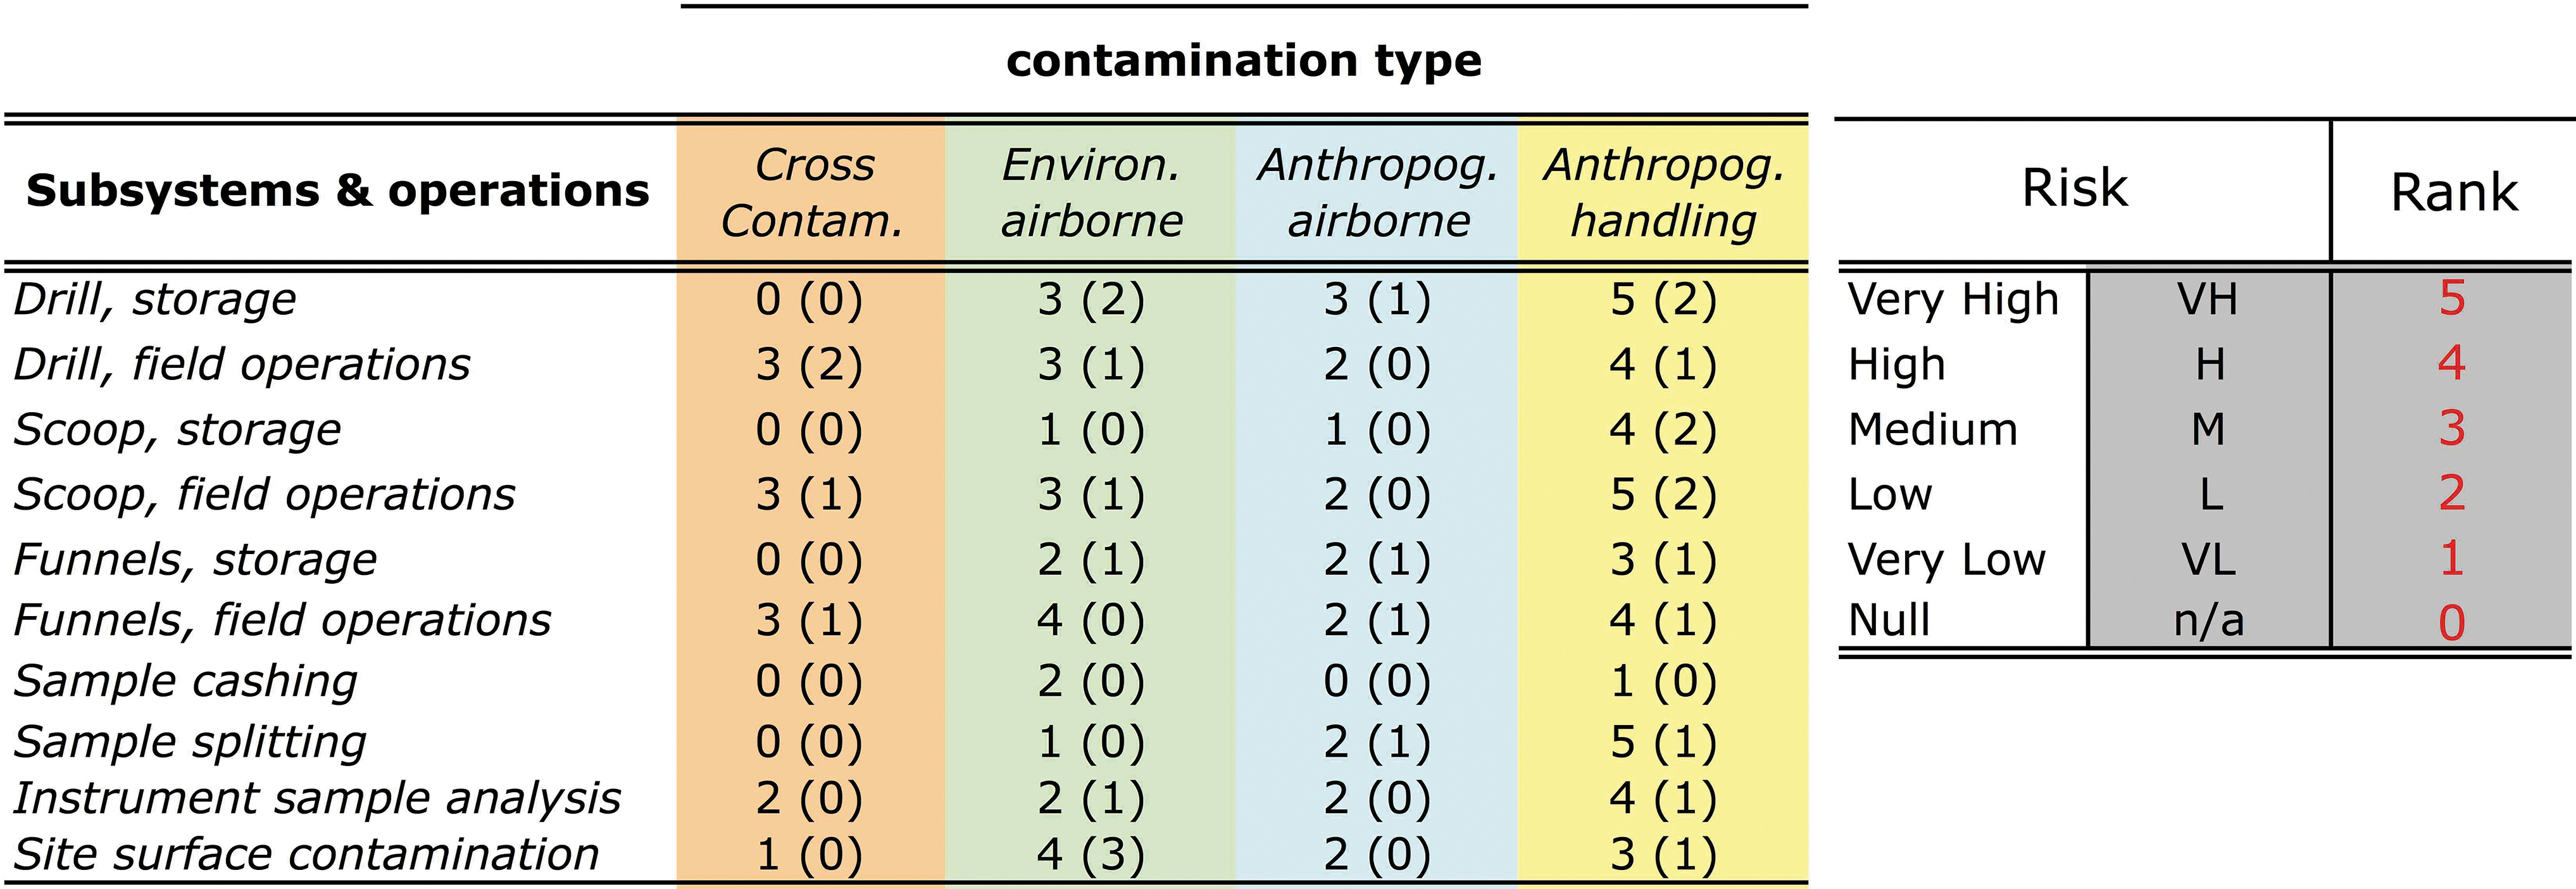
See Section 6.3.
We could distinguish two categories of anthropogenic contamination, airborne and direct transmission. In Section 6.2.2, we already discussed the minor risk posed by airborne anthropogenic contaminants that were lower than expected at Basecamp.
The anthropogenic contamination by direct contact (direct touch, handling during storage) on pre-cleaned (unmitigated) hardware was initially very high (∼1–2 fmoles cm2 ATP), corresponding to ca. 1 to 2 × 10³ cells/cm2 hardware (Ranked 4–5 in Table 11). The deep cleaning (out-sim) reduced the bioburden contamination to attomolar levels per cm2, which the five-step protocol could also maintain in-sim, consistently with the immunogram data.
The immunoassay fluorescent background for ATP Synthase (protein) was barely detectable consistently with the ultra-low ATP background signal. The two indicators demonstrated a very low risk of anthropogenic forward contamination by viable cells, spores, or recently dead cells via hardware, as summarized in Fig. 13 conceptual model (contamination pathways: [1–3, 5]).
Drill site contamination risk
Based on immunoassay data, we identified a high flux of naturally occurring environmental contaminants from a proximal source of sedimentary biomass upwind. Thus, we re-evaluated the pre- post-mitigation contamination risk from high (Rank 4) to very low (Rank 1) after mitigation (Table 11).
Four microflora taxa were detected in air samples or as a component of background residue in post-cleaned in-sim hardware. The first three, that is, the aquatic Anabaena and Nostoc, could be contaminants from locations near (a post-flood playa) and far, that is, the lesser arid hypolithic cyanobacteria, Xenococcus. Traces of the xerophilic Chroococcidiopsis sp. (FI <700) appeared only in the drill bit (Sol 6), perhaps from some cross-contamination between subsurface horizons. See Fig. 13 (contamination pathways: [8, 9 to 3, 4]).
Hardware to sample-cross-contamination risk
We can now evaluate the hardware to sample cross-contamination transfer risk based on post-cleaned (Table 4) ATP bulk bioburden residue and 200 other microbial biomarkers targeted by the LDChip transferable from the STHS chain (Drill-to-Scoop-to-Funnel) to samples analyzed in each Sol (assuming 100% contamination transfer). For example, in Sol 2, the cumulated exogenous bioburden potentially entering Hole 1 and H-1 samples analysis, was equivalent to 7.9 fmoles (PISCES) and 4.3 fmoles (SOLID) compared with the deep-cleaning background of 1.3 fmoles ATP (bulk value).
In Sol 3, (Hole H-2) was 3 fmoles; in Sol 4, (Hole H-3) was 3.8 fmoles; and in Sol 5, (Hole H-4) was 4.8 fmoles. In Sol 6 (Hole H-5), the contamination transfer potential to analysis was only 2 fmoles ATP.
Over 50% of taxa detected in the post-cleaned ARADS hardware were absent in the airborne samples. None were related to the human microbiome, consistent with cross-contamination within the putative subsurface bioma. Less than 50% of taxa detected in the same hardware were also present in the air samples as background environmental contaminants rather than cross-contaminants. However, in most cases, the immunogram signal was low and not correlated with the ATP assay, indicating only a minor potential for cross-contamination.
At least until putative martian life is unequivocally detected on Mars, the cross-contamination of drilled samples would not pose a prominent concern. Discovering that life does exist on Mars at 1–2 m below the surface is more relevant than determining its precise stratigraphic location at 1 or 2 m depth (Miller et al., 2008). On Mars, the primary concern is to avoid forward contamination carried to Mars on the spacecraft and to ensure we do not detect terrestrial life (false positives).
General contamination transfer to cores
The ARADS simulation provided an opportunity to integrate ATP luminometry and immunoassay technology for putative life detection of subsurface materials. The comparison between cellular biomarkers in cores and the dedicated (decontaminated) hardware informed whether anthropogenic or environmental contaminants entered the drilled samples analysis (Fig. 12).
Most positive signals found in background hardware were absent in the cores, with a few exceptions. The IVG6C1 (Thermus termophilus), NifD1 and NifD3 (Nitrogenase Fe-Mo protein) antibodies exhibited values below 300 of FI (classified as traces), whereas the IVK1S2 (Anabaena sp.) and GPBCA (Gammaproteobacteria ancestral beta-lactamase) yielded peak values (>1000) for the SHTS hardware background. Overall, the minimum FI signal values in boreholes H1–H4 cores are 100–200, whereas the maximum FI (peak values) are around 8000 and 15,000 depending on the depth and the core, which showed 5–10 times more peak FI against hardware background swabs (Max FI peaks: ∼1500–1600). Therefore, they should not interfere consistently with the signals found in cores.
FI peak values for cyanobacteria in all cores range between 800 and 1800, with no significant differences between cores. For programmatic reasons, we used only background data of funnels and scoop for the September 19 drill test (Core H4S1). Cores H1S1, H2S1, and H3S1 were drilled before September 19, but there are no SOLID data for Core H5S1 (September 20, Sol-6) that we could compare with the same hardware assayed the same day.
ATP background cumulated in Drill-to-Scoop-to-Funnel in Sol 2 (Hole 1, H1S) throughout Sol 6 (Hole 5, H5S) ranged from 4.8 fmoles in Sol 5 against 300–800 fmoles/g ATP in Hole H4S1 to 2 fmoles ATP in Sol 6 (80–400 fmoles/g ATP in Hole H-5) against levels of total biomass (80–800 fmoles/g ATP). The post-cleaning hardware ATP background (cumulated values in Table 4) was 40–250 times lower than the ATP biomass in the cores (Supplementary Table S3) and did not interfere with the biomarker signal in core samples.
Biomass estimation in geological materials
We used the same ATP luminometry system (Section 4.3) for the in situ semi-quantitative estimation of viable biomass in ARADS materials.
ATP is a widely studied universal biomarker that Parnell et al. (2007) defined as “the most convenient and reliable method for estimating total microbial biomass in most environmental samples.” Intracellular ATP is abundant only in metabolically active cells.
However, after the cells' death and lysis, ATP drops and diffuses into the external environment (as free ATP), rapidly degrading (Holm-Hansen and Booth, 1966). ATP-based biomass methods, including benchtop luminometer systems, are used for aquatic (Holm-Hansen, 1973; Karl, 1980; Bochdansky et al., 2021), desert soil (Cowan et al., 2002; Dyckmans et al., 2003; Mogul et al., 2017), the deep biosphere (Kimura et al., 2003), or other extreme environments (Amador et al., 2014; Gentry et al., 2017; Powers et al., 2018) where estimating biomass with other methods is time-consuming or difficult.
Hand-held ATP luminometry systems were primarily designed for real-time ATP swab assay for hardware cleaning verification, hygiene monitoring in clean rooms, the food processing industry (e.g., Siragusa et al., 1996; Zwartkruis et al., 1999), and health care facilities. For a simplified approach to real-time life detection in extreme environments, we used hand-held luminometers with preloaded ATP liquid sampling devices (lab-on-the-chip) (Bonaccorsi and Stoker, 2008; Stoker et al., 2008; Cockell et al., 2018; Powers et al., 2018; Pandey et al., 2019). This field technique enables a quick collection of biomass data (a semi-quantitative) comparable to other detection techniques (Gentry et al., 2017; Powers et al., 2018).
There are caveats about the accuracy and feasibility of the ATP-biomass technique (e.g., Fairbanks et al., 1984) as the sole source of information, as ATP is a better indicator of metabolic activity than a biomass indicator. Estimates of microbe numbers are organism-specific (Stanley, 1986; Hattori et al., 2003) and can depend on cellular metabolism, activity, dimension, and cell thermal stress (Bajerski et al., 2018).
For instance, fungi and algae have larger cells and contain up to 103-fold higher levels of ATP than bacteria (Cowan et al., 2002; Venkateswaran et al., 2003; and references therein). However, the uncertain biomass estimation based on cell-equivalent of specific biomarkers (e.g., DNA, LPS, PLFA) using a non-culture-based approach is common and unavoidable, given the complexity of microbial communities in extreme environments.
Further, uncertain biomass estimation on Earth's poly-extreme environments is of lesser concern than false positives and negatives. Determining that active life exists, detecting attomolar levels of ATP biomarker (or any other biomarker) is more relevant than knowing its absolute cell-equivalent amount.
More recently, the role of ATP has undergone another paradigm shift. Bochdansky et al. (2021) examined literature data and re-evaluated ATP as a biomass indicator. ATP is not only the universal energy currency for all life but also stabilizes the intracellular protein at millimolar concentrations (Patel et al., 2017). Cytoplasmatic ATP is present in much higher concentrations than required for supporting energy metabolism alone. The average cellular ATP levels are constant among taxonomic groups of aquatic microbes and ∼10-fold changes in growth rates of cultured microorganisms.
Another issue is the preservation mechanisms of free ATP in the environment, which is still being investigated today. Venkateswaran et al. (2003) found up to three times higher free ATP in clean rooms implicating the preservation of extracellular ATP. On the other hand, Cowan et al. (2002) reported that the ATP half-life in Antarctic soils was a few hours; the in situ concentration of extracellular ATP was low and did not affect the living biomass estimate.
However, free ATP can be stable in sterile environments, whereas in life-rich environments, bacteria uptake depletes this ATP pool as a phosphate source (Nescerecka et al., 2016). Free ATP can persist in biologically poor hyper-arid soil/low-biomass systems but would decompose rapidly in an aqueous solution of the same soil—during the dilution process (this study, see Supplementary Figs. S2 A–E).
We measured intracellular microbial ATP (viable biomass) and extracellular free ATP to address what has been stated earlier. Last but not least, the physicochemical characteristics of the geological materials challenge ATP detection. Clay particles and salts can interfere with microfluidic wet chemistry-based life detection techniques (including, but not limited to, the ATP Assay), resulting in false negatives (kinetic-inhibited), false positives (by reaction's enhancement), and low signal-to-noise ratios.
To obtain more reproducible and comparable biomass data during ARADS, we mitigated these issues by customizing matrix-specific protocols for detecting ATP in astrobiology-relevant clays and salt-bearing samples. Our solution for reducing interference with the L-L chemistry and increasing the signal-to-noise ratio was to augment bulk sample mass for water extraction (e.g., 1–2 to 30–50 g), dilution of water extracts, and sample spiking.
This approach succeeded in detecting active biomass in biologically lean Atacama sediment and rocks samples consistently to previous work, that is, ≤102 cells equivalent g−1 (Powers et al., 2018), clay-salts mixtures (Cockell et al., 2018), as well as biomass-rich briny materials, that is, ∼109 cells equivalent g−1 (Bonaccorsi et al., 2010; Pandey et al., 2019).
Conclusions
As part of the 6 days ARADS field project in the hyperarid core of the Atacama Desert, we developed a CCSI for the SHTS hardware. The core of the CCSI was cleaning all drill and sampling hardware to remove organic material and microorganisms, followed by testing to quantify final contamination levels. In addition, the CCSI included field staff training to mitigate anthropogenic contamination during operations, off-hours rover and instrument maintenance, airborne contamination monitoring, and post-mission sampling for lab analyses. Based on this work, we highlight several areas of innovative elements and draw the following conclusions.
Effective protocols used efficiently in a field setting can be developed based on relatively simple cleaning agents: DW, Acetone, IPA, and 3% H2O2-activated 5% sodium hypochlorite, in place of more hazardous chemicals (e.g., 30% H2O2) that might be used in a clean room.
Final and documented, hardware contamination levels can be reduced to ∼1–2 attomoles/cm2, equivalent to ca. 1–10 CFU/cm2 in about 40 min, with 60–100% hardware background ≤3–4 bacterial cells/cm2, the threshold limit for Class <7 aseptic operations.
When the instrument suite includes life detection instruments, these can be used to test forward contamination levels on planetary surfaces. This was demonstrated here with the immunoassay-based SOLID instrument.
Effective contamination control must include a broad approach to source-to-sink contaminants, sample system hardware design (arm-mounted scoop, drill bit), and technologies (selecting fabricated hardware surfaces, teflon coatings on metal surfaces) that mitigate contamination risks.
A novel application of life detection immunoassay technology to re-assess the contamination risk in the Atacama. While perhaps specific to the Atacama Desert site, we found that the significant source of contamination was airborne environmental contamination at levels of ∼5 and ∼22 amols/(cm2·day) of ATP, with a high-intensity immunoassay signal (FI: ∼6000) against aquatic cyanobacteria rather than anthropogenic and cross-contamination in the drilling and sample handling process.
The ARADs mission, using the prototype Icebreaker drill and basic decontamination methods, was designed to mimic a Mars drilling mission focused on life detection. The CCSI provide and tested an approach to ensuring that the results of a similar mission on Mars are not confused by false negatives (or positives), external or cross-contamination, and to satisfy the formal COSPAR PP requirements for a life detection (Category IV) mission in a Special Region on Mars.
The ARADS novel approach expands cost-capped and time-effective standard contamination practices into NASA PP for robotic drilling life detection missions also applicable to the human exploration of Mars and the Solar System.
Future Work
The existing robotic SHTS hardware is a fully functional mock-up model close to operating remotely for future terrestrial experiments and Mars missions Technology Readiness Level (TRL 6), with minor cross-contamination impact of samples. The ARADS sample handling system could be heat- and chemically sterilized before launch with a minor design modification.
Cross-contamination could affect chemostratigraphy analysis, whereas life detection results could be reliable, providing that false positives could be prevented and recognized. Finally, the contamination risk reduction for the ARADS Drill and SHTS is transferable to life detection missions to sample ice-cemented ground over the northern plains of Mars, such as Icebreaker (McKay et al., 2018), ExoMars, or to Icy worlds, namely the Enceladus Orbilander (McKenzie et al., 2022) and the Europa Lander (Hand et al., 2017). Protocol testing is underway in non-cleanroom facilities such as the NASA Ames Vertical Gun Range (e.g., Willson et al., 2018) to support astrobiology life-detection mission simulations for Ocean Worlds applications.
Footnotes
Acknowledgments
The authors wish to thank the ARADS project team, without whose efforts this paper would not be possible.
Author Disclosure Statement
No competing financial interests exist.
Funding Information
This work was funded in part by the National Aeronautics and Space Administration PSTAR program project number 14-PSTAR142-0032 to Brian Glass. ARADS was a project under the auspices of the NASA PSTAR (NNH14ZDA001N-PSTAR) Program led by Dr. Mary Voytek. Support of the SOLID/LDChip instruments came from Grant number RTI2018-094368-B-I00 (SOLID) and MDM-2017-0737 under the Unidad de Excelencia “Maria de Maeztu” Centro de Astrobiología (CSIC-INTA) program by the Spanish Ministry of Science and Innovation/State Agency of Research (MCIN/AEI/5 10.13039/501100011033) and also with support from “ERDF: A way of making Europe.”
Supplementary Material
Supplementary Information
Abbreviations Used
Associate Editor: Jack Mustard