
Abstract
Manganese (Mn) oxides are ubiquitous in nature and occur as both biological and abiotic minerals, but empirically distinguishing between the two remains a problem. Recently, electron paramagnetic resonance (EPR) spectroscopy has been proposed for this purpose. It has been reported that biogenic Mn oxides display a characteristic narrow linewidth in contrast to their pure abiotic counterparts, which is explained in part by the large number of cation vacancies that form within the layers of biogenic Mn oxides. It was, therefore, proposed that natural samples that display a narrow EPR linewidth, ΔH pp < 580G, could be assigned to a biogenic origin. However, in poorly crystalline or amorphous solids, both dipolar broadening and exchange narrowing simultaneously determine the linewidth. Considering that the spectral linewidth is governed by several mechanisms, this approach might be questioned. In this study, we report synthetic chemical garden Mn oxide biomorphs that exhibit both morphologically life-like structures and narrow EPR linewidths, suggesting that a narrow EPR line may be unsuitable as reliable evidence in assessment of biogenicity.
1. Introduction
The search for diagnostic differences between biogenic and nonbiogenic geomaterials is a critical and enduring challenge in paleobiology, geobiology, and astrobiology. Manganese (Mn) oxide-bearing materials have long been recognized as an important potential target in this search and more recently have been identified on Mars (Lanza et al., 2016). On Earth, some Mn oxide-bearing materials have been interpreted as biogenic on the basis of both morphological and compositional evidence.
Mn(II) is the most abundant oxidation state of Mn ions <pH 8.5, and abiotic oxidation to Mn(IV) is kinetically disfavored at circumneutral pH or below boiling point (Hem and Lind, 1983; Tebo et al., 2004). Nonetheless, Mn oxides are ubiquitous on Earth's surface, for example, as deep-sea and lacustrine Mn nodules, desert varnish, or grain coatings in soils. Many bacteria and fungi are capable of oxidizing Mn(II) much faster than abiotic procedures, leading to the widespread opinion that Mn oxides found in nature are largely microbially produced (Wehrli et al., 1995; Tebo et al., 2004). However, unambiguously determining the biogenicity of natural Mn oxides remains problematic.
Several studies have shown that Mn oxides produced biologically in the laboratory are generally poorly crystalline, nanoparticulate layered birnessites ((Na,Ca)0,5(Mn(III)Mn(IV))2O4∙1.5H2O) with hexagonal symmetry, low Mn(III) content, and many cation vacancies (Villalobos et al., 2003; Jürgensen et al., 2004; Webb et al., 2005). Among other techniques, Raman spectroscopy can be used to identify certain Mn oxide mineral phases as well as the oxidation state of Mn in various types of samples (Bernardini et al., 2021).
Electron paramagnetic resonance (EPR) spectroscopy was recently proposed by Kim et al. (2011) as a method to distinguish between biotic and abiotic natural Mn oxides. They reported that EPR spectra from biogenic Mn oxides all showed a linewidth (ΔH pp) narrower than 580 Gauss, whereas all abiotic mineral and synthetic samples showed much broader spectra (>1200 G). Structurally, a large number of site vacancies, that is, octahedral MnO6 missing a central Mn ion, were revealed as a common feature in the biogenic Mn oxides. Thus, the site vacancy was proposed to be responsible for the narrow linewidth, and ΔH pp < 580 G was suggested as a marker for differentiating between biogenetic and abiotic Mn oxides found in nature and in the rock record.
EPR spectroscopy detects unpaired electrons in paramagnetic species such as transition metals and free radicals in the presence of magnetic fields. Electrons are charged particles and, therefore, have an inherent angular momentum known as spin. As such, they have a magnetic dipole moment, and they behave in a particular way in the presence of a magnetic field. In the absence of an external magnetic field, the spin orientation of unpaired electrons of a paramagnetic species is random, in other words, it is not quantized. When introduced into a magnetic field, the spin of the electrons will align themselves parallel (−1/2) or antiparallel (+1/2) to that field, thus splitting the energy between these two spin states (Zeeman interaction).
In EPR analysis, the sample is placed in a resonator and irradiated with microwaves. The magnetic field (B) is scanned to the point wherein it resonates with the microwave frequency (v) to get the g-factor, which is characteristic for a certain magnetic species. The gyromagnetic correction factor, g, of any paramagnetic ion can be calculated by hv = gμBB, where h = Planck's constant and μB = Bohr magneton constant.
Paramagnetic species act as individual magnetic dipoles, and when clustered close together, the intermolecular interactions such as dipole–dipole or spin exchange are stronger, which results in a broader linewidth (Kijlstra et al., 1997). Conversely, if the Mn ions are separated by cation vacancies or other nonparamagnetic spacers, the opposite effect occurs, and linewidths will be narrower. A fundamental factor that affects the linewidth, therefore, is the concentration of the paramagnetic centers. Considering various line-broadening mechanisms, solid materials in a poorly crystalline or amorphous state have broad EPR spectra mainly due to large g-anisotropy and dipole–dipole interaction, both three dimensional (Ovchinnikov and Wight, 1995; Ross, 1965).
Furthermore, it has been known that solid state EPR can also exhibit exchange narrowing (Atsarkin et al., 2000). As such, the question arises whether an abiotic or synthetic Mn oxide can produce an EPR spectrum in which the linewidth is within the region defined as narrow. The answer to this question would be crucial for the reliability of using EPR linewidth as a tool in the assessment of Mn oxide biogenicity and subsequently motivated this study.
Filamentous morphologies in the rock record are commonly interpreted as signs of life, among which some are composed of Mn (Kilias et al., 2007; Neubeck et al., 2021). The biogenicity of such structures has been disputed due to their similarity with laboratory grown biomorphs (e.g., García-Ruiz et al., 2002, 2003 vs. Schopf, 1993; McMahon, 2019 vs. Dodd et al., 2017 and Bengtson et al., 2017). The abiotic self-assembly of silicate/carbonate and metal (oxyhyrdr)oxides into structures that resemble filaments of microbes has been extensively studied (García-Ruiz et al., 2002, 2003; McMahon, 2019).
One such abiotic self-assembly process is known as chemical gardens. The procedure involves dissolving metal salts in an alkaline silicate or carbonate solution, which forms pockets of acidic solution surrounded by a semipermeable gelatinous membrane. Continued dissolution of the salt creates internal pressure on the membrane, which eventually ruptures, and jets of fluid spurt out that act as a template for the precipitation of metal (oxyhydr)oxides on the interior of the enclosing membrane (Barge et al., 2015; McMahon, 2019).
The resulting biomorphs may mimic microbial filaments, with uniform or tapering diameter, circular cross sections, hollowness, twisted and straight trajectories, branching, anastomosis, and nestedness (McMahon, 2019). Chemical gardens, therefore, represent an important branch of research in the topic of origin and early life on Earth and Mars (Ding et al., 2016; Sainz-Díaz et al., 2021).
Mn chemical gardens have previously been made using Mn chloride where the initial salt was compressed into wafers, or by using NaOH and MnCl2 solutions in a microfluidic device (Cartwright et al., 2011a, 2011b; Batista and Steinbock, 2015), but none have been subjected to EPR study. In this study, we report on the results of an experimental study in which chemical garden filaments were produced using Mn sulfate seed salt grains. Raman spectroscopy and X-ray diffraction (XRD) analyses were conducted on the chemical garden products. A leucoberbelin blue (LBB) dye was also used to further assess the oxidation state of the Mn oxide products. The filaments were analyzed using EPR spectroscopy to investigate the reliability of EPR linewidth as a signature for identifying natural biological samples.
2. Materials and Methods
2.1. Chemical gardens
Silicate and carbonate solutions were prepared to a concentration of 100 g/L with concentrated sodium silicate solution (reagent grade, 1.39 g/mL Na2SiO3.H2O; Sigma-Aldrich) and sodium carbonate monohydrate powder (reagent grade, 124 g/mol Na2CO3.H2O; Emprove Essential, Merck), respectively. The initial pH recorded was 11.6 for both solutions. Manganese (II) sulfate monohydrate powder (99+%, extra pure, MnSO4.H2O; Acros Organics) was manually dispersed into beakers containing 10 mL of either solution. These were left overnight to react after which the solution was removed with a pipette. The remaining solids were rinsed four times with deionized water and subsequently left to dry overnight at room temperature.
2.2. Scanning electron microscopy
Microphotographs were taken using a Leica MZ75 optical light microscope mounted with a Nikon digital sight DS U1 and NIS-Elements F2.20 software. The scanning electron microscope (SEM) used was a high-vacuum Zeiss Supra 35VP (Carl Zeiss SMT, Oberkochen, Germany) field emission SEM, equipped with a VPSE low vacuum detector and a Robinson back scatter detector located in Geocentrum, Uppsala University. Images were taken with a beam setting of 4 kV and an aperture of 30.0 μm at an optimal working distance of 8.5 mm. The software ImageJ was used to approximate the diameters of filaments and objects in the images.
2.3. Raman spectroscopy
A Renishaw inVia Raman microscope was used from the Ångström Laboratory at Uppsala University, Sweden. Analysis was carried out using a green light Ar laser (λ = 532 nm) with total power 84 mW. The Renishaw Wire 3.4 Software was used to process the data. A 20 × magnification was used to observe the samples, and laser power was kept at 1% (0.84 mW) when possible, to avoid heat alteration of the sample (Bernardini et al., 2019, 2021). Where no spectra were obtained, the laser power was increased to 5% (4.2 mW).
Accumulation time varied between 50 and 100 s and exposure time varied between 1 and 10 s. A silicon wafer was used as a reference with an intense Raman line at 519 cm−1. Reference spectra for the samples were accessed through the RRUFF project database using the program CrystalSleuth. The reference spectra and band values presented by Bernardini et al. (2021) were used in the discussion of our results.
2.4. LBB reagent
To create the primary LBB reagent, 0.04 g of LBB (65%; Sigma-Aldrich) was added to 100 mL of 45 mM acetic acid (VWR Chemicals) to get a final concentration of 974 μM (Jones et al., 2019). This was left overnight to dissolve at 4°C in the dark. Drops of the dye were subsequently put onto the rinsed samples and left for a few minutes to observe any reaction. A control was made by adding a few drops into distilled water.
2.5. X-ray powder diffraction
Phase identification was carried out on powdered samples using a Bruker D8 Advance Twin/Twin diffractometer with CuKα radiation Lynxeye XE-T PSD detector at 40 kV and 40 mA. Samples were ground by hand with ethanol in a pestle and mortar to reduce and homogenize size before dispersing in a uniform film on a sample holder. Data were collected and interpreted using the program CrystalSleuth to identify the d-spacing of the main peaks along with a combination of the RRUFF database and the American Mineralogist Crystal Structure database (AMCSD) (Downs and Hall-Wallace, 2003).
2.6. EPR spectroscopy
Capillary tubes with diameter 1.35 mm were filled with a small amount of sample (11.1 mg for the silica sample and 3.9 mg for carbonate), and these were weighed on an analytic balance to normalize signal per milligram. Measurements were carried out on a Bruker EMX-micro spectrometer with an EMX-Premium bridge and an ER4119HS resonator. The following parameters were used for all measurements: microwave frequency 9.877 GHz, microwave power 0.2 mW; modulation frequency 100 kHz, modulation amplitude 10 G; detector receiving gain 58 dB, time constant 10.24 ms, and conversion time 40.96 ms with spectral resolution of 1024 data points. Room temperature conditions were kept at all times.
3. Results
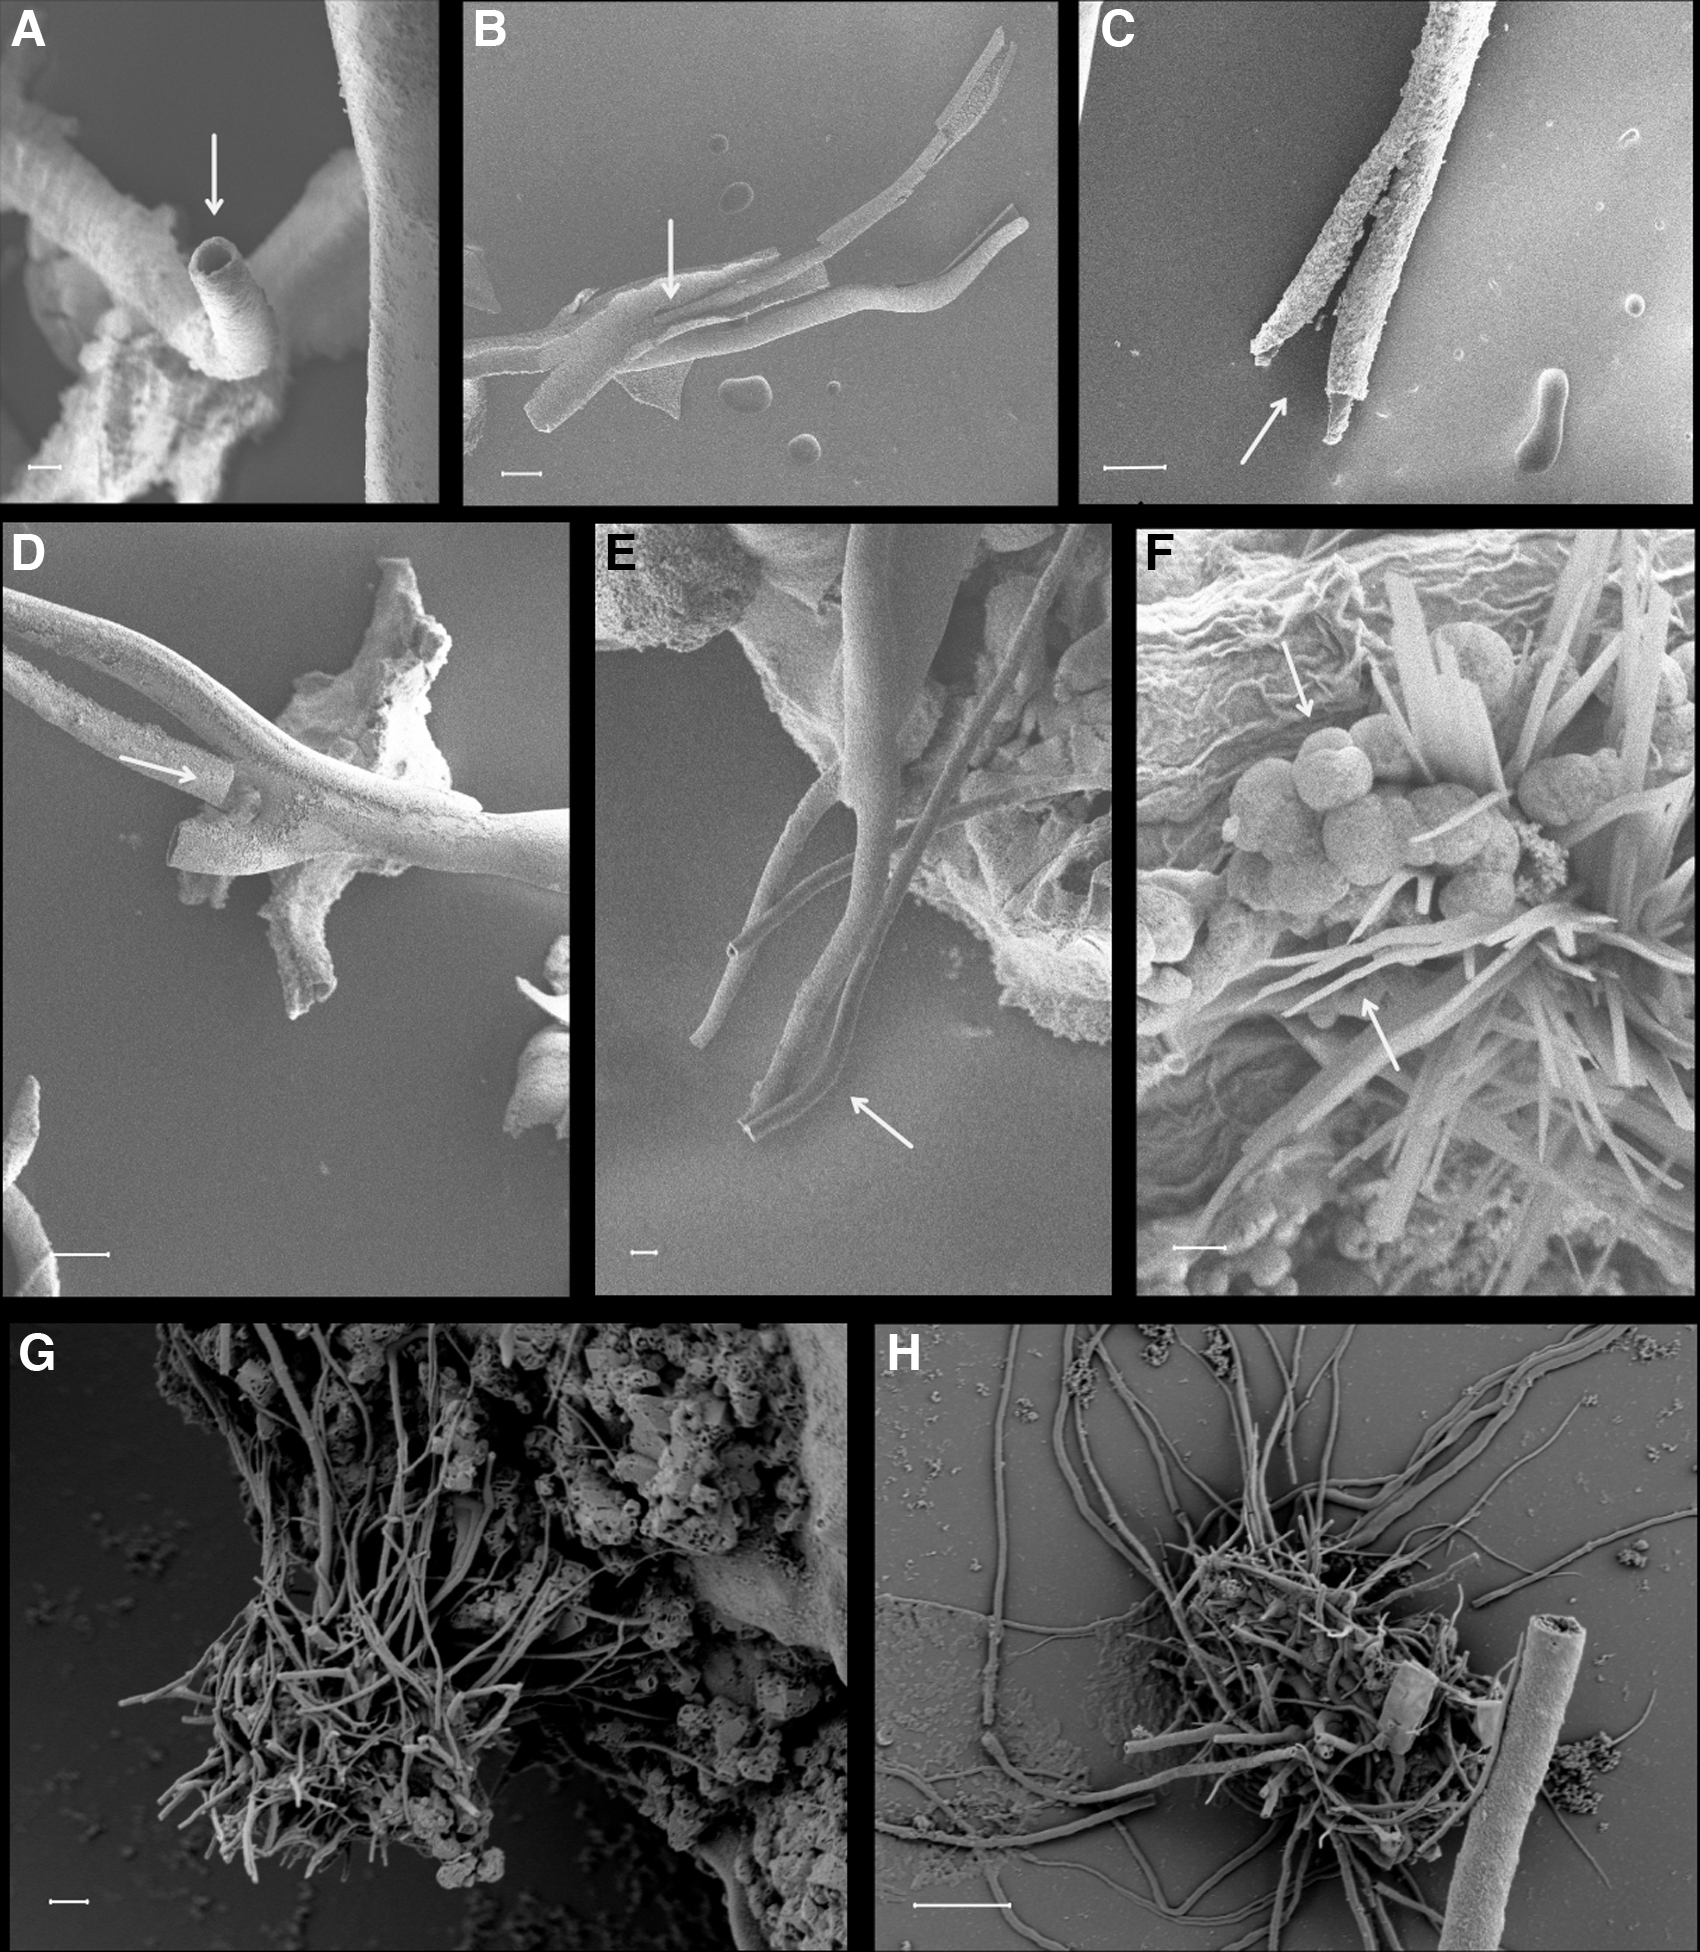
The Mn sulfate grains placed in silica solution began forming hollow filaments within the first few minutes of reaction (Figs. 1 and 2). They steadily grew along the bottom of the beaker and perpendicular to the grain surface (Fig. 1A–C). Initially white, the filaments turned darker with time becoming first a light brown and then progressing to black. Size varied a lot, from a few hundred microns (>200 μm) in diameter and several millimeters in length (Fig. 1A–D) to 1 μm and less in diameter and a few tens of micrometers in length (Fig. 2G, H).
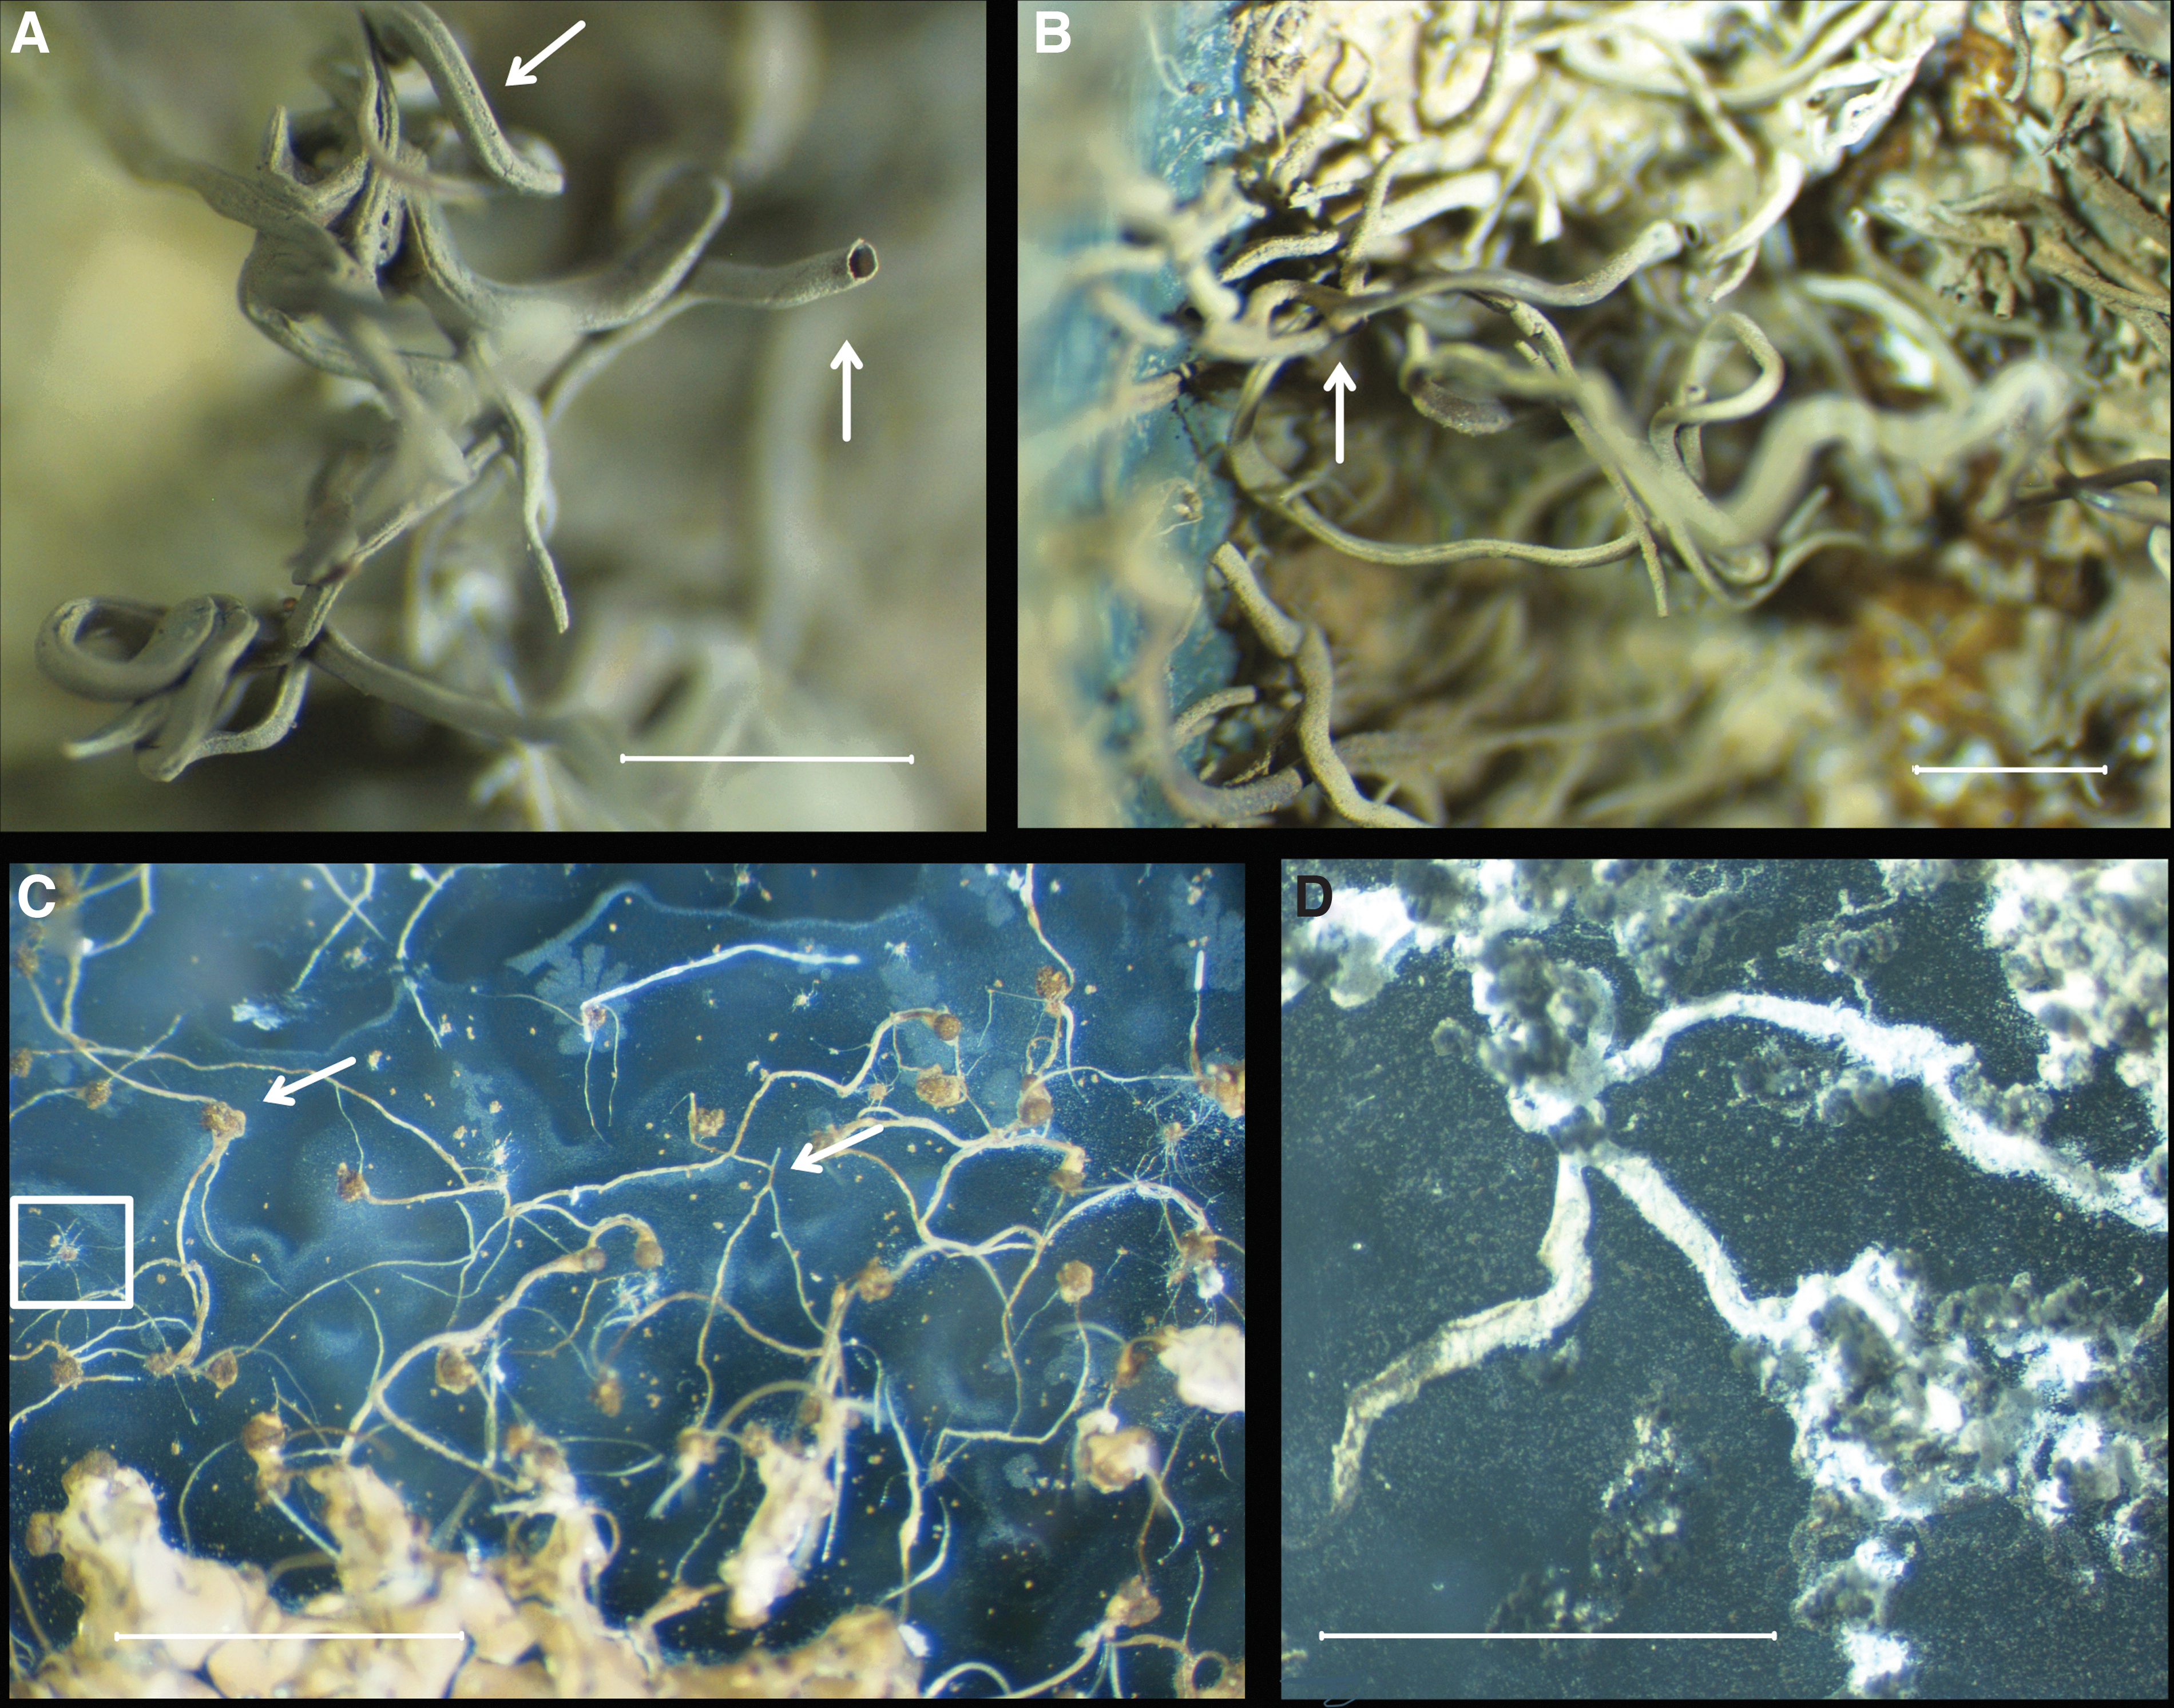
Microphotographs of silicate
SEM pictures of silicate
The filaments were often constant in diameter (e.g., Fig. 2E), but the larger filaments tended to taper out at the extremities. Occasionally they had longitudinal striations that ran the entire length of the filament (Fig. 1A). The latter features are not consistent with bacterial fossils but may rather imitate worm tubes (Georgieva et al., 2017).
Experiments with carbonate solution mostly produced botryoidal globular growths and crude fragile filaments that grew along the bottom of the beaker (Fig. 1D). The globular structures seen in SEM images (Fig. 2F) are typical of natural rhodochrosite, MnCO3 (Jakobsen and Postma, 1989).
Figure 3 shows the Raman and XRD spectra obtained from the two different chemical gardens. The carbonate samples produced spectra identified as rhodochrosite in both cases (Graf, 1961; Getenet et al., 2020). The chemical gardens grown in silicate solution were more difficult to interpret and produced three significant peaks at 470, 630, and 1005 cm−1 in the Raman spectra. Bernardini et al. (2021) found that for Mn oxides in which Mn is organized into polyhedrons, the three main oxidation states II, III, and IV have vibrational modes detectable by Raman spectra. These vibrational modes show up in the spectra as distinct wavenumbers, regardless of their structure.
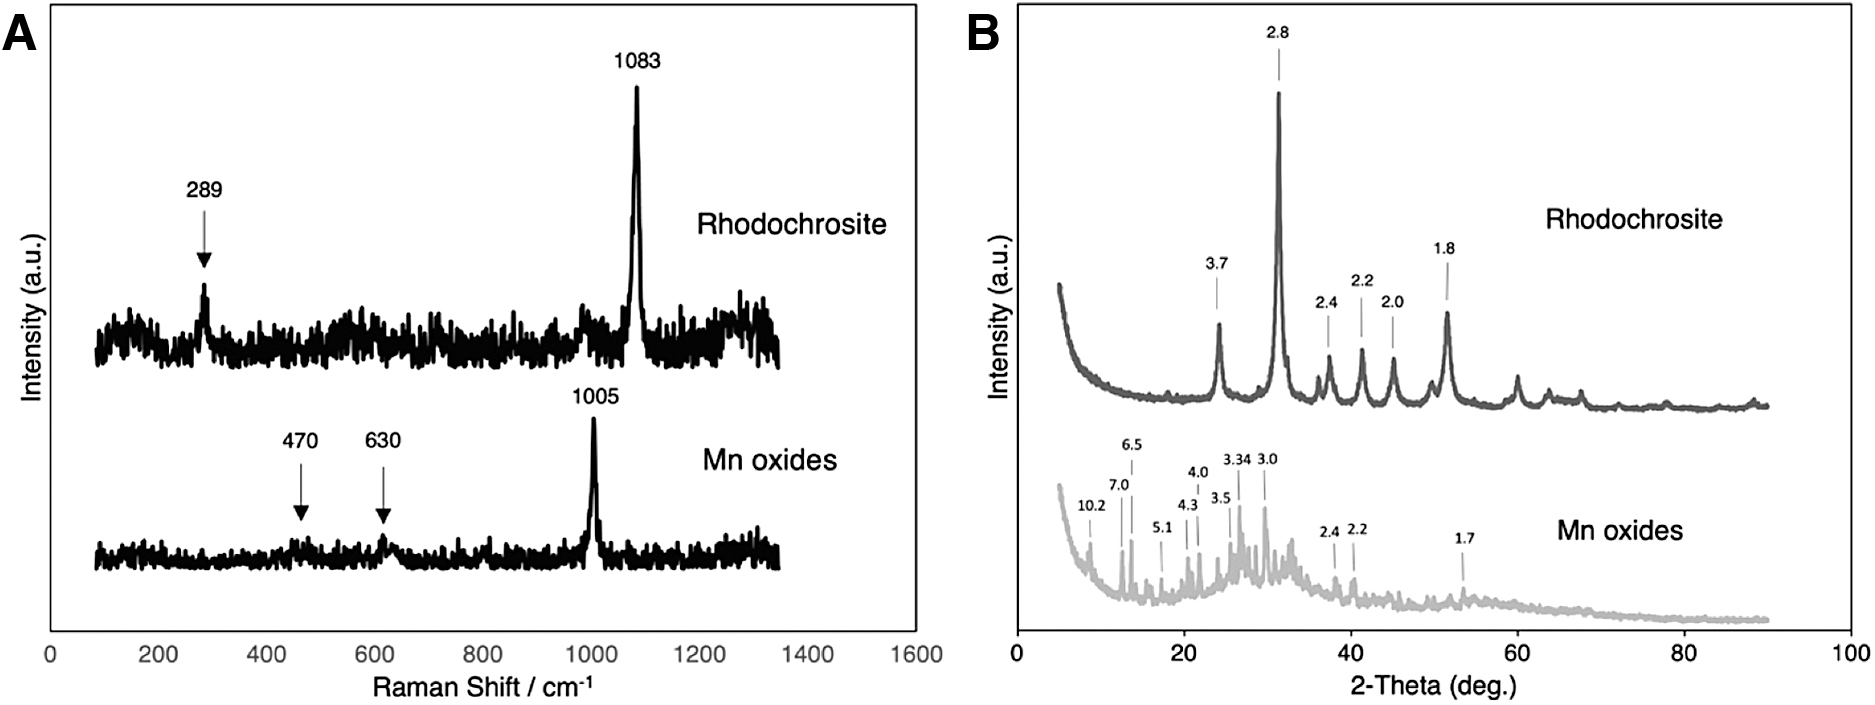
These are ∼530 cm−1 for v 1 Mn(II); ∼580 cm−1 for v 1 Mn(III); and ∼630 cm−1 for v 1 Mn(IV), where v 1 is the stretching frequency of the most frequent Raman active mode. Thus, the wavenumber increases with the oxidation state of the central cation. Based on these observations, the 630 cm−1 band in the silicate garden samples reflects the presence of the v 1 Mn(IV) vibrational mode. The band at 1005 cm−1 is likely the v 1 vibrational mode of sulfate considering the seed metal salt was a Mn sulfate (Sergeeva et al., 2020), whereas the band at 470 cm−1 is most likely related to silica (Barba et al., 2008).
The XRD pattern shows peaks at ∼7.1 and ∼3.7 Å that fit reasonably well with the (d 001) and (d 002) basal planes in birnessite (Drits et al., 1997; Atkins et al., 2014). However, the characteristic commonly broad peaks at ∼2.4 (d 100) and ∼1.4 Å (d 110) are missing (Drits et al., 1997). The ∼10 Å d-spacing in combination with a weak ∼5 Å d-spacing could be suggestive of a 10 Å phyllomanganate or a 3 × 3 tunnel structure todorokite (Cui et al., 2010; Atkins et al., 2014). Peaks at 3.4 and 2.3 Å further support the presence of buserite, a 10 Å phyllomanganate (Cui et al., 2010), and those at ∼7.0, 6.5, 4.4–4.1, 3.0, 2.4, 2.2, and 1.7 Å support the presence of todorokite (amcsd 0001189; Post and Bish, 1988). The high-intensity peak at 3.34 Å is likely related to the (d 001) basal plane of quartz (Levien et al., 1980).
The LBB dye dropped onto the filaments in silica solution turned dark blue in a matter of minutes, indicating an oxidized state. The color change in the carbonate samples was much less evident and likely due to the alkalinity of the solution in which they grew (pH 11.6) rather than the oxidation of Mn. The control sample with LBB in distilled water showed no change in color.
The X-band EPR spectra of carbonate and silicate samples shared a very similar signal outline (Fig. 4) with narrow linewidths of 275G and 329G, respectively. Both displayed a rather featureless single line centered at g near 2 with g = 2.0005 for the carbonate and g = 2.0117 for the silicate samples (Fig. 4).
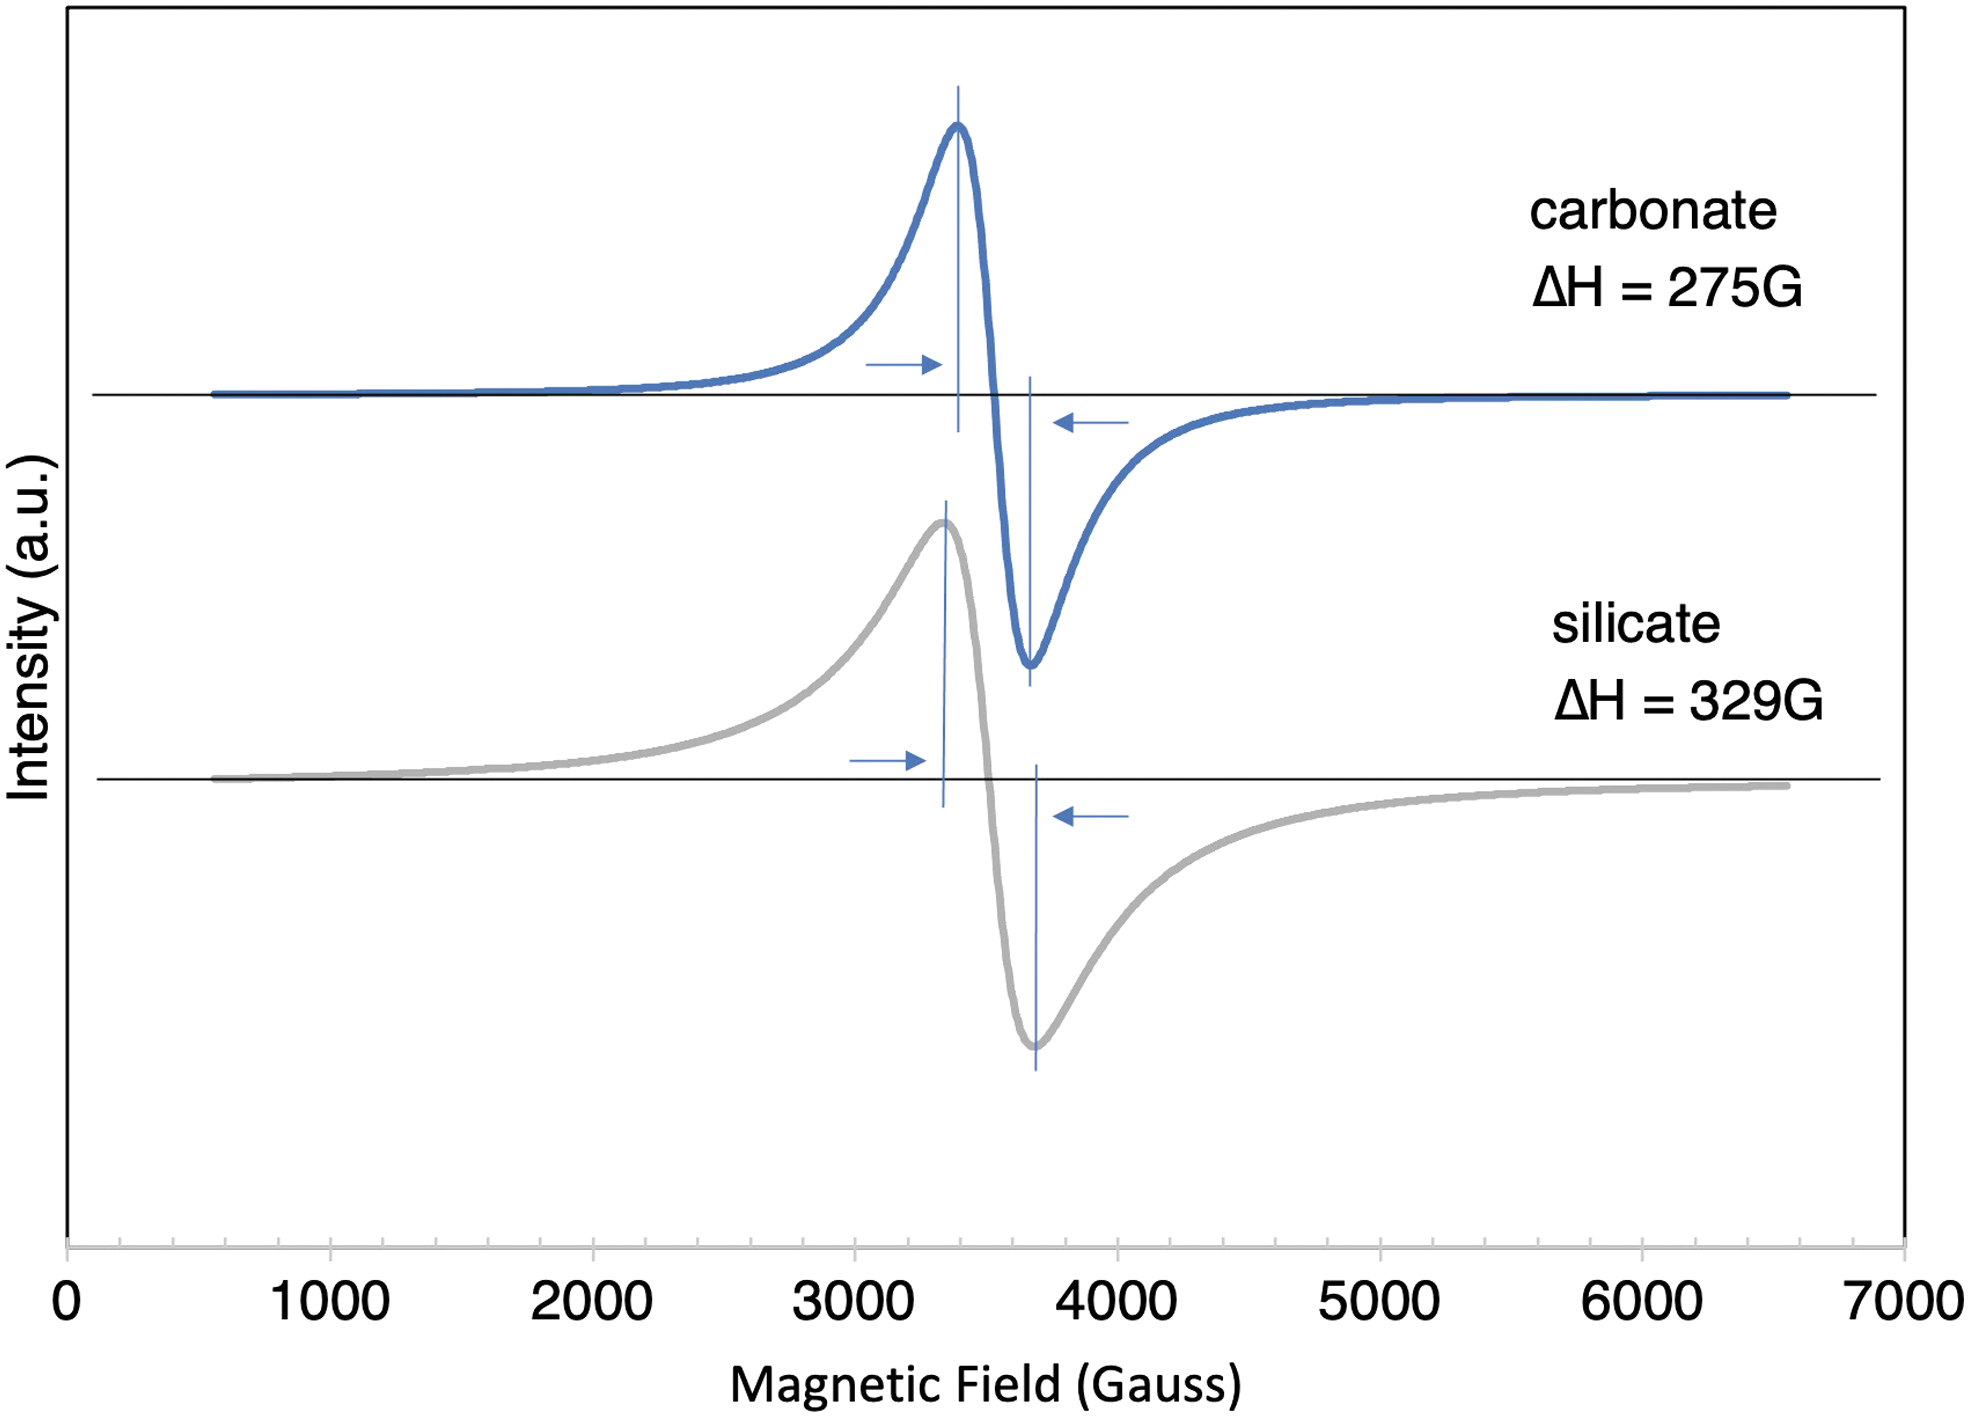
EPR spectra of precipitates formed in carbonate (top) and silicate (bottom) solutions. Arrows indicate linewidth. For carbonate the g-value is 2.0005, that for silicate is 2.0117. EPR, electron paramagnetic resonance. Color images are available online.
4. Discussion
The chemical garden filaments displayed many of the morphological features that are often associated with microbial fossils, including long twisted and straight trajectories, constant diameter, hollowness, circular cross sections, branching, anastomosis, and nestedness (Little et al., 2004; Dodd et al., 2017; Ivarsson et al., 2018; McMahon, 2019) (Figs. 1 and 2). A biological origin for Mn filaments in the rock record is difficult to justify on a morphological basis only. To date, there are no geochemical techniques that can decisively identify Mn oxides in nature as biomarkers at the structural or chemical level.
In fact, these structures are often reinterpreted as abiotic (Muscente et al., 2018). Grains with many radiating and branching filaments (Fig. 1C) resemble stellate Mn oxide structures found in nature that are interpreted by some to be a mineralized prokaryote [“Metallogenium,” Zavarzin (1981)] and by others to be a biological byproduct (Emerson et al., 1989). Similarly, some Mn oxidizing bacteria have been found to produce central bodies with many radiating filaments (Templeton et al., 2005), and fossil forms are known from the Gunflint formation (Knoll and Barghoorn, 1976). However, though the filaments may be in the same size range (<1 μm; Fig. 2G, H), the central body is generally much larger in the chemical gardens than bacterial cells.
It is also possible that bacterial filaments grow on grains of varying size, in which case the size of the central body in the chemical garden experiments is irrelevant. Several fossil filamentous structures have very similar size ranges as a few of the filaments presented here (Fig. 2G, H) and display branching and constant diameters (Kielemoes et al., 2002) or may be twisted and hollow (Thorseth et al., 2001). The variability of size in the chemical garden products may not be typical of bacteria, in particular since the range is quite large (1–200 μm in diameter).
Previous chemical garden studies where the initial grains were sieved to <63 μm yielded a majority of filaments with diameters between 2 and 10 μm (McMahon, 2019). Owing to the similarity of the Mn oxide filaments presented here and these previous experiments, it is expected that decreasing the initial grain size would have a similar effect on size range distribution.
In addition to bacteria, fungi are known to oxidize Mn (Tebo et al., 2004; Ivarsson et al., 2018). Many of the biogenicity criteria used for the identification of microbes, such as curvilinear growth trajectories, branching, circular cross sections, and nonuniform diameter, are reproduced in the chemical garden biomorphs here (Figs. 1A–C and 2A–H). Considering that some of the small clusters in the chemical gardens have filaments within the size range of hyphae (∼5–25 μm; Figs. 1C and 2A, E, and H), it is not implausible to think that many filamentous structures found in the rock record may very well be the products of abiotic reactions such as chemical gardens.
There are several examples of Mn-covered filamentous hyphae in the rock record (Owocki et al., 2016; Ivarsson et al., 2018), induced Mn oxide precipitation (Li et al., 2016), and actively Mn oxide-producing biofilms (Sjöberg et al., 2021). The chemical composition of fungal Mn oxides is known to vary according to which species produces them, and the same species may produce different Mn oxides in slightly different environments (Santelli et al., 2011). The initial product, in any case, seems to remain a nanoparticulate layered birnessite-type structure.
The far-from-equilibrium conditions for chemical gardens to grow are not abnormal and may occur in the deep subsurface, where serpentinization occurs, as it generates alkaline- and silica-rich fluids when altered (Garcia-Ruiz et al., 2017). Many microbial organisms may feed on the products of serpentinization such as H2 and CH4. Further ionic sources, among them Mn(II), are common in basaltic subsurface regions that constitute a supply of electron donors for microbes to survive. In addition, fungi are known to inhabit all sorts of subsurface environments, including some varieties that oxidize Mn (Ivarsson et al., 2015, 2018; Nuppunen-Puputti et al., 2021).
Though the pH of the experiments presented here (∼11.6) is not applicable to biological habitats, chemical reactions surrounding the formation of chemical gardens are known to induce fluctuations in the surrounding environment (Garcia-Ruiz et al., 2003). Thus, for periods of time the pH of the environment may lower to a more hospitable environment for many microbes and induce silica precipitation, whereas local pH increases may allow chemical gardens to grow and Mn oxides to precipitate.
Raman, XRD, and LBB all indicate within the silicate solutions that Mn was oxidized, primarily to Mn(IV). The XRD spectra reveal the presence of a polymorphic Mn oxide substance primarily composed of layered phyllomanganates such as birnessite and/or buserite along with tunnel-structured todorokite. All of these are typically associated with biological samples (Villalobos et al., 2003; Tebo et al., 2004; Webb et al., 2005; Feng et al., 2010; Santelli et al., 2011).
For the Raman spectra, the case could be made that the Mn oxides produced in this study are todorokite, considering the single peak visible at 630 cm−1, as has been observed from subsurface fungi (Ivarsson et al., 2015). In fact, it has been found that layered Mn varnishes on basalt have a Raman signal ∼620–630 μm (Israel et al., 1997), and these structures are often thought to be biological in origin (Staley et al., 1982; Taylor-George et al., 1983).
In the carbonate solutions, the combined data of globules in SEM, the Raman spectrum, and LBB indicate that Mn was not in fact oxidized but rather the Mn(II) reacted with the carbonate in solution to form rhodochrosite (MnCO3). The rapid precipitation of rhodochrosite took precedence over Mn oxidation, and as a result the pressure inside the membrane did not build up, that is, a chemical garden did not form in the same manner as in the silicate solutions. In fact, with a concentration of >1 ppm for Mn and 100 ppm of bicarbonate, MnCO3 will precipitate at a pH >7 (Hem, 1963). Since some filaments, however crude, did form along the bottom of the beaker, there is an indication that certain conditions of pH and concentration may allow for the formation of Mn chemical gardens in carbonate solution.
Neither the carbonate nor the silicate samples displayed the finger-print six-line spectrum for Mn(II) or Mn(IV) (Badalyan et al., 2008). The g-values of ∼2 are typical for Mn(II) and Mn(IV) (Badalyan et al., 2008). Their respective ΔH pp—width of 275G and 329G falls into the ΔH pp < 580G region, a value that has been defined as narrow and suggested as a possible criterion for the assessment of the biogenicity of natural Mn(IV) samples (Kim et al., 2011). Considering that all the narrow EPR spectra found by Kim et al. were represented by the biological samples, the 580G criteria seemed reasonable.
However, the results obtained in this study contradict this. Our results clearly demonstrate that even synthetic Mn minerals can show narrow EPR lines (Fig. 4). Although the rhodochrosite, which is an Mn(II) carbonate, is not a proper candidate, the silicate-grown filaments do contain Mn(IV) and are, therefore, considered as an abiotic counterpart to a Mn oxide biomineral. The EPR results presented here cast doubt on the reliability of this technique in using a narrow linewidth as a criterion for assessing the biogenicity of Mn oxides.
In solid state, a broad EPR spectrum is common. The line-broadening mechanism has been convincingly discussed by Kim et al. (2011), and the broad EPR spectra observed in their study have been well explained by the authors. It seems clear that synthetic and abiotic Mn oxides are prone to show broad and featureless EPR signals, which is also confirmed by others in the literature (Ovchinnikov and Wight, 1995; Atsarkin et al., 2000).
In amorphous or poorly crystalline solid state, g-anisotropy and dipole–dipole interaction are three dimensional, and both dominantly broaden the spectral lines simultaneously yet in a different manner (Ross, 1965; Ovchinnikov and Wight, 1995; Atsarkin et al., 2000). Examples can be found widely, including the natural abiotic and synthetic Mn oxides reported by Kim et al. (2011). Although the g-anisotropy is intrinsic, the dipolar interaction is very distance sensitive. It decreases with the rate of
Once the average distance
Comprehensibly, to be able to observe this six-line feature, the prerequisite is a magnetically dilute system wherein intermolecular interactions are negligible. In solid state, such a magnetically dilute example was reported by Badalyan et al. using an Mn-doped perovskite type oxide, where the hyperfine coupling constant A of ∼85–90 G gave the linewidth ΔH pp ∼450–450 G (Badalayn et al., 2008). Interestingly, this six-line feature was also observed by Kim et al. in their laboratory biological Mn oxide samples.
It was postulated by them that the presence of Mn(II) in the enzymatic component of the bacterial cells gave rise to the better spectral resolution shown, and not the Mn oxides. This six-line hyperfine feature was not reported where EPR was tested on fossilized fungal Mn oxides (Ivarsson et al., 2015).
In this study, the Mn oxides were synthesized in the presence of impurities similar to environmental conditions, where natural samples are often found as mixtures of Fe and Mn oxides or Mn oxides interspersed with other minerals. Synthetic Mn(II) in rhodochrosite and Mn(IV) in the silicate-grown filaments showed linewidths ΔH pp < 420 G yet with a concomitant loss of hyperfine structure. An attempt at line shape fitting reveals that a Lorentzian shape is the best fit for both the Mn(II) carbonate and the silicate-grown filaments Mn(IV) EPR spectra (Fig. 4).
Clearly, the spin systems underwent an exchange narrowing mechanism (Poole and Farach, 1979; Atsarkin et al., 2000; Barudžija et al., 2017). Furthermore, it is noted that the exchange narrowing effect renders the spectral resolution. Consequently, a narrow EPR line does not necessarily mean the system is spin dilute nor biogenetic.
Kim et al. (2011) reported that desert varnish and marine and lacustrine Mn nodules, which represent natural potentially biogenic test subjects for EPR analyses, showed narrower linewidths than synthetic Mn oxide analogs but broader than pure biotic analogs. This situation seems reminiscent of simultaneous dipolar broadening and exchange narrowing mechanisms. The prevailing opinion is that Mn oxidation occurs more readily in the biosphere. Phase changes in biologically produced Mn oxides are believed to take place quickly since the speed with which Mn oxidation occurs leads to the formation of metastable products (Mandernack et al., 1995).
Biological birnessites may transform into a pseudo-orthogonal structure (Webb et al., 2005) or todorokite (Feng et al., 2010), for example. In nature, it is rare to find pure Mn oxides, whereas site vacancy and/or cocrystallization with other mineral metal(s) or with semimetal(s) along with the Mn oxide formation is more likely to occur. As a result, the involvement of nonmagnetic sites in the Mn oxide structure leads to longer distances that separate two Mn ions and r increases. In many cases, dipolar broadening and exchange narrowing interplay.
Thus, the linewidth could span over an extensive range, from a couple of hundreds of Gauss as shown in this study and up to several thousands of Gauss reported earlier. Based on this factor, we are hesitant in accepting a narrow EPR line as reliable evidence for biogenicity and caution against its use in elucidating natural samples without additional structural analyses.
5. Conclusion
Silicate chemical gardens made with Mn sulfate seeds can form filaments that imitate many of the morphological features commonly associated with bacterial fossils. The poorly crystalline and nanoparticulate nature of Mn oxides makes them difficult to interpret under XRD and other similar analytical techniques, but Raman spectroscopy offers some insight into the oxidation state of the Mn ions present in the sample. The EPR linewidth character is also dependent on structural and compositional variations, in particular, the presence of other cations, minerals, or cation vacancies.
Although a broad line is common, a narrow line is also possible for abiotic and synthetic Mn oxides. Thus, a narrow line alone is insufficient evidence for determining the biogenicity of natural Mn oxides. The highly altered nature of fossil samples might additionally produce a change in the EPR signal. We would, therefore, caution against the use of EPR to identify ancient biological Mn oxides on Earth or on Mars.
Footnotes
Acknowledgments
Special thanks go out to Michael Streng (Uppsala University [UU]) for use of the SEM laboratory; to Tomas Edvinsson (UU) for Raman spectra; to Mikael Ottosson (UU) for XRD laboratory; to Roger Herbert (UU) for use of laboratory equipment; and to Graham Budd (UU) for the photo laboratory. The perspectives in this article were shaped in part by the authors' participation in EU COST Action CA17120 - Chemobrionics.
Author Disclosure Statement
No competing financial interests exist.
Funding Information
This study was funded by the Helge Axson Johnsons Foundation Grant No. F21-0040 and the Swedish Research Council Grant No. 05018. This work was also funded by The Royal Society of Edinburgh.