
Abstract
We show that solar irradiances calculated across Venus' clouds support the potential for Earth-like phototrophy and that treatment of Venus' aerosols containing neutralized sulfuric acid favor a habitable zone. The phototrophic potential of Venus' atmosphere was assessed by calculating irradiances (200–2000 nm, 15° solar zenith angle, local noon) using a radiative transfer model that accounted for absorption and scattering by the major and minor atmospheric constituents. Comparisons to Earth's surface (46 W m−2, 280–400 nm) suggest that Venus' middle and lower clouds receive ∼87% less normalized UV flux (6–7 W m−2) across 200–400 nm, yet similar normalized photon flux densities (∼4400–6200 μmol m−2 s−1) across 350–1200 nm. Further, Venus' signature phototrophic windows and subwindows overlap with the absorption profiles of several photosynthetic pigments, especially bacteriochlorophyll b from intact cells and phycocyanin. Therefore, Venus' light, with limited UV flux in the middle and lower clouds, is likely quite favorable for phototrophy. We additionally present interpretations to refractive index and radio occultation measures for Venus' aerosols that suggest the presence of lower sulfuric abundances and/or neutralized forms of sulfuric acid, such as ammonium bisulfate. Under these considerations, the aerosols in Venus' middle clouds could harbor water activities (≥0.6) and buffered acidities (Hammett acidity factor, H 0 -0.1 to -1.5) that lie within the limits of acidic cultivation (≥H 0 -0.4) and are tantalizingly close to the limits of oxygenic photosynthesis (≥H 0 0.1). Together, these photophysical and chemical considerations support a potential for phototrophy in Venus' clouds.
1. Introduction
We present photophysical and chemical arguments for the potential of phototrophy in Venus' clouds or the harnessing of light for metabolic purposes. We show that the wavelength-dependent photon fluxes calculated across Venus' cloud layers are sufficient for terrestrial-like phototrophy. With regard to cloud layer habitability, we also present novel interpretations of the refractive index values obtained in situ and sulfuric acid vapor abundance profiles obtained through radio occultation that suggest, due to the presence of partly neutralized sulfuric acid, that acidity and water activity values in Venus' aerosols may potentially be suitable for microbial growth.
2. Photophysical Considerations
Solar radiances in the venusian atmosphere were measured by the Venera atmospheric entry probes (Ekonomov et al., 1984) and Pioneer Venus Large Probe (Tomasko et al., 1980) during descents to the surface. Across the altitudes of 60–48 km (400–1000 nm; reported solar zenith angle 45°), normalized irradiances ranged from 840–1390 W m−2 or 1080 ± 250 W m−2 (Moroz et al., 1985). For this study, venusian fluxes were normalized from the reported solar zenith angle (SZA) to 0° and adjusted for anisotropic scattering by the clouds using Equation 5a from the work of Moroz et al. (1985). In contrast, irradiances of ∼930 W m−2 (400–1000 nm, reported SZA 48.19°) are found on Earth's surface (ASTM G-173-03, standard reference) when considering cloudless conditions and normalization through division by the cosine of the reported SZA. These comparisons reveal that irradiances in Venus' middle and lower clouds are holistically similar to those at Earth's surface, where photosynthesis is abundant, thus providing tangible support for the potential for phototrophy at Venus.
When considering phototrophy, wavelength-dependent photon fluxes are critical due to a dependence on photon stoichiometry. Photon fluxes, however, could not be accurately estimated from Venera 11 and 14 spectra (Moroz et al., 1982; Ignatiev et al., 1997), which were low resolution and available only in graphical format, or extracted from the integrated irradiances from Pioneer Venus (Moroz et al., 1985). Additionally, transmittance windows within the clouds could not be accurately established from Venera 11 and 14 spectra due to log-scale representations of the published spectra and reduced relative peak heights (Moroz et al., 1982; Ignatiev et al., 1997). Accordingly, we obtained radiances with high spectral and vertical resolution using radiative transfer calculations (Lee et al., 2016, 2019) based on a commonly adopted Venus cloud model (Ragent et al., 1985).
3. Calculated Irradiances
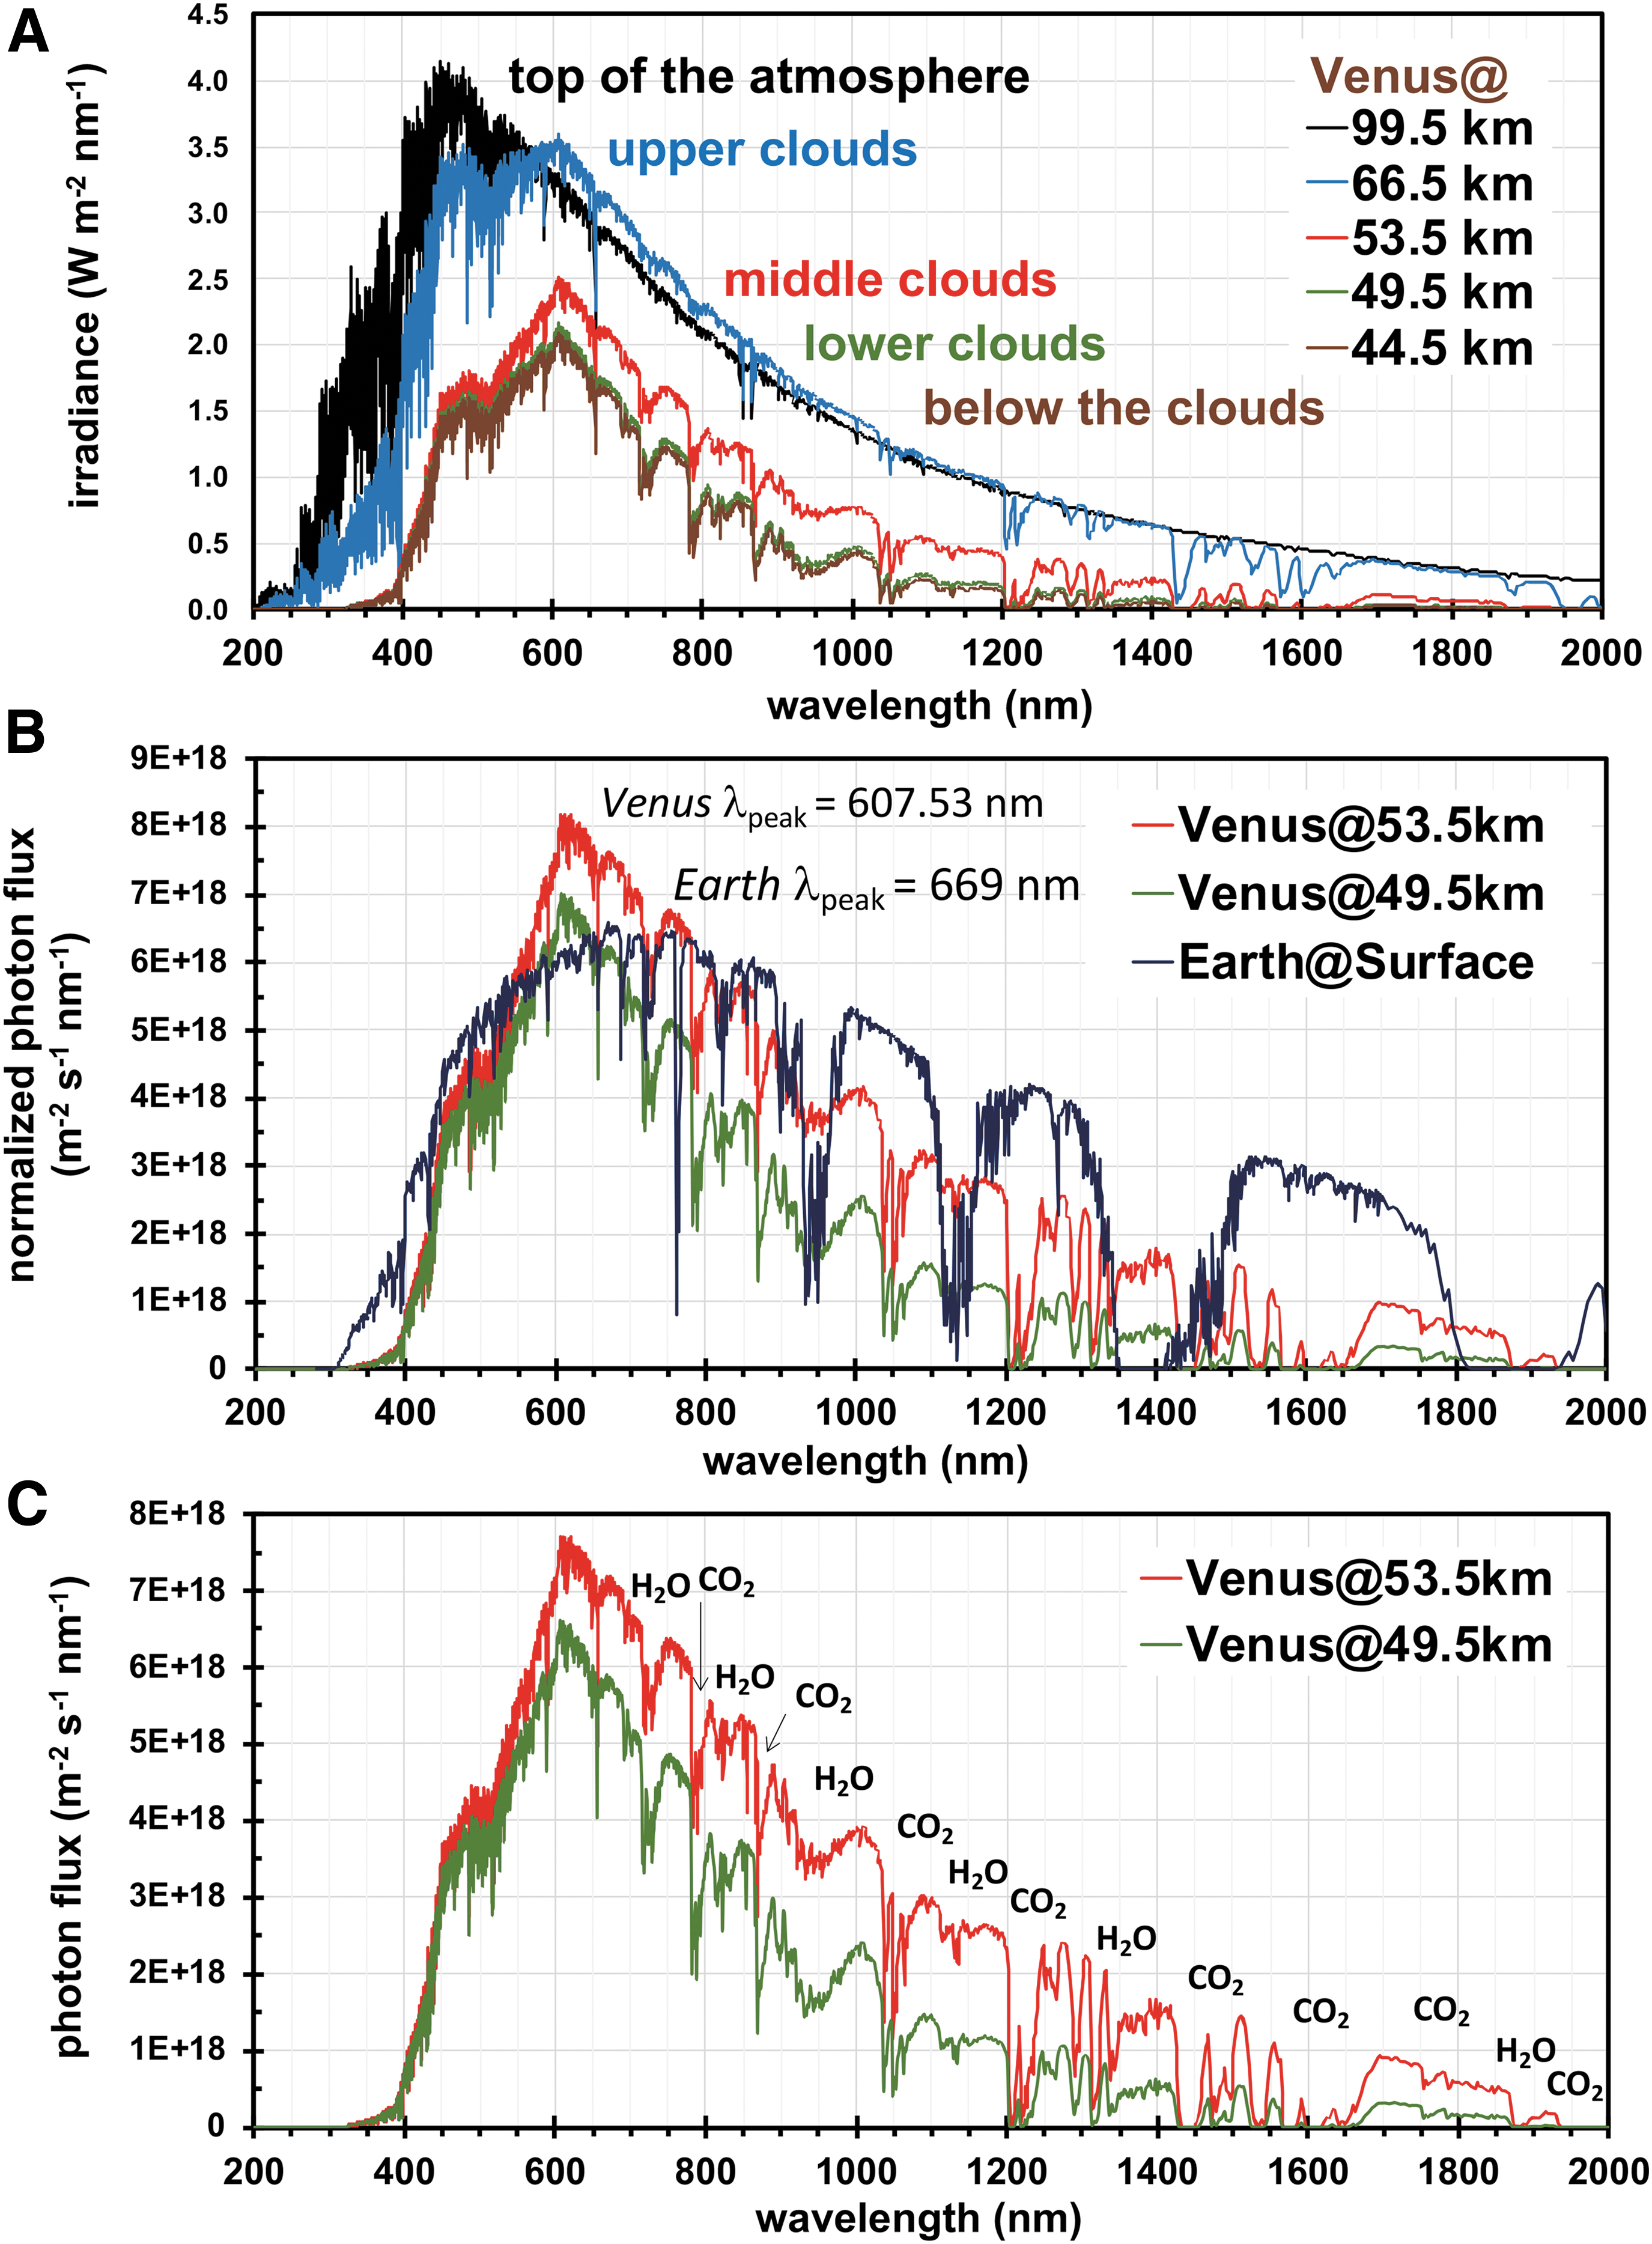
The radiative transfer calculations (local noon, SZA 15°) were described in the works of Lee et al. (2016) and Lee et al. (2019). For this study, we calculated solar irradiances and photon fluxes from 0.2–5 μm at 0.0001 nm resolution at altitudes ranging from the atmospheric tops (99.5 km) to the surface. Altitude profiles of the calculated spectra enabled delineation of the transmittance windows for solar irradiance within Venus' middle (56.5–50.5 km) and lower (50.5–47.5 km) clouds, along with identification of the wavelengths available for phototrophy.
Briefly, the calculations yielded spectra for downward direct and diffused irradiances that accounted for absorption and scattering by major and minor atmospheric constituents (CO2, H2O, N2, SO2, COS, HCl, CO, HF, H2S), along with scattering by aerosolized sulfuric acid, which has a minimal absorption at λ < 3 μm (Hummel et al., 1988). Optical depths ranged between 20 and 50 in the visible range, as observed in situ (Ragent et al., 1985), and the vertical structure for the equatorial clouds (optical depth of 31 in the visible range) was from the work of Crisp (1986).
To account for the ultraviolet and blue radiation absorbers within Venus' clouds that, to date, remain unidentified (Pérez-Hoyos et al., 2018; Titov et al., 2018), the absorbers were treated as (abiotic) components of the aerosols, where the single scattering albedo of the aerosols was forced to <1.0 between 310 and 780 nm across the altitudes of 57–71 km (Crisp, 1986). This treatment involved optimization to yield a scale factor of 1.18, which successfully fit the mean UV albedo at low latitudes (0–30°S) observed from 2006 through 2017 (Lee et al., 2019). The resulting spectra are shown in Fig. 1A for the top of the atmosphere (TOA, 99.5 km); the upper (65.5 km), middle (53.5 km), and lower (49.5 km) clouds; and below the clouds (44.5 km).
(
Comparison with integrated irradiances measured in situ revealed similar values after correction for SZA and anisotropic scattering, as described. Calculated and normalized irradiances across 450–1200 nm of 998 W m−2 (53.5 km) and 741 W m−2 (49.5 km) were very close or within error to averaged irradiances from Venera 11, 13, and 14 (450–1200 nm) of 1085 ± 86 W m−2 (55 km) and 719 ± 162 W m−2 (50 km). However, normalized values from Pioneer Venus across 400–1000 nm of 1150 W m−2 (55 km) and 956 W m−2 (50 km) were ∼20–30% higher than the calculated values (400–1000 nm) of 932 W m−2 (53.5 km) and 728 W m−2 (49.5 km). These differences are suggestive of variations in cloud opacity across in situ measures and/or an indication of lower in situ abundances (along the incoming beam) of the unidentified blue-radiation absorbers in comparison to our model. Similarly, the wavelength of peak irradiance at 607.5 nm (53.5 km) from our calculations was ∼10% higher than the value of 558 nm (52 km) recorded by Venera 14, which was suggestive of lower absorption coefficients and/or lower in situ abundances of the unidentified blue-radiation absorbers.
4. Comparisons of Venus and Earth Spectra
Expectedly, our calculations show that irradiances below Venus' cloud tops are substantially attenuated with decreasing altitude through absorption by SO2 (≤320 nm) and the unknown absorbers. Calculations conducted across the UV (200–400 nm) show that irradiances of 205 W m−2 at the TOA decrease by ∼97% to ∼6–7 W m−2 in the middle and lower clouds (Table 1). In comparison, Moroz (1983) reported a ∼90% reduction of in situ UV flux at 370 nm in the middle clouds to yield 0.6–2.8 W m−2 (58–48 km). Our calculations show that (A) >99.99% of the total UV flux in the middle clouds arises in the UV-A region (320–400 nm), (B) ∼66% of the total UV flux arises at wavelengths (370–400 nm) longer than those measured by the Venera probes, and (C) fluxes in the UV-B (280–320 nm) and UV-C (200–280 nm) decrease to negligible levels in the middle clouds from the respective fluxes of ∼20% and ∼7% in the TOA.
List of Selected Photophysical Parameters 1 for Venus (Normalized to SZA 0° from 15°C and Adjusted for Anisotropic Scattering) at the Top of the Atmosphere (TOA; 99.5 km) and in the Upper (65.5 km), Middle (53.5 km), and Lower (49.5 km) Clouds, Including Below the Clouds (BTC; 44.5 km), as Well as Earth's Surface (Normalized to SZA 0° from 48.19°)
Selected parameters include λpeak (for photon flux and irradiance), normalized peak photon flux (m−2 s−1 nm−1), integrated and normalized UV photon flux between 200 and 400 nm (W m−2 μm−1), normalized peak irradiance (m−2 s−1), and integrated and normalized UV irradiance (W m−2) between 200 and 400 nm.
Normalized peak photon flux or normalized peak irradiance at λpeak.
Integrated over 200–400 nm for Venus and 280–400 nm for Earth.
λpeak for photon flux.
λpeak for irradiance.
On Earth's surface (46 W m−2, 280–400 nm), integrated irradiances across the UV-A and UV-B are ∼7-fold higher than those in Venus' middle clouds (6.7 W m−2, 280–400 nm), after normalization as described. We note that measured UV irradiances on Earth range from ∼12–29 W m−2 (normalized from SZA 30°) in the UV-A across North America (Grant and Slusser, 2005), where microbial activity is abundant, and can rise to ∼73 W m−2 (normalized from SZA 16°) across the UV-A and UV-B (295–385 nm) in the Atacama Desert (Piacentini et al., 2003), where microbial abundance and activity are limited but measurable (Warren-Rhodes et al., 2006; Orellana et al., 2020). Further, Lee et al. (2019) reported ∼30% variations in global UV albedo of Venus on a decadal timescale from analysis of images from Venus Express (2006–2014) and Akatsuki (2016–present) orbiters. Therefore, given the observed variability and low flux, UV radiation is likely not a limiting constraint for habitability in Venus' middle and lower clouds.
We additionally compared photon fluxes (m−2 s−1 nm−1) at the wavelength of peak photon flux (λpeak) across Venus' clouds and Earth's surface. As displayed in Fig. 1B and listed in Table 1, normalized photon fluxes in Venus' middle and lower clouds peak at 607.5 nm with values of 8.2 × 10¹⁸ and 7.0 × 10¹⁸ m−2 s−1 nm−1, respectively. In contrast, normalized fluxes on Earth's surface peak at 669 nm with values of 6.6 × 10¹⁸ m−2 s−1 nm−1, representing ∼0.8-fold of the flux in Venus' middle clouds, and a ∼60 nm shift in the λpeak toward the red. These differences are due to the modeled absorption by the unknown absorbers, and Rayleigh scattering in the atmosphere.
To account for cloud opacity variability, we estimated variances in the downward flux using in situ measures obtained by Venera 11, 13, and 14 (Table 6–7, Moroz et al., 1985). Integrated downward fluxes (450–1200 nm) at the respective altitudes of 60, 55, 50, and 48 km were averaged across the Venera data and resulting standard deviations expressed as percentages to reveal variances ranging from 8–23% (or an average of 15 ± 6%) across the middle and lower clouds. As inferred from these uncertainties (or variances in cloud opacity), fluxes over time at the respective λpeak are likely comparable across Venus' middle and lower clouds and Earth's surface. This suggests that photon abundances and energies in Venus' middle and lower clouds are sufficient for Earth-like phototrophy and are potentially more favorable due to lower UV flux.
5. Earth Life in Venus' Light
On Earth, solar irradiance is regarded as a selective biological pressure for phototrophy, where the λpeak (669 nm) correlates to the wavelength of maximum visible absorption by chlorophyl a (λmax 669 nm), the dominant pigment used in photosynthesis (Nishio, 2000; Kiang et al., 2007b). Similarly, solar irradiance on Venus could theoretically serve as a selective pressure and favor phototrophs that harbor pigments with maximal absorbances at the λpeak of ∼608 nm (or between 558 and 608 nm, when considering the range from Venera 14 and calculated spectra).
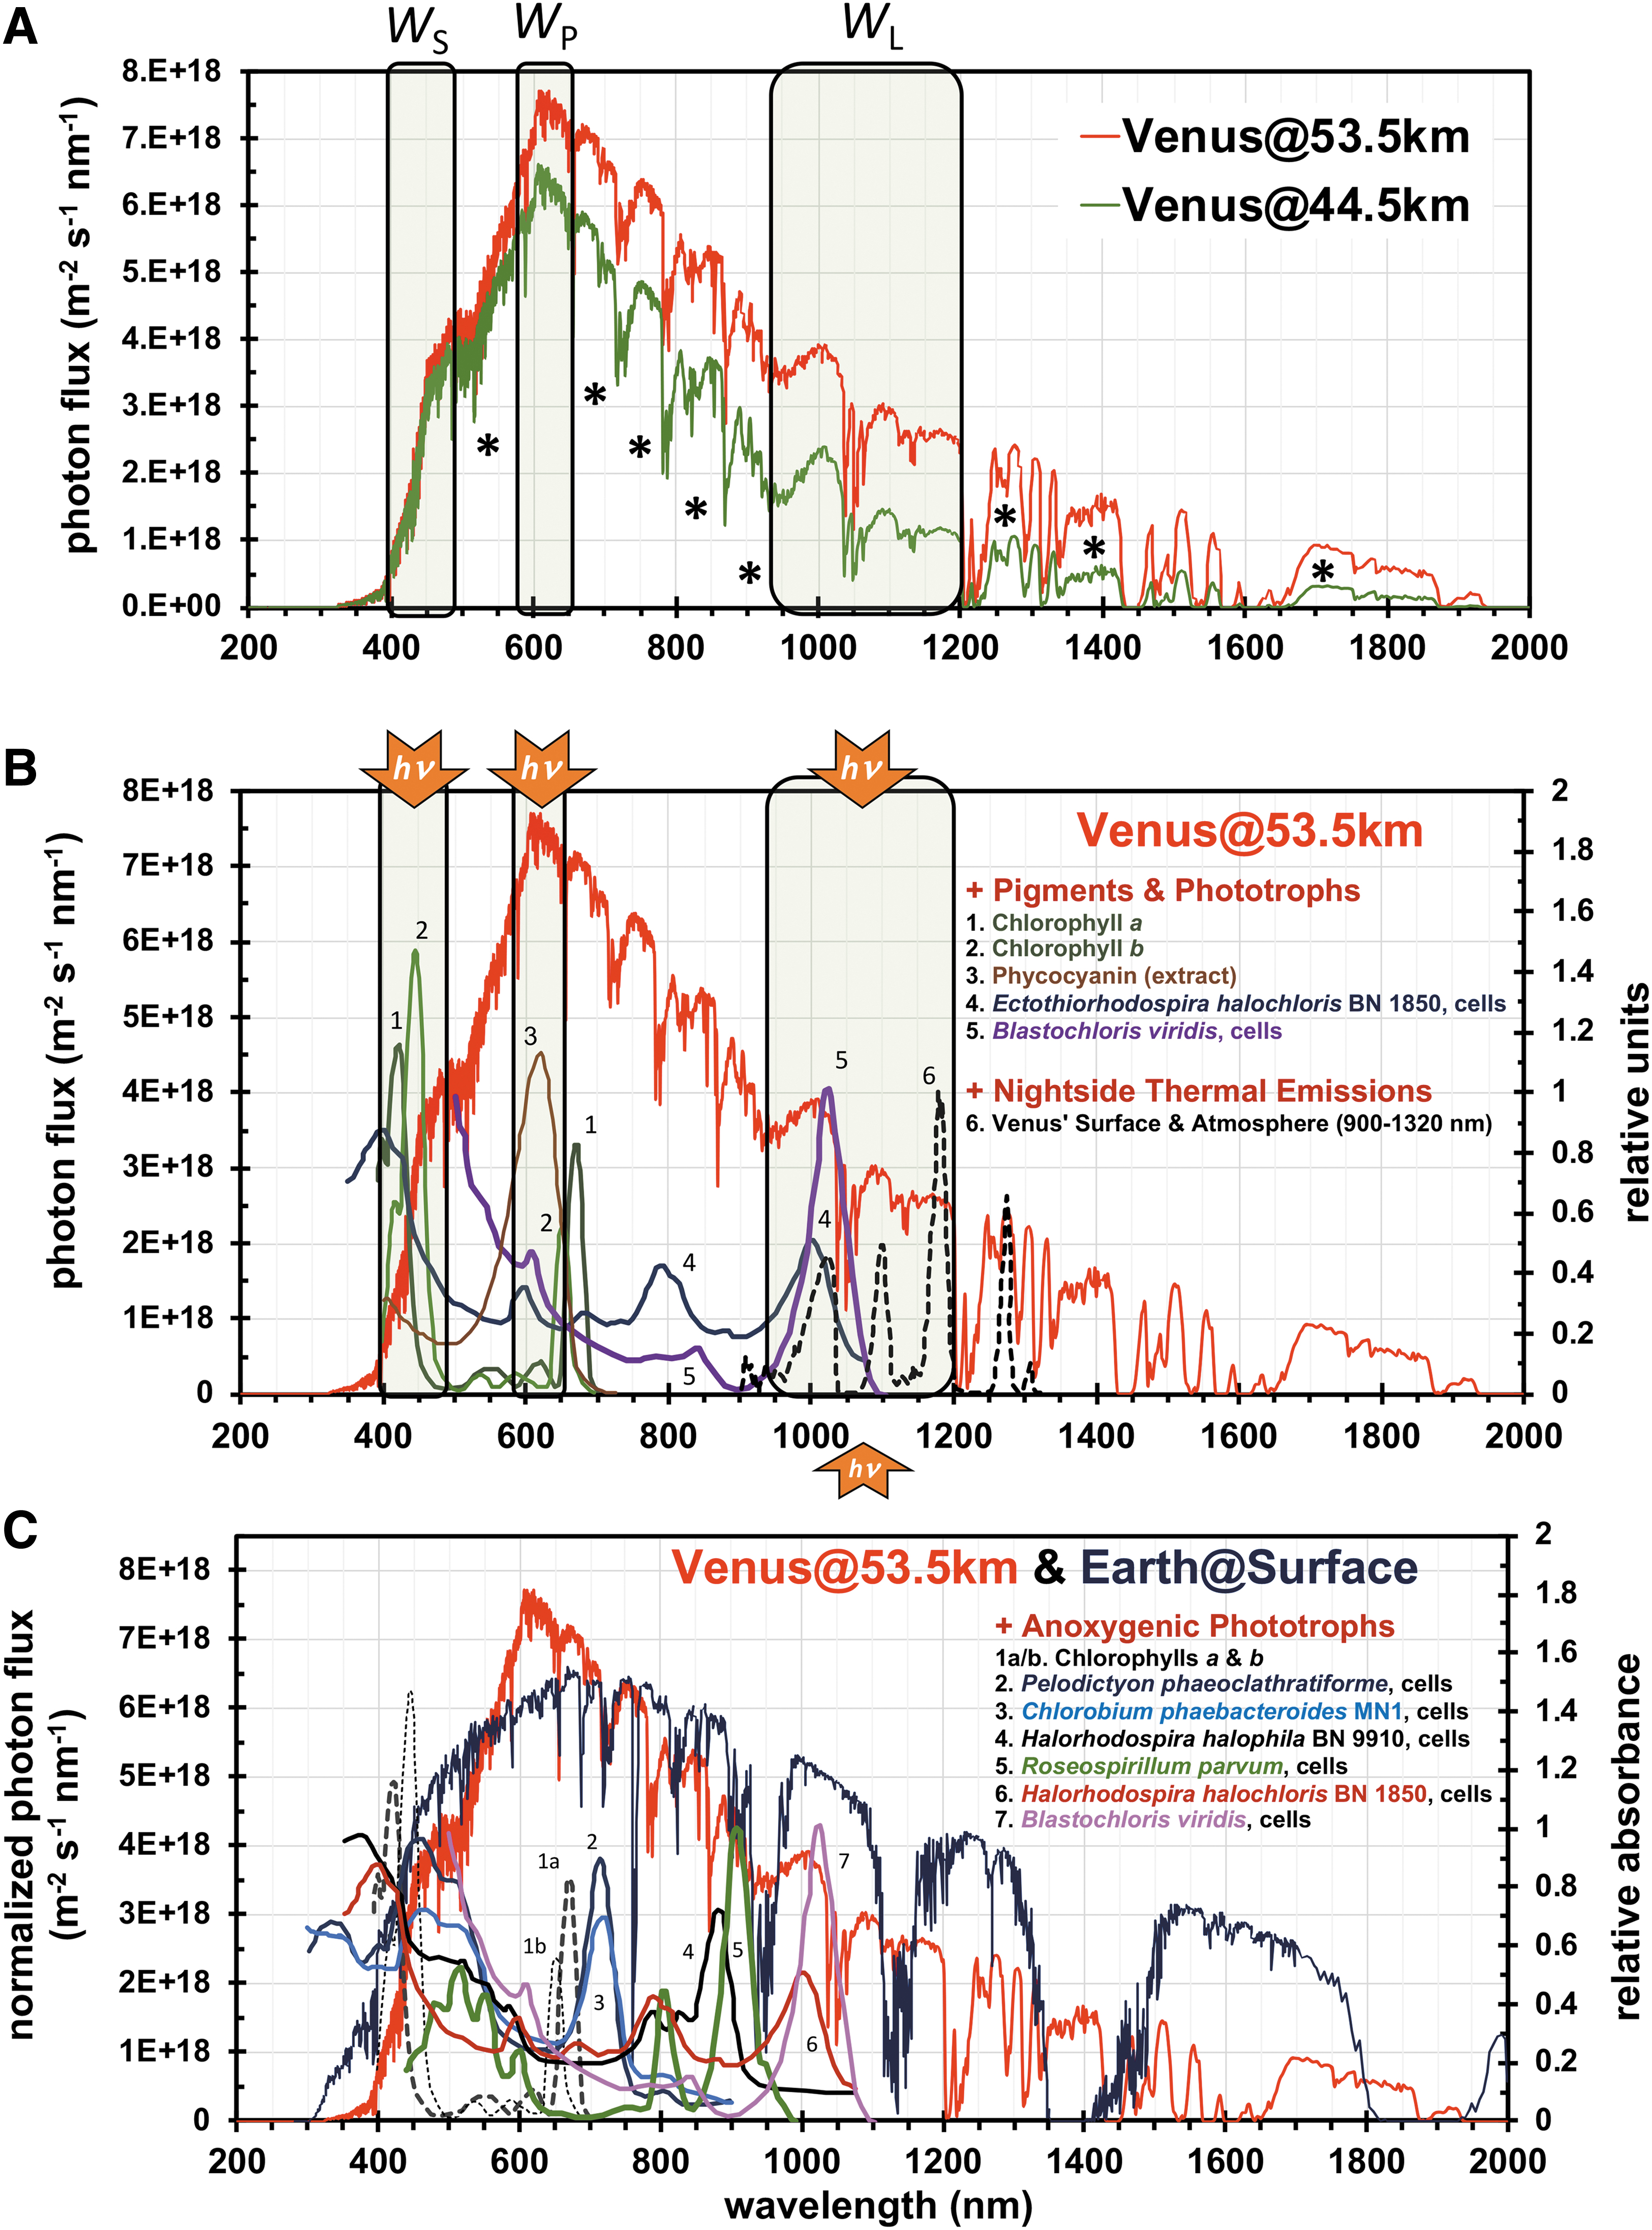
On Earth, the wavelengths available for phototrophy are also constrained by the absorption of atmospheric species such as water, O2, O3, and to a lesser degree CO2. In turn, the light that is transmitted to Earth's surface overlaps with the absorption profiles of pigments used in photosynthesis (e.g., chlorophylls, bacteriochlorophylls, and carotenoids) (Govindjee, 1974; Kiang et al., 2007a, 2007b; Stomp et al., 2007; Holtrop et al., 2021). Analogously, the dominant absorption associated with CO2 stretching in Venus' clouds (see Fig. 1C)—and to a lesser degree H2O stretching—also defines regions of transmitted solar irradiance or potential windows for phototrophy.
Highlighted in Fig. 2A are the hypothetical phototrophic windows in Venus' clouds. As adapted from the work of Kiang et al. (2007a), the photosynthetic windows on Earth comprise three signature regions that relate to peak absorbances by the photosynthetic pigments. These regions comprise the λpeak (W P), as the principal window for energy input and selective biological pressure, and the longest (W L) and shortest (W S) wavelengths available for absorption by photosynthetic pigments. On Earth, the signature photosynthetic windows, as listed in Table 2, comprise (1) red light in the W P (∼590–685 nm), which overlaps with the absorption of chlorophylls a and b, (2) near-infrared wavelengths in the W L (∼950–1100 nm), which are absorbed by bacteriochlorophyll b (and related protein complexes), and (3) blue light in the W S (∼350–500 nm), which is absorbed by all pigments. Relatedly, absorption across W P (red) and W S (blue) by chlorophylls a and b results in the observed green reflectance of plants. Earth's spectra, of course, harbor phototrophic subwindows that overlap with pigments from niche environments (e.g., chlorophyll f, bacteriochlorophyll a, and bacteriochlorophyll b) (Madigan, 2003; Stomp et al., 2007).
(
Signature Phototrophic Windows and Photosynthetic Photon Flux Density (PPFD) for Venus' Middle (53.5 km) and Lower (48.5 km) Clouds and Earth's Surface
Phototrophic windows represent the regions of highest photon flux (W P) and the shortest (W S) and longest (W L) suitable wavelengths of available solar radiation.
For Venus—when using Earth pigments as a reference—the primary phototrophic windows, as listed in Table 2, are nominally ∼590–656 nm (W P), ∼900–1200 nm (W L), and ∼400–500 nm (W S), as constrained by the absorption of CO2 and H2O in the atmosphere. Under such selective biological pressures, we speculate that dominant phototrophs within Venus' solar radiation might appear brown/maroon after absorption in the respective W P (orange) and W S (blue) regions. Demarcations for potential phototrophic subwindows in Venus' spectra are provided in Fig. 2A (asterisks). Potential low-energy niches include subwindows in the infrared of ∼1210–1300, ∼1400–1425, and ∼1675–1875 nm (asterisks in Fig. 2A); however, plausible photosynthesis would require absorption of increased numbers of photons per fixed CO2 (or conversion of CO2 to (CH2O) n —or Venus equivalent) to attain energies equivalent to those from the W P region (Wolstencroft and Raven, 2002; Kiang et al., 2007a; Lehmer et al., 2018).
Solar photon fluxes within Venus' middle clouds are compared in Fig. 2B to the absorption spectra of selected terrestrial anoxygenic phototrophs (intact cells) and photosynthetic pigments. The comparisons show that solar irradiances that transmit through W P, W L, and W S directly overlap with the absorption bands of intact cells of purple nonsulfur and sulfur bacteria (such as Blastochloris viridis and Ectothiorhodospira halochloris BN 1850, respectively), which harbor macromolecular complexes that contain bacteriochlorophyll b and differing pigments (see Fig. 2B legend). Irradiances transmitting through W P also overlap with the absorption of phycocyanin, a carotenoid from cyanobacteria, while irradiances that transmit through W S overlap with the absorbances of all assessed biochemical/biological spectra (similar to Earth). In fact, as indicated in Fig. 2C, the absorption features from all listed terrestrial anoxygenic phototrophs (intact cells) overlap with Venus' phototrophic windows or subwindows.
Photosynthetic photon flux densities (PPFDs; μmol m−2 s−1) were calculated across 400–700 nm (photosynthetically active radiation on Earth), 350–1200 nm (the wavelengths spanning W S to W L for Venus and Earth), and 700–1200 nm (near-infrared region). Normalized PPFD values (Table 2) in Venus' middle clouds were 2700 μmol m−2 s−1 (400–700 nm), 6230 μmol m−2 s−1 (350–1200 nm), and 3520 μmol m−2 s−1 (700–1200 nm); while those at Earth were 2610 μmol m−2 s−1 (400–700 nm), 6480 μmol m−2 s−1 (350–1200 nm), and 3780 μmol m−2 s−1 (700–1200 nm). Normalized values for Venus' lower clouds are provided in Table 2. Despite variances in the flux, Venus' cloud PPFD values are very similar to those at Earth's surface, while values in Venus' lower clouds are likely lower in the near infrared as suggested by decreases of ∼40% and ∼45% when compared to Venus' middle clouds and Earth's surface, respectively.
Intriguingly, appreciable fluxes of photons also arise from thermal emissions (∼1000–1750 nm) from the hot surface and atmosphere below Venus' clouds (Crisp et al., 1989; Meadows and Crisp, 1996; Mueller et al., 2008; Longobardo et al., 2012). As displayed in Fig. 2B (spectra #6, black dashed lines), Venus' thermal radiances, as measured on the nightside between 900 and 1320 nm (Meadows and Crisp, 1996), overlap with the absorption of intact cells of purple nonsulfur and sulfur bacteria that harbor bacteriochlorophyll b. Using spectra from the works of Mueller et al. (2008) and Meadows and Crisp (1996), nightside photon fluxes within W L were calculated to be 8.3 × 10¹⁶ m−2 s−1 (1000–1200 nm) and 6.7 × 10¹⁶ m−2 s−1 sr−1 (900–1200 nm), respectively; with an additional 1.3 × 10¹⁶ m−2 s−1 and 1.1 × 10¹⁶ m−2 s−1 sr−1 transmitting through the subwindow of ∼1210–1300 nm, respectively. Consistent with our radiative transfer model (Figs. 1C and 2B), thermal emissions would be detectable by orbiter or Earth-based measures after transmission through W L (for emissions at ∼1030, 1100, and 1180 nm) and the subwindow of ∼1210–1300 nm (for emissions at ∼1280 and 1300 nm); additionally, the abrupt decrease in emission between ∼1035 and 1050 nm, as observed in the spectra of Mueller et al. (2008) and Meadows and Crisp (1996), is due to attenuation by atmospheric CO2 (or, absorption related to CO2 stretching at 1037 and 1049 nm).
On Earth, anoxygenic low-light survival is associated with green sulfur bacteria in (1) the deep sea at hydrothermal vents in the East Pacific Rise (depth 2391 m), where photon fluxes of ∼1015 m−2 s−1 sr−1 (600–1000 nm) arising from geothermal emissions are reported to support phototrophy (Beatty et al., 2005); (2) the Black Sea at depths of 120 m where the presence of phototrophs is associated with downwelling photon fluxes that range from 4.5 × 10¹⁴ to 1.3 × 10¹⁵ m−2 s−1, as adapted from PPFD values of 0.00075 to 0.0022 μmol m−2 s−1 (400–700 nm) reported by Manske et al. (2005); and (3) laboratory studies where fixation of CO2 occurs at fluxes as low as 9.0 × 10¹⁵ m−2 s−1 (0.015 μmol m−2 s−1) (Manske et al., 2005; Marschall et al., 2010). In comparison, Venus' photon fluxes and PPFD values that arise from thermal radiances (0.14 μmol m−2 s−1, 1000–1200 nm; 0.11 μmol m−2 s−1 sr−1, 900–1200 nm) are well above the minimum fluxes that support anoxygenic photosynthesis on Earth, albeit at longer wavelengths, as phototrophs near hydrothermal vents and deep in the Black Sea are associated with measurable abundances of bacteriochlorophylls c and e, respectively, which absorb between ∼650 and 850 nm (Beatty et al., 2005; Manske et al., 2005).
Thus, for a hypothetical cloud-based microbiome at Venus, the absorption of solar irradiance with minimal UV flux, along with the absorption of continual thermal radiance from the surface/atmosphere, could together provide several unique advantages—that is, when compared to the selective pressures on Earth—including an expanded chemical and structural parameter space for photobiochemistry and novel diurnal cycles for photosynthesis. In turn, such attributes could hypothetically yield increased rates of microbial growth and division, and enhanced microbial diversity due to niche differentiation in an expanded photophysical habitat that includes solar flux during the day and illumination from below the clouds throughout the day and night. For photosynthesis, the anaerobic reduction of CO2 could also hypothetically proceed through electron donors arising from coupled sulfur and iron-based cycles (Limaye et al., 2018), which incorporate nitrate reduction and hydrogen oxidation (Limaye et al., 2018; Cockell et al., 2021). Additionally, nitrite, a potential chemical in Venus' middle clouds (Mogul et al., 2021), could contribute to nitrogen cycles on Venus (to yield nitrate) by serving as an electron donor for anoxygenic photosynthesis.
6. Habitability Limitations
In Venus' clouds, however, the potentials for phototrophy and/or chemotrophy are significantly constrained by the abundances of acid and water. Discussions of photosynthesis and photoassimilation are further restricted as simple carbohydrates ((CH2O) n ) have yet to be reported in Venus' atmosphere. In contrast, abundances of species containing nitrogen, sulfur, phosphorus, chlorine, and iron have been reported in several studies (Knollenberg et al., 1980; Krasnopolsky, 1989, 2013, 2017; Johnson and de Oliveira, 2019).
Acid abundances are regarded to be ≥75% w/w sulfuric acid in the aerosols in Venus' middle clouds with values peaking at ∼98% w/w in the lower clouds (Kliore et al., 1979; Grinspoon and Bullock, 2007; Cottini et al., 2012; Krasnopolsky, 2015). From studies on Earth, solutions of ≥75% w/w sulfuric acid (∼13–18 M H2SO4) are considered to exhibit water activities of ≤0.01 (Staples, 1981; Hallsworth et al., 2021), where measured concentrations of free (or unreacted) water are ≤9 M (Walrafen et al., 2000). Due to this water limitation, estimates of pH (-log [H3O+]) greatly underestimate the functional acidity of the solution, or ability of a Brønsted-Lowry acid to transfer a proton. Instead, better measures of acidity are obtained when using the Hammett acidity factor (H 0), where relative degrees of acid strength can be interpreted using the typical pH scale (Hammett and Deyrup, 1932; Johnson et al., 1969). As is indicated in Fig. 3, abundances of 75–99% w/w sulfuric acid relate to H 0 values of -6 to -11 across ∼25–60°C (the temperatures found across 51.5 to 56 km) and correspond to acidity levels that are several orders of magnitude greater than those suggested by Grinspoon and Bullock (2007) (pH ∼0 to -1), stoichiometric calculations of pH (pH -1.1 to -1.3), and Raman spectral measures of hydronium ion concentrations (pH -0.6 to -1.1) in 30–98% sulfuric acid solutions (Young et al., 1959; Walrafen et al., 2000).
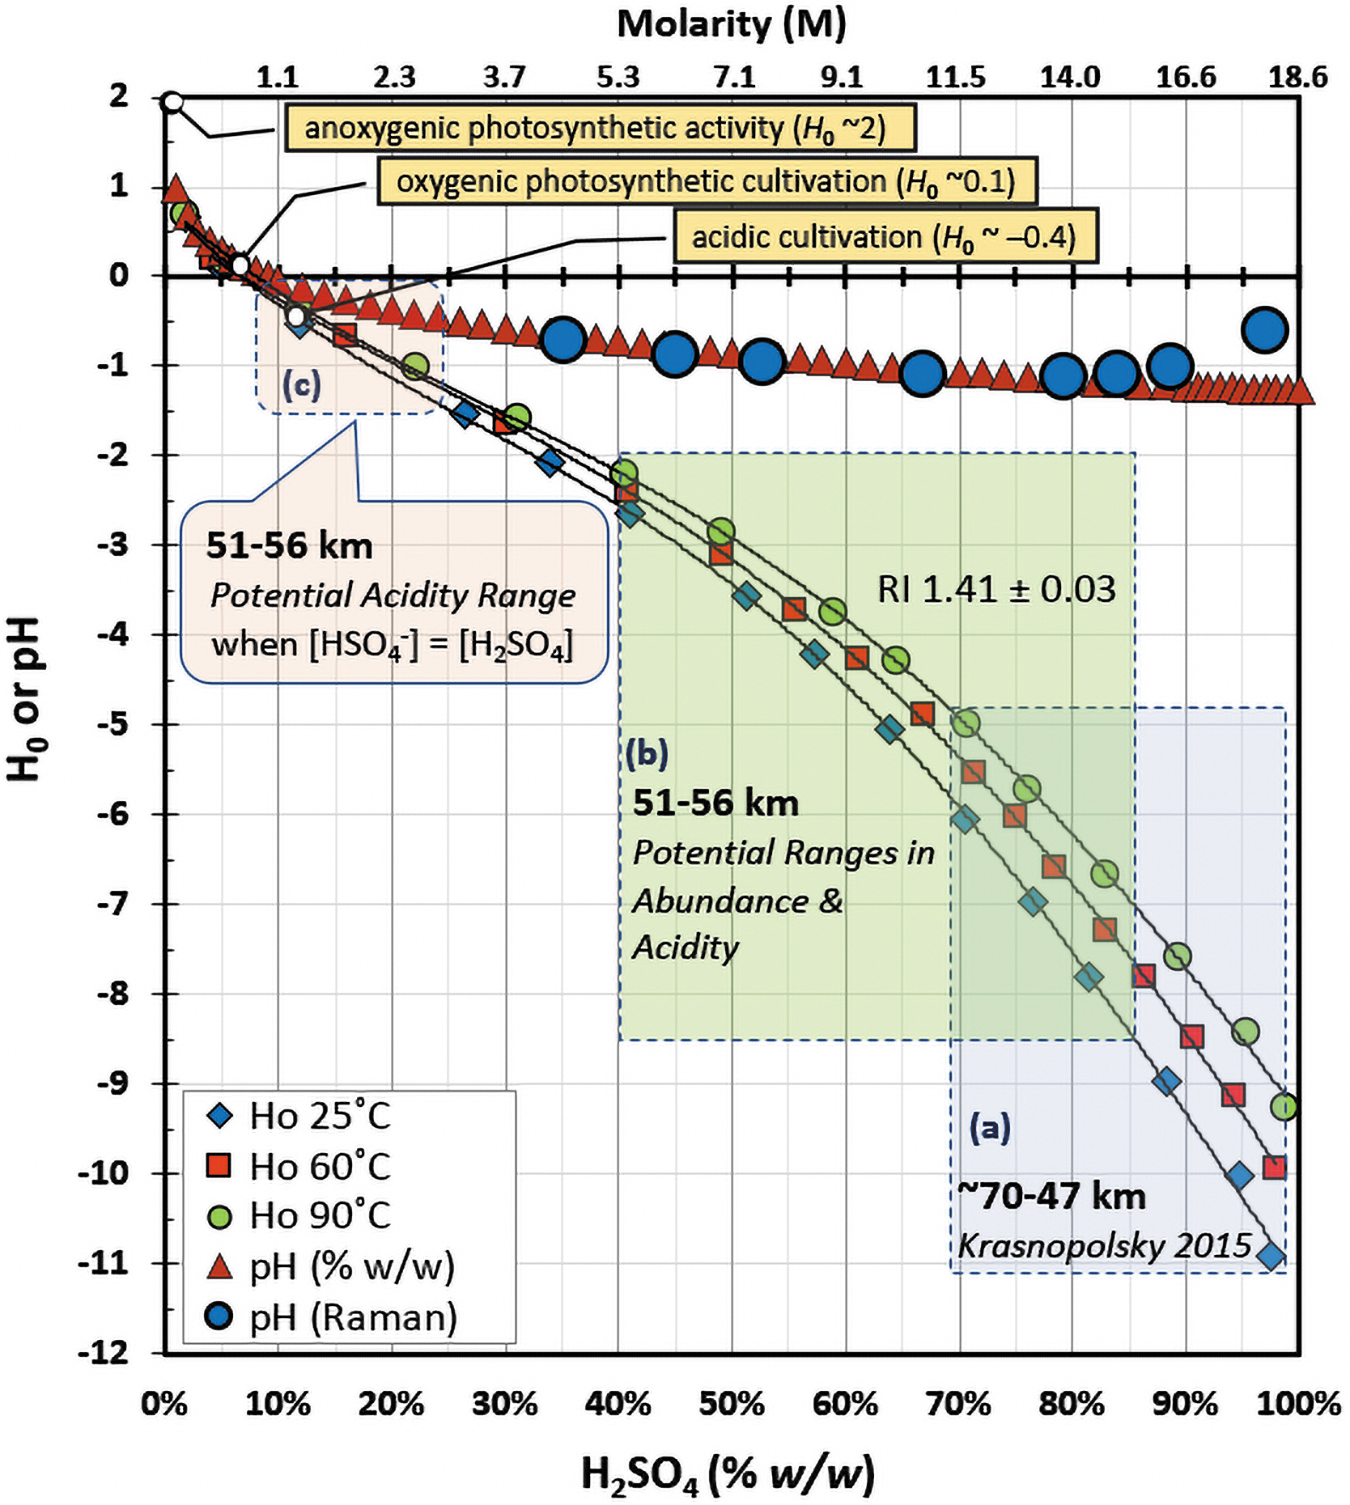
Impacts of sulfuric acid abundance (% w/w) on H 0 and pH values, where molarity (M) of sulfuric acid is provided on the upper x-axis. H 0 values were measured by Johnson et al. (1969) at 25°C (diamonds), 60°C (squares), and 90°C (circles), where fitted lines were used to interpolate trends across abundance (25°C: y = 98.657x 6 - 352.13x 5 + 509.18x 4 - 377.75x 3 + 139.19x 2 - 29.465x + 1.4915 [R 2 = 0.9987]; 60°C: y = 14.362x 4 - 36.317x 3 + 23.021x 2 - 11.729x + 0.7174 [R 2 = 0.9995]; 90°C: y = 10.744x 4 - 28.559x 3 + 18.616x 2 - 10.632x + 0.7109 [R 2 = 0.9994]). Values for pH were calculated using hydronium concentrations obtained from Raman spectral studies (large circles) of sulfuric acid solutions (Walrafen et al., 2000) and through direct conversion of % w/w to molarity (triangles) using densities of sulfuric acid at 25°C (Haynes, 2016), assuming no formation of sulfate (for simplicity purposes). Acidity values (H 0) and/or sulfuric acid abundances (% w/w or M) across Venus' clouds are highlighted using rectangular or round corner boxes to represent (a) ∼70–98% w/w sulfuric acid (H 0 ∼ -6 to -11) spanning ∼70–47 km (upper to lower clouds), as calculated by Krasnopolsky (2015); (b) potential range of 40–85% w/w sulfuric acid (H 0 ∼ -2.5 to -8.5) across 51–56 km (middle clouds), as estimated using an averaged RI of 1.41 ± 0.03 (propagated variance) obtained from in situ measures (Pioneer Venus and Venera 9); and (c) potential range in buffered acidity (H 0 ∼ -0.1 to -1.5) after neutralization of 40–85% w/w sulfuric acid with 0.5 mole equivalents of base, or when [HSO4 -] = [H2SO4], as described in the rounded corner callout box. Rectangular callout boxes highlight example terrestrial limits for acidic cultivation (H 0 ∼ -0.4), oxygenic photosynthetic cultivation (H 0 ∼0.1), and molecular measures related to anoxygenic photosynthesis (H 0 ∼2).
In perspective, such extreme acidities and low water activities preclude any known biochemistry. On Earth, microbial growth is typically associated with water activities of ≥0.6 (Rummel et al., 2014) with the lowest known limit being 0.585 (Hallsworth et al., 2021), which, in the context of sulfuric acid, correspond to ≤39% w/w or (≤4.5 M), as indicated in the works of Staples (1981, Table 42) and Hallsworth et al. (2021). Microbial growth is further constrained by acidity as inferred from the current limits for cultivation and oxygenic and anoxygenic photosynthesis. For acidic cultivation, lower limits are under chemoheterotrophic anaerobic conditions at an apparent pH of -0.06 (60°C), or an added amount of 1.2 M H2SO4 (H 0 -0.43), by Picrophilus, an aerobic archaea (Schleper et al., 1995). For oxygenic photosynthesis (22–25°C), the lower limits are pH ∼0.3 (H 0 ∼0.1; adapted from pH) by Dunaliella acidophila and pH 1.5 (H 0 ∼0.7; adapted from pH) by Chlamydomonas acidophila, which are green algae (Gimmler and Weis, 1992; Gerloff-Elias et al., 2005). For anoxygenic photosynthesis, lower limits for activity (∼50°C) are at pH 2.2–2.4, or 5–7 mM H2SO4 (H 0 = pH ∼2), where molecular measurements support anoxygenic photoassimilation of carbon and the presence of transcripts associated with bacteriochlorophyll biosynthesis (Hamilton et al., 2019).
7. Chemical Considerations
Given these constraints, and as a chemical argument towards habitability, we suggest that treatments of Venus' aerosols, to date, may underestimate the presence of bisulfate and/or sulfate, which would directly impact the functional acidity and water activities of the aerosols. Bisulfate (HSO4 -) and sulfate (SO4 2-) are structurally and spectrally related to sulfuric acid (H2SO4), as they represent the respective conjugate bases of neutralized sulfuric acid. Aqueous solutions of bisulfate and sulfate salts, such as ammonium bisulfate and copper sulfate, are also optically refractive, which is relevant since Venus' clouds have been inferred to harbor ∼75% w/w sulfuric acid due to similarities in refractive index (Hansen and Hovenier, 1974; Barstow et al., 2012; Arney et al., 2014). At Venus' cloud tops, refractive index (RI) values were found to be 1.44 ± 0.02 (550 nm) and 1.44 ± 0.01 (900 nm) by ground and orbiter-based polarimetry, respectively (Hansen and Hovenier, 1974; Kawabata et al., 1980; Knollenberg et al., 1980; Sato et al., 1996). Similarly, ∼75–76% w/w sulfuric acid solutions exhibit RI values of ∼1.44 per calculations (550 nm) at -23 and 15°C (Hansen and Hovenier, 1974) and measurements (556 nm) at 27°C (Palmer and Williams, 1975).
In comparison, solutions of ∼35–62% w/w ammonium bisulfate (∼3.7–7.5 M; NH4HSO4) at 25°C yield measured RI values (633 nm) of 1.38–1.41 (Tang and Munkelwitz, 1994) with ∼89% w/w (∼11 M) yielding an extrapolated RI of 1.44; as calculated when using the linear relationship (R 2 > 0.99) between measured RI and concentration of NH4HSO4. Additionally, solutions of 1.5 M copper sulfate (CuSO4) yield RI values (589 nm) of ∼1.37 with minimal variation (1.365–1.370) between 25°C and 50°C (Nieto and Olcina, 1999). These similar RI values are noteworthy as models and in situ measures in Venus' atmosphere suggest the presence of ammonia/ammonium (Surkov et al., 1974; Mogul et al., 2021), copper (Schaefer and Fegley, 2004), and iron (Krasnopolsky, 2017), though relative abundances remain unconstrained. Theoretically, such chemicals could contribute to the neutralization of sulfuric acid to yield bisulfate and/or sulfate salts.
Measures of cloud layer RI were also obtained by the Pioneer Venus and Venera spacecraft (Knollenberg et al., 1980; Ragent et al., 1985). For this study, measures possessing defined uncertainties across the spacecraft measures (Pioneer Venus, 900 nm; Venera 9, 920 nm) were aggregated to yield averaged RI values of 1.41 ± 0.03 (propagated variance) across 51–55 km (∼33–63°C) for the middle clouds, and 1.39 ± 0.04 (propagated variance) across 48–49 km (∼79–87°C) for the lower clouds. When considering the propagated variances, the range in RI values for the middle clouds of 1.38–1.44 translated to abundances ranging ∼40–85% w/w sulfuric acid, while RI values for the lower clouds (1.34–1.42) surprisingly translated to decreased values of <25–70% w/w sulfuric acid—these estimates were obtained by (1) interpolation of measurements (909 nm) from the work of Palmer and Williams (1975) using the linear relationship (R 2 > 0.99) between RI across 25–75% w/w sulfuric acid and (2) coarsely assuming that the impacts of temperature were minimal, as suggested by the <10% decrease in sulfuric acid densities between 25°C and 100°C, the ≤10% change in calculated RI for 75% w/w sulfuric acid at -53°C and 27°C, and ≤10% change in RI for 0.1–1.5 M copper sulfate across 25–50°C (interpreted as a proxy for sulfuric acid) (Massie, 1994; Nieto and Olcina, 1999; Haynes, 2016).
In summary (Fig. 3), these observations and calculations, when solely considering RI, suggest that aerosols in the middle clouds could harbor wide-ranging abundances of ∼40% to 85% w/w sulfuric acid with corresponding acidities (H 0) of -2.5 to -8.5. Our comparisons also show that solutions of bisulfate and/or sulfate salts—and quite likely mixtures with sulfuric acid—exhibit optical properties like those observed at Venus. For example, similar RI values are shared between Venus' middle clouds, 40–85% w/w sulfuric acid (∼5.4–16 M), and 40–89% w/w ammonium bisulfate (∼4.5–11 M).
8. Sulfuric Acid Abundances
Abundances of sulfuric acid in Venus' aerosols have additionally been inferred from radio occultation measurements, which involve microwave absorption and a dependence on the index of refraction of the clouds. Several studies indicate that sulfuric acid vapor is ∼0–3 ppm in Venus' middle clouds and ∼1–10 ppm in the lower clouds (Kolodner and Steffes, 1998; Imamura et al., 2017; Oschlisniok et al., 2021). In fact, across 51–56 km (middle clouds), multiple measures of ∼0 ppm vapor have been obtained from varying spacecraft including Akatsuki (Imamura et al., 2017), Magellan across three orbits (Jenkins et al., 1994), Venus Express (Oschlisniok et al., 2012), and Mariner 10 (Kliore et al., 1979).
To relate vapor and solution-phase abundances for sulfuric acid at Venus, Krasnopolsky (2015) performed thermodynamics calculations, which related ∼2 ppm H2SO4 vapor to ∼98% w/w sulfuric acid solutions at 50 km (∼66°C and 1 atm) and 30 ppm water vapor. Under these constraints, radio occultation measures of ∼10 ppm H2SO4 vapor are then suggestive of the lower clouds harboring supersaturated sulfuric acid. Supersaturation, however, is contrary to the models of Esposito et al. (1983) and James et al. (1997), which suggest nominal saturating conditions between 50 and 45 km. Supersaturation is also inconsistent with gas chromatography measures of water vapor, which suggest abundances of 86% w/w sulfuric acid at 51.6 km (Oyama et al., 1980). In addition, apparent RI values from the lower clouds (1.38 ± 0.04) are suggestive of ≤70% w/w sulfuric acid (48–49 km). These comparisons, therefore, reveal potential uncertainties in calculated estimates for solution-phase abundances, where ∼10 ppm H2SO4 vapor may instead relate to ≤98–100% w/w sulfuric acid, or nominally saturating conditions in the lower clouds.
We also estimated sulfuric acid abundances using vapor phase diagrams measured by Marti et al. (1997). These measures showed that solutions of ∼75% w/w sulfuric acid (25°C, 1 atm) liberate ∼3 ppm H2SO4 vapor at ∼910 ppm water (2.9% relative humidity). In contrast, calculations by Krasnopolsky (2015) suggest that ∼75% w/w sulfuric acid solutions liberate 0 ppm H2SO4 vapor at 2000 and 10,000 ppm water under conditions relating to 54 km (∼25°C, ∼0.5 atm) and 50 km (66°C, 1 atm), respectively. These comparisons again suggest that thermodynamics calculations and measurements possess inherent uncertainties. Potential examples of these uncertainties include: (1) the ∼1-log difference between measured H2SO4 vapor pressures of Gmitro and Vermeulen (1964) and Ayers et al. (1980) (as compared in Marti et al. [1997]); (2) the ∼3.5-fold higher H2SO4 vapor pressures when comparing calculations of Krasnopolsky (2015) and measurements of Ayers et al. (1980); (3) the 5–6% lower H2SO4 activity values of Rard et al. (1976) when compared to those of Giauque et al. (1960); and (4) the ∼30% uncertainty in Venus' cloud water vapor, as reported by Hallsworth et al. (2021), which for ∼10–1000 ppm water correspond to ±5–10% variances in solution-phase sulfuric acid abundances, as estimated using H2O vapor phase diagrams of Gmitro and Vermeulen (1964).
Additional sources of potential uncertainty are the nonvolatile and volatile chemicals in Venus' atmosphere (Hoffman et al., 1980; Krasnopolsky, 2013, 2017; Mogul et al., 2021) that may dissolve within the aerosols (similar to our treatment of the unknown absorber) and decrease the partial vapor pressures of sulfuric acid and water (Lovelace et al., 1921). For the lower clouds, uncertainties regarding the vertical variability in RI also include assumptions of particle shape. For example, Knollenberg et al. (1980) indicated that nephelometry data were best fit at 50 km (presumed altitude) with very low RI values of ≤1.3, which was indicative of limited backscatter due to conditions including absorbance of the nephelometer radiation by the particles and/or irregular (or non-spherical) particle shapes. Interestingly, intact cells that contain bacteriochlorophyll a (Roseospirillum parvum, Fig. 2C) maximally absorb near the nephelometer wavelengths of 900 and 920 nm; theoretically, therefore, biotic pigments could explain such observations, as could abiotic absorbers in the near infrared.
Alternatively, radio occultation measurements could support the presence of partly neutralized sulfuric acid. According to Marti et al. (1997), solutions of 55–77% w/w sulfuric acid (30°C) exhibit similar H2SO4 vapor pressures both before and after partial neutralization by ammonia gas (≤0.5 mole ratio of NH3 to H2SO4). For example, for ∼72% w/w sulfuric acid, vapor pressures of ∼2–3 ppm H2SO4 marginally decrease to 0.9 ± 0.4 ppm after neutralization by 50% mole ratio of ammonia. As displayed in Fig. 3, the impacts of such neutralizations for Venus were estimated assuming 40–85% w/w sulfuric acid for the middle clouds (in accordance with RI measures) and a 0.5 mole ratio of ammonia. Such hypothetical neutralizations yield mixtures of 23–46% w/w ammonium bisulfate (∼2.8–6.4 M) with 19–40% w/w sulfuric acid (∼2.2–5.3 M)—concentrations assumed densities equal to sulfuric acid at 25°C. By means of measures on Earth, water activities of ≥0.6 (25°C) are obtained from solutions of 23–46% w/w ammonium bisulfate (Tang and Munkelwitz, 1994) or 19–40% w/w sulfuric acid (Staples, 1981).
Under these buffering conditions, in accordance with Fig. 3, adjusted acidity (H 0) values for the middle clouds range from -0.1 to -1.5 with slightly more basic values projected at higher temperatures (Johnson et al., 1969). We found limited information in the literature regarding H 0 values for 1–10 M mixtures of bisulfate and sulfuric acid. To account for equimolar conjugate base, therefore, H 0 values (-1.0 and -2.4) at 19% and 40% w/w sulfuric acid (∼2.2 and 5.3 M), as adapted from the work of Johnson et al. (1969), were corrected by using a ΔH 0 of 0.9, which yielded values of -0.1 to -1.5. As reported by Paul and Long (1957), solutions of 2–6 M H2SO4 and HClO4 display similar H 0 profiles, while comparison of 6 M HClO4 to mixtures of 3 M HClO4 with 3 M NaClO4 revealed a ΔH 0 of ∼0.9. Hence, given that H2SO4 and HClO4 display similar acidic behaviors, a ΔH 0 of ∼0.9 was used to correct for 2–6 M solutions that contained equimolar sulfuric acid and bisulfate. For Venus' lower clouds, such treatments for 25–98% w/w sulfuric acid (lower and higher limits from RI and vapor phase calculations, respectively) yielded an adjusted H 0 range of +0.4 to -2 and water activities of ≥0.41 (for 46% w/w sulfuric acid). Thus, these hypothetical acidities and water activities, especially for the middle clouds, fall within the limits of terrestrial microbial growth.
9. Potential for Phototrophy
Our photophysical results indicate that transmitted solar irradiances in Venus' clouds (Table 1) are suitable for Earth-like phototrophy with similar photon fluxes (Table 2) across the visible and near-infrared (350–1200 nm) when compared to Earth's surface (ASTM G-173-03). As potential selective biological pressures, the solar irradiances in Venus' clouds could also be more favorable due to ∼87% less flux in UV-A, with negligible flux in UV-B and UV-C. Hypothetical phototrophs, moreover, could appear brown/maroon in the middle and lower cloud after absorption of light transmitting through Venus' signature phototrophic windows (Table 2), inclusive of maximal absorption at the wavelength of peak solar irradiance (608 nm). Lastly, our calculations suggest that thermal emissions from below Venus' clouds could sustain phototrophy. Hence, our analyses are supportive of a photophysical habitat that includes diurnal input of solar energy through the cloud tops, along with the persistent input of lower-power and lower-flux thermal energy from below the clouds.
10. Potential for Habitability
When considering chemical limits to habitability, our interpretations of measured refractive index and radio occultation data suggest that aerosols in the middle clouds could harbor neutralized forms of sulfuric acid, such as ammonium bisulfate. Such interpretations of partly neutralized sulfuric acid are parallel to those of Rimmer et al. (2021), who suggest that aerosols with pH values of ∼1 (due to the presence of substantial base) yield water and SO2 vapors that match Venus observations. When assuming the presence of mixtures of sulfuric acid and ammonium bisulfate (0.5 mole ratio), our results suggest that the aerosols could harbor water activity (≥0.6) and acidity values (H 0 -0.1 to -1.5) that lie within the limits of terrestrial acidic cultivation (H 0 ≥ -0.4). The acidity limits are also tantalizingly close to the limits for oxygenic photosynthesis (≥H 0 0.1). However, for anoxygenic photosynthesis (≥H 0 2), acidity remains to be a constraining variable, which suggests the need for additional basicity, similar to the model of Rimmer et al. (2021), to yield terrestrial-type conditions.
When considering water, a consensus of low water vapor abundances (∼20–100 ppm) are obtained through optical measures (Johnson and de Oliveira, 2019). In contrast, in situ measures suggest ∼200–2000 ppm (Vega 1, and Venera 9, 10, 13, and 14) in the middle/lower clouds (58–48 km) and ∼5000 ppm (Pioneer Venus) just below the clouds (41.7 km) (Hoffman et al., 1980; Oyama et al., 1980; Surkov et al., 1983, 1987; Von Zahn et al., 1983). Apart from instrumental issues, we posit that these high values represent partial sampling of the aerosols, which hint at larger solution-phase reservoirs of water, per se, that may harbor solutes, as noted, that could lower the partial pressures of water and/or sulfuric acid. We speculate, therefore, that microbial survival in an aerosolized and water-restricted environment could include bio/chemical strategies to reduce vapor pressure and loss of solution-phase water, similar to microbial strategies associated with freezing point and temperature depression (Scotter et al., 2006; Möhlmann, 2012), inhibition of ice formation (Krembs and Deming, 2008; Raymond et al., 2008), and cloud condensation (Lazaridis, 2019).
11. Conclusions
Solar irradiances calculated across Venus' clouds support the potential for Earth-like phototrophy, while treatment of Venus' aerosols as containing neutralized sulfuric acid favors a habitable zone in the clouds. To date, most studies suggest that the aerosols in Venus' middle and lower clouds harbor high acidities (Seager et al., 2020; Limaye et al., 2021) with commensurate low water activities or availabilities (Cockell, 1999; Izenberg et al., 2020; Seager et al., 2020; Cockell et al., 2021; Hallsworth et al., 2021; Limaye et al., 2021). In contrast, as presented in this study, alternative interpretations to in situ measures yield potentially habitable conditions with water activities (≥0.585) and buffered acidities (Hammett acidity factor, H 0 -0.1 to -1.5) that lie within the limits of terrestrial microbial growth.
Venus' clouds, therefore, may not be as inhospitable as suggested by the models of Krasnopolsky (2015) and Hallsworth et al. (2021) given the lack of observational constraints for Venus' middle and lower clouds and since differing chemicals may share RI and microwave absorption properties. Looking ahead, mass spectrometers amenable to sampling vapors of sulfuric and phosphoric acids (Wurz et al., 2012; Ren et al., 2020), ionized chemical species (Baines et al., 2021), and/or sublimated salts (Hänni et al., 2019) could help in detailing the acid, conjugate base, and water abundances in the aerosols, and thereby directly address the potential for habitability in Venus' clouds. Furthermore, when considering potential life-detection strategies, our results suggest that the wavelength range of ∼558–608 nm, which accounts for uncertainties with the unknown absorbers, may serve as a reasonable excitation window for fluorescence spectroscopy.
Footnotes
Author Contributions
All authors (RM, SSL, YJL, and MP) contributed to the acquisition, analysis, or interpretation of the data, and drafting of critical revisions/reports of the work. The primary investigator and corresponding author is RM. Spectra were calculated by YJL. Calculation of photon flux and PPFD, and assignment of spectral regions for phototrophy, were performed by RM. Refractive index, acidity, and water activities were calculated or estimated by RM and MP.
Acknowledgments
We thank Jaime A. Cordova for editing of the manuscript. RM acknowledges support from the National Aeronautics and Space Administration (NASA) Research Opportunities in Space and Earth Sciences (NNH18ZDA001N). SSL acknowledges support from NASA (NNX16AC79G). YJL acknowledges funding from EU Horizon 2020 MSCA-IF No. 841432.
Associate Editor: Sara Seager