
Abstract
Radiation dosimetry was carried out at the exposure facility (EF) and the pressurized module (PM) of the Japanese Kibo module installed in the International Space Station as one study on environmental monitoring for the Tanpopo mission. Three exposure panels and three references including biological and organic samples and luminescence dosimeters were launched to obtain data for different exposure durations during 3 years from May 2015 to July 2018. The dosimeters were equipped with additional shielding materials (0.55, 2.95, and 6.23 g/cm2 mass thickness). The relative dose variation, as a function of shielding mass thickness, was observed and compared with Monte Carlo simulations with respect to galactic cosmic rays (GCRs) and typical solar energetic particles (SEPs). The mean annual dose rates were D EF = 231 ± 5 mGy/year at the EF and D PM = 82 ± 1 mGy/year at the PM during the 3 years. The PM is well shielded, and the GCR simulation indicated that the measured mean dose reduction ratio inside the module (D PM/D EF = 0.35) required ∼26 g/cm2 additional shielding mass thickness. Observed points of the dose reduction tendency could be explained by the energy ranges of protons (10–100 MeV), where the protons passed through, or were absorbed in, the shielding materials of different mass thickness that surrounded dosimeters.
1. Introduction
Currently, crewed space explorations are carried out in the International Space Station (ISS) at low Earth orbit, where the ISS crew is constantly exposed to space radiation that consists of various energetic charged particles from galactic cosmic rays (GCRs), solar energetic particles (SEPs), and particles trapped by a geomagnetic field (Benton and Benton, 2001). Deep space crewed missions are planned for the Moon and beyond, where the radiation environments are more hostile because GCRs and SEPs are irradiated directly under conditions that offer less shielding from space radiation, that is, a lower-strength magnetic field and extremely thinner atmosphere than those of Earth. On the planned Lunar Orbital Platform Gateway (Crusan et al., 2018) and on future missions to Mars and deep space, space crews will be exposed to much higher space radiation levels due to the longer flight durations and smaller shielding parameters. A Monte Carlo simulation study compared the radiation dose levels at low Earth orbit, interplanetary free space, and lunar and martian surfaces and pointed out that there would be a much higher dose level in deep space (Sato et al., 2018). Another Monte Carlo simulation study estimated the radiation dose on the lunar surface was ∼420 mSv/year (Naito et al., 2020a), and such a value was measured with the radiation dose monitor aboard China's Chang'E 4 lander (Zhang et al., 2020). It has been estimated that interplanetary free space cruising would result in a dose of ∼660 mSv for even the shortest round-trip case to Mars (Zeitlin et al., 2013).
As countermeasures, shielding with hydrogen-enriched materials (Wilson et al., 1997; Shavers et al., 2004; Zeitlin et al., 2005; Durante, 2014; Kodaira et al., 2014) and carbon fiber composites for a spacecraft (Naito et al., 2020b) and utilization of lava tubes on the lunar surface (Naito et al., 2020a) are proposed for efficient dose reduction in deep space missions. The recommended effective dose limits for a crew member career of 10 years are 400 mSv (for females) and 700 mSv (for males), starting when the person is 25 years old (NCRP, 2002). The radiation risk to crew members should be controlled below the recommended limits by making use of radiation dosimetry.
Numerous space radiation dosimetry campaigns have been carried out in the pressurized module (PM) of the ISS (e.g., Ambrožová et al., 2011; Nagamatsu et al., 2013; Kodaira et al., 2013; Kroupa et al., 2015; Berger et al., 2016, 2017). The typical daily dose rate inside the ISS ranges from about 0.5 to 1 mSv (0.2 to 0.5 mGy) depending on the solar activity and orbital and shielding parameters of the module. Meanwhile, a few dosimetry measurements have been made outside the ISS and aboard an uncrewed satellite (Benton et al., 2002; Reitz et al., 2009; Sihver et al., 2016). Experimental data near free space are required for estimating the radiation risk in future deep space crewed missions. In this paper, we report dosimetric results measured at the exposure facility (EF) and PM of the Japanese Kibo module installed in the ISS; these measurements were carried out as one study on environmental monitoring during the Tanpopo mission.
2. Experimental
2.1. Tanpopo mission
The Tanpopo mission was carried out on the ISS at the EF of the Japan Experiment Module (JEM: otherwise known as Kibo) for testing the possible interplanetary migration of microbes and transfer of organic compounds to Earth (Kawaguchi et al., 2020). Three sets of exposure panels and reference panels, each consisting of biological and organic test samples as well as environmental sensors of ultraviolet ray and space radiation, were launched by Space-X CRS-6 in April 2015. The three exposure panels were installed at the EF, and the three reference panels were stored in the PM of the Kibo module. The three exposure panels were prepared to obtain the data for different exposure durations; that is, the first panel was retrieved from the ISS in June 2016, the second one was retrieved in July 2017, and the third one was retrieved in July 2018. Here, we call these different exposure durations Sessions I to III as summarized in Table 1a. Each retrieved panel was returned to the ground laboratory a few months after its retrieval.
Number of Exposure Days for Duration of Sessions I to III
Number of Exposure Days for Periods #1 to #3
2.2. Radiation dosimeters
The aluminum oxide–based optical stimulated luminescence dosimeters (OSLDs: 7.2 mm diameter, 0.5 mm thick, Nagase Landauer Inc., Japan) and the silver-activated phosphate glass-based radiophotoluminescence dosimeters (RPLDs: 8.5 × 8.5 × 1.5 mm thick, Chiyoda Technol Corporation, Japan) were employed for absorbed dose measurements (Yamagishi et al., 2018). The dose values were obtained by averaging the values measured with OSLDs and RPLDs at the same condition. Four OSLDs and three RPLDs were installed in a dosimeter package made of aluminum alloy with 0.55 g/cm2 mass thickness ( = 0.20 cm × 2.77 g/cm3). An additional slab of SUS-316 (stainless steel containing Cr-18%, Ni-12%, Mo-2.5%; 2.39 g/cm2 mass thickness [ = 0.30 cm × 7.98 g/cm3]) or lead (5.68 g/cm2 mass thickness [ = 0.5 cm × 11.35 g/cm3]) was set in front of the dosimeters to observe the dose reduction effect with the shielding. Total shielding mass thickness (aluminum package + slab) was 0.55, 2.95, or 6.23 g/cm2 for each. This configuration may allow characterization of the dose reduction of different components from GCRs and SEPs. In other words, the dose reduction rate as a function of shielding thickness depends on the components: low-energy protons may be easily stopped in the shielding material. The dose contribution of low-energy protons in SEPs is larger than that in GCRs because the flux of SEP protons is much higher than that in GCRs (Mewaldt et al., 2012). We have tested this idea comparing experimental data with results of Monte Carlo simulations considering SEP protons.
2.3. Monte Carlo simulations
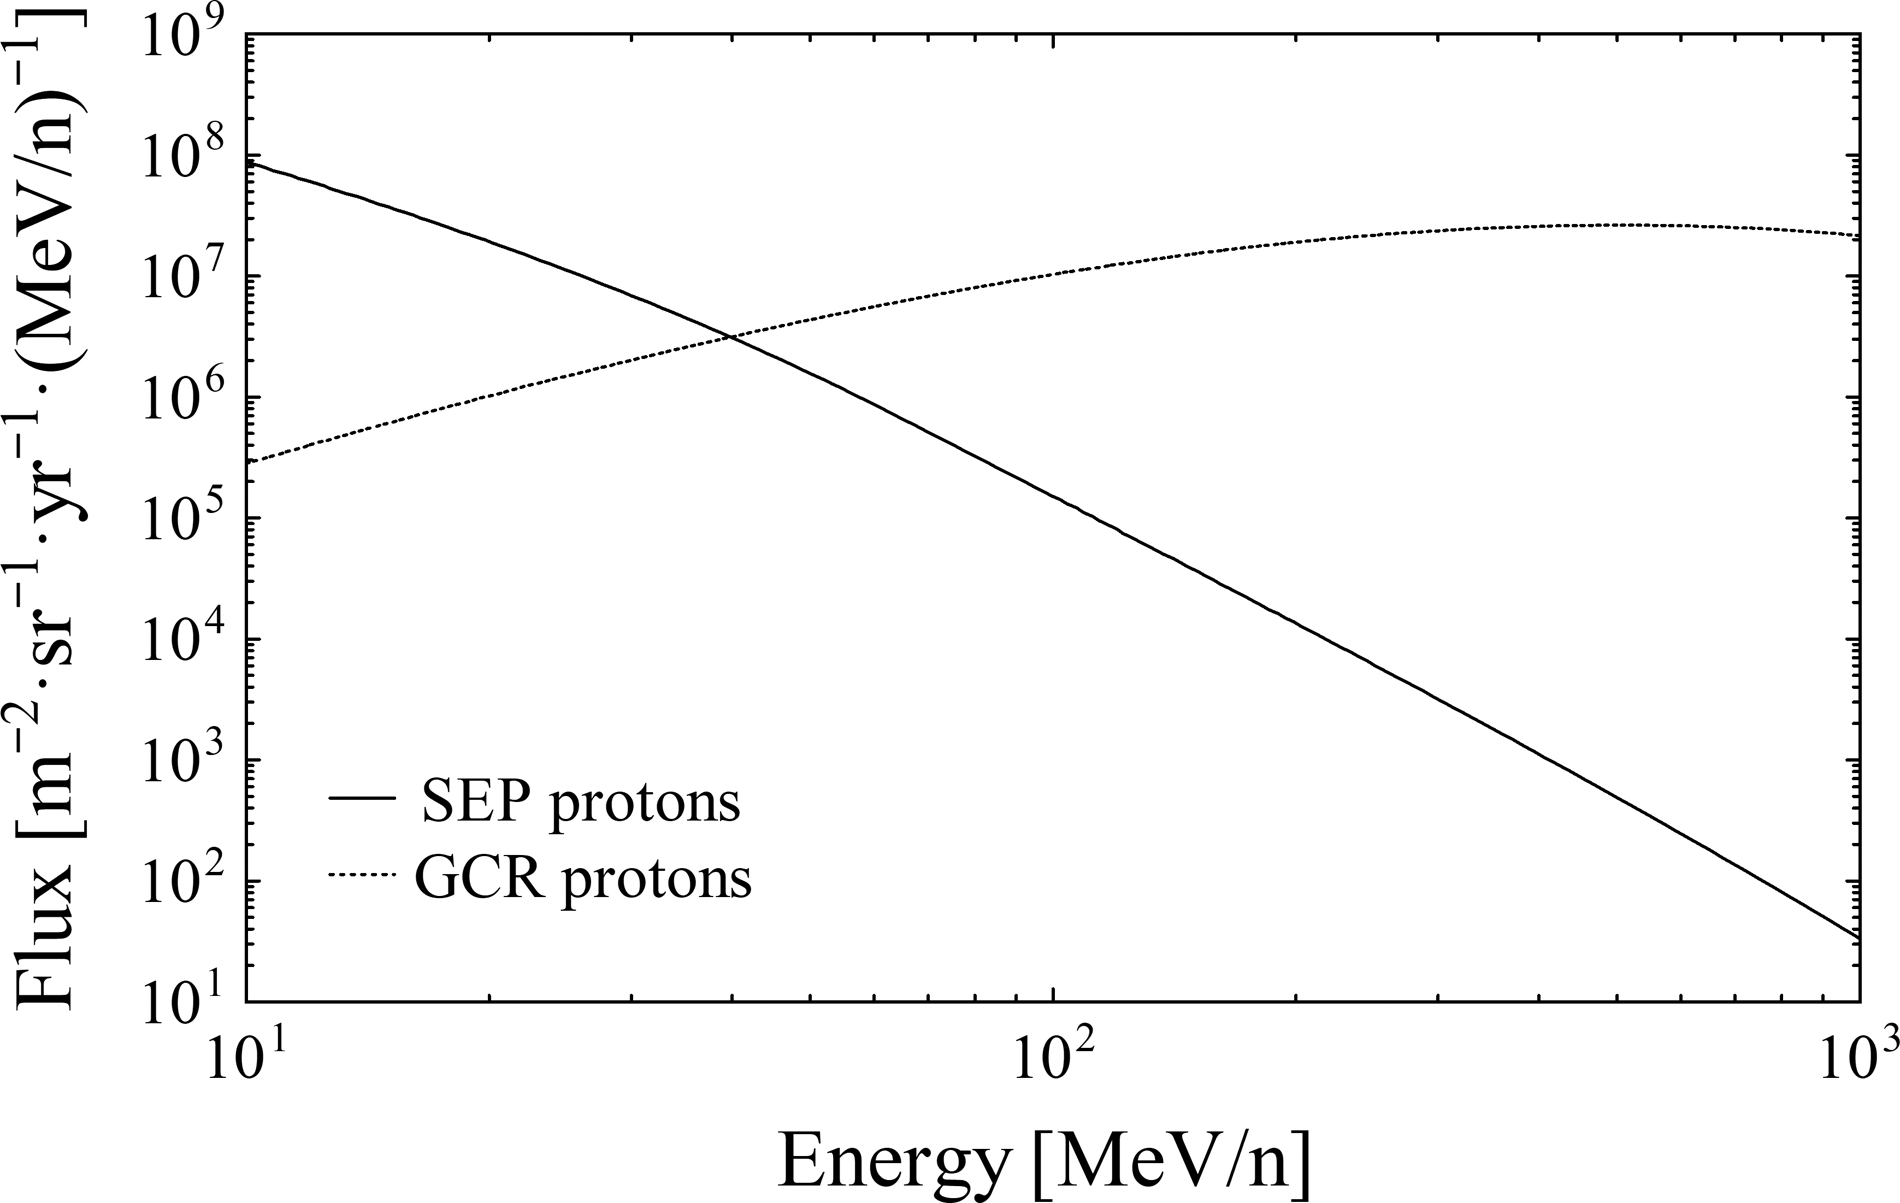
Numerical calculations of particle production and transport were carried out by using the Geant4 code v10.04.p02 (Agostinelli et al., 2003; Allison et al., 2006, 2016) with the Geant4 reference physics model “Shielding.” In this model, hadronic interactions are simulated by intranuclear cascade models of QMD, Bertini and Fritiof. Electromagnetic interactions are included in the Geant4 standard physics. Similar results were obtained by using the other geant4 physics lists “QGSP_BIC_HP” and “FTFP_BERT_HP.” The GCR energy spectra from the proton to iron (Z = 1–26) with energies of 10 MeV/n to 100 GeV/n were taken from the DLR model for the year 2005 (Matthiä et al., 2013), assuming similar solar activity to the observed Sessions I to III (the solar maximum phase). The SEP proton energy spectra of 10 MeV to 1 GeV at the solar maximum were taken from the SAPPHIRE model (Jiggens et al., 2018). Figure 1 shows the energy spectrum of SEP protons together with that of GCR protons used in this work (Matthiä et al., 2013; Jiggens et al., 2018). Particles were traced for 0.7 mm in shielding materials. Planar particle sources with a cosine angular distribution reproducing isotropic exposure were irradiated to the shielding material (aluminum) with the same mass thickness as mentioned in Section 2.2. The absorbed dose behind each shielding material was calculated with 1 mm thick detection water layers. Standard deviations of the absorbed dose in the water layers were presented as the error of simulation results.
3. Results
The dosimetry measurements started on May 26, 2015, and ended on different days and years after exposures from 1 to 3 years. By subtracting the overlapping days during Sessions II and III, the exposure durations were divided into Periods #2 and #3, and Period #1 was the same as Session I. The numbers of exposure days are summarized in Table 1b. Table 2 summarizes the measured absorbed doses at the EF and PM for different shielding mass thicknesses in 2a Sessions I to III and in 2b Periods #1 to #3. The absorbed doses increased monotonically with the exposure durations from 2015 to 2018 as shown in Fig. 2. The mean annual dose rates (with 0.55 g/cm2 total mass shielding) were 231 ± 5 mGy/year at the EF and 82 ± 1 mGy/year at the PM. Absorbed dose measured at the PM (D PM) was 65% (0.55 g/cm2 total mass shielding), 50% (2.95 g/cm2 total mass shielding), and 46% (6.23 g/cm2 total mass shielding) lower than the values at the EF (D EF) for 3 years (Session III). The mean dose reduction ratio (D PM/D EF) was 0.35 for the smallest shield data case (0.55 g/cm2).
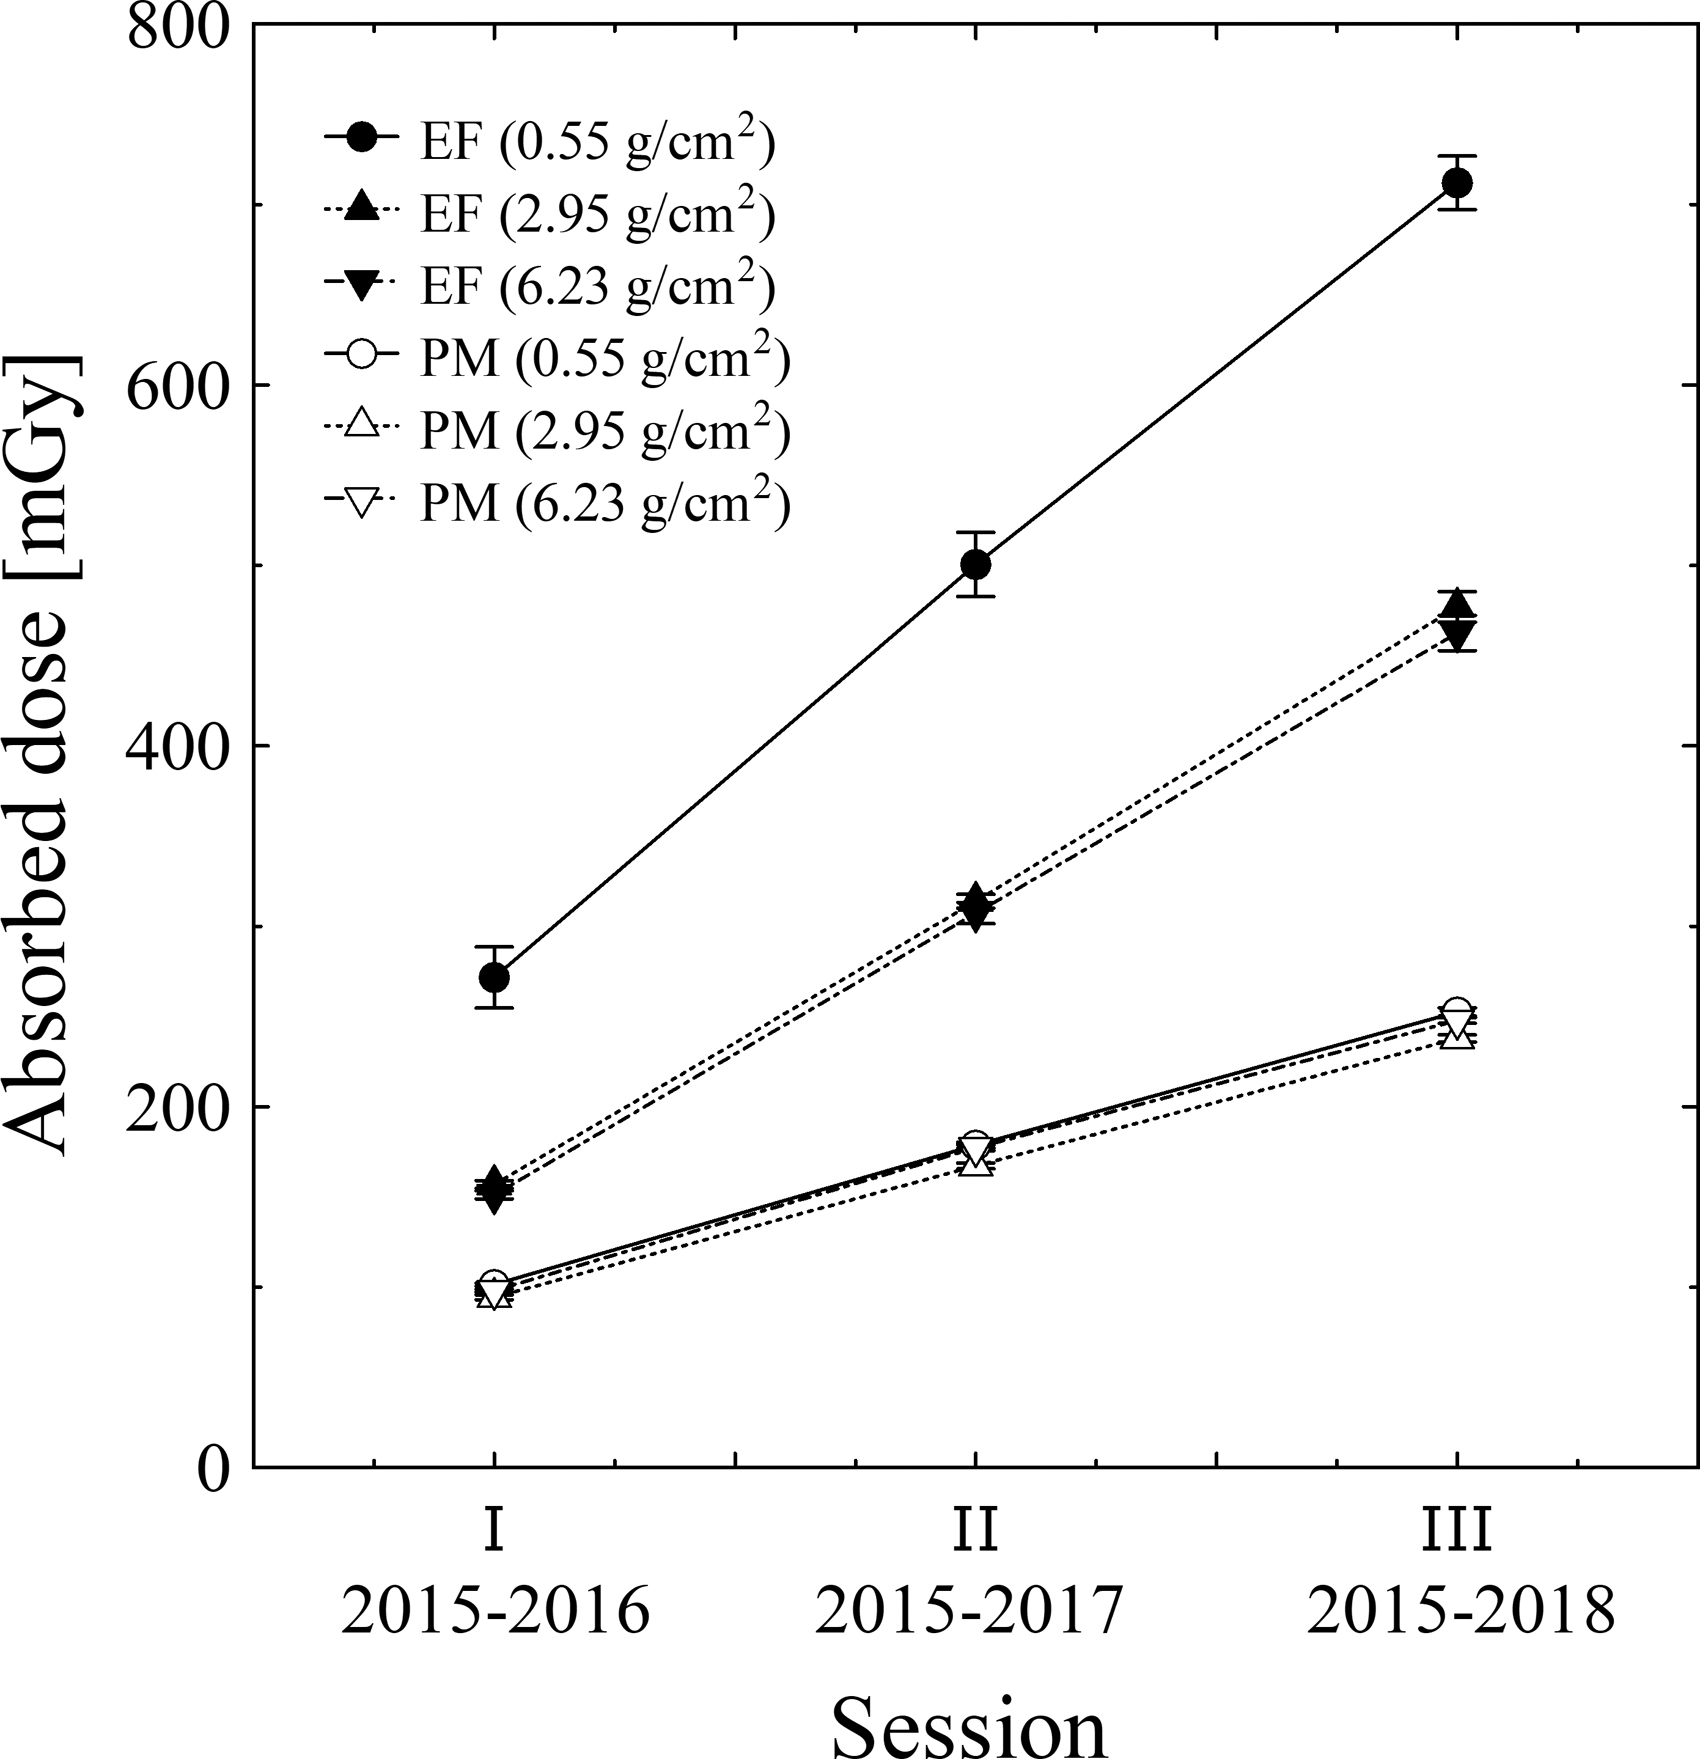
Variations of absorbed dose data with shielding materials as a function of exposure duration from 2015 to 2018 in Sessions I to III.
Absorbed Dose Data for the Exposure Facility (EF) and Pressurized Module (PM) for Different Shielding Mass Thicknesses in the Sessions
Absorbed Dose Data for the Exposure Facility (EF) and Pressurized Module (PM) for Different Shielding Mass Thicknesses in the Periods
4. Discussion
Figure 3 shows the relative variations of absorbed dose as a function of shielding mass thickness in the three periods. The data are normalized by the EF data with 0.55 g/cm2 total mass shielding in each period. The dose decreased with the mass shielding thickness at the EF, while it remained almost constant at the PM. In general, relative doses of GCRs decrease due to the breakup of heavy charged particles into lighter nuclei due to nuclear fragmentation reactions interacted with materials and the absorption of the low-energy component in the materials. The measurement data consist almost completely of only the charged particle component because the dosimeters we used were insensitive to neutrons and there is a very low contribution by other secondary radiations. Low-energy protons were easily stopped in the material, so that the relative dose dropped for the mass shielding thickness of several g/cm2. The GCR simulation (solid line) indicated that the measured mean dose reduction ratio (D PM/D EF = 0.35) required ∼26 g/cm2 of additional shielding mass thickness. In accordance with past observations in the same PM under the solar minimum from 2008 to 2010 (Nagamatsu et al., 2013), the mean annual absorbed dose rates measured with thermoluminescence dosimeters ranged from 98 to 114 mGy/year with 10% uncertainty depending on the location in the PM. The present data are 16–28% lower than the past data. One explanation we could offer was the difference in solar activity and ISS altitude. Another possibility was the difference in the shielding mass distribution due to materials stored in the module at the time of measurements.
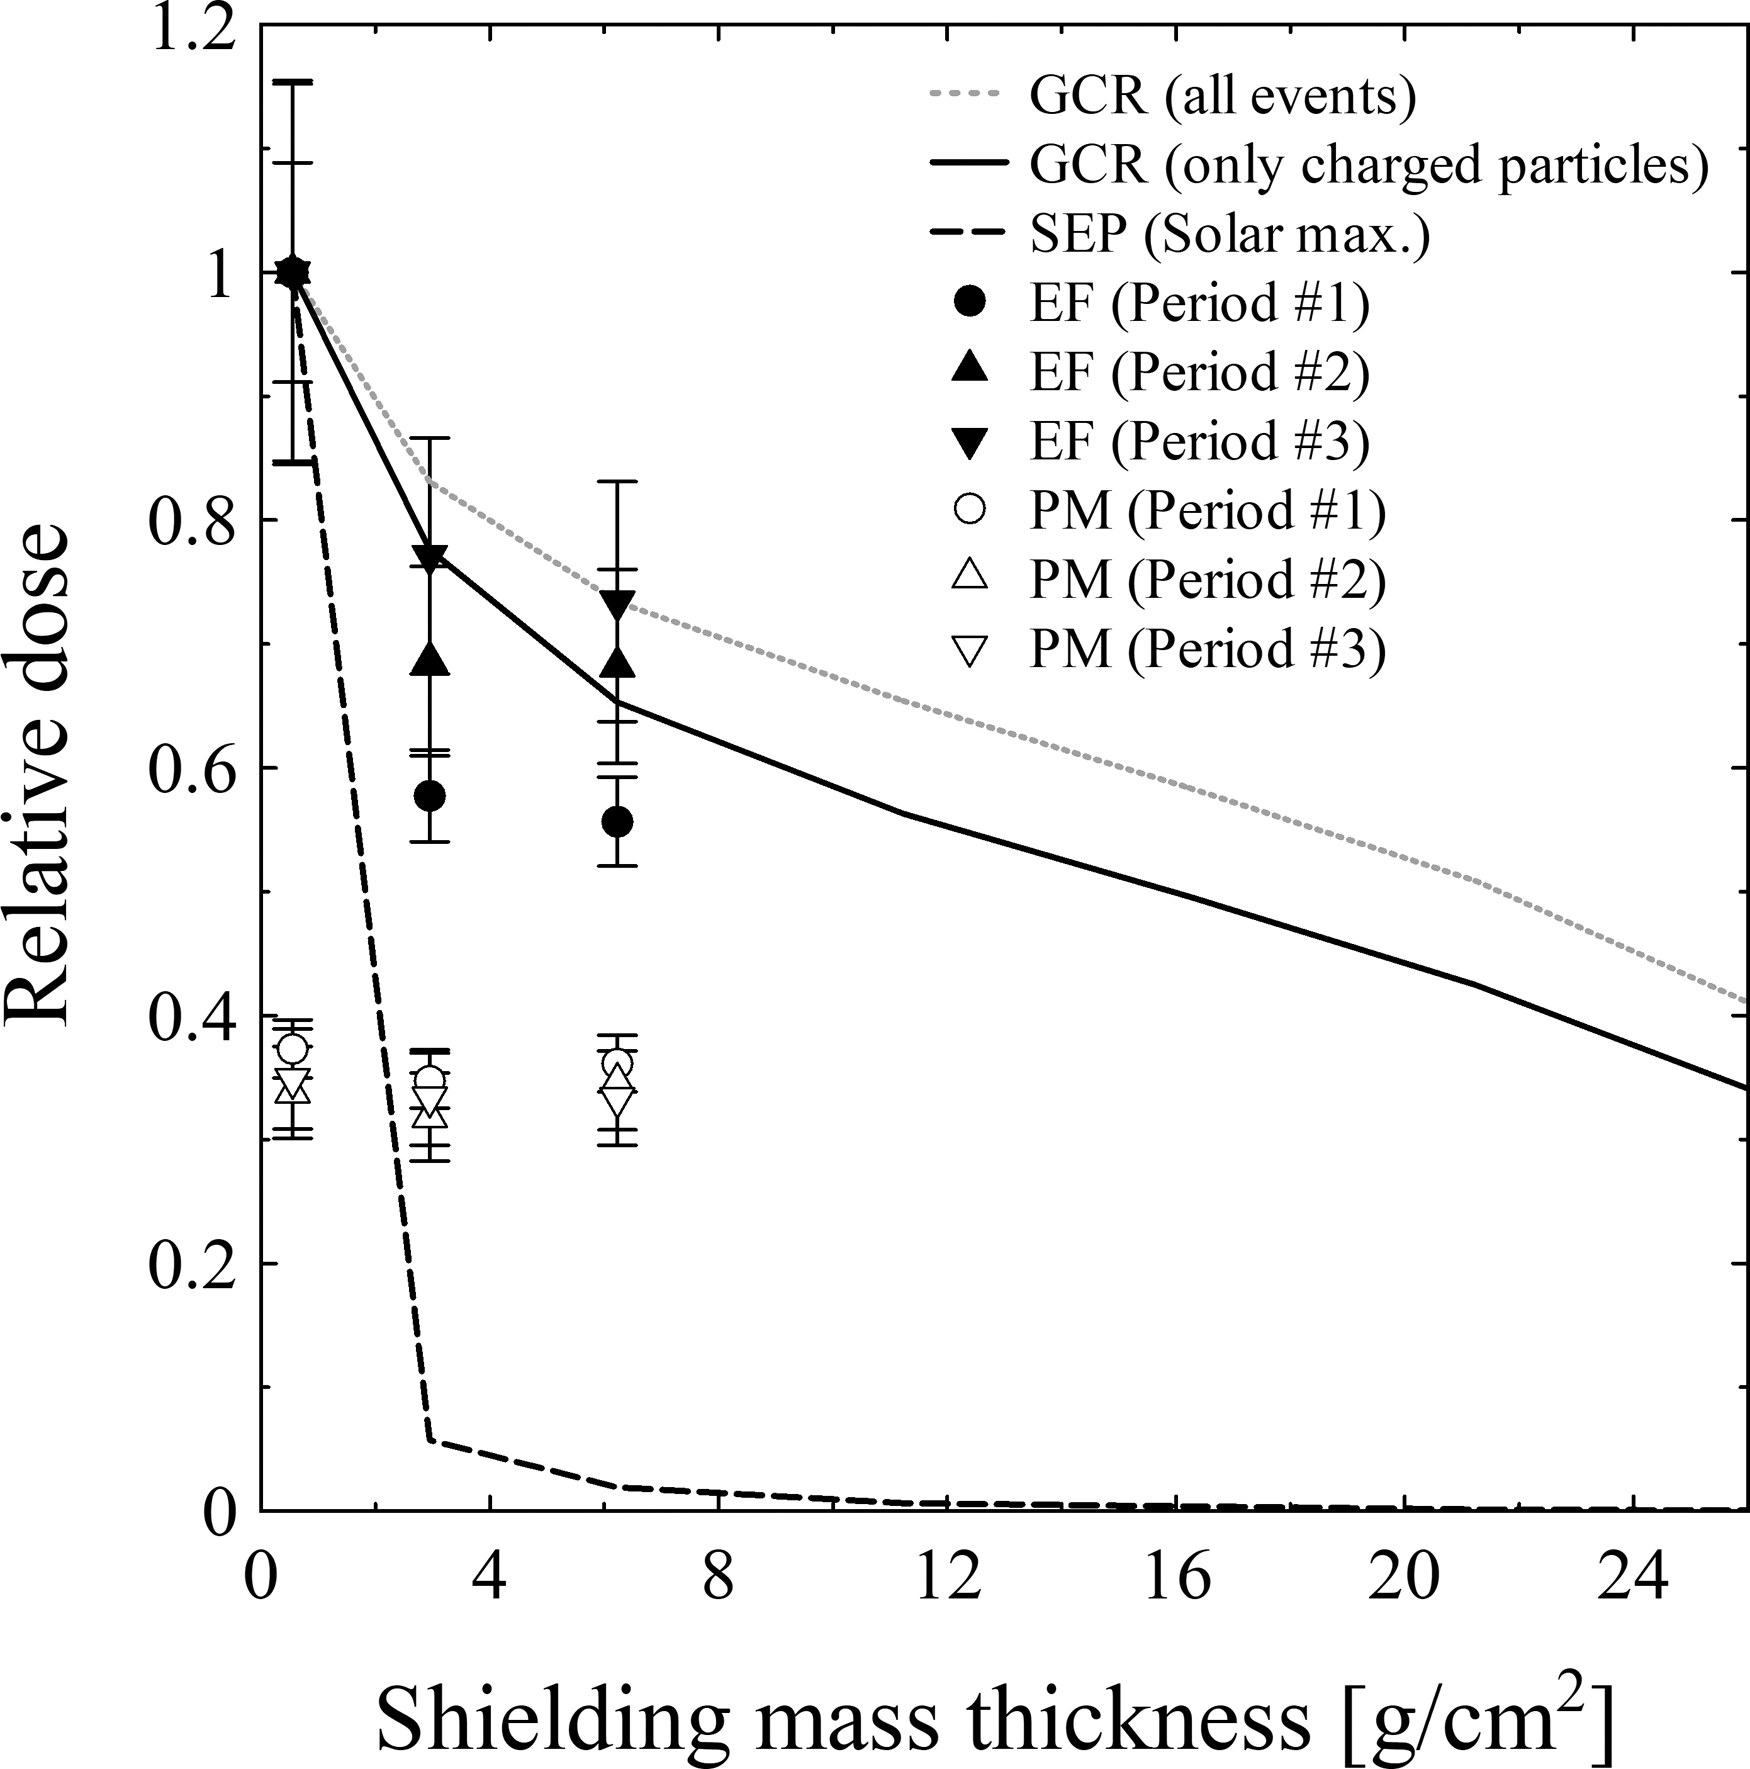
Relative variations of absorbed dose as a function of shielding mass thickness in Periods #1 to #3. Lines denote the simulation results: (dotted line) GCRs including all secondary radiations of neutrons, gamma rays, muons and pions; (solid line) only the charged particle component of GCRs and secondary radiations; and (dashed line) SEPs that occurred at the solar maximum.
In Fig. 3, we observed the following points. (1) The dose reduction in Period #1 was larger for the shielding mass thickness change from 0.55 to 2.95 g/cm2 than in other periods. (2) The relative doses in Period #3 were larger for the shielding mass thicknesses of 2.95 and 6.23 g/cm2 than in other periods. (3) The relative dose variation in Period #2 was in better agreement with the simulation of the GCRs (solid line) than in other periods. Figure 4 shows the time variations of proton fluxes observed by the National Oceanic and Atmospheric Administration (NOAA) Geostationary Operational Environmental Satellites (GOES) (GOES-13 in 2015–2017 and GOES-15 in 2018). The measured dose rate data at the EF are plotted as well. Several large SEP events were observed in Periods #1 and #3. Larger numbers of >10 MeV proton events occurred in Period #1 than in other periods, while highly intense events of >100 MeV protons occurred in Period #3. The dose rate should increase monotonically if only solar activity is affected. The data with 2.95 and 6.23 g/cm2 shielding mass thickness materials increased slightly, while the inverse correlation was observed for the 0.55 g/cm2 data case. The large fluctuation might be due to an effect from the dosimeter locations on the panels. The dosimeters with 0.55 g/cm2 shielding mass thickness were installed at the panel edges, where the docking frame of the panels with the EF module was located beside the dosimeters. The other dosimeters with 2.95 and 6.23 g/cm2 shielding mass thicknesses were installed at the center of the panels facing toward free space completely.
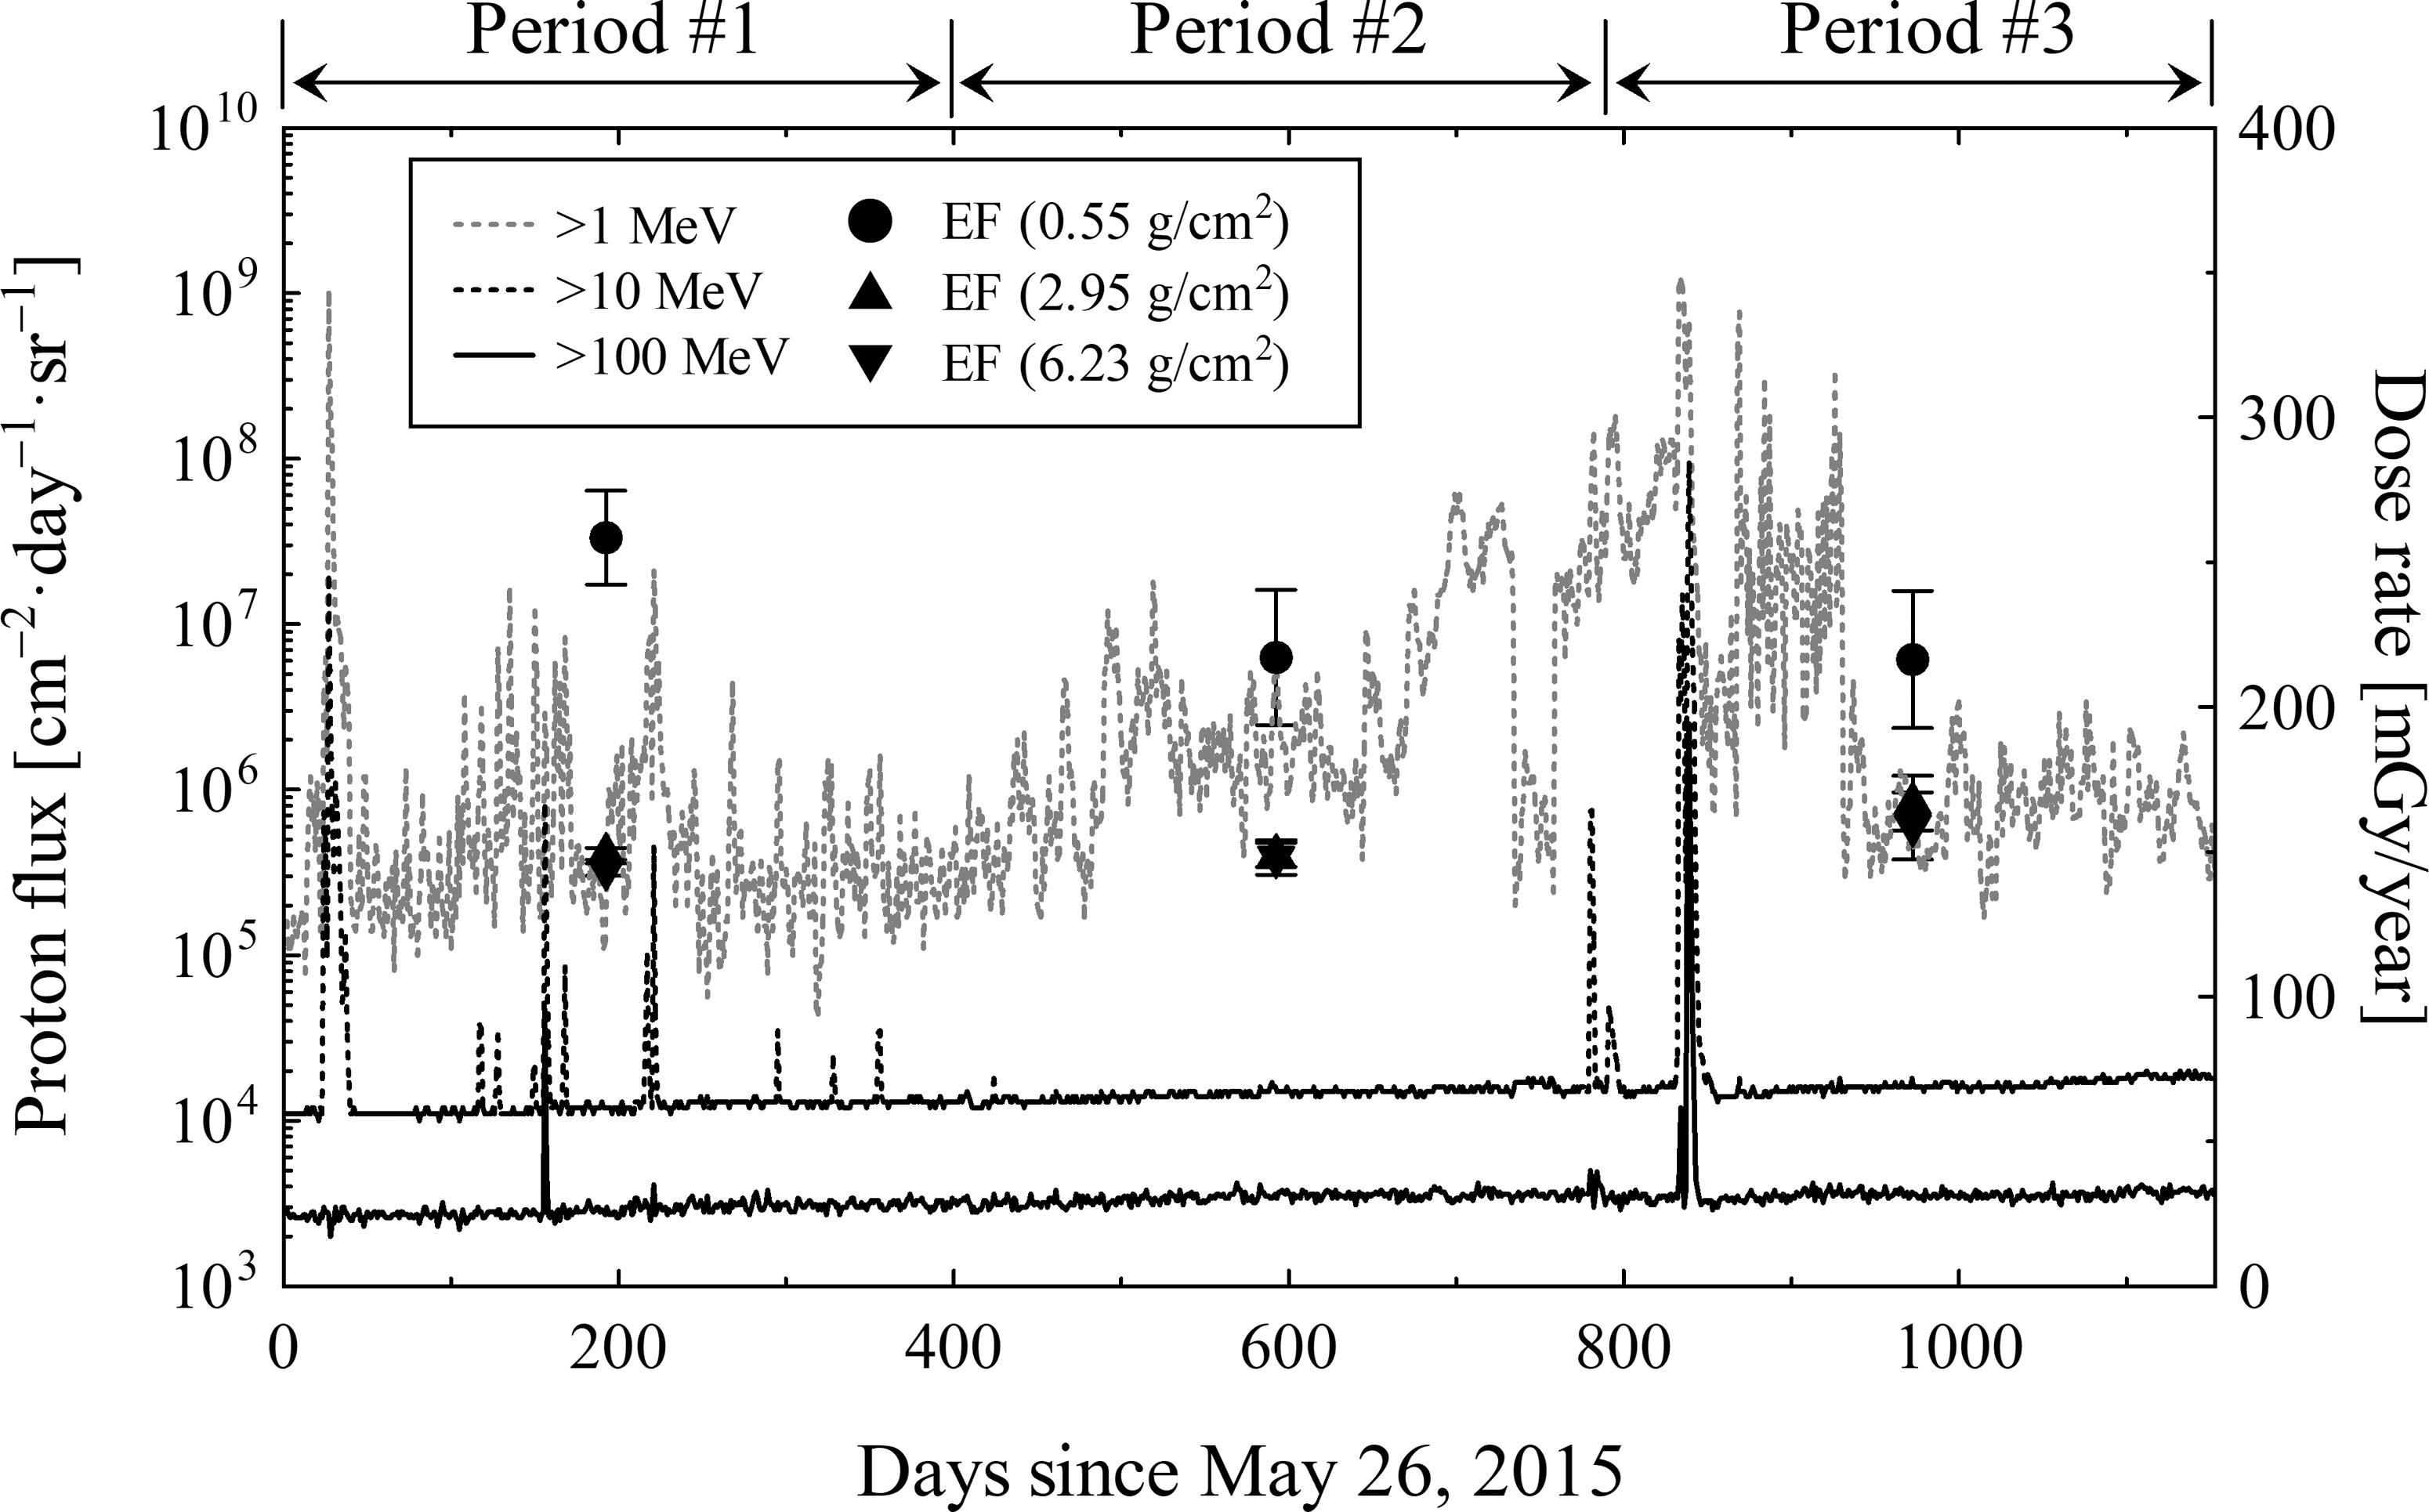
Time variations of proton fluxes observed with NOAA GOES-13 and 15 and the measured dose rate at the EF during 2015–2018.
All the low-energy 1 MeV protons (range in material: 0.003 g/cm2) should stop in the aluminum package (0.55 g/cm2) in front of the dosimeters. In the >10 MeV proton events, middle-energy 25–60 MeV protons (range in material: 0.55–2.95 g/cm2) should contribute to the measured dose result with the 0.55 g/cm2 shielding material and then be absorbed in the 2.95 g/cm2 shielding material. The contribution of relatively high-energy 60–100 MeV protons would be generally smaller than the middle-energy protons because of the inverse power-law energy spectrum (Mewaldt et al., 2012), where proton flux decreases by an order magnitude. This effect strongly depends on the energy spectrum (“soft” or “hard”) of SEPs. In this analysis, we could not consider the energy spectrum for each SEP due to the data availability limitation. High-energy >100 MeV protons (range in material: 7.71 g/cm2) should contribute to the dose enhancement in the measured dose with the 6.23 g/cm2 shielding material. These views could explain the above points (1) and (2), where highly intense events of >10 MeV and >100 MeV protons occurred in Periods #1 and #3, respectively. In the quiet Period #2, there were a few SEP events. Therefore, the relative dose variation should follow only the GCR contribution (point (3) above).
5. Conclusions
We have carried out radiation dosimetry measurements at the EF and PM installed in the Japanese Kibo module of the ISS for different exposure durations during 3 years from May 2015 to July 2018. The observed relative dose variation as a function of shielding mass thickness was compared with Monte Carlo simulations considering GCRs and SEPs. The mean annual dose rates were 231 ± 5 mGy/year at the EF and 82 ± 1 mGy/year at the PM for these 3 years. The PM would be well shielded with ∼26 g/cm2 additional shielding mass thickness according to the GCR simulation. We observed three points. (1) The dose reduction in 2015–2016 (Period #1) was larger for the shielding mass thickness change from 0.55 to 2.95 g/cm2 than in other periods. (2) The relative doses in 2017–2018 (Period #3) were larger for the shielding mass thicknesses of 2.95 and 6.23 g/cm2 than in other periods. (3) The relative dose variation in 2016–2017 (Period #2) was in better agreement with the GCR simulation than in other periods. These observed points of dose reduction tendency could be explained by the energy range difference of protons in SEPs.
Footnotes
Acknowledgments
The GOES 13 and 15 particle data were produced in real time by the NOAA Space Weather Prediction Center (SWPC) and were distributed by the NOAA National Geophysical Data Center (NGDC).
Author Disclosure Statement
No competing financial interests exist.
Abbreviations Used
Associate Editor: Lewis Dartnell