
Abstract
Hydrothermal systems host microbial communities that include some of the most deeply branching members of the tree of life, and recent work has suggested that terrestrial hot springs may have provided ideal conditions for the origin of life. Hydrothermal microbial communities are a potential source for biosignatures, and the presence of terrestrial hot spring deposits in 3.48 Ga rocks as well as on the surface of Mars lends weight to a need to better understand the preservation of biosignatures in these systems. Although there are general patterns of elemental enrichment in hydrothermal water dependent on physical and geochemical conditions, the elemental composition of bulk hydrothermal microbial communities (here termed biocumulus, including cellular biomass and accumulated non-cellular material) is largely unexplored. However, recent work has suggested both bulk and spatial trace element enrichment as a potential biosignature in hot spring deposits. To elucidate the elemental composition of hot spring biocumulus samples and explore the sources of those elements, we analyzed a suite of 16 elements in hot spring water samples and corresponding biocumulus from 60 hot springs sinter samples, and rock samples from 8 hydrothermal areas across Yellowstone National Park. We combined these data with values reported in literature to assess the patterns of elemental uptake into biocumulus and retention in associated siliceous sinter. Hot spring biocumuli are of biological origin, but organic carbon comprises a minor percentage of the total mass of both thermophilic chemotrophic and phototrophic biocumulus. Instead, the majority of hot spring biocumulus is inorganic material—largely silica—and the distribution of major and trace elements mimics that of surrounding rock and soil rather than the hot spring fluids. Analyses indicate a systematic loss of biologically associated elements during diagenetic transformation of biocumulus to siliceous sinter, suggesting a potential for silica sinter to preserve a trace element biosignature.
1. Introduction
Terrestrial hydrothermal systems, such as the silica-saturated hot springs in Yellowstone National Park, USA have gained new importance to astrobiology. Recent work has brought Darwin's famous speculation on the initiation of life in “warm little ponds” in a letter to his colleague Joseph Hooker in 1871 to the forefront, with the idea that terrestrial hot springs may have provided the environments necessary for the initiation of life on Earth (e.g., Follmann and Brownson, 2009; Damer and Deamer, 2015; Deamer and Georgiou, 2015; Forsythe et al., 2015; Pearce et al., 2017; Van Kranendonk et al., 2017; Milshteyn et al., 2018; Ranjan et al., 2019; Deamer et al., 2019; Damer and Deamer, 2020). Further, terrestrial hot spring deposits with apparent evidence for life have been found in the 3.48 Ga Dresser Formation in Australia (Djokic et al., 2017, 2021). Hydrothermal environments also serve as analogues for better understanding microbial communities in continental and marine settings during the Archean era (e.g., Schuler et al., 2017; Havig and Hamilton, 2019a; Havig and Hamilton 2019b).
Silica has been suggested as being effective at minimizing the degradation of entombed microorganisms, even through green schist facies metamorphism (Alleon et al., 2016). Hydrothermal systems can be generated and sustained for long periods of time as a result of impacts (e.g., Osinski et al., 2013). Silica deposits on Mars may be the result of past hot springs (e.g., Allen and Oehler, 2008; Milliken et al., 2008; Squyres et al., 2008; Skok et al., 2010; Ruff et al., 2011; Ruff and Farmer, 2016; Ruff et al., 2020), and siliceous hot spring deposits have been singled out as key astrobiological targets (Cady et al., 2018). Recent work has also suggested concentration of trace elements associated with entombed microbial biomass in siliceous sinter as a potential biosignature, with enrichment of trace elements associated with entombed microbial biomass in modern and recent sinter deposits in YNP (Gangidine et al., 2020), and in ∼400 Ma Drummond Basin hot spring siliceous sinter deposits (Gangidine et al., 2020). Thus, hot spring research is timely for the Perseverance rover mission in Jezero Crater and the potential follow-up sample return mission as there is evidence for past hydrothermal activity in the region around Jezero Crater, including Syrtis Major (Skok et al., 2010) and Nili Fossae (Ehlmann et al., 2009), as well as evidence for opal A and/or opal CT that could be from a hydrothermal source in the delta and floor of Jezero Crater (Tarnas et al., 2019).
There is also great impetus for making connections between subsurface processes that effect hot spring geochemical environments, and how those environments may drive microbial community elemental composition that can be preserved in the rock record. Geochemical environments can also influence the elemental composition of biomass, including a range of elemental concentrations and carbon and nitrogen isotopic signals (Havig, 2009; Havig et al., 2011; Holloway et al., 2011; Hamilton et al., 2014, 2019; Schuler et al., 2017; Havig and Hamilton, 2019a, 2019b; Gangidine et al., 2020).
Hot spring pH values can be linked to subsurface processes driving subsurface boiling and the resulting phase separation (e.g., White et al., 1971, 1988; Truesdell and Fournier, 1976; Fournier, 1989; Nordstrom et al., 2009). Hot springs that receive input from deeply sourced hydrothermal water with minimal subsurface boiling are typically circum-neutral to alkaline in pH (Fig. 1). In areas where subsurface boiling generates phase separation, these phases feed hot springs to varying degrees, producing hot springs that range from liquid phase dominated to vapor phase dominated. Liquid phase dominant (LPD) springs are associated with higher chloride concentrations, lower sulfate concentrations, and circum-neutral to slightly acidic pH values; whereas vapor-phase dominated springs are associated with higher concentrations of sulfate (due to oxidation of accrued sulfide to sulfuric acid), lower concentrations of chloride, and acidic pH values (Fig. 1). pH is a key driver of solubility of many major and trace elements and will dictate, in part, the elemental composition of the fluids feeding hot springs. Reactions with rock and soil at the surface will also act to preferentially concentrate elements depending on subsurface processes, effecting element availability for hot spring microbial communities. For the most up-to-date review of the Yellowstone hydrothermal system, see Hurwitz and Lowenstern (2014) and sources listed therein.
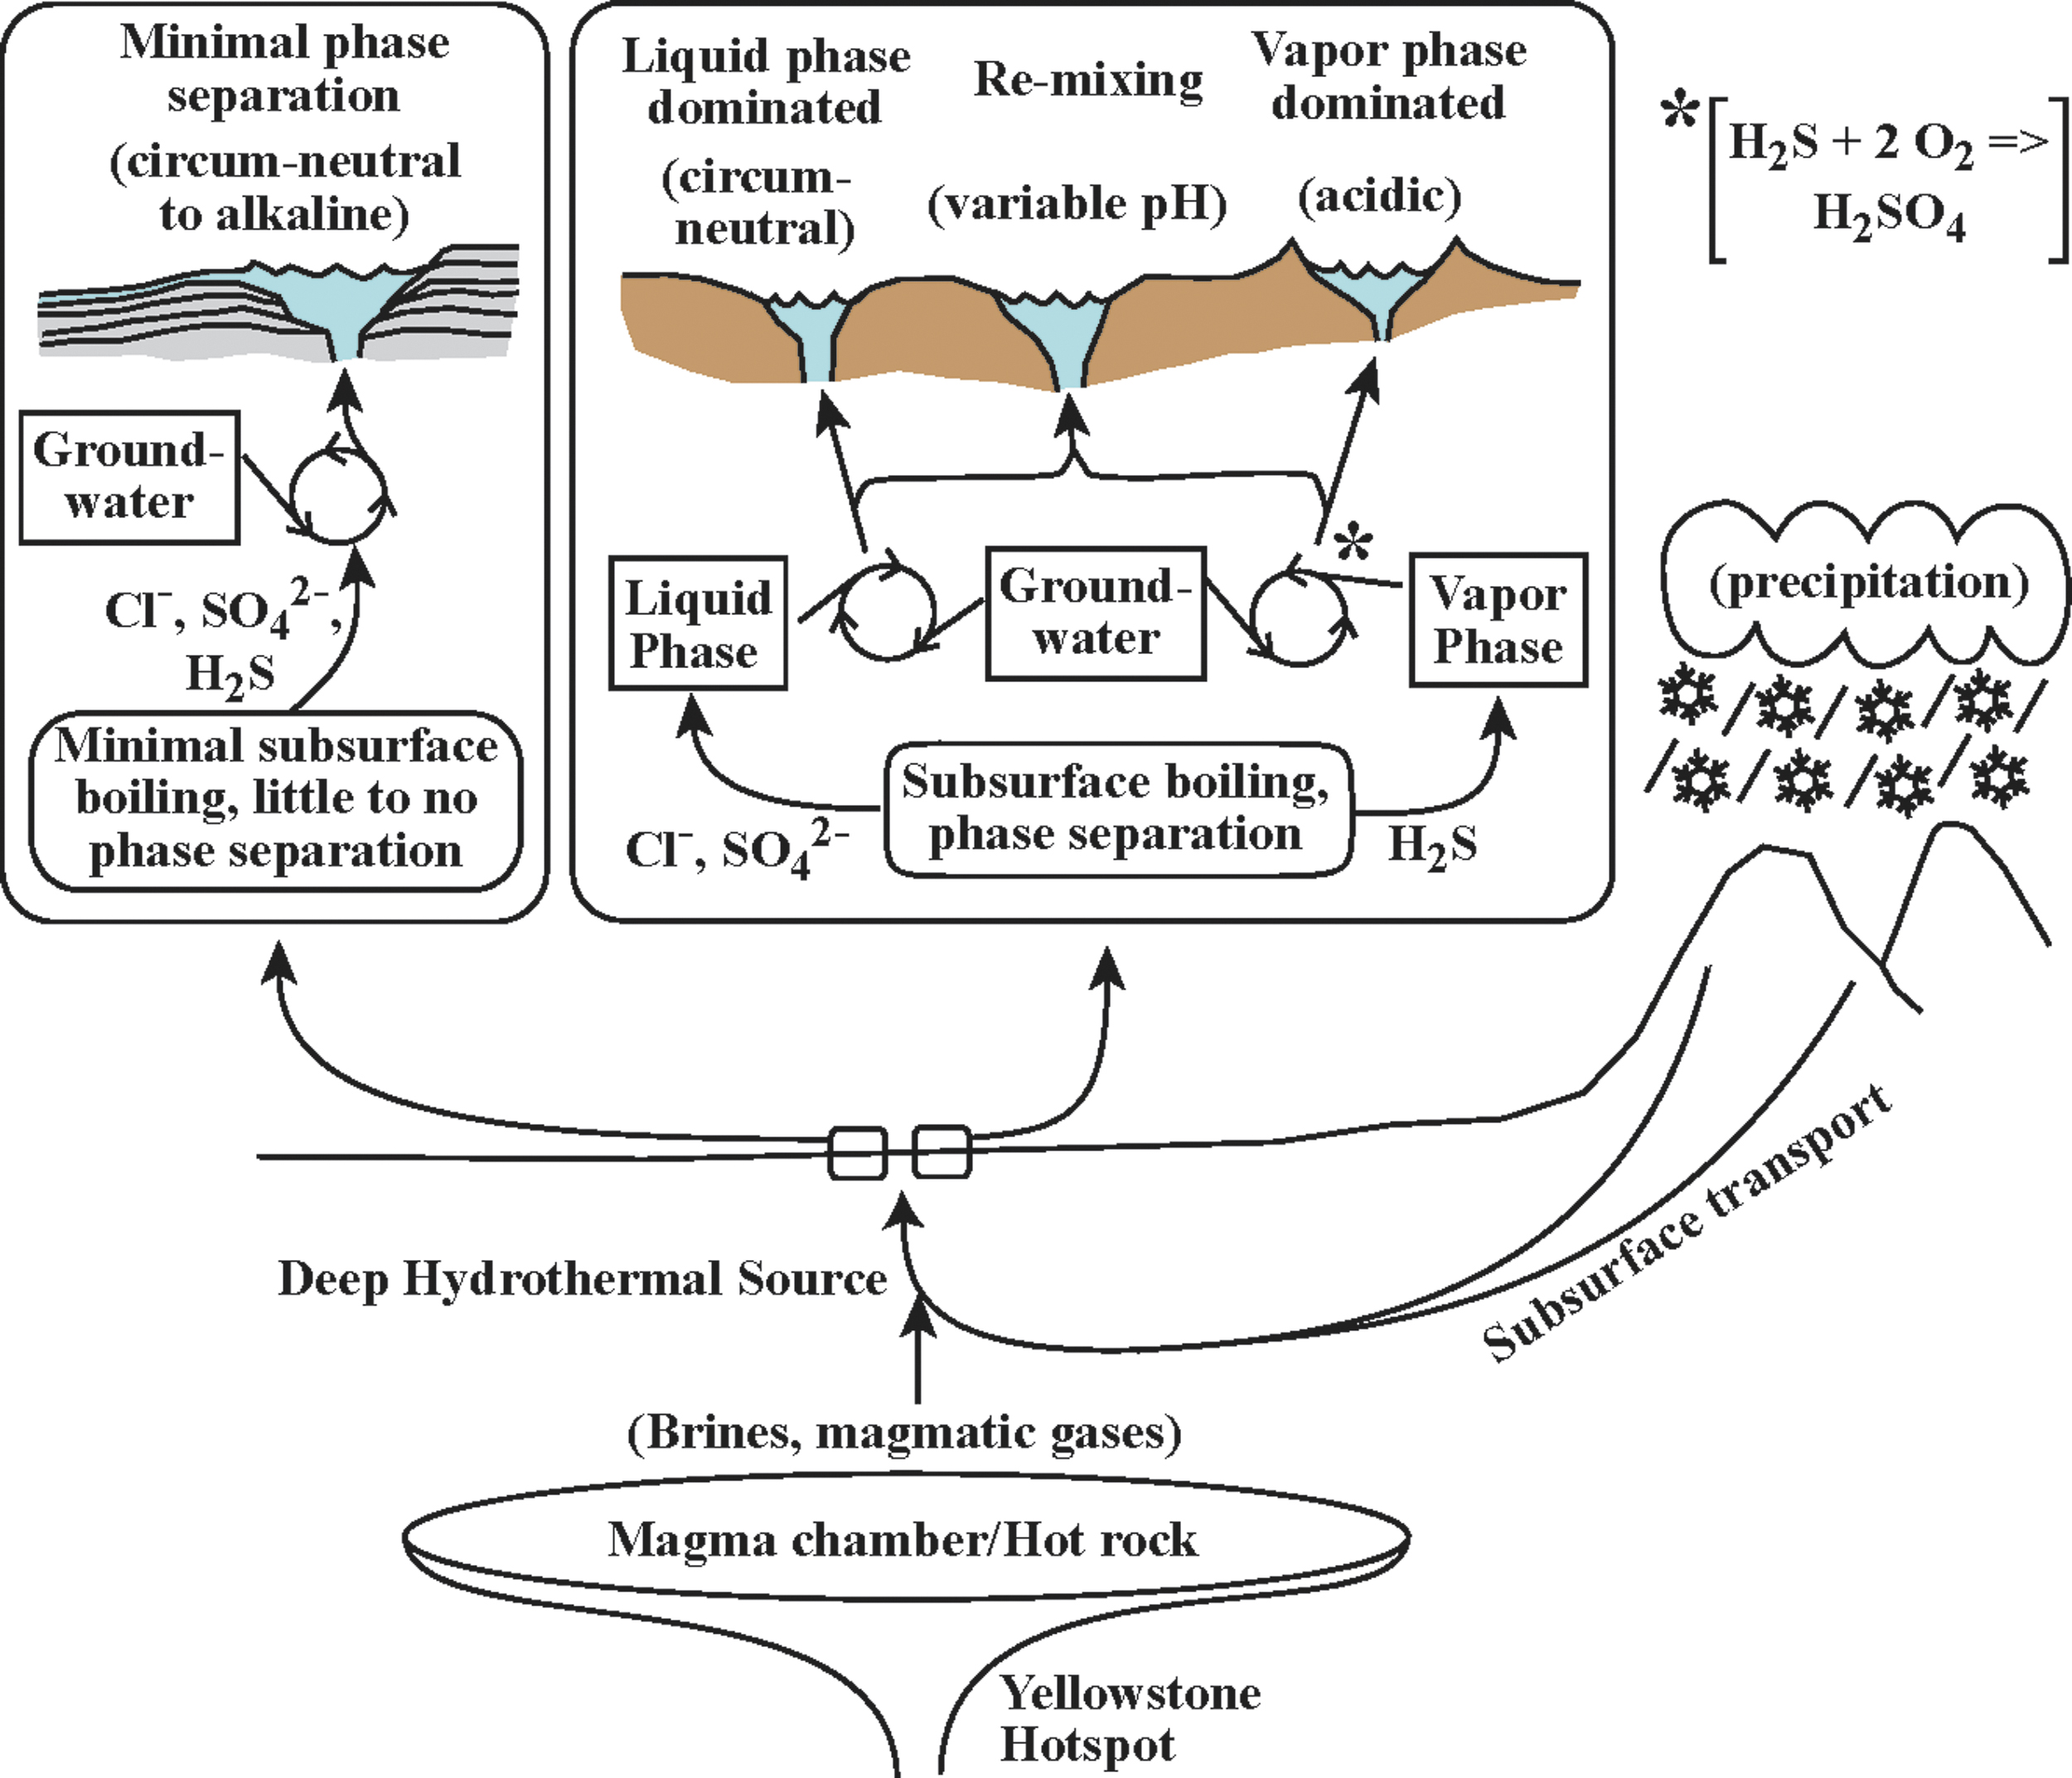
Conceptual model for subsurface processes driving geochemistry of hot springs in Yellowstone National Park.
Supersaturation (predominantly silica or calcite for terrestrial hydrothermal systems) drives mineral precipitation as hydrothermal water cools. As layers of precipitate form, biomass may be entombed. Through diagenesis, much of the original material and structure that made up the entombed microbial community can be transformed or lost (e.g., Guidry and Chafetz, 2003; Brasier et al., 2004; Lopez-Garcia et al., 2006). In fact, diagenetic processes have been used to challenge the morphological and carbon isotope evidence that suggest the presence of biosignatures in the cherts of the 3.465 Ga Apex Basalt of the Warrawoona Group in Western Australia and the metasedimentary units of the 3.80 Ga Isua Supracrustal Belt and putative Banded Iron Formations in the 3.85 Ga Akilia Formation of Greenland (Brasier et al., 2004; Lopez-Garcia et al., 2006). The preservation of lipid biomarker compounds through diagenesis (Simoneit et al., 1998; Brocks et al., 2003) suggests that some organic components (e.g., hopane and sterane hydrocarbons) of microbial communities can be preserved in the geological record, though French et al. (2015) suggest that some hydrocarbon biomarkers (specifically lipids) may not be useful for thermally mature Archean rocks (French et al., 2015). However, recent work revisiting the preservation potential of silica in hot spring systems suggests there may be higher fidelity of biosignature preservation associated with silica precipitation than previously thought (e.g., Havig, 2009; Campbell et al., 2015, 2019; Alleon et al., 2016; Ruff and Farmer, 2016; Gangidine et al., 2020; Teece et al., 2020; Williams et al., 2021). Further research has shown that the preservation quality of microbial textures (i.e., microbial fabrics) is impacted by the rate of silicification of microbial communities coupled with the disturbances of silica phases caused by diagenesis (Campbell et al., 2015). A more comprehensive understanding of the geochemical composition of microbial communities and preserved siliceous microbial textures may provide more biomarkers as signatures of microbial communities in the rock record.
In an effort to understand how internal and external processes affect the elemental composition of hot spring microbial communities, we sampled 86 chemotrophic and phototrophic bulk microbial communities from 60 hot springs, in the framework of a larger-scale water sampling regime (102 hot spring water samples from 8 hydrothermal areas within Yellowstone National Park). We coupled these samples to contextual samples, including local rock units (n = 4), sinter (n = 31), and local biota samples (moss, lichen, lodgepole pine needles, bison fur, and feces, n = 7) (Fig. 2). In addition, we compiled literature values of similar samples collected in Yellowstone National Park (YNP), including hydrothermal areas not included in this study's sampling areas (Fig. 2), which in total comprised 599 water samples, 63 bulk microbial community samples from 49 hot springs, 1 sinter sample, 8 rock and soil samples, and 6 contextual samples of local biota (grass, sedge, bison fur and feces, lodgepole pine needles, and insects found in nearby hot springs) (Havig, 2009; Havig et al., 2011; Holloway et al., 2011; McCleskey et al., 2014). We focused on 16 elements, which we grouped into 1 of 3 categories: those that are major components of biomass (BIO: C, N, and P), trace components of biomass integral to biological functions (BIO-TRACE: Mg, V, Mn, Fe, Co, Ni, Cu, Zn, and Mo), and elements not known to play important roles in biological functions (NON-BIO: Li, Al, Ga, and As). Here, we draw the distinction for our study between elements integral to biological function (e.g., enzyme components, structural components, etc.) and elements that may be utilized for energy-gaining redox reactions by specific microbial lineages but are not known to be used for integral biological function, specifically for As. Similar patterns of elemental sequestration were found for biocumulus (which includes cellular biomass and accumulated non-cellular material, described in greater detail below) collected from areas with minimal subsurface phase separation and areas with a range of vapor phase to liquid phase input from areas with subsurface phase separation. Our results indicate that the elemental composition is the result of biological fixation, accumulation from hydrothermal water, and input from soil particulates transported into the systems. A comparison of bulk microbial community samples from hot springs with minimal subsurface boiling to those where extensive subsurface boiling has occurred (resulting in LPD to vapor phase dominant [VPD] input) shows differences in elemental uptake and sequestration. Elemental composition differences between biocumulus and associated silica sinter samples suggest preservation of an elemental biosignature for minimal phase separation (MPS) versus phase separation microbial communities.
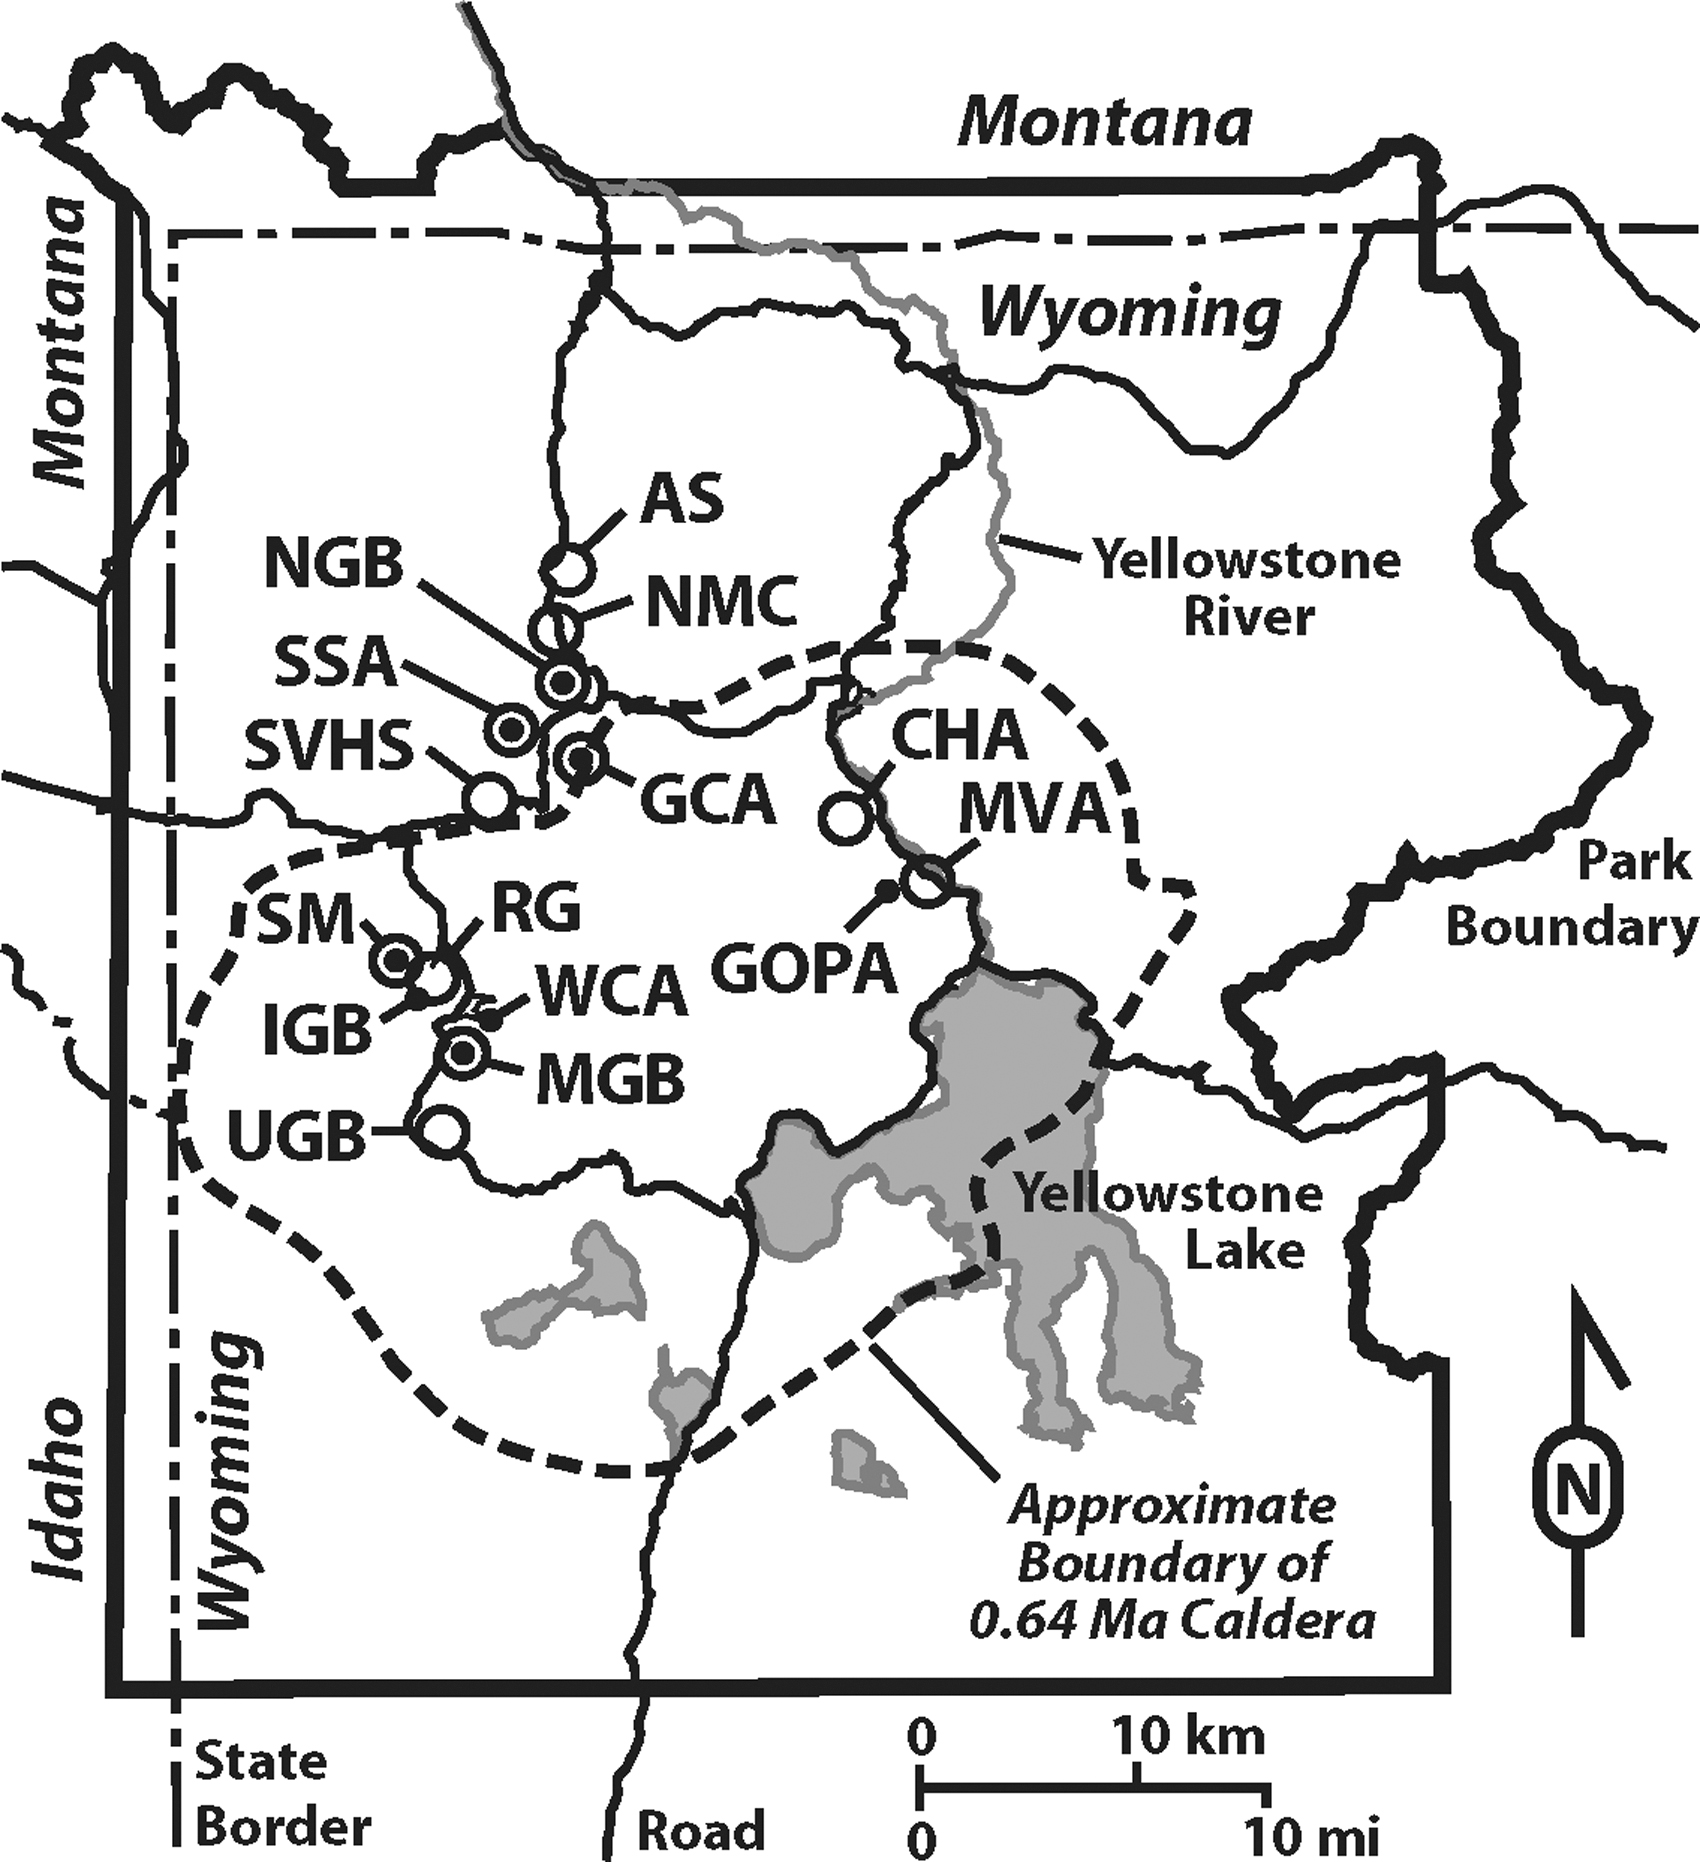
Map of YNP with hydrothermal sampling areas labeled. Areas shown include: AS, Amphitheater Springs; CHA, Crater Hills Area; GCA, Geyser Creek Area; GOPA, Greater Obsidian Pool Area, MVA; IGB, Imperial Geyser Basin; LGB, Lower Geyser Basin; MGB, Midway Geyser Basin; MVA, Mud Volcano Area; NGB, Norris Geyser Basin; NMC, Norris-Mammoth Corridor; RG, River Group, LGB; SM, Sentinel Meadows, LGB; SSA, Sylvan Spring Area; SVHS, Secret Valley Hot Springs; UGB, Upper Geyser Basin; WCA, White Creek Area, LGB. Large open circles indicate sites reported in previous work, small closed circles indicate sites reported in this study, and large open circles with inset small closed circles indicate sites reported in previous work and this study.
2. Proposed New Terminology
The use of the terms “biofilm” (sessile microbial ecosystems and associated extracellular polymeric substances [EPS] attached to surfaces that actively and passively accumulate elements) (Watnick and Kolter, 2000) or “biomass” (dry weight of organic matter comprising a group of organisms in a particular habitat) (Campbell and Reece, 2005) does not fully encompass the composition of hot spring bulk microbial community samples (i.e., microbial cellular material, EPS, primary mineral precipitates, secondary minerals from alteration of allochthonous material, and allochthonous organic and inorganic material). The term “microbialite” (organosedimentary deposits that have accreted as a result of a benthic microbial community trapping and binding detrital sediment and/or forming the locus of mineral precipitation) (Burne and Moore, 1987) also does not provide a satisfying definition, as many of these hydrothermal microbial communities inhabit flowing subaqueous to subaerial environments. “Bulk microbial community” is cumbersome and neglects the inorganic fraction of the samples. We propose the new term “biocumulus” (plural: “biocumuli”) to describe these microbiological structures based on the combination of bio (latin for life) and cumulus (latin for heap, or pile), here defined as the sum of microbial community cellular biomass, EPS (e.g., polysaccharides, proteins, DNA), accumulated allochthonous material, and precipitated minerals that together form a distinctive mass that is ordered and not ascribed to sedimentary processes alone. Biocumulus would include all microbial community-associated structures (i.e., filaments, mats, and stromatolites), and it would encompass biofilms and microbialites. Examples of types of materials that this term would describe (imaged via scanning electron microscopy) are provided in Fig. 3. A conceptual model of the microstructure of hydrothermal mats, filaments, and stromatolites is shown in Fig. 4, giving a simplified cartoon representation of hot spring biocumuli.
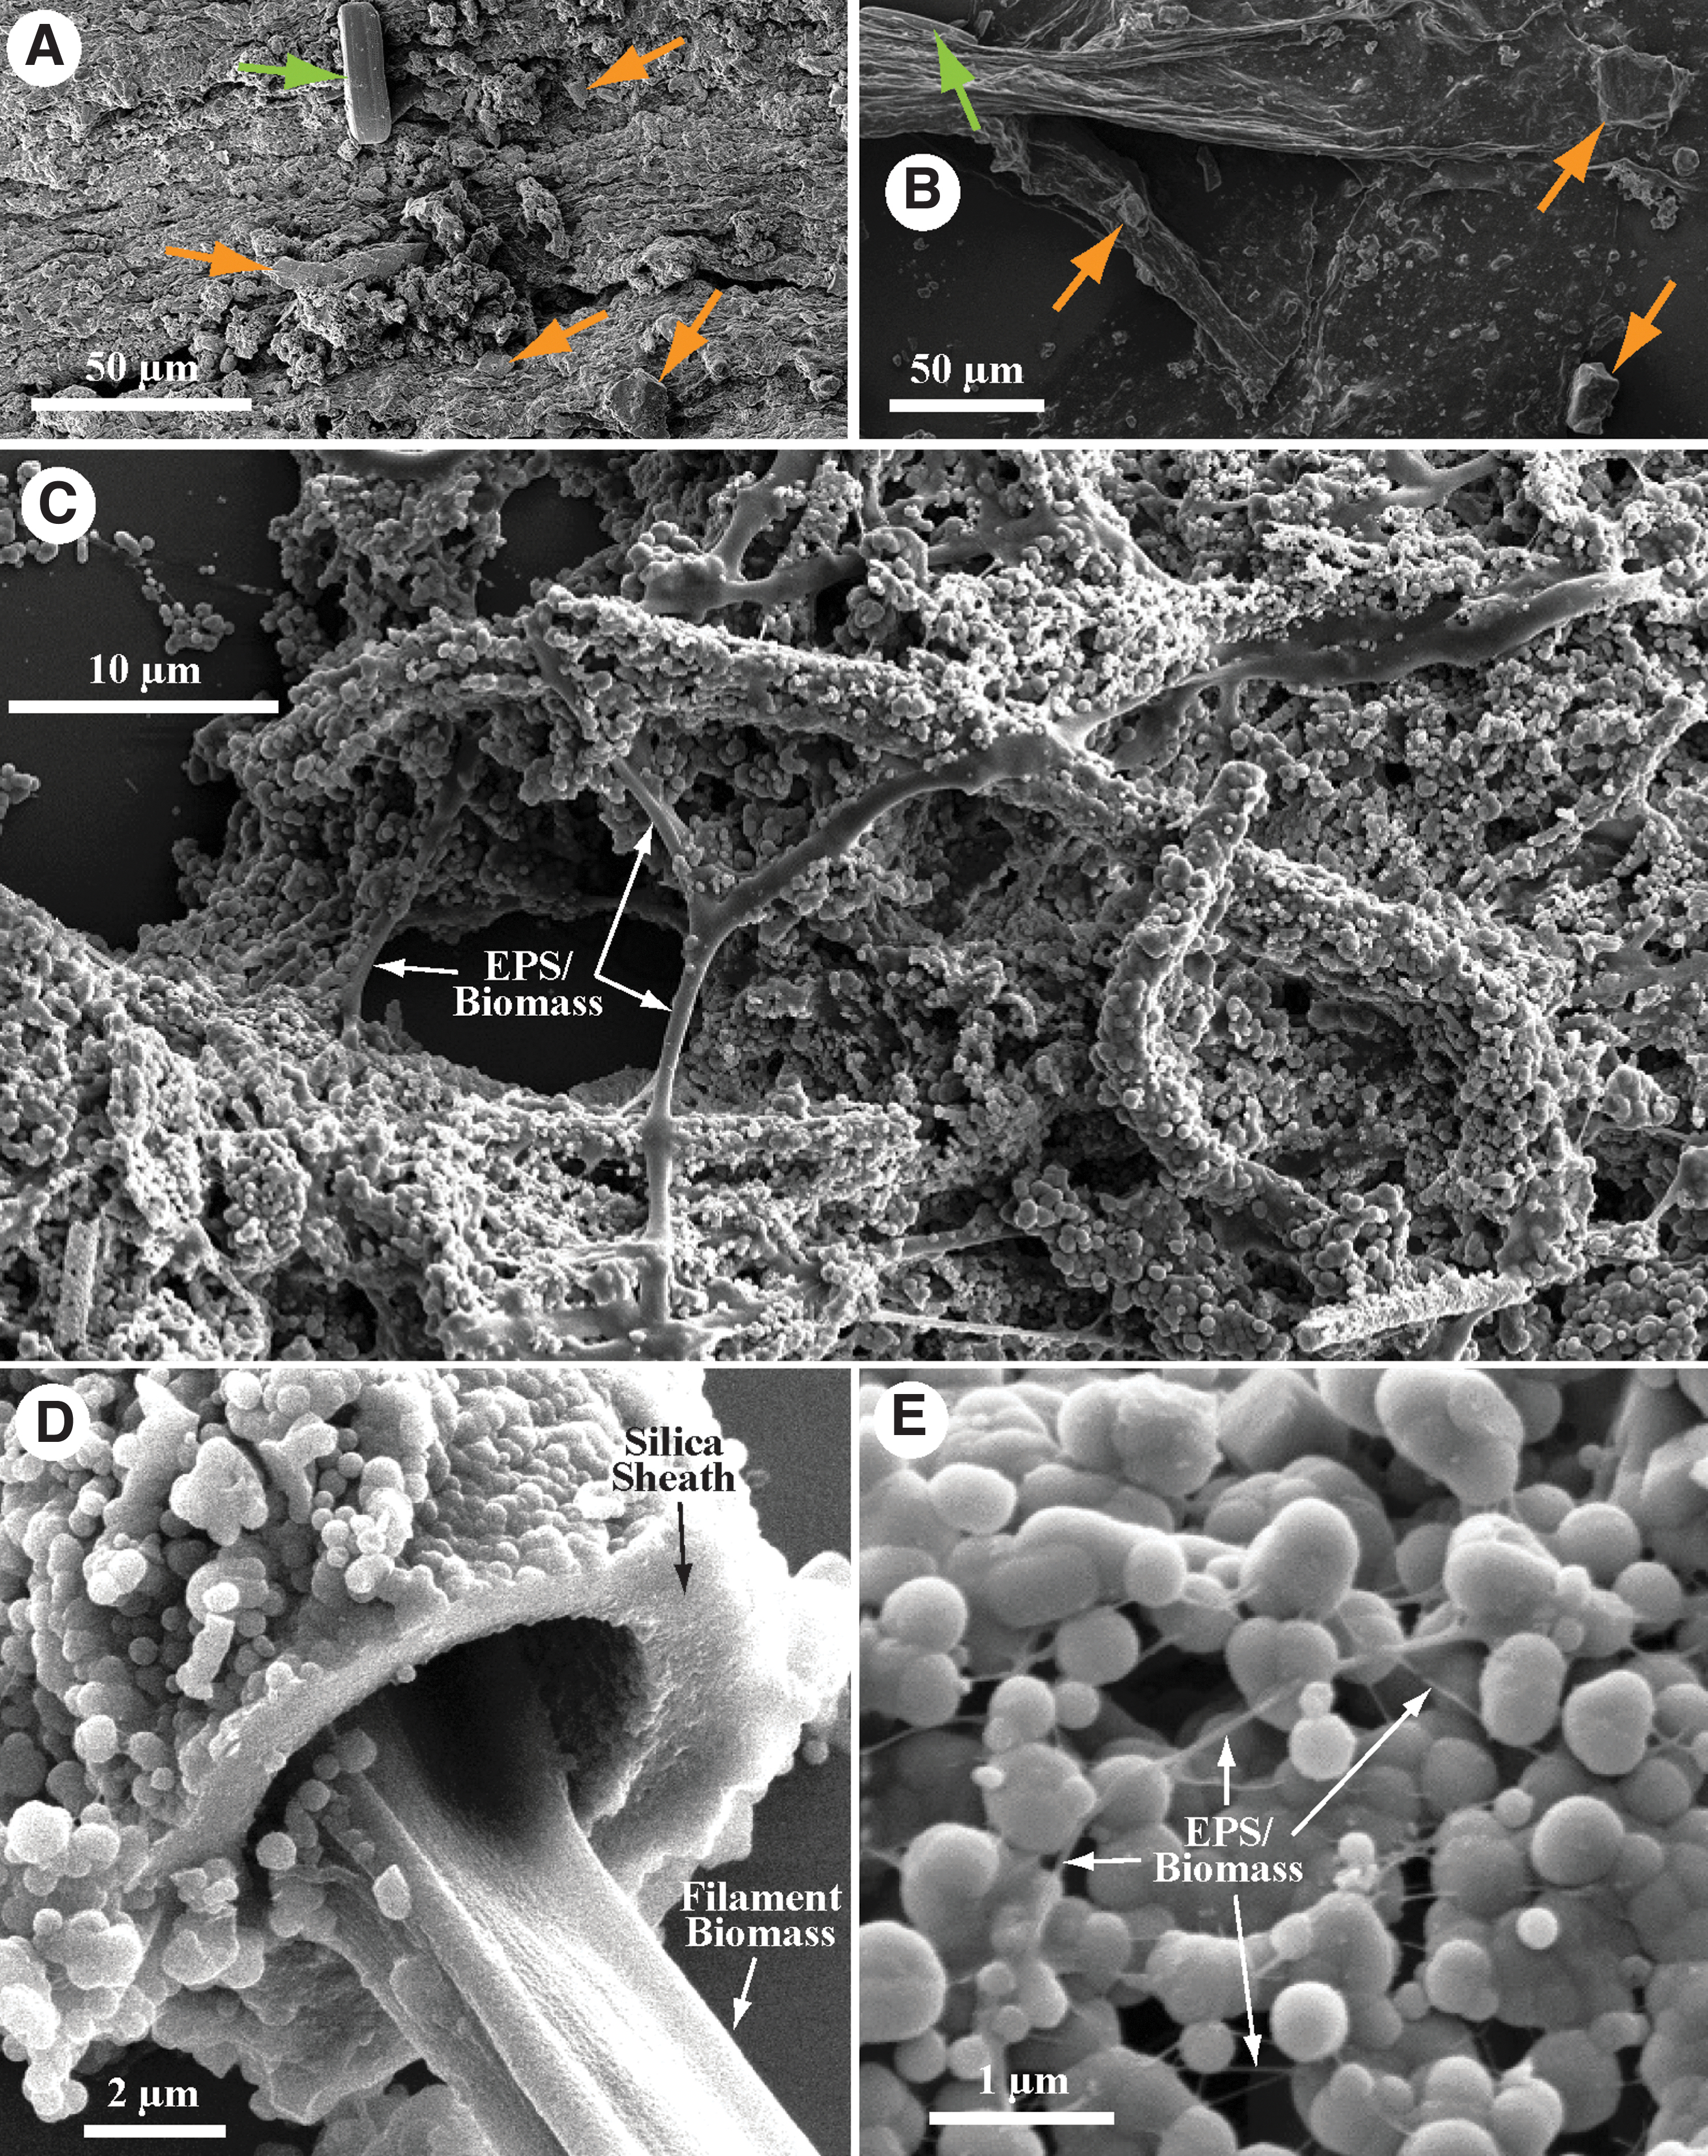
Scanning Electron Microscopy imaging of hot spring biocumulus samples. Scale bars included for each image.
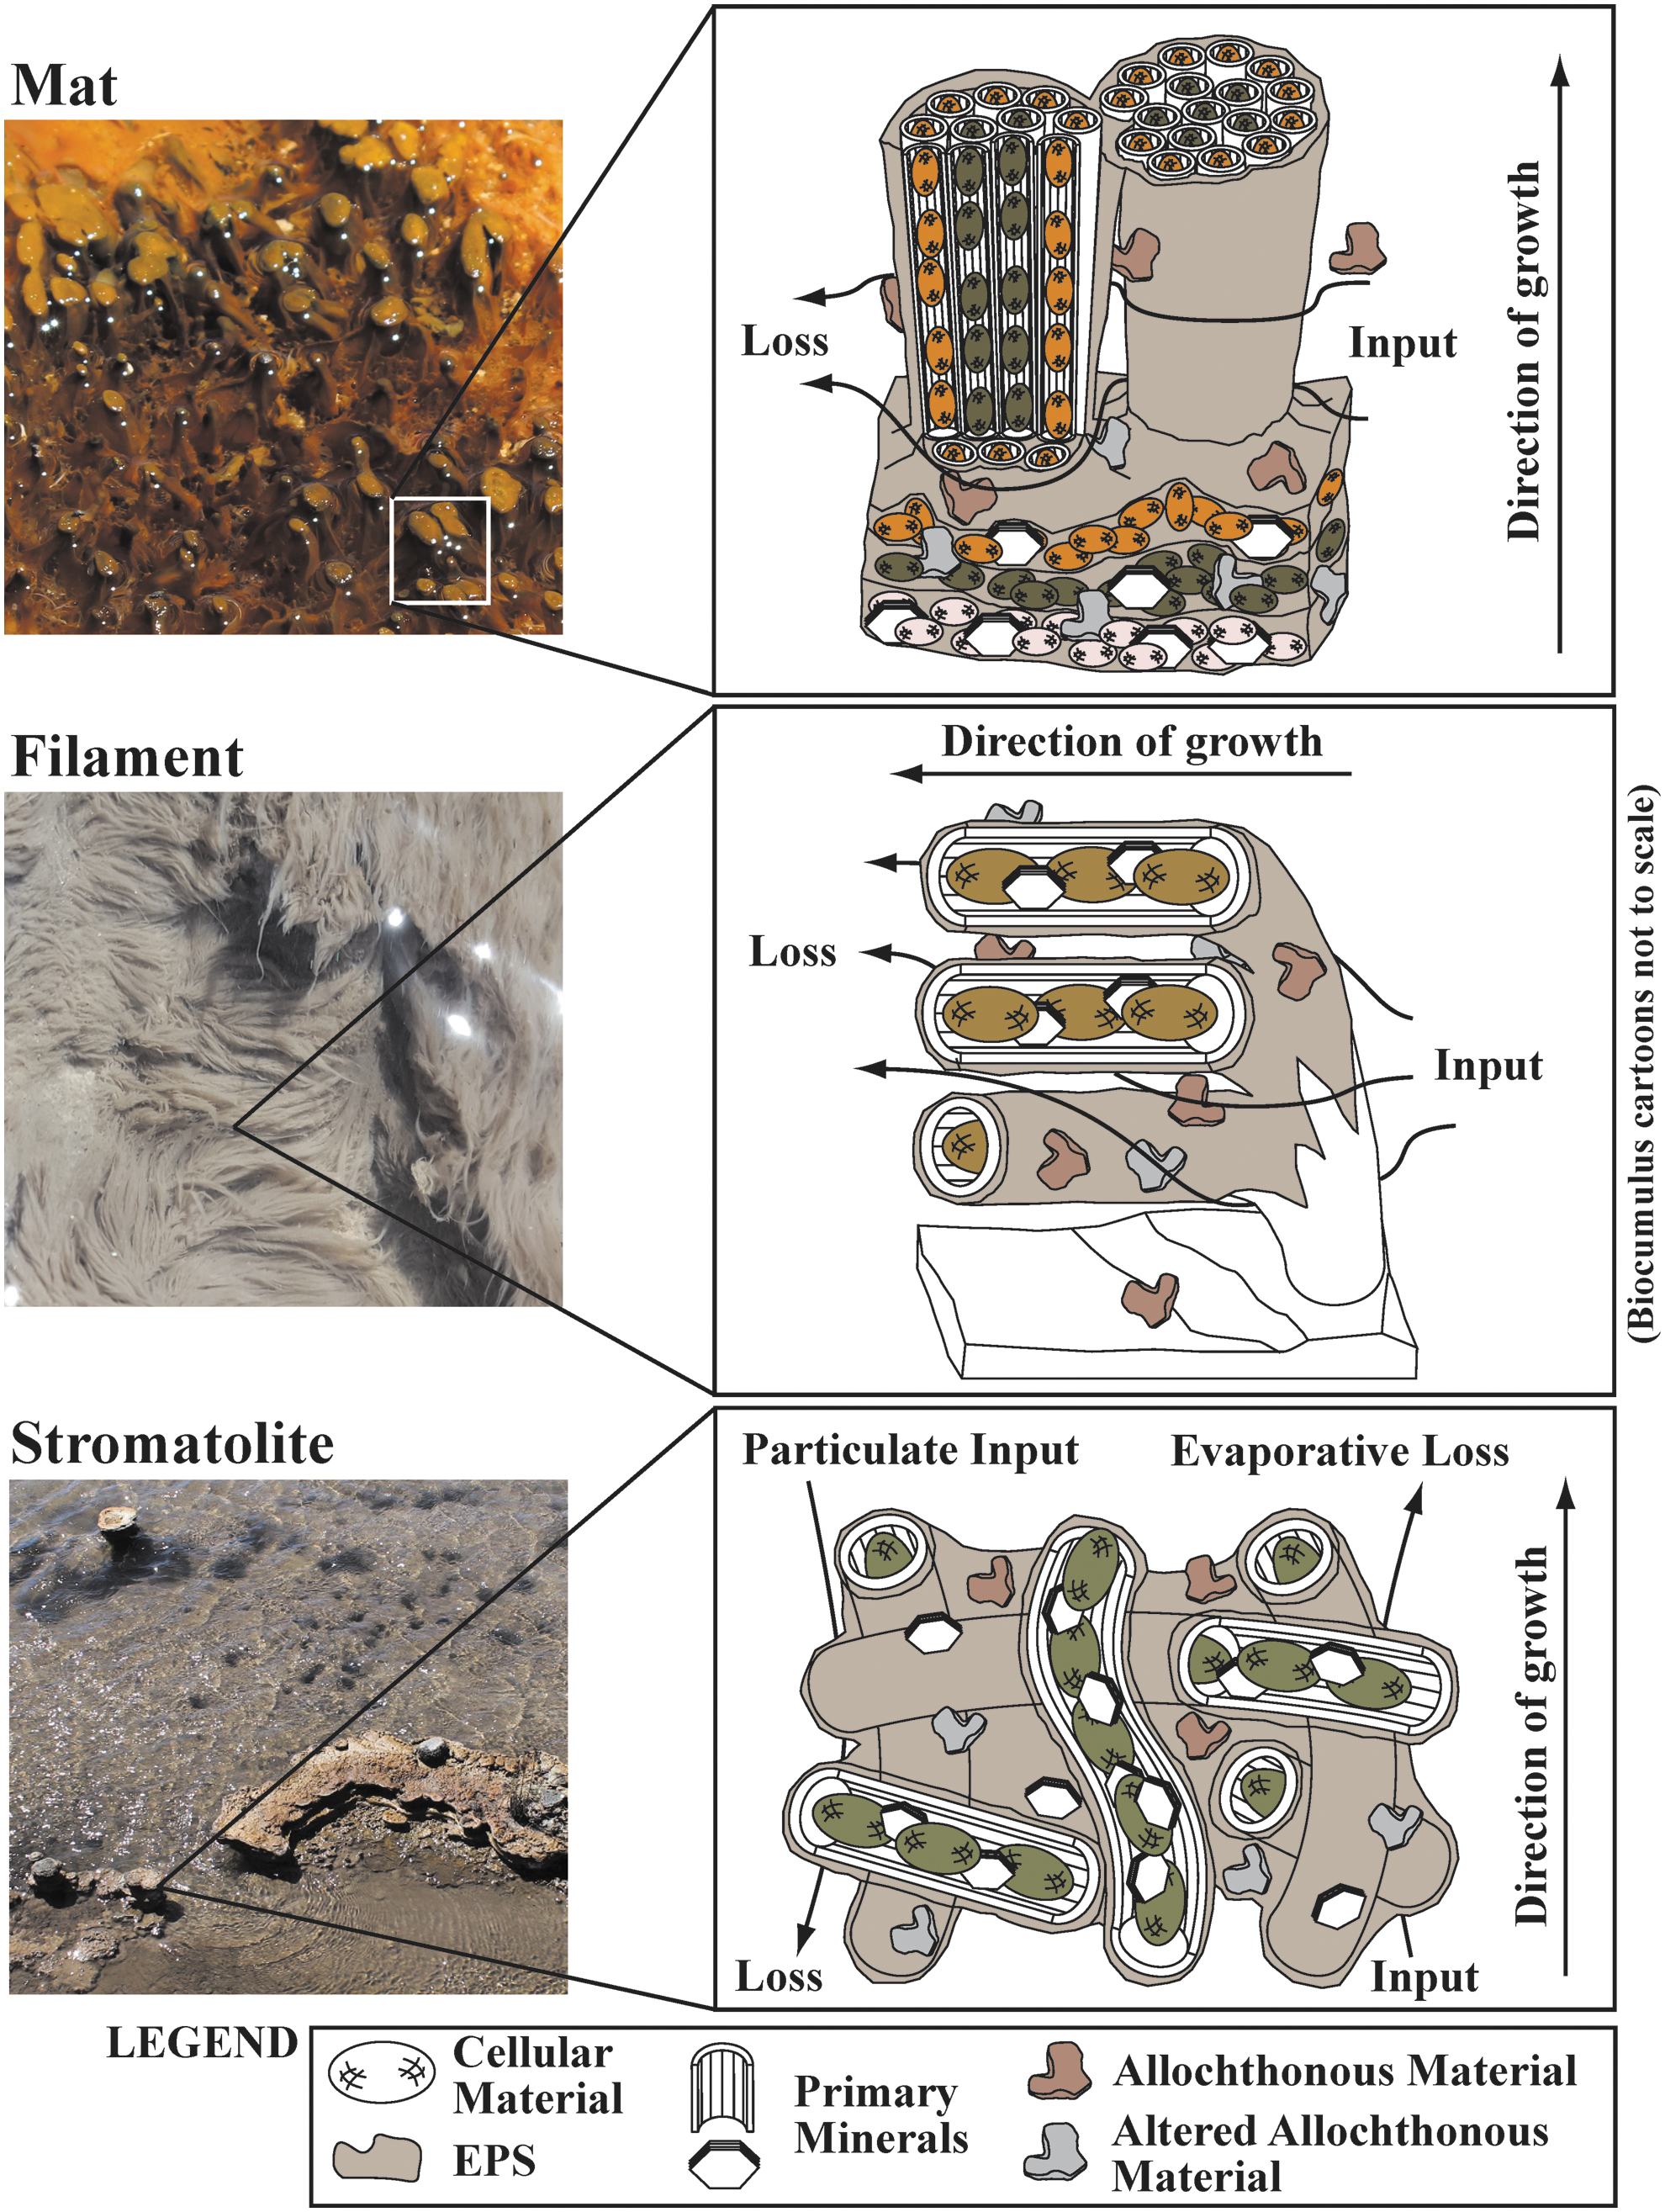
Conceptual simplified cartoons of different hydrothermal biocumulus types, including mats (top), filaments (middle), and stromatolites (bottom). Biocumulus includes cellular material, EPS (e.g., polysaccharides, proteins, DNA), allochthonous material, altered allochthonous material, and primary minerals precipitated from solution. Allochthonous material includes soil, dust, and biomass that are transported into the hot spring. Primary minerals include all minerals precipitated in or around the biocumulus. Input includes all passive and active uptake of elements into the biocumulus. Loss includes all elements that are passively or actively lost from the biocumulus. Microbial mat image from photosynthetic zone of the outflow channel for “Bison Pool,” SM, LGB (image field of view is ∼15 cm across). Filament image from the chemotrophic zone of the outflow channel of “Skippy's Bathtub,” GOPA, MVA (image field of view is ∼10 cm across). Stromatolite image is from the water-air interface of “Happy Harfer Pool,” GOPA (image field of view is ∼1 m across).
3. Methods
Hydrothermal water samples were collected from 8 hydrothermal systems both within the 0.64 Ma Yellowstone caldera boundary, including: the Greater Obsidian Pool Area (GOPA), Sentinel Meadows (SM), Imperial Geyser Basin (IGB), and White Creek Area (WCA) within the Lower Geyser Basin (LGB), and the Rabbit Creek Area within the Midway Geyser Basin (MGB); and outside of the caldera, including: the Geyser Creek Area (GCA) and Sylvan Spring Area (SSA) of the Gibbon Geyser Basin (GGB) and the Gap Area of the Norris Geyser Basin (NGB) (Fig. 2). Sites for microbial community elemental determination were selected from a subset of sampling locations. Hot springs for biocumulus sampling in MPS sites of circum-neutral to alkaline systems included sites in SM, IGB, WCA, and MGB. Hot springs for biocumulus sampling in phase separation regimes included sites in GCA, SSA, NGB, GOPA, and MGB. Results reported for the study include new analyses and reported literature values that are directly linked to the samples analyzed. Biocumulus sample digestions reported here include both new analyses along with previously collected related analyses (biocumulus C and N data) (i.e., Schuler et al., 2017; Hamilton et al., 2019; Havig and Hamilton, 2019a, 2019b), and other data reported previously (Havig, 2009; Havig et al., 2011). Aqueous geochemistry data described later are either new to this study or have been reported in part recently (Schuler et al., 2017; Hamilton et al., 2019; Havig and Hamilton, 2019a, 2019b; Gangidine et al., 2020), with data that have been previously reported indicated in Supplementary Table S1. Sinter sample digestions described next include new data for this study and one sample from previous work (Havig, 2009; Havig et al., 2011). Rock and soil sample digestions described next include new data for this study and data previously reported (Havig, 2009; Havig et al., 2011). All of these data will be treated together in the results section to capture overall trends, and data reported in recent literature will be indicated in the Supplementary Tables S1 and S2.
It should be noted that in accordance with Le Châtelier's principle, the pH value associated with neutrality decreases with increasing temperature in pure water, due to increasing temperatures favoring increasing dissociation. Although a neutral pH is 7.00 at T = 25°C, at T = 50°C, neutral pH = 6.63°C, at T = 70°C, neutral pH = 6.39, and at the boiling point of most springs in Yellowstone (due to elevations being 2100–2300 m, it is ∼93.3°C), neutral pH = 6.18. Thus, neutral is taken to mean 6.2–6.7 for most of the hot springs measured for this study.
3.1. Sample collection and analysis
Water samples were collected and analyzed, as previously described (Schuler et al., 2017; Havig and Hamilton, 2019a, 2019b). Microbial community samples (e.g., Supplementary Fig. S1) were collected with Teflon tweezers and placed in 5 mL cryovials. All sample sites were located by global positioning and marked on maps. Samples were flash frozen on dry ice in the field and kept frozen until they were processed. Rock, soil, and sinter samples were collected in either 50 mL centrifuge tubes or plastic bags, labeled, and photographed in place at the time of collection. Soils were collected from exposed soils, and all contained gravel to sand-sized pieces of obsidian and rhyolite/tuff. Rock samples were collected from the exposed outcrop of rhyolite/obsidian flows. Sinter samples were collected from the active precipitation region of hot springs, or from old sinter outcrops in hydrothermal areas. For images of representative biocumulus and sinter samples, see Supplementary Fig. S1. Contextual biota samples were collected and placed into either 5 mL cryovials or 15 mL centrifuge tubes, flash frozen in the field on dry ice, and kept frozen until processing.
Temperature and pH were measured onsite with a WTW 330i meter and probe (Xylem Analytics, Weilheim, Germany), and conductivity was measured with a YSI 30 conductivity meter and probe (YSI, Inc., Yellow Springs, OH). Water-dissolved silica values were estimated during sampling by using Hach DR1900 Portable Spectrometers (Hach Company, Loveland, CO) utilizing powder pillows for determining dissolved silica concentrations. Dissolved silica values should be treated as qualitative estimates, as higher temperatures and interferences from other aqueous species are known to affect the colorimetric chemical reaction involved with the Hach methods (unpublished data). Total ammonia [NH4(T) = NH3 + NH4 +] and nitrate concentrations were determined with DR1900 spectrometers via powder pillows on return to the lab to minimize intereferences from temperature and interfering chemical species (e.g., sulfide). Total dissolved inorganic nitrogen (TDIN) was calculated from the sum of NH4(T) and nitrate.
Hot spring water was collected with a 140 mL syringe directly or drawn after collected with a long-handled polyethylene dipper (500 mL beakers attached to a pole). Water collectors were rinsed with sample water three times before filling. Water was filtered through 0.8/0.2 μm Supor® syringe filters and dispensed into the appropriate sample bottles after a 10 mL flush to minimize contamination from the filter. Samples for ion chromatography (IC) analysis of major anions (Thermo Scientific Dionex ICS 5000+ IC system) were stored in 15 mL polypropylene centrifuge tubes. Samples for inductively coupled plasma optical emission spectroscopy (ICP-OES) analysis (Thermo Scientific iCAP 6000 series ICP-OES) of major cations and for inductively coupled plasma mass spectrometry (ICP-MS) analysis (Thermo Scientific X Series 2 ICP-MS) for trace elements were stored in acid-washed (3 days soak in 10% TraceMetal Grade HNO3 [Fisher Scientific, Hampton, NH] followed by triple rinsing with 18.2 MΩ/cm deionized water) 15 mL polypropylene centrifuge tubes and acidified with 400 μL of concentrated, OmniTrace Ultra™ concentrated HNO3 (EMD Millipore, Billerica, MA). Field blanks were taken daily by using 18.2 MΩ/cm deionized water transported to the field in 1 L acid-washed Nalgene bottles. IC, ICP-OES, and ICP-MS analyses were carried out by the Analytical Geochemistry Laboratory in the Department of Earth Sciences at the University of Minnesota.
Samples for dissolved inorganic carbon (DIC) analysis were filtered into a gas-tight syringe and then injected into Labco Exetainers® (Labco Limited, Lampeter, United Kingdom) that was pre-flushed with He. Excess He was removed after the introduction of 4 mL of filtered sample with minimal agitation. Samples were stored inverted and on ice and refrigerated at 4°C until they were returned to the lab, where 1 mL of concentrated H3PO4 was added and the samples were shipped to the Stable Isotope Facility (SIF) at the University of California, Davis for analysis. The DIC analysis for concentration and 13C isotopic signal was acquired by a GasBench II system that was interfaced to a Delta V Plus isotope ratio mass spectrometer (IR-MS; Thermo Scientific, Bremen, Germany). Raw delta values were converted to final by using laboratory standards (lithium carbonate, δ13C = −46.6‰ and a deep seawater, δ13C = +0.8‰) that were calibrated against standards NBS-19 and L-SVEC. Samples for dissolved organic carbon (DOC) analysis were filtered through a 0.2 μm polyethersulfone syringe filter that had been flushed with ∼30 mL of sample, and then ∼40 mL was put into a 50 mL centrifuge tube and then immediately flash-frozen on dry ice. They were kept frozen and in the dark until analysis at the SIF. The DOC analysis for concentration and 13C isotopic signal was carried out by using O.I. Analytical Model 1030 TOC Analyzer (O.I. Analytical, College Station, TX).
Major biologically essential elements (BIO: carbon, nitrogen, and phosphorous) were determined as DIC and DOC (via IR-MS), as NH4(T) and NO3 − (via field spectrophotometer), and summed as TDIN and dissolved P in samples that were filtered through 0.2 μm syringe filters (via ICP-MS) (Fig. 7 and Supplementary Table S1). Trace elements that were analyzed included Li, Al, V, Mn, Fe, Co, Ni, Cu, Zn, Ga, As, and Mo (Figs. 6 and 8 and Supplementary Table S1). These were binned into elements that are relevant to the function of life (termed BIO-TRACE), which included V, Mn, Fe, Co, Ni, Cu, Zn, and Mo (as well as Mg, discussed above), and elements that are biologically non-essential (termed NON-BIO), including Li, Al, Ga, and As.
3.2. Solid sample preparation and analysis
Solid samples (including biocumulus, sinter, rocks, and soils) were dried for 3 days in an oven set at ∼60°C. After drying, the samples were ground to a homogeneous powder with an agate mortar and pestle that was cleaned between samples by using an ethanol silica sand slurry followed by rinsing with 18.2 MΩ/cm deionized water and drying. The C and N analysis samples were weighed and placed into tin cups that were folded to seal the sample inside. The samples were then analyzed by using an Elementar Vario EL Cube or Micro Cube elemental analyzer (Elementar Analysensysteme GmbH, Hanau, Germany) that was interfaced to a PDZ Europa 20–20 IR-MS (Sercon Ltd., Cheshire, United Kingdom) at the SIF at the University of California, Davis. The samples were combusted at 1080°C in a reactor packed with copper oxide and tungsten (VI) oxide. After combustion, the oxides were removed in a reduction reactor (reduced copper at 650°C). The helium carrier then flowed through a water trap (magnesium perchlorate). N2 and CO2 were separated by using a molecular sieve adsorption trap before entering the IR-MS. During analysis, the samples were interspersed with several replicates of at least two different laboratory standards (bovine liver, glutamic acid, enriched alanine, nylon 6), which had been previously calibrated against NIST Standard Reference Materials (IAEA-600, USGS-40, USGS-41, USGS-42, USGS-43, USGS-61, USGS-64, and USGS-65).
Trace element analysis of biomass and soils were determined from ground and dried samples (∼0.050 g each) that were digested by using acid ratios adapted from the EPA method 3052 (Kingston and Walter, 1998) and carried out via an open-vessel digestion. Weighed samples were placed in Teflon beakers with 1 mL 30% H2O2 and 1 mL of trace element-clean concentrated HNO3 and were heated at 30°C for 3 h to break down organics. The remaining 4 mL of the HNO3 and 3 mL of trace element-clean concentrated HCl were added sequentially in 1 mL increments to avoid excess H2O2 from rapidly effervescing. The samples were heated for 1 h at 40°C before adding 1 mL of trace element-clean concentrated hydrofluoric acid (HF). The samples were left at 40–50°C until solutions became faint yellow or clear (approximately 3–4 h). The samples were then heated to just below boiling in a fume hood to drive off HF (reducing the sample to a volume of ∼0.5 mL), and then they were diluted with nanopore 18.2 MΩ/cm deionized water to 30 mL in a 50 mL centrifuge by using a 5 mL pipette. This gave a final concentration equivalent of ∼1 g sample per 0.6 L of water. Confirmation of digestion method element recovery was conducted with NIST SRM 278. The digested samples were analyzed with ICP-MS (Thermo Scientific X Series 2 ICP-MS) by the Analytical Geochemistry Laboratory in the Department of Earth Sciences at the University of Minnesota.
Elements measured in digested bulk biocumulus samples were binned into three categories: (i) major biologically essential elements (BIO, including C, N, and P); (2) trace biologically essential elements (BIO-TRACE, including Mg, V, Mn, Fe, Co, Ni, Cu, Zn, and Mo); and (3) biologically non-essential elements (NON-BIO, including Li, Al, Ga, and As) (Fig. 6 and Supplementary Table S2). Values are presented in units of mol/kg to facilitate comparison of concentration values that span over seven orders of magnitude, and these units will be used for sinter, rock, and soil digestion analysis results as well. Median values are used to represent data populations for each element, as mean values would be skewed by high concentration outliers.
All analytical results are reported in tables provided in the Supplementary Table S2, including biocumulus analytical results; biocumulus associated water sample site location, temperature, pH, conductivity, and analytical results (Supplementary Table S1); non-biocumulus water sample site location, temperature, pH, conductivity, and analytical results (Supplementary Table S1); and rock and biota sample locations and analytical results (Supplementary Table S2).
4. Results
Data are presented broken down into four main categories: aqueous geochemistry, biocumulus, contextual samples, and siliceous sinter. The aqueous geochemistry section focuses on the results of analyses of water samples collected from reported hot springs and highlights the characteristics of MPS versus phase separation sites. The biocumulus section is broken down into BIO elements (C, N, and P), BIO-TRACE elements (Mg, V, Mn, Fe, Co, Cu, Ni, Zn, and Mo), and NON-BIO elements (Li, Al, Ga, and As), with differences between MPS and phase separation sites highlighted when present. The contextual samples section reports the BIO, BIO-TRACE, and NON-BIO element concentrations for potential allochthonous sources (e.g., rock, soil, biota). The siliceous sinter section presents relationships between biocumulus and siliceous sinter as well as the concentrations of BIO, BIO-TRACE, and NON-BIO elements in siliceous sinter.
4.1. Aqueous geochemistry
Hot spring water samples had pH values that ranged from a low of 2.05 to a high of 9.49 (Fig. 5 and Supplementary Table S1). The MPS area sites (n = 46) had pH values, with one mode between 6.35 and 9.49 with an average of 8.4. Areas with phase separation sites (n = 55) ranged from 2.05 to 8.26 and exhibited a bimodal distribution between more acidic sites (n = 26) with an average pH of 3.0 and less acidic to circum-neutral sites (n = 29) with an average of 6.3. These pH distributions are consistent with previous work (e.g., Brock, 1971; Nordstrom et al., 2009; Holloway et al., 2011; Boyd et al., 2012; Inskeep et al., 2013). Temperatures ranged from 29.4°C to 92.8°C, with MPS sites ranging from 33.1°C to 92.8°C and phase separation sites ranging from 29.4°C to 91.6°C (Supplementary Table S1). All sites exhibited high concentrations of dissolved silica, with MPS sites ranging between 1.96 and 6.18 mM (average of 4.18 mM) and phase separation sites ranging between 1.18 and 6.82 mM (average of 3.07 mM) (Supplementary Table S1). In general, all aqueous geochemistry values and patterns observed are consistent with previous work done by the USGS in studying the geochemistry of hot springs in Yellowstone National Park (e.g., Ball et al., 2002, 2008, 2010; McCleskey et al., 2005, 2014).
The MPS sites had a relatively small range of SO4 2− and Cl− concentrations, falling between 0.14 and 0.37 mM with an average value of 0.19 mM for SO4 2− and between 6.01 and 9.30 mM with an average value of 7.46 mM for Cl- (Fig. 5 and Supplementary Table S1). Phase separation sites exhibited a wider range of concentrations, falling between 0.16 and 6.97 mM for SO4 2− and between 0.01 and 20.29 mM Cl−, with a general bimodal distribution of high concentration of one constituent associated with a low concentration of the other, with Cl− tracking with liquid phase input and SO4 2− tracking with vapor phase input.
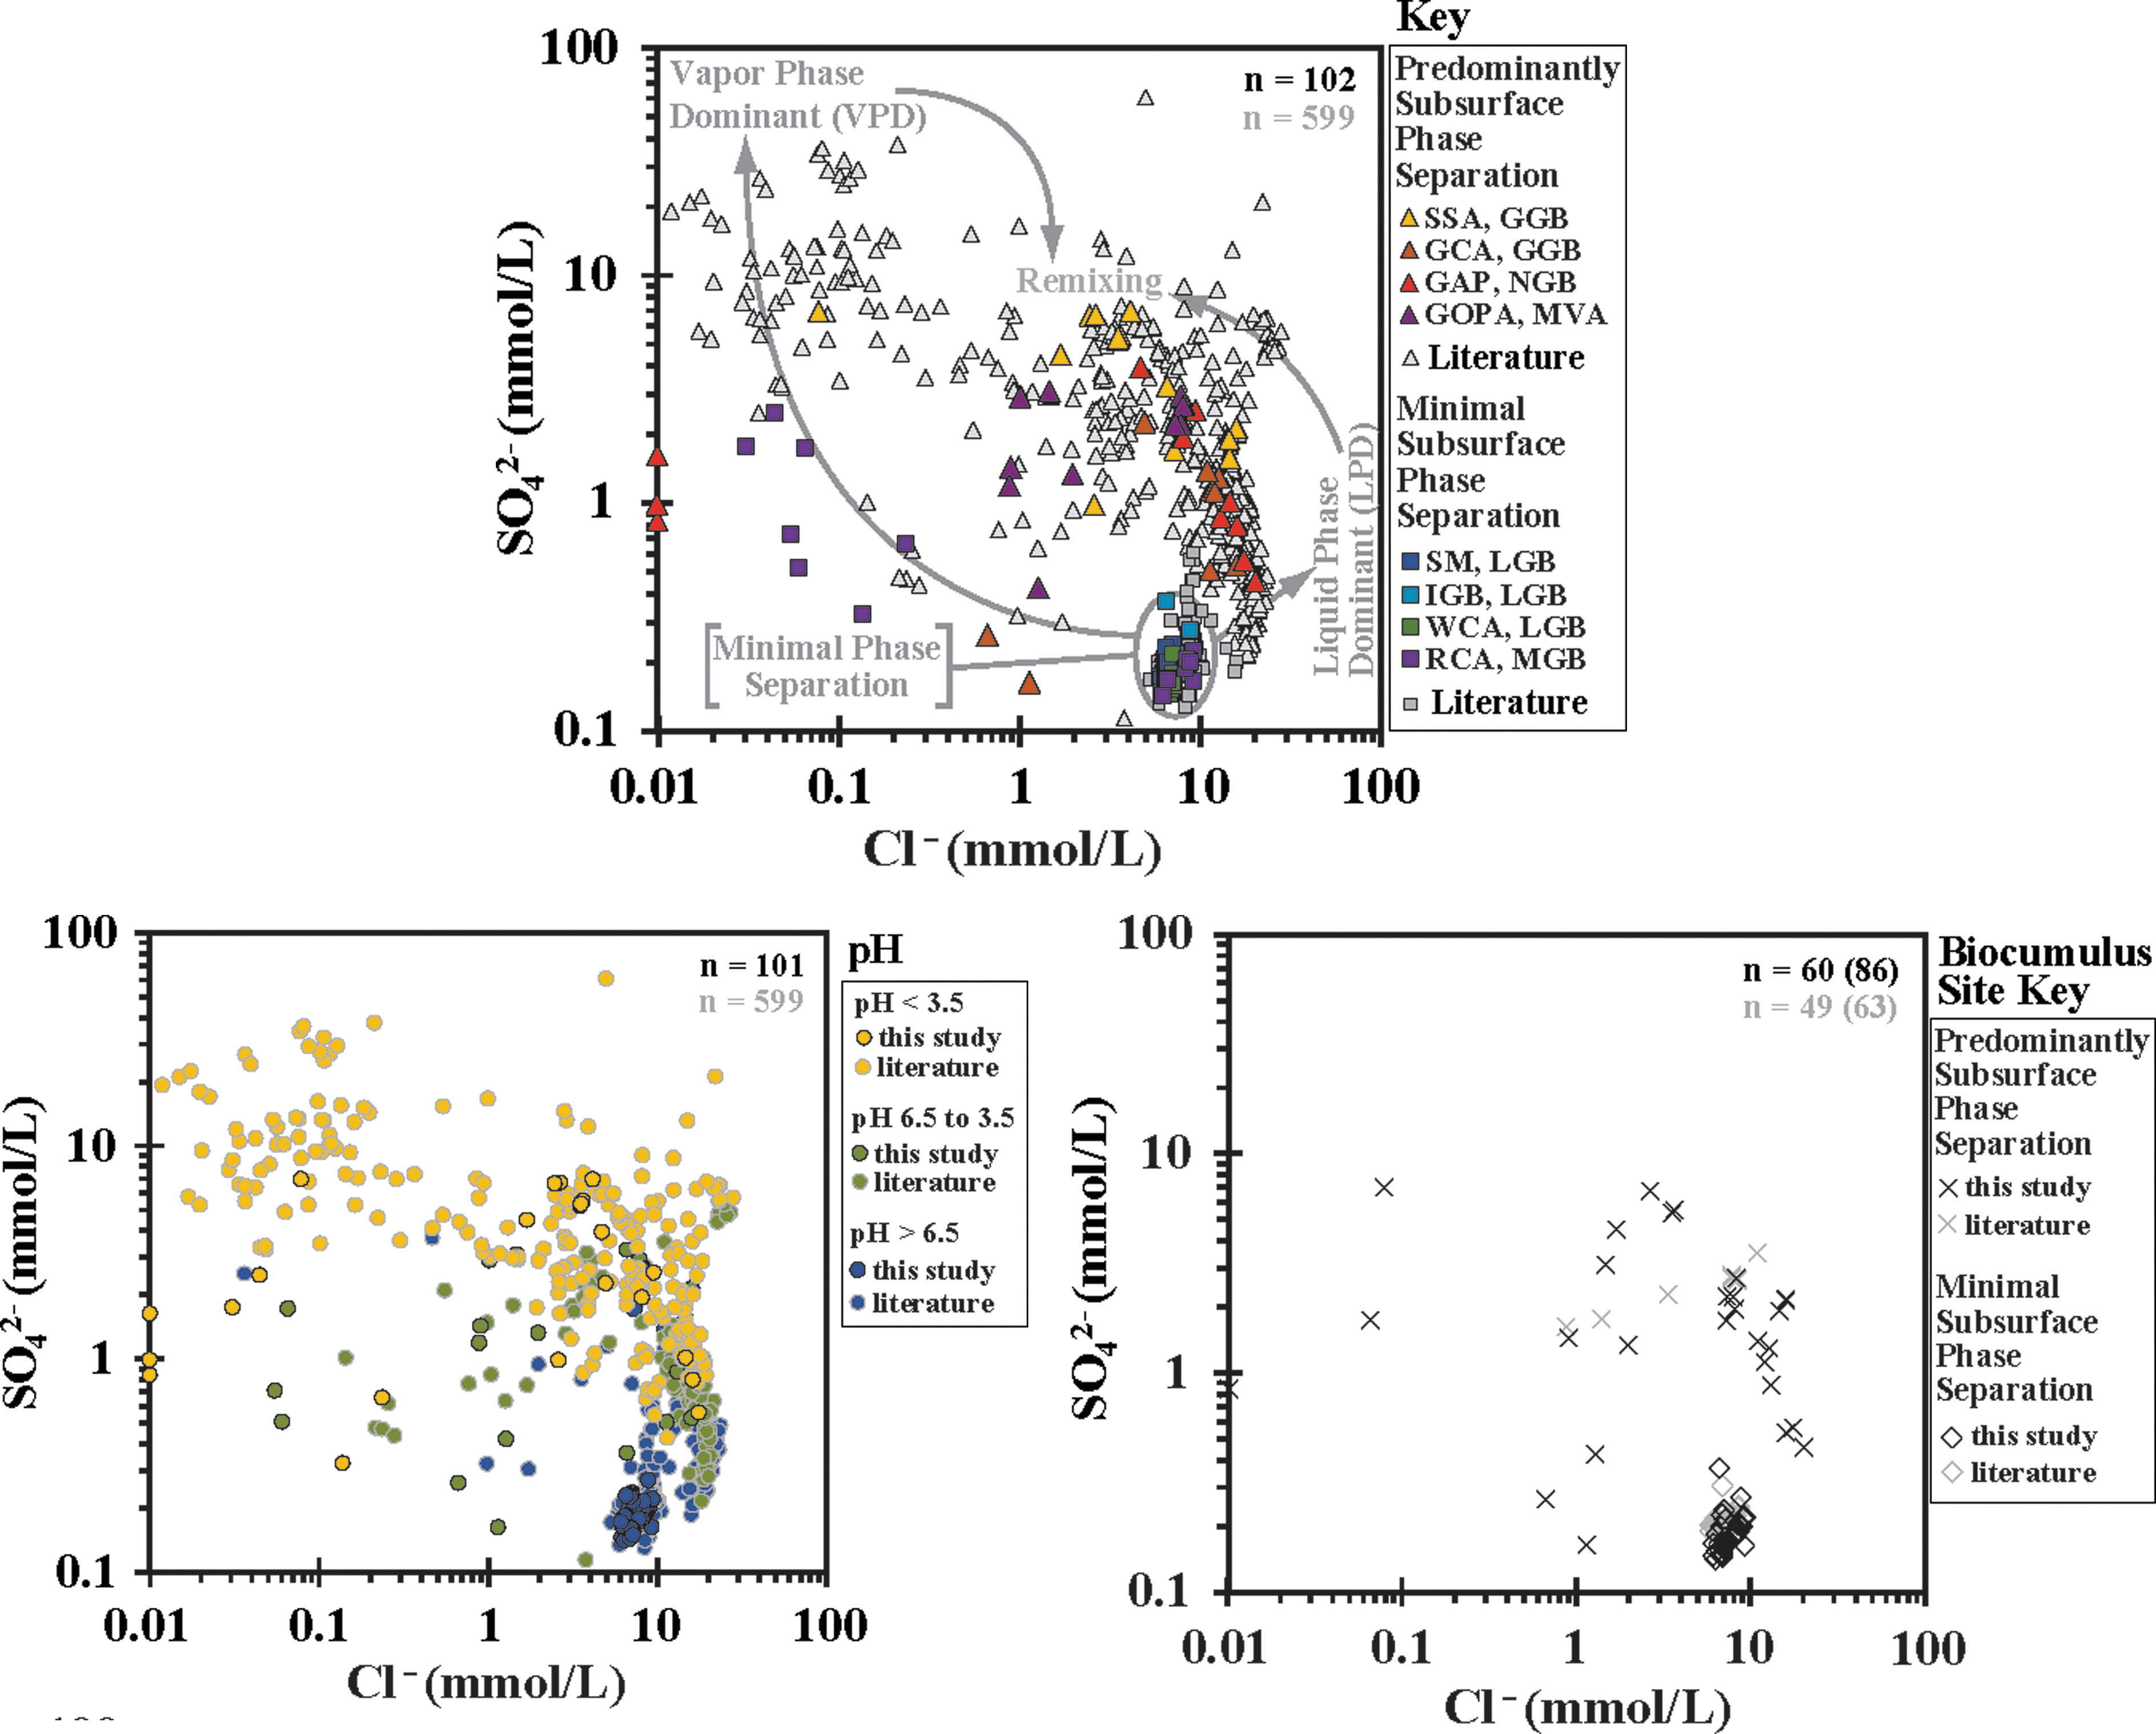
SO4 2− versus Cl− plots for Yellowstone hot springs sampled for this study and in previous work. Top: samples broken down by hydrothermal area. Closed symbols for this work, open symbols for previous work. Bottom, left: samples binned by pH of hot springs sampled. Black outlined symbols for this work, gray outlined symbols for previous work. Bottom, right: hot springs that were sampled for biocumulus elemental composition determinations. GAP, The Gap Area; GGB, Gibbon Geyser Basin. Literature values from Havig (2009), Havig et al. (2011), Holloway et al. (2011), McCleskey et al. (2014), Schuler et al. (2017), Hamilton et al. (2019), Havig and Hamilton (2019a, 2019b), Gangidine et al. (2020).
Monovalent and divalent cations exhibited strong, though differing, correlation with phase input. Na and K concentrations were higher in MPS sites and phase separation sites with significant liquid phase input. Mg and Ca concentrations were higher in phase separation sites with significant vapor phase input (Supplementary Table S1). Similar to SO4 2− and Cl−, MPS sites had Na and K concentrations that exhibited a relatively narrow range of values, with 9.85–16.41 mM and an average of 13.64 mM for Na and 0.23–0.55 mM and an average of 0.37 mM for K. Phase separation sites had a larger range of values for Mg and Ca, from below detection limits (<5 nM) to 0.617 mM and an average of 0.055 mM Mg and from 0.008 to 0.940 mM and an average of 0.169 mM Ca.
The DIC concentration ranged from 2.25 to 6.96 mM with an average of 4.09 mM DIC at sites with MPS, whereas the highest and lowest overall values were recovered from sites with phase separation inputs, ranging from 0.02 to 14.93 mM, with an average of 3.17 mM DIC. The DIC is present as primarily dissolved CO2 and H2CO3 at acidic pH sites and predominantly as HCO3 − at circum-neutral to alkaline sites. The DOC (measured as bulk values) was generally lower at MPS sites (20.45–161.5 μM with an average of 67.60 μM DOC) and higher at sites receiving predominantly phase separation inputs (38.22–492.3 μM with an average of 132.0 μM DOC). Inorganic fixed nitrogen, when above detection limits, was present as either a relatively low concentration of NO3 − (typical for MPS sites) or a relatively high concentration of NH4(T) (typical for input from vapor phase in phase separation sites). When above detection limits, NO3 − concentration ranged from 9.50 to 71.42 μM, whereas NH4(T) concentration ranged from 0.61 to >575 μM, which are consistent with previous observations (e.g., Holloway et al., 2011). Phosphorous concentration varied across sites, with a general pattern of lower concentration at MPS sites (range of 0.82–38.05 μM, average value of 8.31 μM) and higher concentration at phase separation sites (range of 1.04–134.73 μM, average value of 17.14 μM).
Element concentration ranges for each element were as follows—Li: 4.61–881 μM, Al: 1.20–1645 μM, V: 0.39–1600 nM, Mn: 3.71–10,867 nM, Fe: 7.07–174,722 nM, Co: below detection limits to 38.74 nM, Ni: below detection limits to 314.3 nM, Cu: below detection limits to 191.27 nM, Zn: 1.59–7046 nM, Ga: 0.057–523.1 nM, As: 28.68–54,470 nM, and Mo: 1.04–2139 nM. These elements fell into two patterns of behavior: either high concentration in MPS and phase separation sites with significant liquid phase input, or high concentration in sites with significant vapor phase input. Most elements had higher concentrations in the VPD sites, including Al, Mn, Fe, Co, Ni, Cu, and Zn. Elements with higher concentrations associated with liquid phase input included Li, As, and Mo.
4.2. Biocumulus
Biocumulus BIO element concentrations were similar for MPS samples and phase separation samples. The C concentrations ranged from 3.59 × 10⁻¹ to 2.35 × 10+1 mol/kg, with median values of 6.07 × 100 mol/kg for MPS samples and 4.22 × 100 mol/kg for phase separation samples. The N concentrations ranged from 3.10 × 10⁻² to 2.74 × 100 mol/kg, with median values of 5.45 × 10⁻¹ and 4.80 × 10⁻¹ for MPS and phase separation samples, respectively. The P concentrations ranged from 1.97 × 10⁻³ to 1.60 × 10⁻¹ mol/kg, with median values ranging of 1.44 × 10⁻² mol/kg for MPS samples and 1.85 × 10⁻² mol/kg for phase separation sites. The ratio of biocumulus C:N concentrations for MPS and phase separation sites fell along a 10.1 to 1 line (Fig. 10).
Biocumulus BIO-TRACE element concentrations were generally higher in biocumulus samples from phase separation sites compared with samples from MPS sites, consistent with higher concentrations of trace elements in phase separation hot spring water compared with MPS hot springs. The ranges of values recovered were Mg: 1.32 × 10⁻³ to 2.13 × 10⁻¹ mol/kg, V: 2.19 × 10⁻⁶ to 7.71 × 10⁻³ mol/kg, Mn: 1.59 × 10⁻⁵ to 2.35 × 10⁻² mol/kg, Fe: 8.11 × 10⁻⁴ to 4.07 × 100 mol/kg, Co: 7.49 × 10⁻⁷ to 1.03 × 10⁻³ mol/kg, Ni: 1.32 × 10⁻⁶ to 3.65 × 10⁻⁴ mol/kg, Cu: 2.44 × 10⁻⁶ to 5.67 × 10⁻⁴ mol/kg, Zn: 2.47 × 10⁻⁵ to 1.67 × 10⁻² mol/kg, and Mo: 6.62 × 10⁻⁷ to 6.23 × 10⁻⁴ mol/kg. The median values for phase separation site biocumulus samples were approximately two to ten times the median values of MPS site biocumulus samples for all BIO-TRACE elements except Mn (which was nearly the same).
Biocumulus NON-BIO element concentrations did not follow a consistent pattern, with Al and As concentration ranges similar for biocumulus samples from MPS sites versus phase separation sites (1.88 × 10⁻¹ to 3.90 × 100 mol/kg Al and 6.80 × 10⁻⁵ to 3.27 × 10⁻² mol/kg As), though median values for phase separation biocumulus samples were higher than for MPS biocumulus samples. Alternatively, Li and Ga concentrations were generally higher in MPS biocumulus samples (1.33 × 10⁻³ to 1.17 × 10⁻¹ mol/kg Li with a median of 1.13 × 10⁻² mol/kg Li and 4.85 × 10⁻⁵ to 7.36 × 10⁻³ mol/kg Ga with a median of 1.22 × 10⁻³ mol/kg Ga) compared with phase separation biocumulus samples (1.35 × 10⁻³ to 8.69 × 10⁻² mol/kg Li with a median of 5.65 × 10⁻³ mol/kg Li and 1.04 × 10⁻⁴ to 1.94 × 10⁻² mol/kg Ga with a median of 4.89 × 10⁻⁴ mol/kg Ga).
4.3. Contextual samples
The concentration of BIO, BIO-TRACE, and NON-BIO elements in rock and soil samples overlapped with biocumulus samples (Supplementary Table S2). The BIO element concentrations for rocks and soils were all at the low range of biocumulus concentration values. Soil C:N ratios had an average value of 21.7 to 1, which was more than double the C:N ratio of biocumulus samples (Fig. 10). The BIO-TRACE element concentrations for rocks and soils overlapped with either the mid-range values for biocumulus samples (e.g., Mg, V, Ni, Cu, and Mo) or the high-range values for biocumulus samples (e.g., Mn, Fe, Co, and Zn). NON-BIO element concentrations overlapped with the high end of biocumulus concentrations for Al, but with the low end of biocumulus concentrations for Li, Ga, and As. A comparison of median rock and soil values with median biocumulus concentrations from either MPS or phase separation sites shows that elements fall along, or close to, a 1:1 line (Fig. 11). The overall ranges of values for rock and soil samples for BIO, BIO-TRACE, and NON-BIO elements were as follows: C: 3.60 × 10⁻¹ to 1.48 × 100 mol/kg, N: 1.61 × 10⁻² to 9.52 × 10⁻² mol/kg, P: 3.07 × 10⁻³ to 1.16 × 10⁻² mol/kg, Mg: 2.15 × 10⁻³ to 2.20 × 10⁻¹ mol/kg, V: 6.11 × 10⁻⁶ to 8.21 × 10⁻⁴ mol/kg, Mn: 5.04 × 10⁻⁴ to 4.09 × 10⁻² mol/kg, Fe: 9.71 × 10⁻² to 3.64 × 0−1 mol/kg, Co: 4.48 × 10⁻⁶ to 7.73 × 10⁻⁴ mol/kg, Ni: 4.37 × 10⁻⁶ to 3.29 × 10⁻⁴ mol/kg, Cu: 3.82 × 10⁻⁵ to 9.22 × 10⁻⁴ mol/kg, Zn: 2.31 × 10⁻⁴ to 1.33 × 10⁻³ mol/kg, Mo: 3.00 × 10⁻⁵ to 8.38 × 10⁻⁵ mol/kg, Li: 5.32 × 10⁻⁴ to 7.06 × 10⁻³ mol/kg, Al: 1.79 × 100 to 4.01 × 100 mol/kg, Ga: 2.64 × 10⁻⁴ to 3.32 × 10⁻⁴ mol/kg, and As: 7.72 × 10⁻⁵ to 1.97 × 10⁻³ mol/kg.
Allochthonous biota biomass C concentrations fell in a small range of values (2.77 × 10+1 to 4.09 × 10+1 mol/kg) and a wide range of sources, including Lodgepole Pine needles, grasses, sedges, mosses, lichens, insects, bison feces, and bison fur. Biota N concentrations exhibited a larger range of values (4.58 × 10⁻¹ to 1.13 × 10+1 mol/kg). Lichen, mosses, and Lodgepole Pine needles had the lowest values of N, whereas insects and bison fur had the highest values. The C:N concentration ratios ranged from a high of 70.7 to 1 for lichen to a low of 3.4 for bison fur, and all plant matter and bison feces values fell close to, or above, the soil C:N ratio, or below the biocumulus C:N ratio (Fig. 10).
4.4. Siliceous sinter
Concentrations of BIO and BIO-TRACE elements in siliceous sinter samples were consistently at, or below, values of associated biocumulus samples for both MPS sites and phase separation sites, with siliceous sinter median values all lower than associated biocumulus median values (Fig. 12 and Supplementary Table S2). Sinter C:N ratios were more scattered than biocumulus values, but they still fell along a 10.1 to 1 line (Fig. 10). For NON-BIO elements, Li and Al concentrations in siliceous sinter samples were at, or below, values for associated biocumulus samples, and median sinter values were lower than biocumulus median values. Ga and As concentrations were similar to biocumulus values, and median values varied (MPS sites had sinter median values lower than biocumulus median values, and phase separation sites had sinter median values similar to biocumulus median values). Analyses for Mo in all sinter samples, for Co in MPS sinter samples, and for P in phase separation sinter samples were at or below detection limits; therefore, these values were excluded from this study. The overall ranges of values for siliceous sinters for BIO, BIO-TRACE, and NON-BIO elements were as follows: C: 6.73 × 10⁻² to 1.40 × 100 mol/kg, N: 9.86 × 10⁻³ to 1.48 × 10⁻¹ mol/kg, P: 5.09 × 10⁻⁴ to 3.23 × 10⁻³ mol/kg, Mg: 1.86 × 10⁻⁴ to 1.94 × 10⁻² mol/kg, V: 7.24 × 10⁻⁷ to 1.16 × 10⁻⁴ mol/kg, Mn: 3.30 × 10⁻⁶ to 1.38 × 10⁻² mol/kg, Fe: 1.46 × 10⁻⁴ to 5.18 × 10⁻¹ mol/kg, Co: 1.19 × 10⁻⁶ to 2.73 × 10⁻⁴ mol/kg, Ni: 1.35 × 10⁻⁶ to 5.43 × 10⁻⁵ mol/kg, Cu: 2.57 × 10⁻⁶ to 1.81 × 10⁻⁴ mol/kg, Zn: 5.21 × 10⁻⁶ to 1.23 × 10⁻³ mol/kg, Mo: at or below detection limits, Li: 2.32 × 10⁻⁴ to 1.90 × 10⁻² mol/kg, Al: 1.65 × 10⁻² to 2.49 × 100 mol/kg, Ga: 2.67 × 10⁻⁵ to 2.04 × 10⁻² mol/kg, and As: 9.06 × 10⁻⁵ to 2.17 × 10⁻¹ mol/kg.
In summary, whether a hot spring and endemic biocumulus are in hydrothermal areas that exhibit either MPS or phase separation influences the elemental composition of the water (aqueous geochemistry), biocumulus, and siliceous sinter.
5. Discussion
The Discussion comprises four sections. Section 5.1 describes the influences of subsurface processes on the concentrations of BIO, BIO-TRACE, and NON-BIO elements as the geochemical environmental setting for hot spring biocumuli. Section 5.2 describes compositional breakdowns with a focus on similarities and differences between minimum phase separation and phase separation sites. Section 5.3 details potential sources for elements from soil/rock and biota inputs and evidence for which elements are influenced by these inputs. Section 5.4 details the patterns of element retention through the early stages of digenesis (from biocumulus to sinter), with focuses on MPS sites, phase separation sites, and then a general conceptual model based on the patterns described.
A comparison of different hot spring types can be facilitated by using a geochemical framework. Chloride, sulfate, and pH can be used to distinguish deep hydrothermal source water that feeds hot springs with no to MPS, or hydrothermal areas with subsurface boiling driving phase separation producing hot springs that are LPD, VPD, or mixed liquid and vapor phase (“remixing”) (Fig. 5).
With increasing phase separation due to subsurface boiling, LPD hot springs tend to have higher chloride concentration and circum-neutral pH values (pH ∼5 to ∼7), whereas VPD hot springs tend to have higher sulfate concentration, lower chloride concentration, and lower pH values (pH ≤3.5), with remixed hot springs exhibiting a range of chloride and sulfate concentration and pH values similar to (or falling between) LPD or VPD. The MPS springs tend to have lower sulfate concentrations, higher chloride concentrations, and pH values that range from circum-neutral to alkaline (pH ∼7 to ∼9.5) (Fig. 5). Thus, VPD hot springs tend to accumulate and concentrate leached and soluble elements between periods of washing out by precipitation or winter snow melt runoff, whereas LPD hot springs are enriched in elements that are retained in the liquid phase during boiling and are typically geochemically more stable. The VPD springs experience episodic flushing caused by precipitation or snow melt, whereas the LPD springs experience less.
Consequently, concentrations of elements in VPD springs fluctuate from higher values during dry periods and lower values during wet periods. The LPD springs are not as drastically affected due to higher and continuous discharge. The MPS hot springs tend to be the most geochemically stable, reflecting minimal deviation from the input of the deep hydrothermal source. These patterns are consistent with analyses and literature from previous work done in YNP hydrothermal systems (e.g., Brock, 1971; White et al., 1971, 1988; Fournier, 1989; Rye and Truesdell, 1993; Ball et al., 2002, 2008, 2010; McCleskey et al., 2005, 2014; Havig, 2009; Nordstrom et al., 2009; Holloway et al., 2011; Boyd et al., 2012; Inskeep et al., 2013; Hurwitz and Lowenstern, 2014).
Plotting biocumulus sample sites from this study into chloride versus sulfate space results in two bins: (1) MPS samples from the SM, IGB, and WCA of the LGB and the Rabbit Creek Area of the MGB (lower right, Fig. 5); and (2) sites that have varying LPD and VPD input from the GOPA of the Mud Volcano Area (MVA), the SSA and GCA of the GGB, the Gap Area of the NGB, and the Rabbit Creek Area of the MGB (Fig. 5). It should be noted that the Rabbit Creek Area has both modes of subsurface processes. This allows characterization of patterns in element concentrations based on phase input to produce a framework with which to describe element sequestration in biocumulus and predict loss during diagenesis of biocumulus into sinter, which will be done later.
5.1. Characterizing hot spring water
A total of 102 hot spring water samples were collected from 8 hydrothermal areas across Yellowstone National Park from 2015 to 2018 (Fig. 2) and were analyzed for major and trace elements (Figs. 6–8). Coupled to this, 618 hot spring samples reported in select literatures sources (Havig, 2009; Havig et al., 2011; Holloway et al., 2011; McCleskey et al., 2014) were added for context. Elements of interest were placed into three separate bins as follows: (1) biologically essential elements that are major components of cellular material, including C, N, and P (BIO); (2) biologically essential elements that are minor or trace components of cellular material, including Mg, V, Mn, Fe, Co, Ni, Cu, Zn, and Mo (BIO-TRACE); and (3) elements that are biologically non-essential, including Li, Al, Ga, and As (NON-BIO).
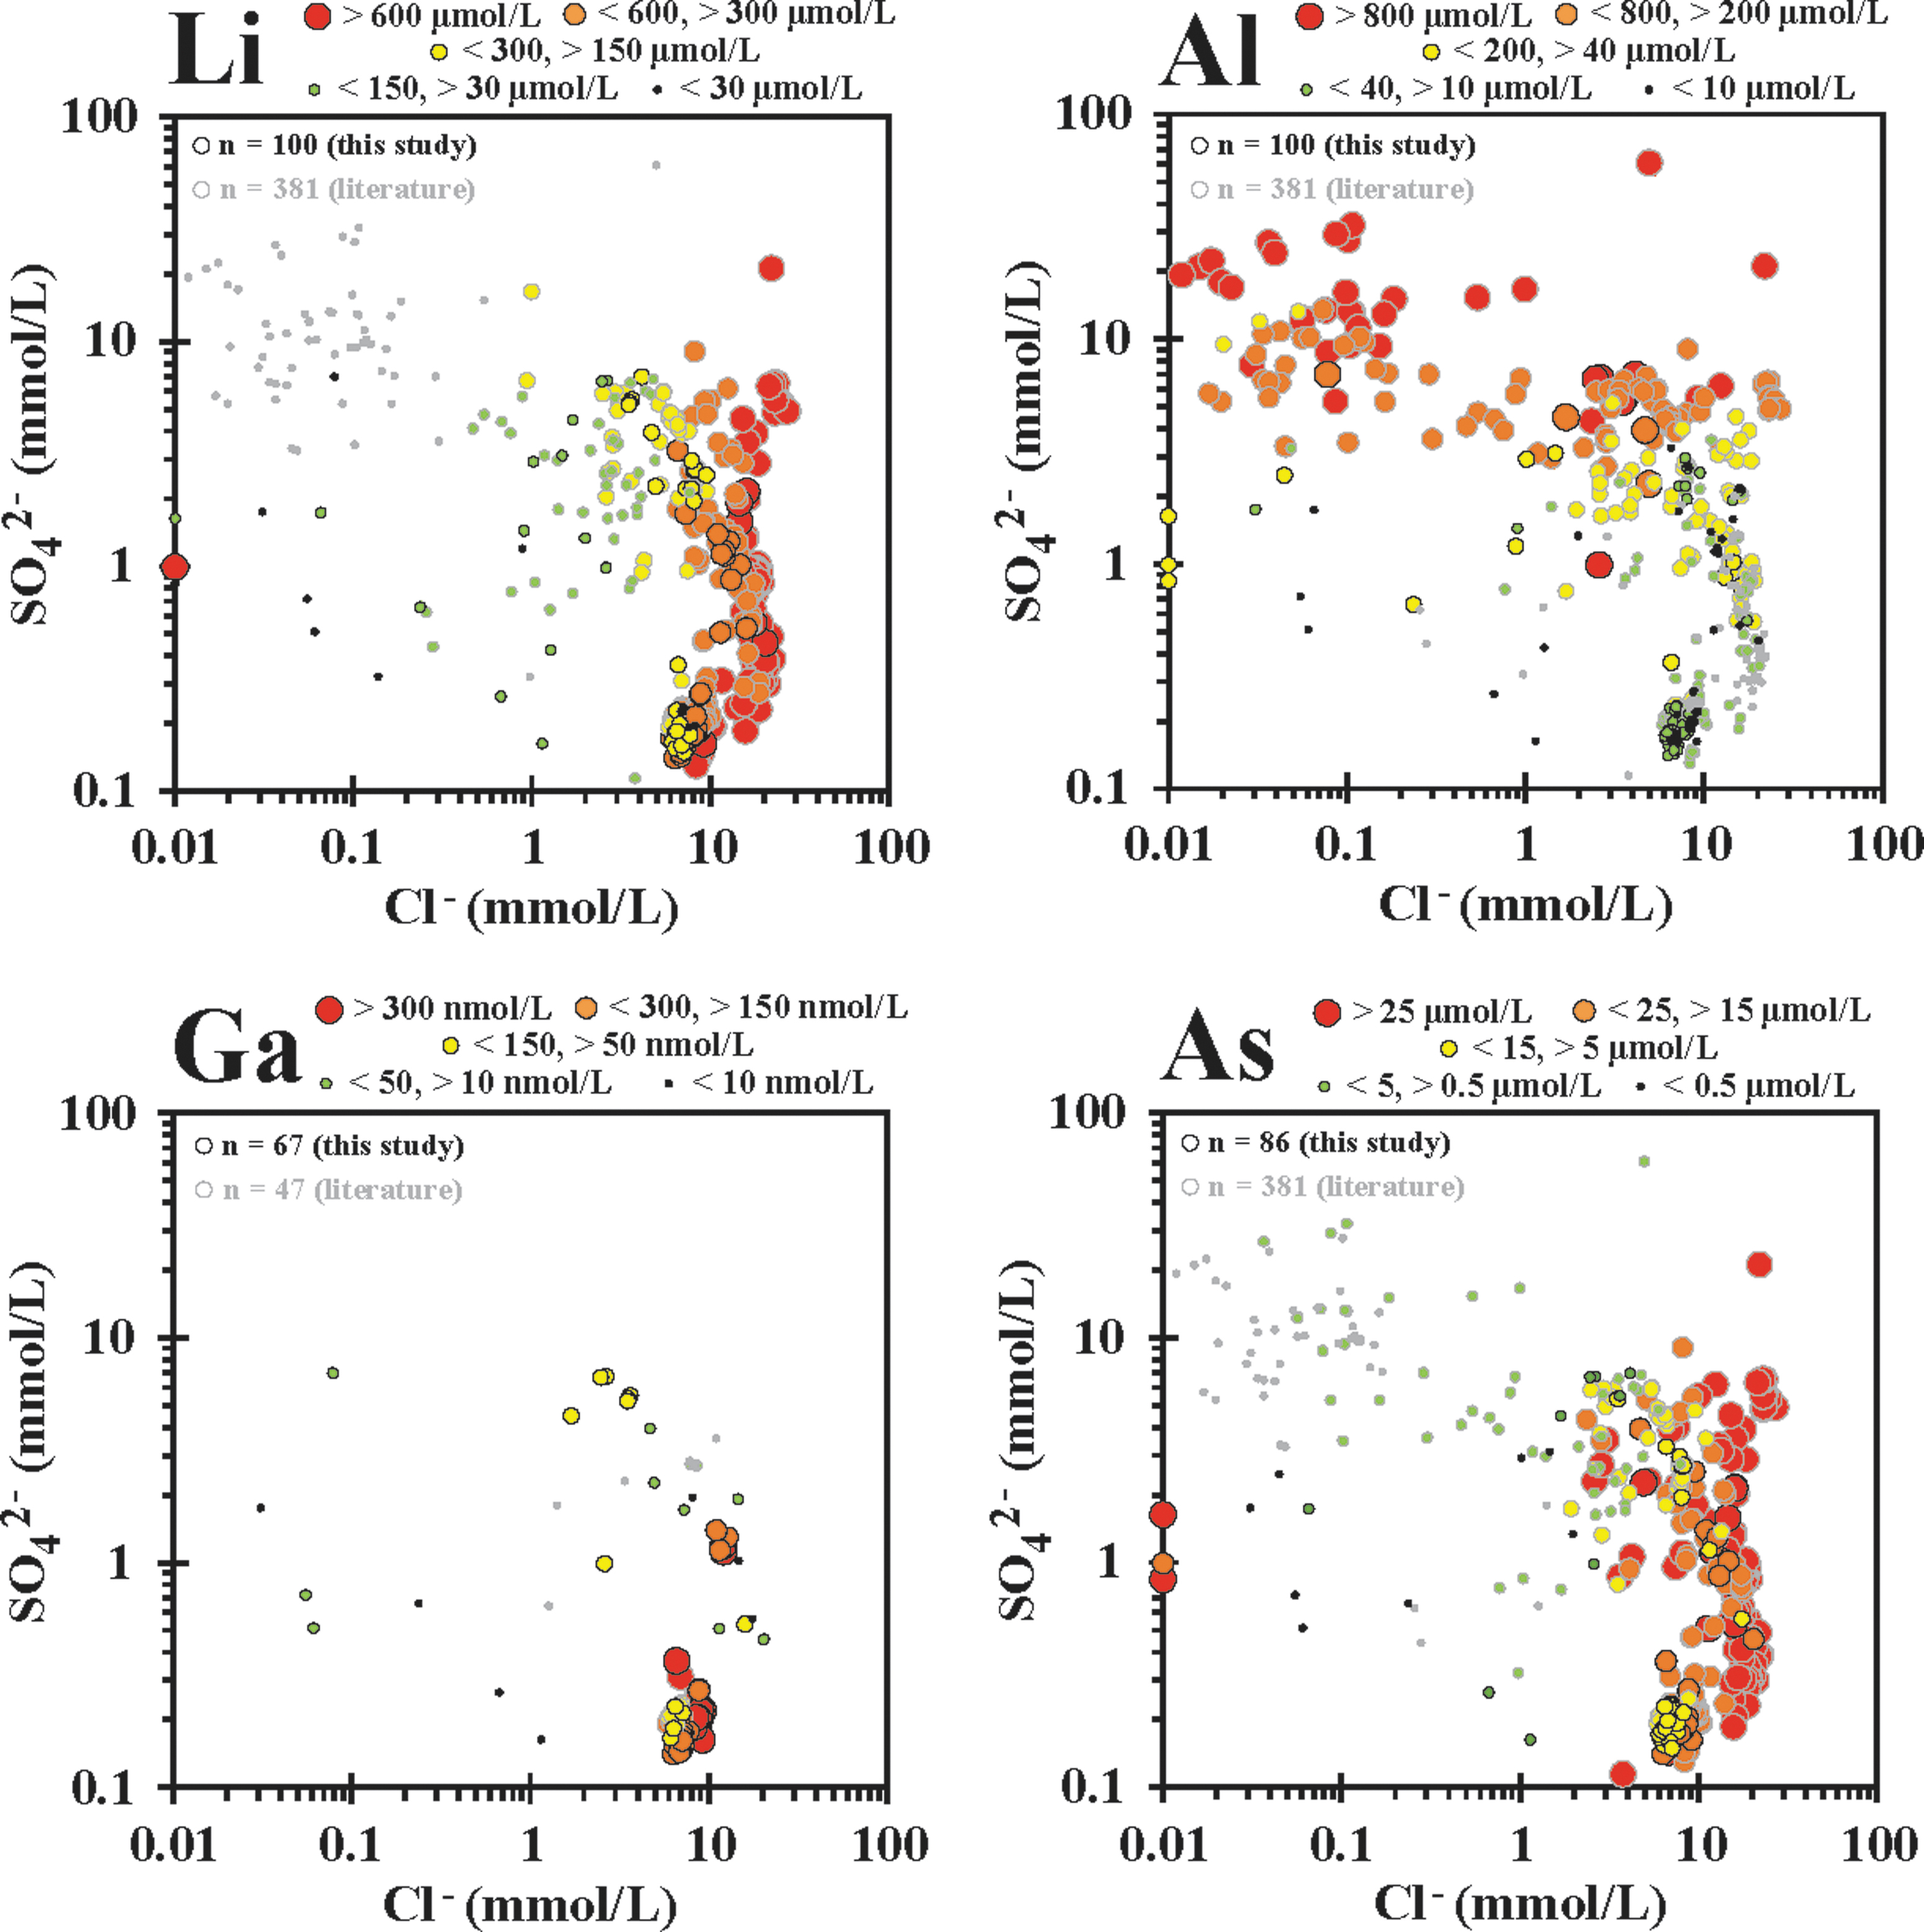
SO4 2− versus Cl− plots with hot spring biologically non-essential (NON-BIO) element concentration bins overlain, including (in increasing atomic weight) Li, Al, Ga, and As. Element ranges for bins given for each element.
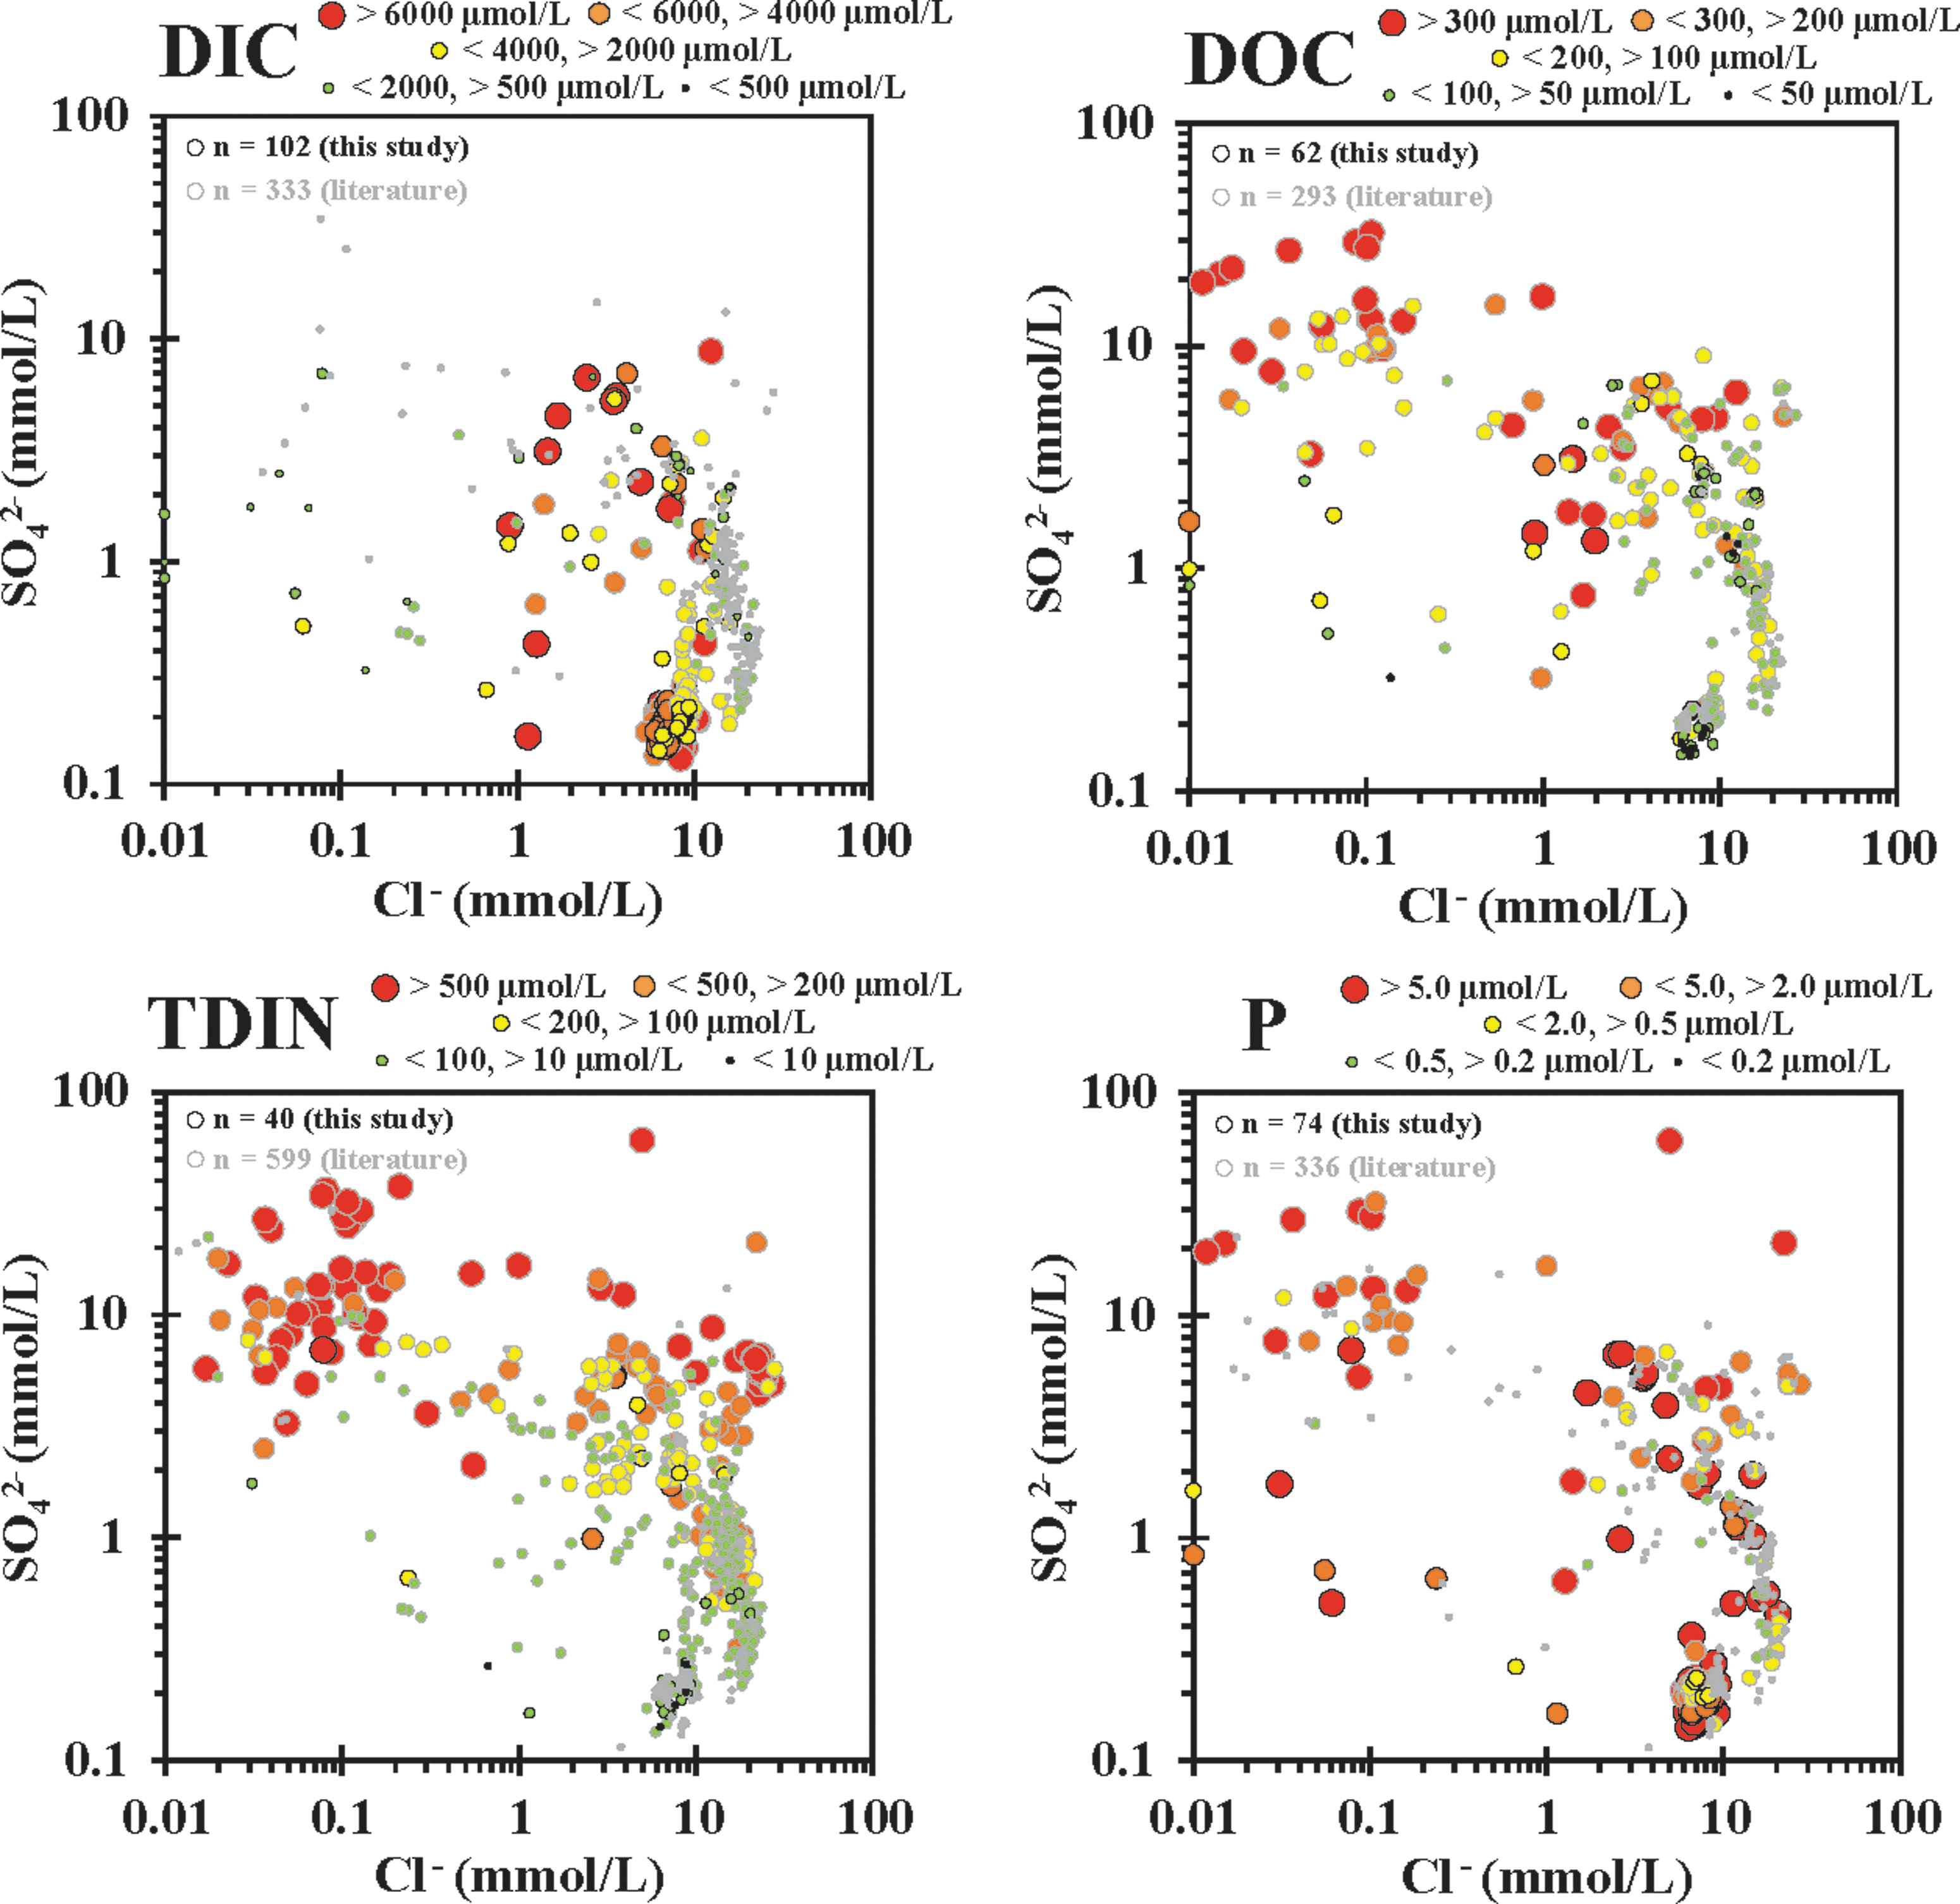
SO4 2− versus Cl- plots with hot spring major biologically relevant (BIO) element concentration bins overlain, including (in increasing elemental atomic weight) DIC, DOC, TDIN [TDIN = NH4(T) + NO3 − + NO2 −], and total dissolved phosphorous (P). Element ranges for bins given for each element. DIC, dissolved inorganic carbon; DOC, dissolved organic carbon; TDIN, total dissolved inorganic nitrogen.
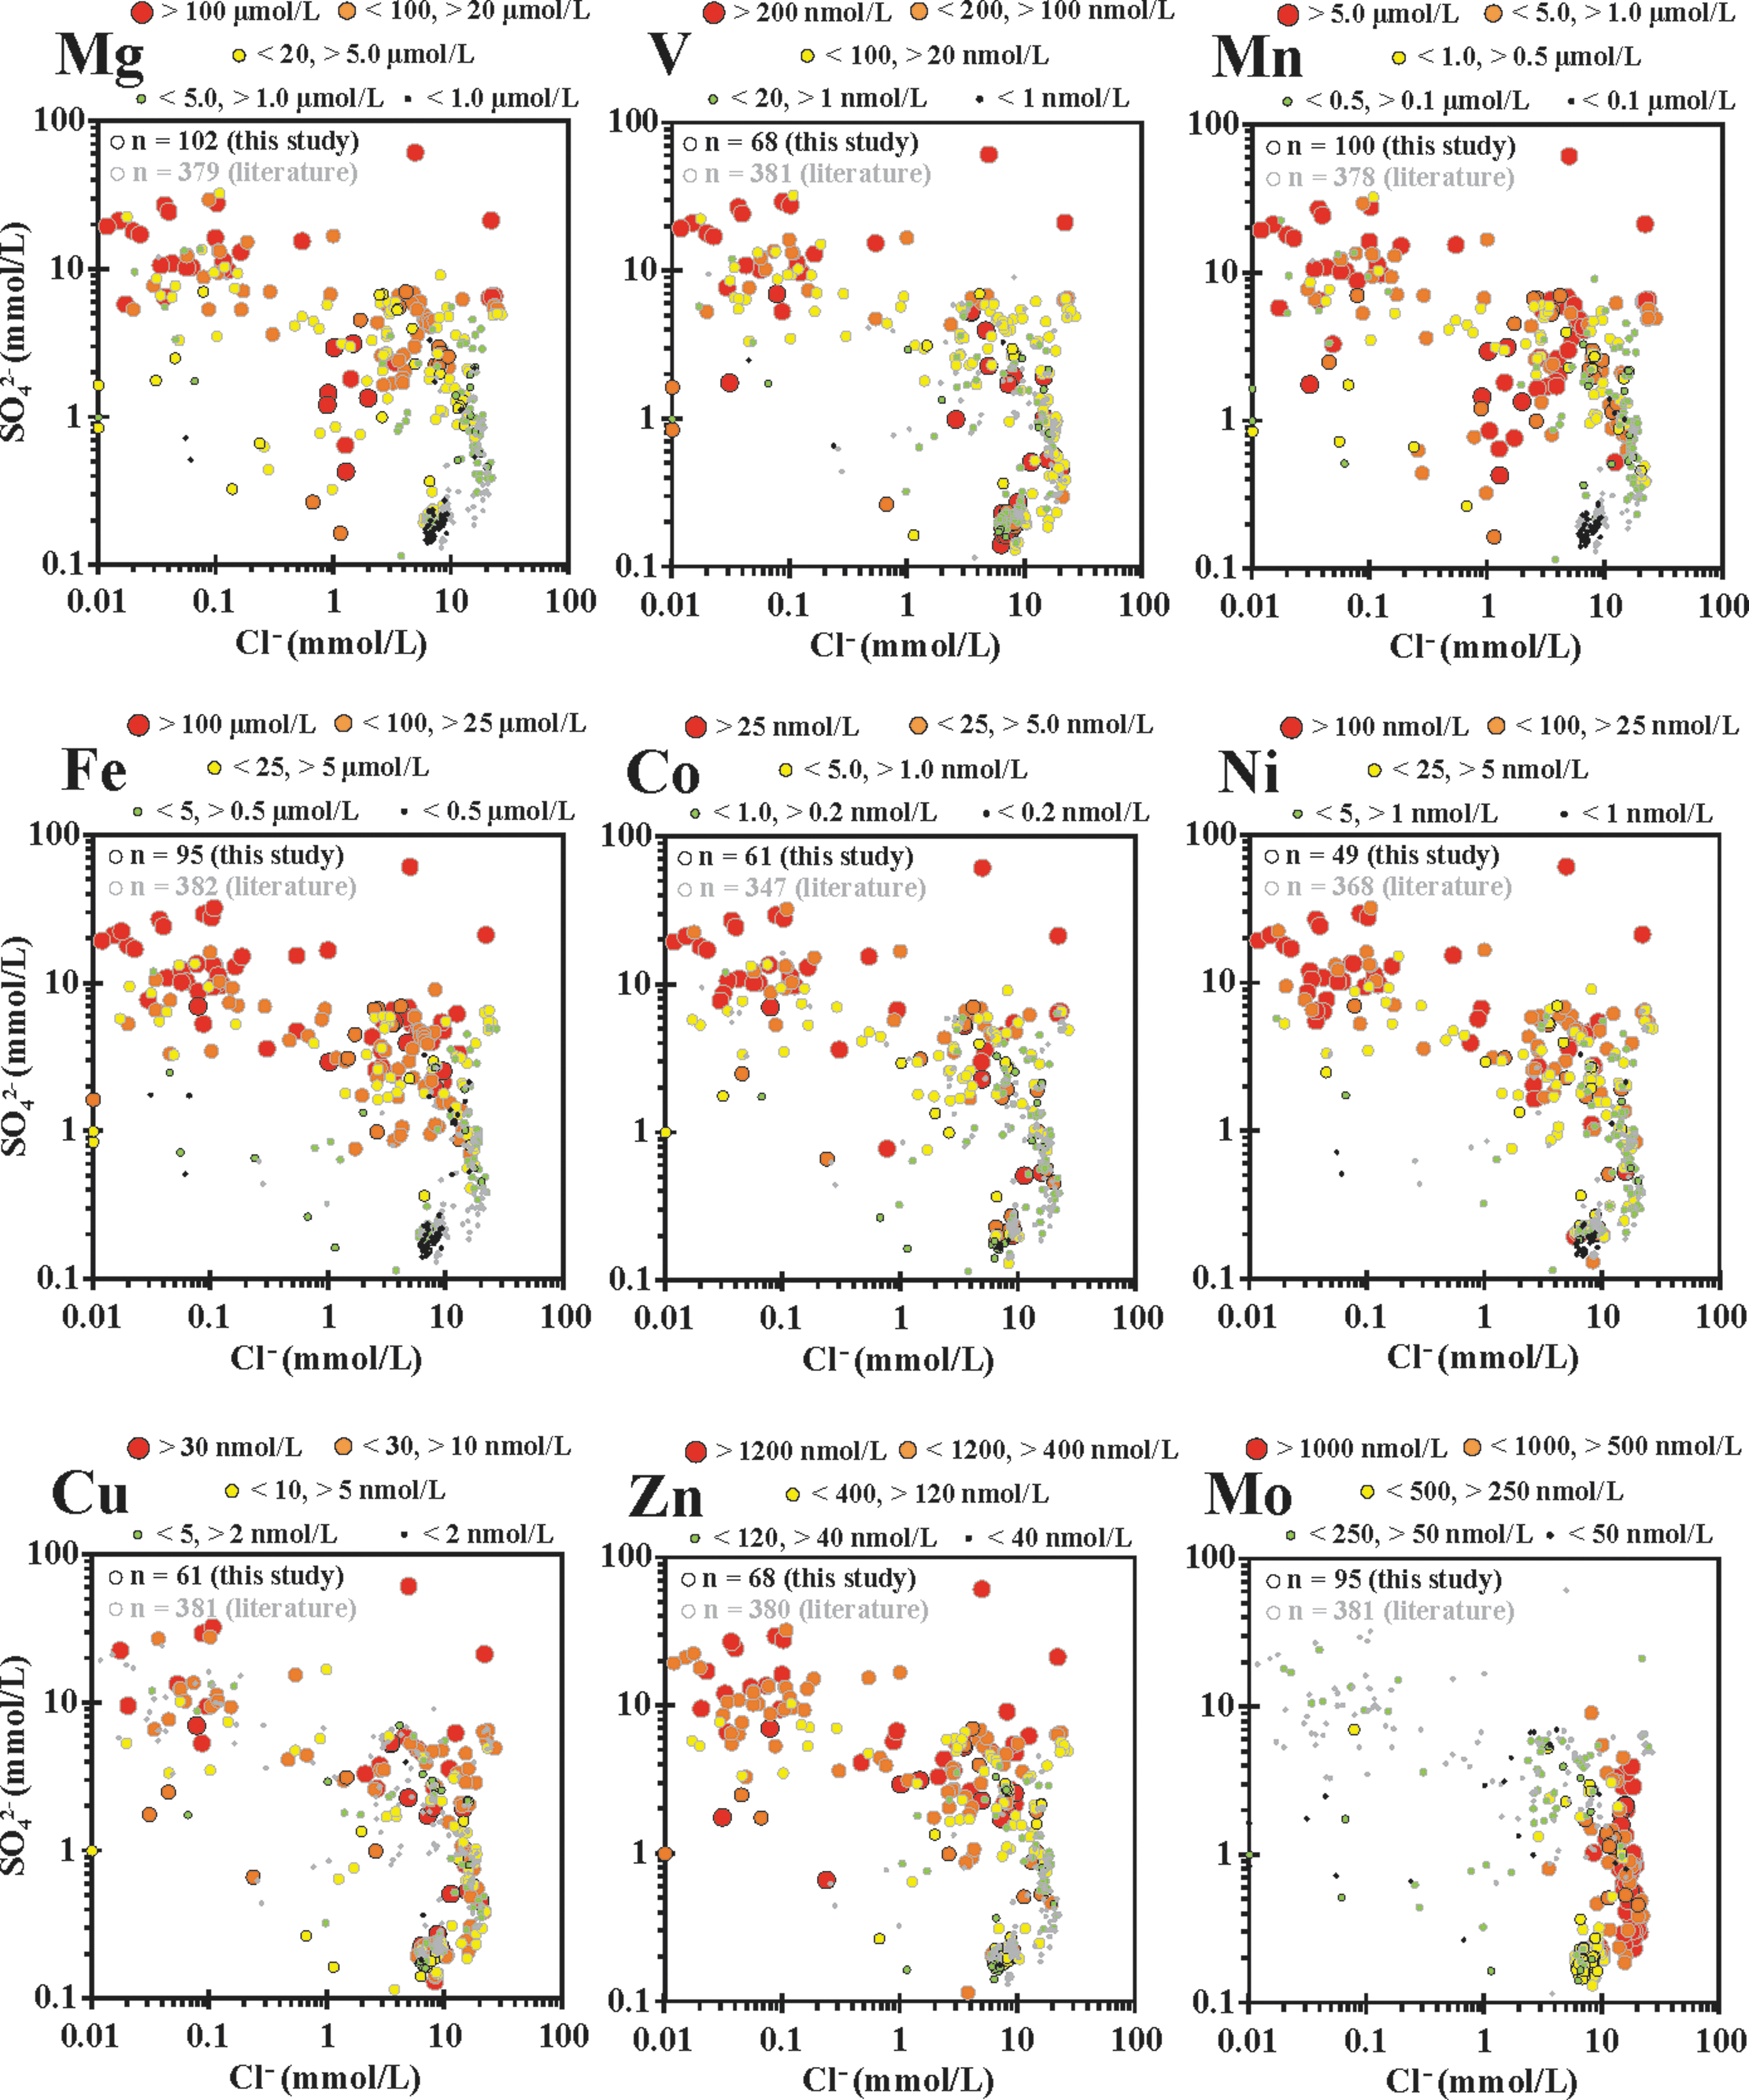
SO4 2− versus Cl− plots with hot spring trace biologically relevant (BIO-TRACE) element concentration bins overlain, including (in increasing elemental atomic weight) Mg, V, Mn, Fe, Co, Ni, Cu, Zn, and Mo. Element ranges for bins given for each element.
BIO elements—the major components of life—were measured as DIC, DOC, TDIN [the sum of NO3 −, NO2 −, and NH4(T)], and total dissolved phosphorous (P) in hydrothermal waters, with the concentrations binned and plotted within the SO4 2− versus Cl− field (Fig. 7). The DIC concentrations generally increased with increasing LPD input, with the majority of the highest concentrations measured (>6000 μM) found in the MPS area and lower DIC values in VPD hot springs due to low pH driving DIC to CO2(g), which is readily lost. Conversely, the highest DOC concentrations were observed in hot springs with vapor phase input, and most of the lowest DOC values (<50 μM) were found in the MPS area. This indicates that DOC is picked up from surface sources and concentrated in VPD hot springs, but it is not as readily concentrated in LPD systems, potentially due to the continuous turnover of hot spring water and/or heterotrophic breakdown, which is consistent with DOC δ13C values compared with allochthonous sources in previous work (Havig, 2009; Havig et al., 2011).
The TDIN concentrations were the lowest in the MPS area and greatest in the VPD area. A spread of concentrations was observed in remixed to LPD areas, which is consistent with volatilization as NH3(g) during subsurface phase separation and concentrated as NH4(T) with vapor phase condensate. Holloway et al. (2011) presented a more in-depth discussion about TDIN and its connection to subsurface processes and input.
High P concentrations were found across both MPS and phase separation hot springs, indicating that input of P from allochthonous and autochthonous sources may act as sources of P for microbial communities present, without a consistent pattern. Most of the lowest P sites plot in the MPS and LPD space, suggesting that the autochthonous hot spring source of P is less significant than that of allochthonous sources. This is consistent with the accumulation of P due to the breakdown of allochthonous organic material and/or dissolution of primary minerals in low pH phase separation dominant hot springs.
Concentrations of BIO-TRACE elements (Mg, V, Mn, Fe, Co, Ni, Cu, Zn, and Mo) were binned and plotted within the SO4 2− versus Cl− field and are shown in increasing atomic weight (Fig. 8). In general, for Mg, V, Mn, Fe, Co, Ni, Cu, and Zn, there was a clear difference between the phase separation and MPS areas, with the lowest concentrations found in MPS samples, and elevated concentrations found in phase separation dominant sites. Mo had the highest concentrations in the LPD phase separation sites, indicating input from concentrated liquid phase, and minimal dissolution in acidic hot springs.
NON-BIO elements can act as tracers of fluid interactions and uptake into biofilms that are not directly linked to biologic function. Binning and plotting concentrations of these and other NON-BIO elements in SO4 2− versus Cl− space help to elucidate the effects of phase inputs on concentrations of these elements in hot springs (Fig. 6). Li and As are elevated in phase separation hot springs with dominant LPD input (typically >600 μM Li and >25 μM As), indicating that they are accumulated while the source water is circulating at depth and then transported to the surface via the deep hydrothermal source and concentrated in the liquid phase during subsurface boiling. Al is sparingly soluble in circum-neutral water, especially in silica-enriched hydrothermal waters, and is thus transported via the liquid phase in relatively low concentrations (typically <40 μM). Conversely, relatively high concentrations of Al are observed in VPD hot springs (>200 μM) due to leaching from local rock and soil by sulfuric acid generated from oxidation of vapor phase accrued H2S. Though there is a relative paucity of Ga concentration analyses, Ga exhibits higher concentrations in the MPS sites. There are, however, indications that elevated Ga concentrations are also found in phase separation sites. The lowest Ga concentrations were observed in remixed springs. This may be explained by a solubility minimum for α-GaOOH around pH 4, with higher pH water concentrating Ga as Ga(OH)4 − in the liquid phase, and dissolution of Ga by acidic water concentrating Ga as Ga(OH)2 +, Ga(OH)2+, and Ga3+ (Benézéth et al., 1997).
Overall, LPD and MPS hot springs can be characterized as relatively enriched in elements that are transported by the liquid phase (including Li, DIC, Cl, As, and Mo). Conversely, VPD and remixed hot springs are relatively enriched in (1) elements that are transported with the vapor phase [TDIN specifically as NH3(g), and SO4 2− from the oxidation of H2S(g)]; (2) elements that are mobilized through acid leaching from subsurface and surface soil and/or rock by H2SO4 (including Mg, Al, V, Mn, Fe, Co, Ni, Cu, and Zn); and (3) elements that are introduced from breakdown of allochthonous organic material (including DOC, TDIN, and P). From this, we predict that microbial communities that live in these hot spring water types sequester elements differentially, which are, in turn, reflected in their elemental compositions.
5.2. Characterizing biocumulus elemental compositions
Element concentrations in biocumulus samples span one to >3 orders of magnitude (Fig. 9). This is likely due to multiple factors discussed in detail later, but to facilitate a comparison of biocumulus between MPS and phase separation dominant sites and with associated siliceous sinter deposits, the median values have been determined and used to highlight general trends. Average values were found to be influenced by small numbers of high concentration samples, whereas median values better represented the middle of the population of data points. Further, no difference was observed between chemotrophic and phototrophic biocumulus for either MPS or phase separation dominant sites, and so they will be treated together in the following discussion.
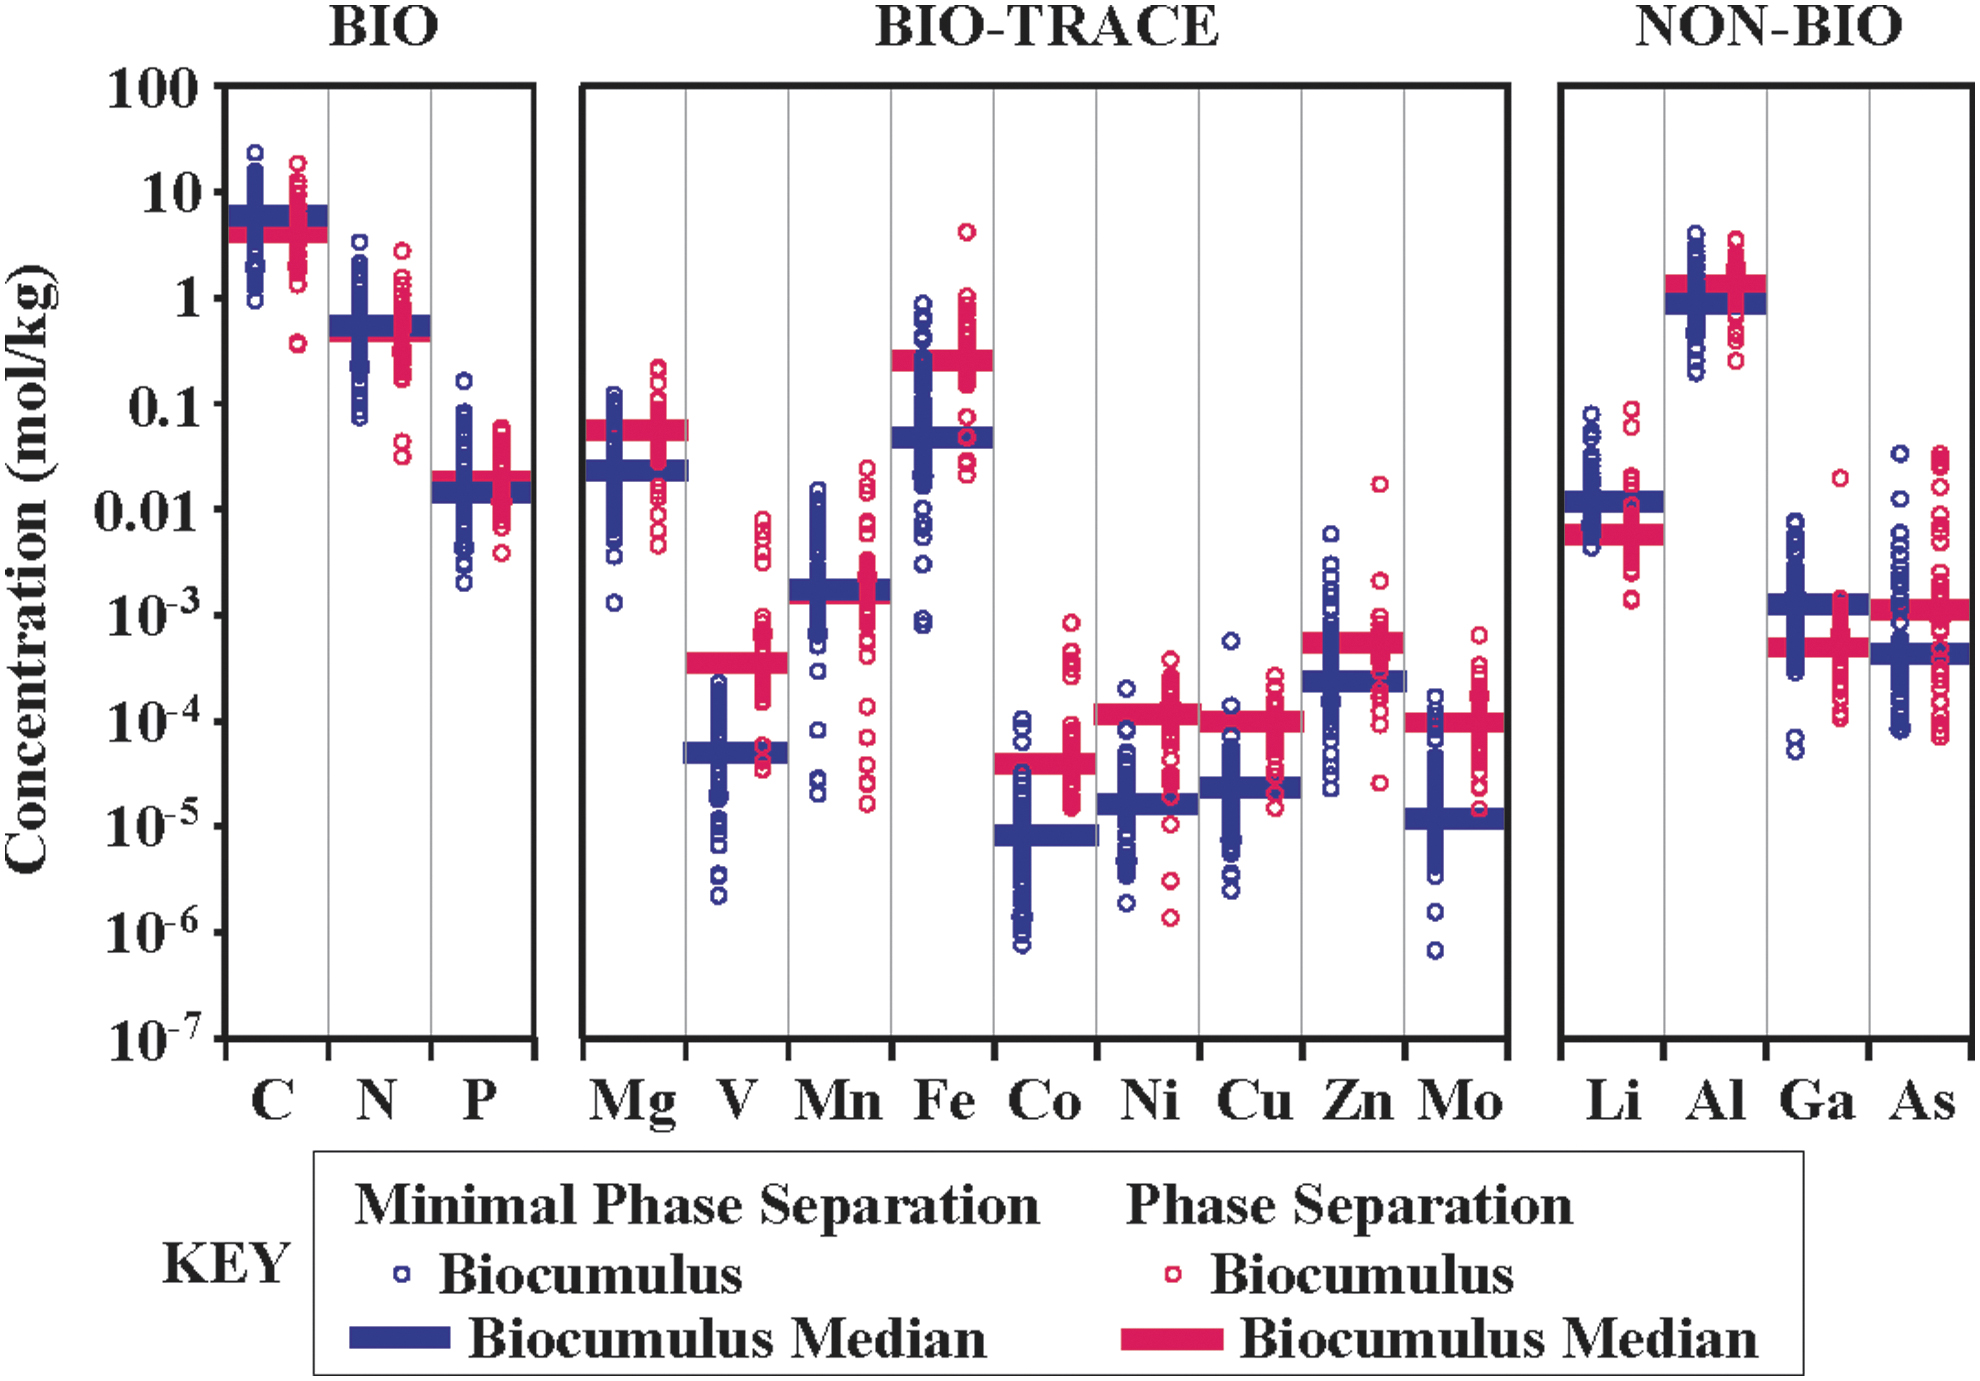
Biocumulus concentration and median values by increasing atomic weight for elements that are grouped into one of three bins, including biologically non-essential (NON-BIO, including Li, Al, Ga, and As), major biologically essential elements (BIO, including C, N, and P), and trace biologically essential elements (BIO-TRACE, including Mg, V, Mn, Fe, Co, Ni, Zn, Mo). Biocumulus samples grouped as either no phase separation sites (royal blue left-justified open circles and closed bar, n = 74) or phase separation sites (raspberry red right-justified open circles and closed bar, n = 39). Data from this study and literature (Havig, 2009; Havig et al., 2011; Schuler et al., 2017; Hamilton et al., 2019; Havig and Hamilton, 2019a, 2019b).
Most biocumulus samples are predominantly Si as the most abundant element (by dry weight), followed by C, Al, N, Ca, Fe, Mg, and P, indicating that inorganic components (represented by the high concentrations of rock-forming elements such as Si, Al, Ca, Fe, and Mg) as well as organic components (represented by C, N, and P) represent significant fractions of biocumulus (Havig, 2009). Thus, biocumuli are taken as primarily a mixture of three components as follows: (1) biomass and EPS represented by C, N, and P; (2) allochthonous rock and soil particulates broken down from two mineralogical components; and (3) autochthonous silica precipitated from the supersaturated hot spring water (Figs. 3 and 4) (Havig, 2009). The two mineralogical components of allochthonous rock/soil (represented by soil and rock samples overlying literature values for Yellowstone rhyolites) and autochthonous silica precipitate (represented by siliceous sinter samples approaching 100% SiO2) can be taken as two end members of a mixing line, with biocumulus falling on the line and moving toward the 100% silica end member with increasing silica precipitation over time (SOM) (Fig. 2) (Havig, 2009).
5.2.1. Minimum phase separation sites versus phase separation sites
To examine the differences between MPS hot spring biocumuli and those from phase separation dominant hot springs, 77 MPS biocumulus sample compositions from this study and literature (Havig, 2009; Havig et al., 2011; Hamilton et al., 2019; Havig and Hamilton, 2019a, 2019b; Gangidine et al., 2020) and 39 phase separation site biocumulus sample compositions from this study and literature (Havig, 2009; Schuler et al., 2017; Hamilton et al., 2019; Havig and Hamilton, 2019a, 2019b) were analyzed for elemental composition and compiled and compared (Fig. 9). From this comparison, it is apparent that there are similarities in BIO element concentrations, whereas there are distinct differences between BIO-TRACE and NON-BIO element concentrations between MPS and phase separation sites.
Phase separation and MPS biocumulus samples exhibit complete overlap of C, N, and P concentration and similar median values despite the range of differences in metabolism, suggesting similar processes for the accumulation of cellular biomass and associated EPS. This is consistent with all analyzed biocumuli having microbial communities rooted with autotrophic members that drive autochthonous productivity, based on either phototrophy or chemolithotrophy fueled by substrates delivered by the hot springs (e.g., H2S, Fe2+, Mn2+, H2, etc.), which has been noted by previous work (e.g., Meyer-Dombard et al., 2005; Spear et al., 2005; Boyd et al., 2009; Schuler et al., 2017; Coleman et al., 2019; Hamilton et al., 2019; Havig and Hamilton, 2019a, 2019b). This is also consistent with ready availability of fixed N as either NH4(T) and/or NO3 − delivered by the hot springs or through biological nitrogen fixation (Hamilton et al., 2011; Holloway et al., 2011), as well as P delivered by the hot springs, or from allochthonous input of biomass, soil, and/or rock that is broken down. BIO-TRACE element concentrations in biocumulus from MPS and phase separation dominant sites overlap, but median values suggest a general pattern of phase separation site biocumulus samples that have higher concentrations of all but Mn (Fig. 9). This is consistent with an overall pattern of higher concentration of these elements in phase separation dominant hot spring water (Fig. 8), suggesting that a higher concentration of dissolved elements enhances uptake and sequestration. NON-BIO element concentrations had mixed signals: Li and Ga were generally higher in MPS biocumulus, whereas Al and As were generally higher in phase separation site biocumulus samples. However, Al and As concentrations in the two categories of biocumulus overlapped.
5.3. Allochthonous materials as potential inputs to biocumulus
Given that hot springs are open systems, it is unsurprising to find evidence for input of allochthonous material, ranging from observing dead insects (e.g., dragonflies, beetles, crickets, grasshoppers, etc.), animals (e.g., voles, newts, mice, bison, deer), animal excrement (e.g., bison feces), and plant matter (e.g., grasses, sedges, Lodgepole Pine needles and wood, etc.) from the local endemic biota in hot springs and hot spring runoff channels to noting transport of soil particulates from wind, rain and hail impact, and precipitation runoff. Thus, it is important to attempt to identify any impact of inputs into hot springs on element uptake in biocumuli.
The impact of potential input of C and N as biomass from allochthonous sources was examined by using C:N ratios (Fig. 10). Biocumulus from both MPS and phase separation sites fell along a 10.1 C to 1 N line, suggesting that this is a signal of hot spring microbial community biomass akin to the Redfield Ratio (6.625 C to 1 N) used to describe oceanic phytoplankton (Redfield, 1934, 1958). Silica sinter samples that are presumed to have derived from biocumulus also fell along this 10.1:1 line, suggesting the biomass preserved was sourced from biocumulus. Local soils clustered along a 21.7 C to 1 N line, suggesting significant depletion in N relative to biocumulus. Further, most soils had C and N concentrations that were below most biocumuli, making it unlikely that soils were a major contributor of those elements. Biota C:N ratios were either much lower (e.g., average C:N values ≤6.4 for insects and bison fur) or much higher (e.g., average C:N values ≥20.0 for plants and bison feces), and they exhibited a wide range of N concentration versus a relatively narrow range of C concentration. This evidence supports the hypothesis that most of the C and N in biocumulus samples is accrued from inorganic sources in the hydrothermal water [e.g., DIC, NH4(T), NO3 −] or atmosphere (e.g., biological fixation of N2). This is supported by previous work that has shown that hot spring biocumulus samples had different δ13C and δ15N values compared with potential sources of allochthonous input (Havig, 2009; Havig et al., 2011).
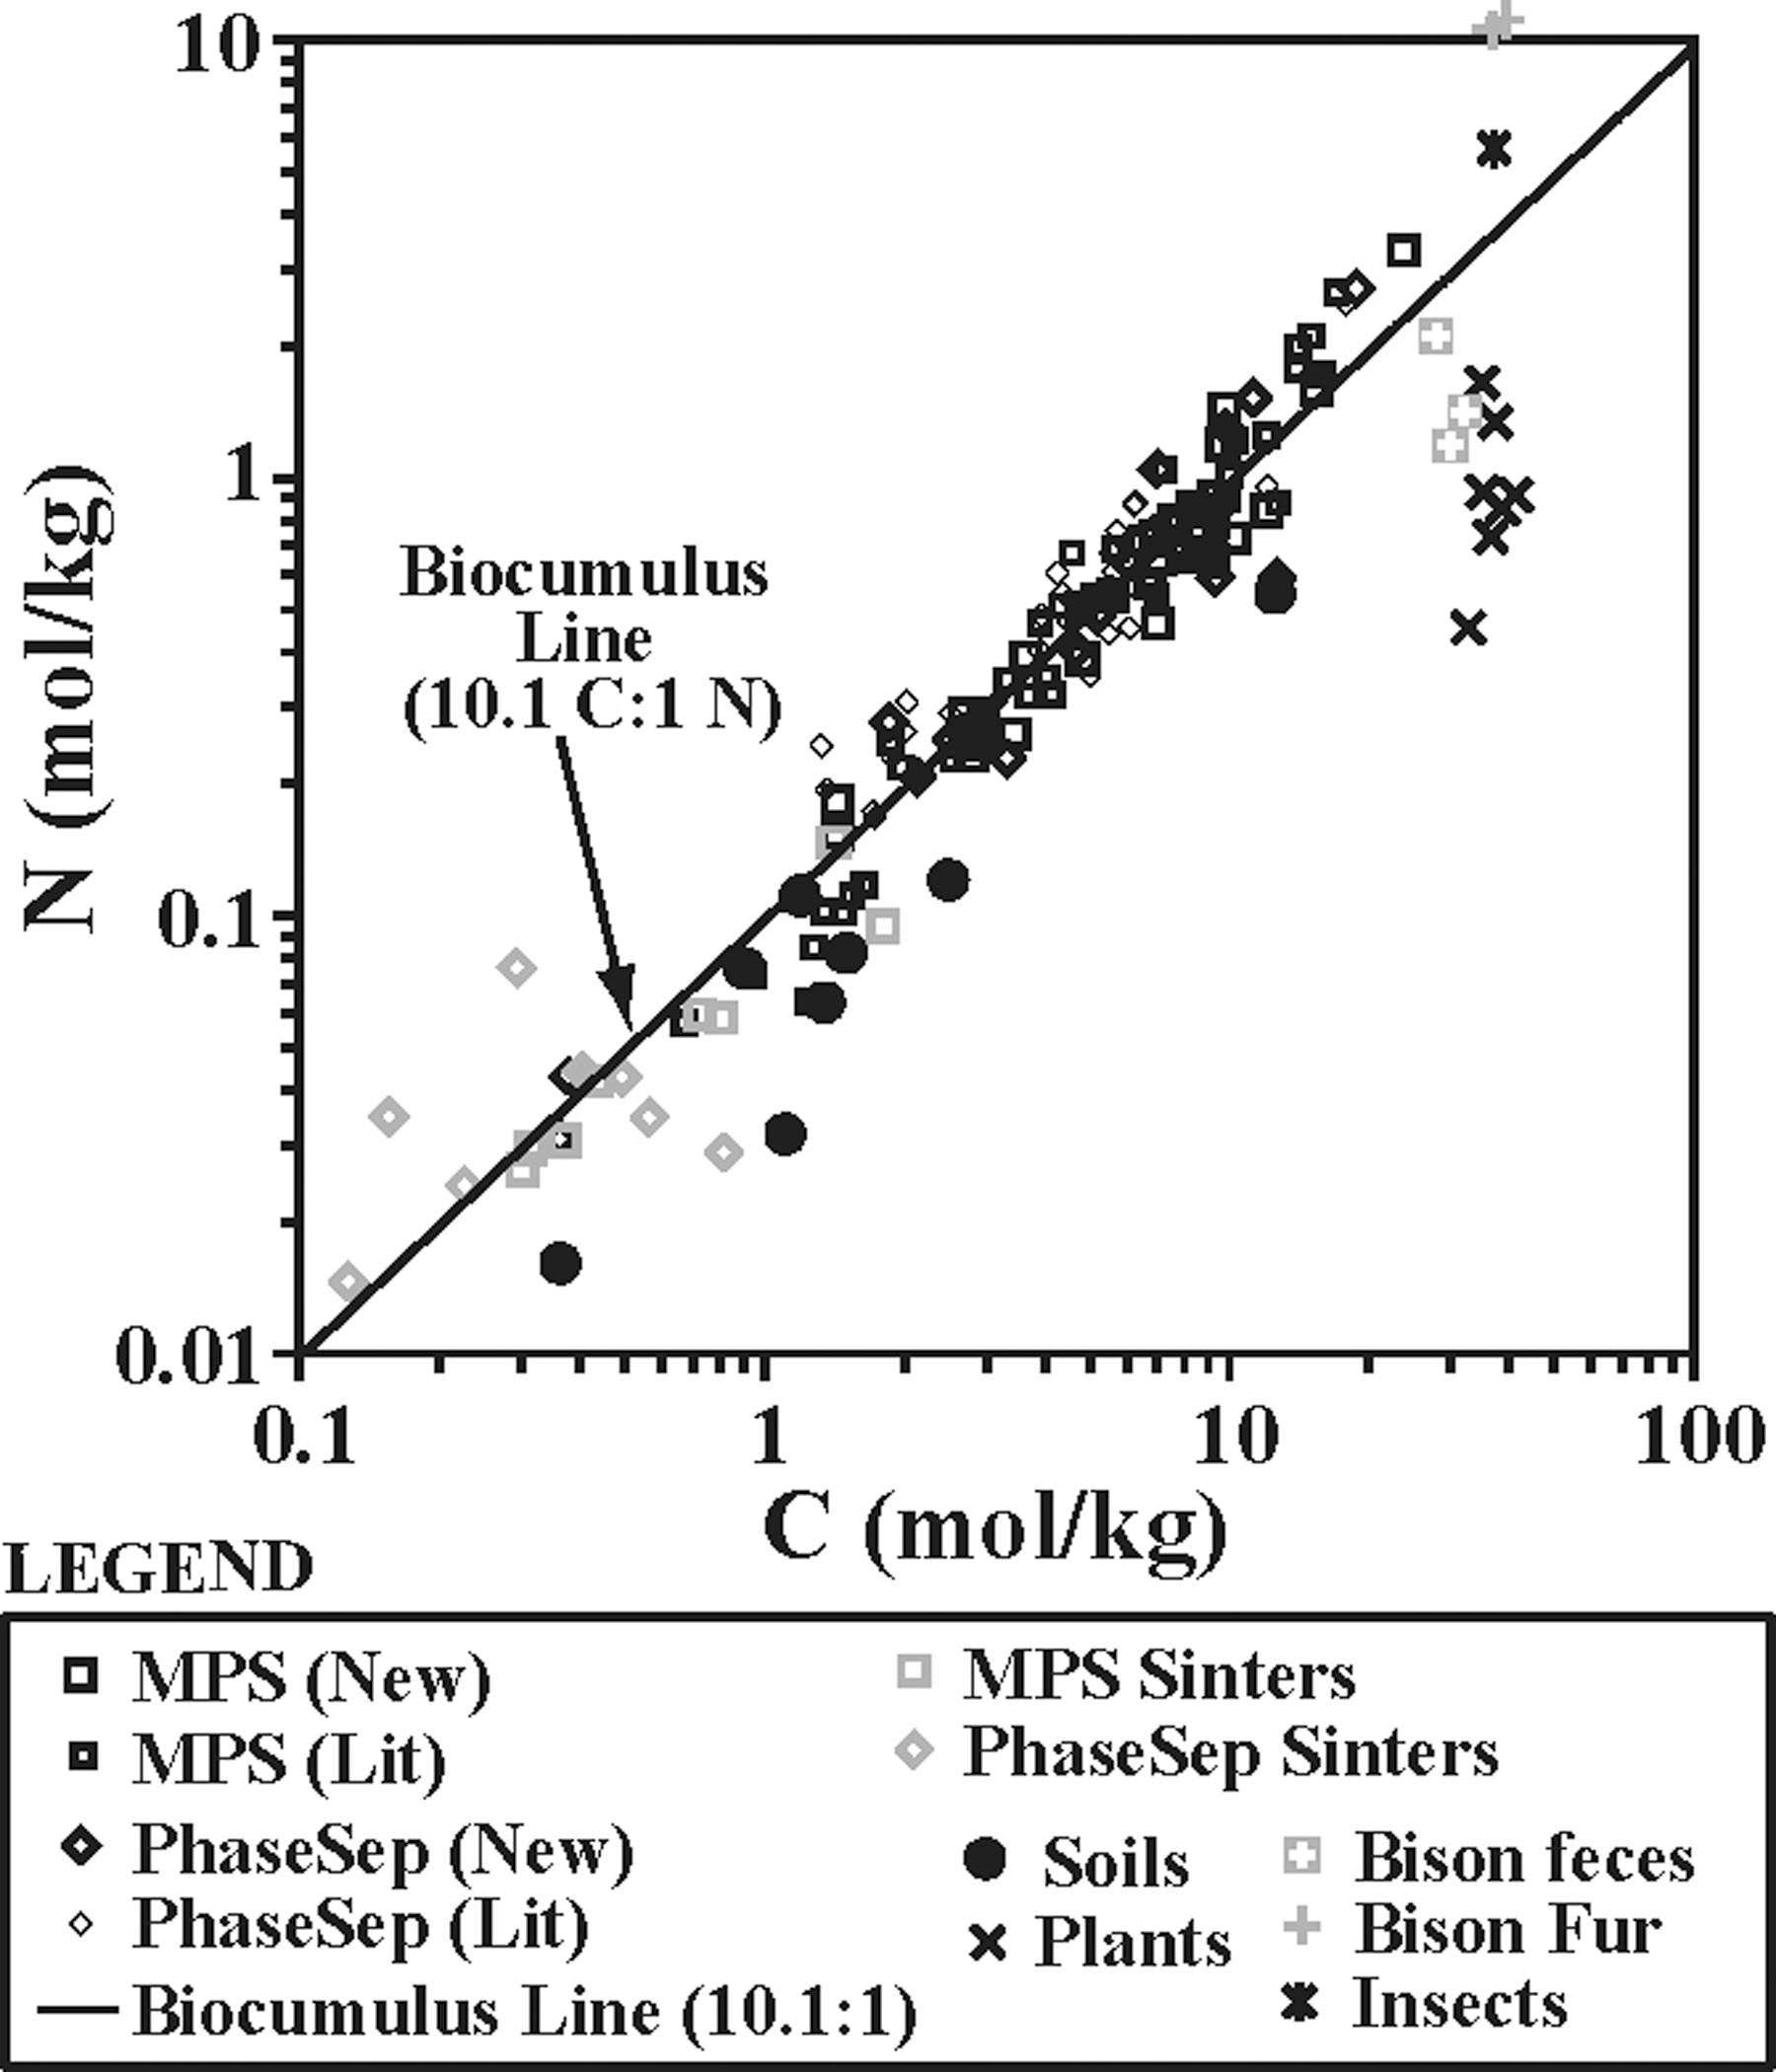
Carbon and nitrogen in biocumulus, soils, and contextual samples. Top: Nitrogen concentration plotted against carbon concentration for samples from this study and literature for MPS sites (MPS, n = 75), phase separation sites (PhaseSep, n = 47), no phase separation site sinter samples (n = 8), phase separation site sinter samples (n = 10), local soil samples (n = 8), plant samples (mosses, lodgepole pine needles, grasses and sedges, n = 7), bison feces samples (n = 3), bison fur samples (n = 2), and an insect sample (n = 1). MPS, minimal phase separation. Literature values taken from Havig (2009), Havig et al. (2011), Schuler et al. (2017), Hamilton et al. (2019), and Havig and Hamilton (2019a, 2019b).
Mineralogical allochthonous inputs are assumed to be represented by local volcanic rocks and the local soils derived from them, which can be transported as particulates into hot springs from wind, precipitation impact, or fluvial transport. Median rock and soil element concentrations plotted against median values for MPS or phase separation site biocumuli median values fall close to a 1:1 line, suggesting a systematic input of these elements from a mineralogical source (Fig. 11). The C and N fall above the 1:1 line, representing the uptake of those elements from hot spring water sources (described above). Al is sparingly soluble in circum-neutral to alkaline water and is not essential to biological functions; Al is, however, a major component of the local volcanic rocks and thus an ideal tracer for mineralogical soil particulate input into biofilms in MPS sites. A line that intercepts the Al median value and is parallel to the 1:1 line is taken to represent where elements would fall if their input into biofilms was solely from allochthonous mineralogical particulate input (dashed line, Fig. 11). Elements that fall on, or close to, the Al line include Fe, Mn, Zn, Cu, Mo, and Co, with Ni, V, and Mg not as close. This proximity suggests that a significant portion of these elements are taken up by biocumuli from allochthonous particulates. Elements that fall above this line, besides C and N, include P, Li, Ga, and As. P is an essential element for life, so focused uptake is not unexpected. However, though they are not known to be essential components for life, enrichment of Li, Ga, and As (which are relatively enriched in MPS water) (Fig. 6) suggests that uptake from the hot spring water is a significant contribution to biocumuli compositions. These patterns of element uptake from autochthonous water and allochthonous particulate sources for MPS biocumuli are consistent with what has been previously reported (Havig, 2009).
Phase separation sites tend to have lower pH values (Fig. 5), where Al is more soluble (Fig. 6) and potentially drives the dissolution of mineralogical particulates. Thus, disentangling uptake of dissolved constituents versus input from allochthonous particulate material is a greater challenge for phase separation site biocumulus. The Al line for phase separation biocumulus falls closer to the 1:1 line, with the elements Fe, Li, Mn, Zn, and Co falling on or close to the Al line (Fig. 11). Elements that fall above the line, besides C and N, include Mg, P, Ga, As, V, Cu, Mo, and Ni. Elements in phase separation biocumuli that exhibit similar characteristics to those from MPS include BIO elements C, N, and P and BIO-TRACE elements Mn, Fe, Co, and Zn. Relatively greater enrichment in Mg, V, Ni, Co, and lower enrichment in Li may be indicators of the influence of lower pH/higher H+ activity on the ability of biocumuli to uptake these elements coupled to elevated concentrations, but further study is needed to disambiguate these results.
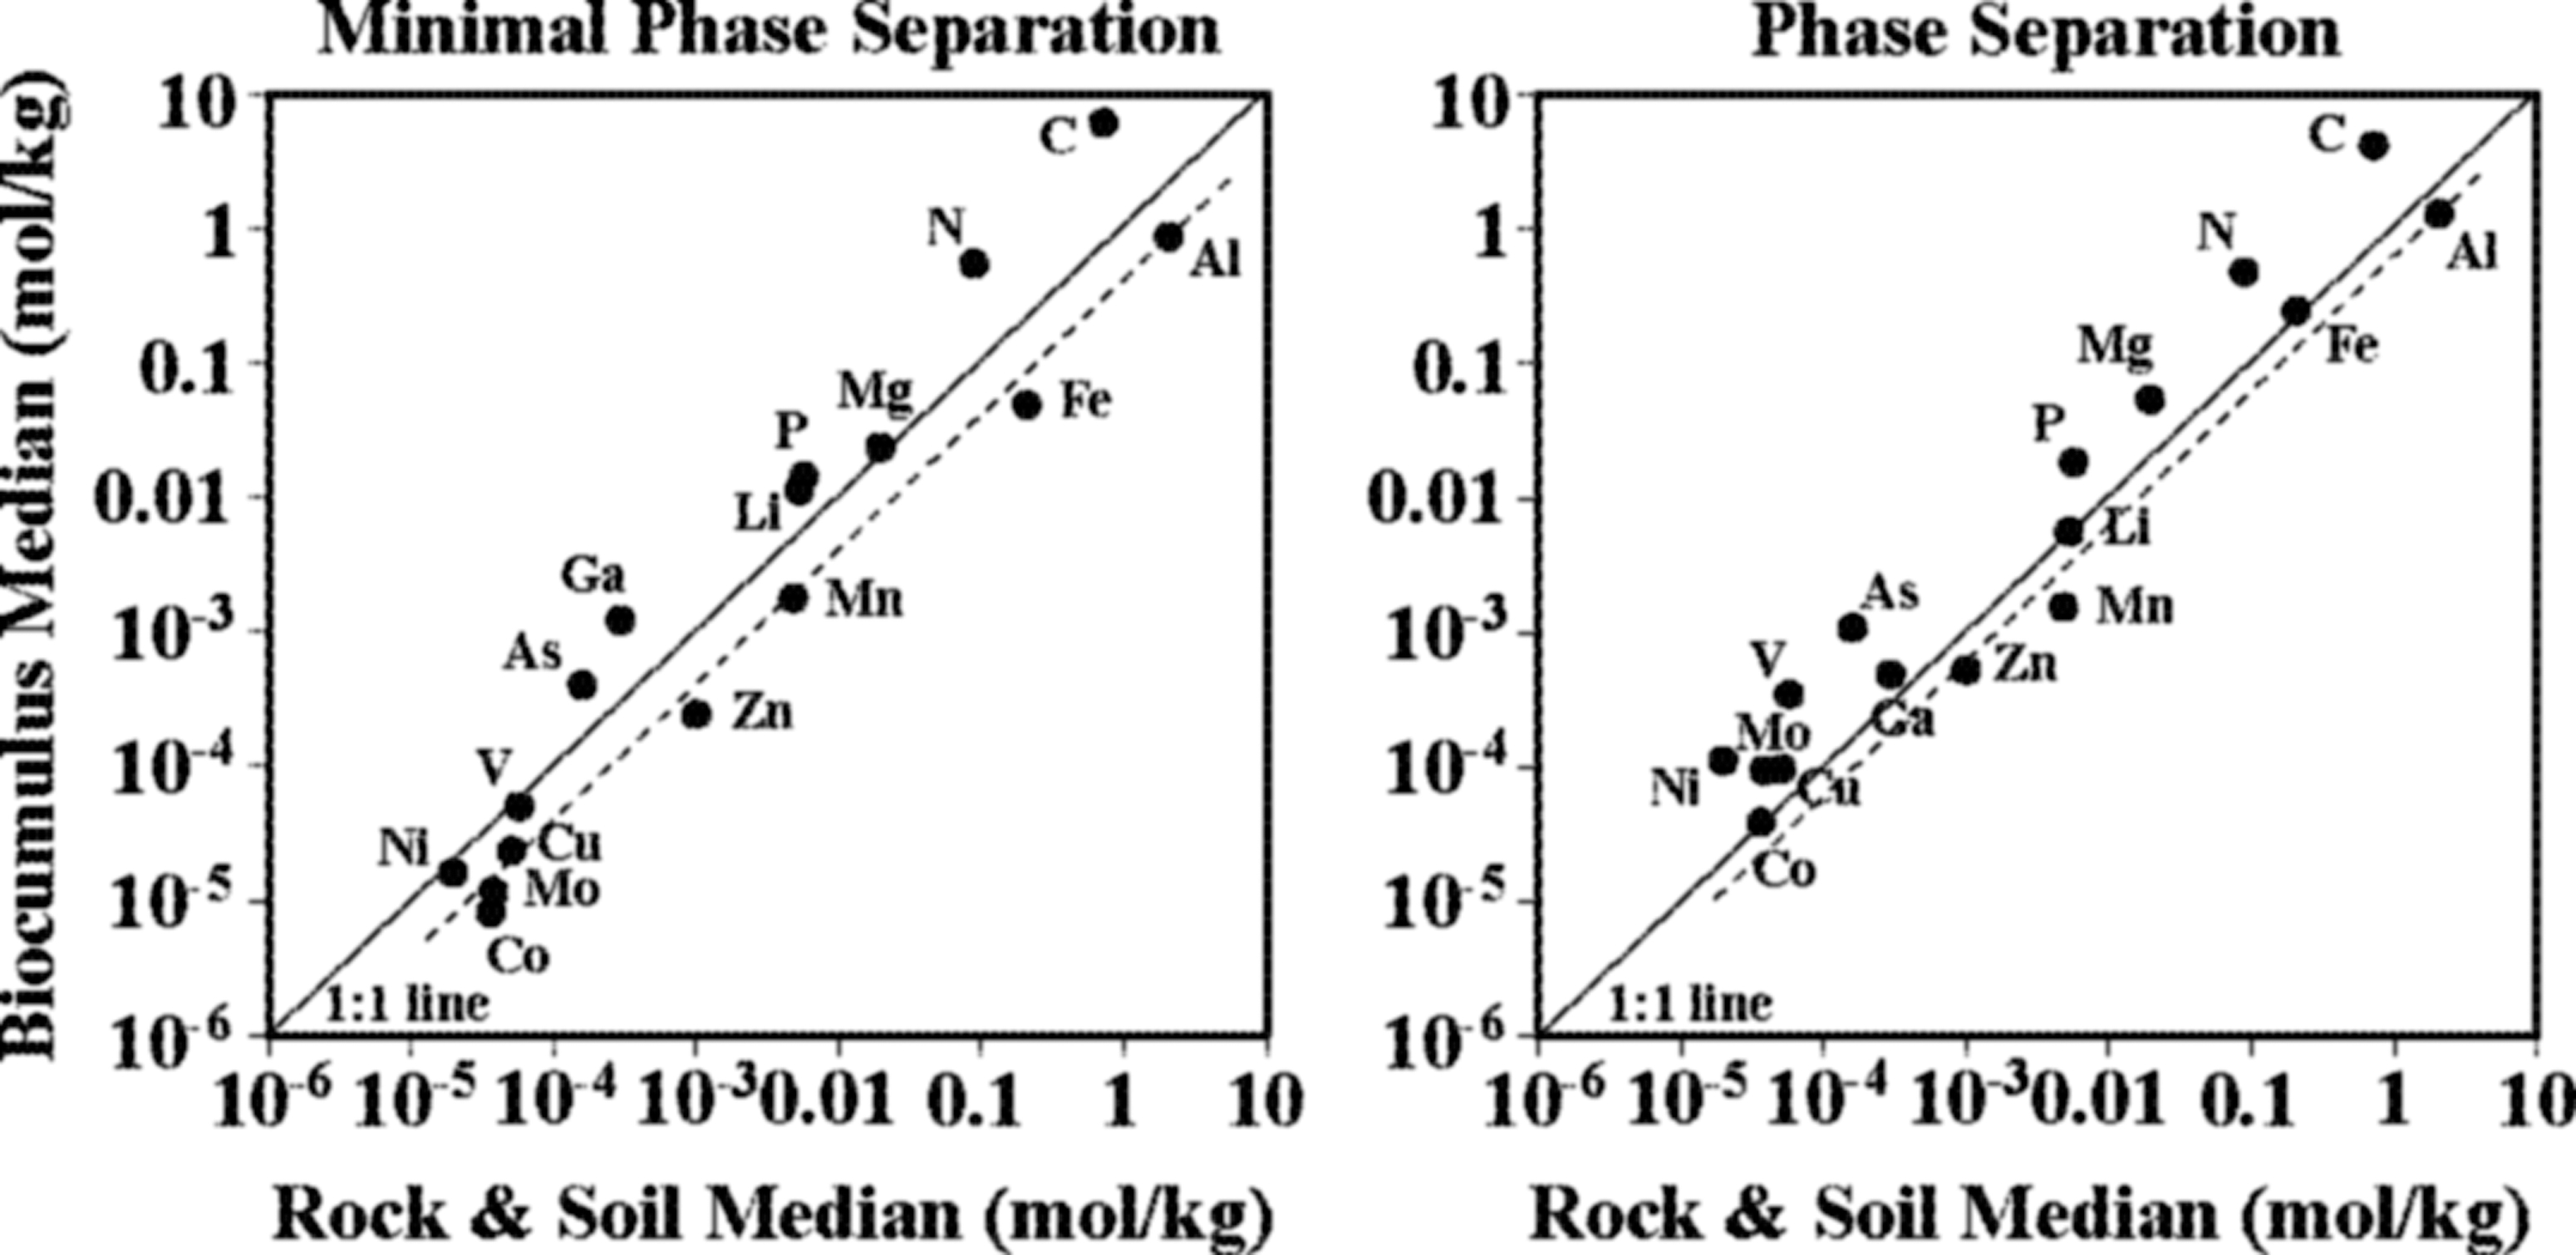
Biocumulus median element concentration values plotted against rock and soil median concentration values for MPS sites (left) and phase separation sites (right). 1:1 Line (solid) and a parallel line centered on Al (dashed) given for each plot.
Biocumulus in silica saturated hot springs continuously takes up silica due to precipitation, increasing the potential for biocumuli to be preserved as siliceous sinter in the rock record. Comparing biocumuli with associated siliceous sinter deposits would provide evidence for the question of which elements sequestered in biocumuli are retained through the transition to siliceous sinter. Specifically, retention of elements may provide evidence for an element concentration biosignature that could be preserved in the rock record even without the presence of associated microfossils. Whether or not trace elements taken up as allochthonous particulate material are sequestered/associated with biomass/EPS or remain as separate particulates trapped in silica could be tested by measuring whether there was loss of the elements of the same magnitude as Al. Similar elemental mass loss as that of Al would suggest that all that was lost was associated with soil particulates that were not incorporated in the silica precipitate. This would also suggest that all elements retained were associated with preservation of biomass within the silica sinter matrix. Also, retention of the soil particulate signal and hot spring water signal would give information on the environment at the time of the biocumulus formation, which would potentially be useful for teasing apart what the water chemistry and local soil compositions were. Less loss of Al might mean there was more Al sequestered into the silica from the dissolved component in phase separation biocumulus to sinter transition. All of this would serve as a first step toward potentially developing a novel biosignature that could be used for looking for signs of life in the ancient rock record as well as on other planets.
5.4. Biocumulus comparisons to sinter
BIO, BIO-TRACE, and NON-BIO element concentrations for biocumulus and sinter samples from MPS and phase separation sites are shown in Fig. 12. Biocumulus and sinter sample concentrations and median values are displayed for each element, with the overall element retention from biocumulus to sinter calculated from median values.
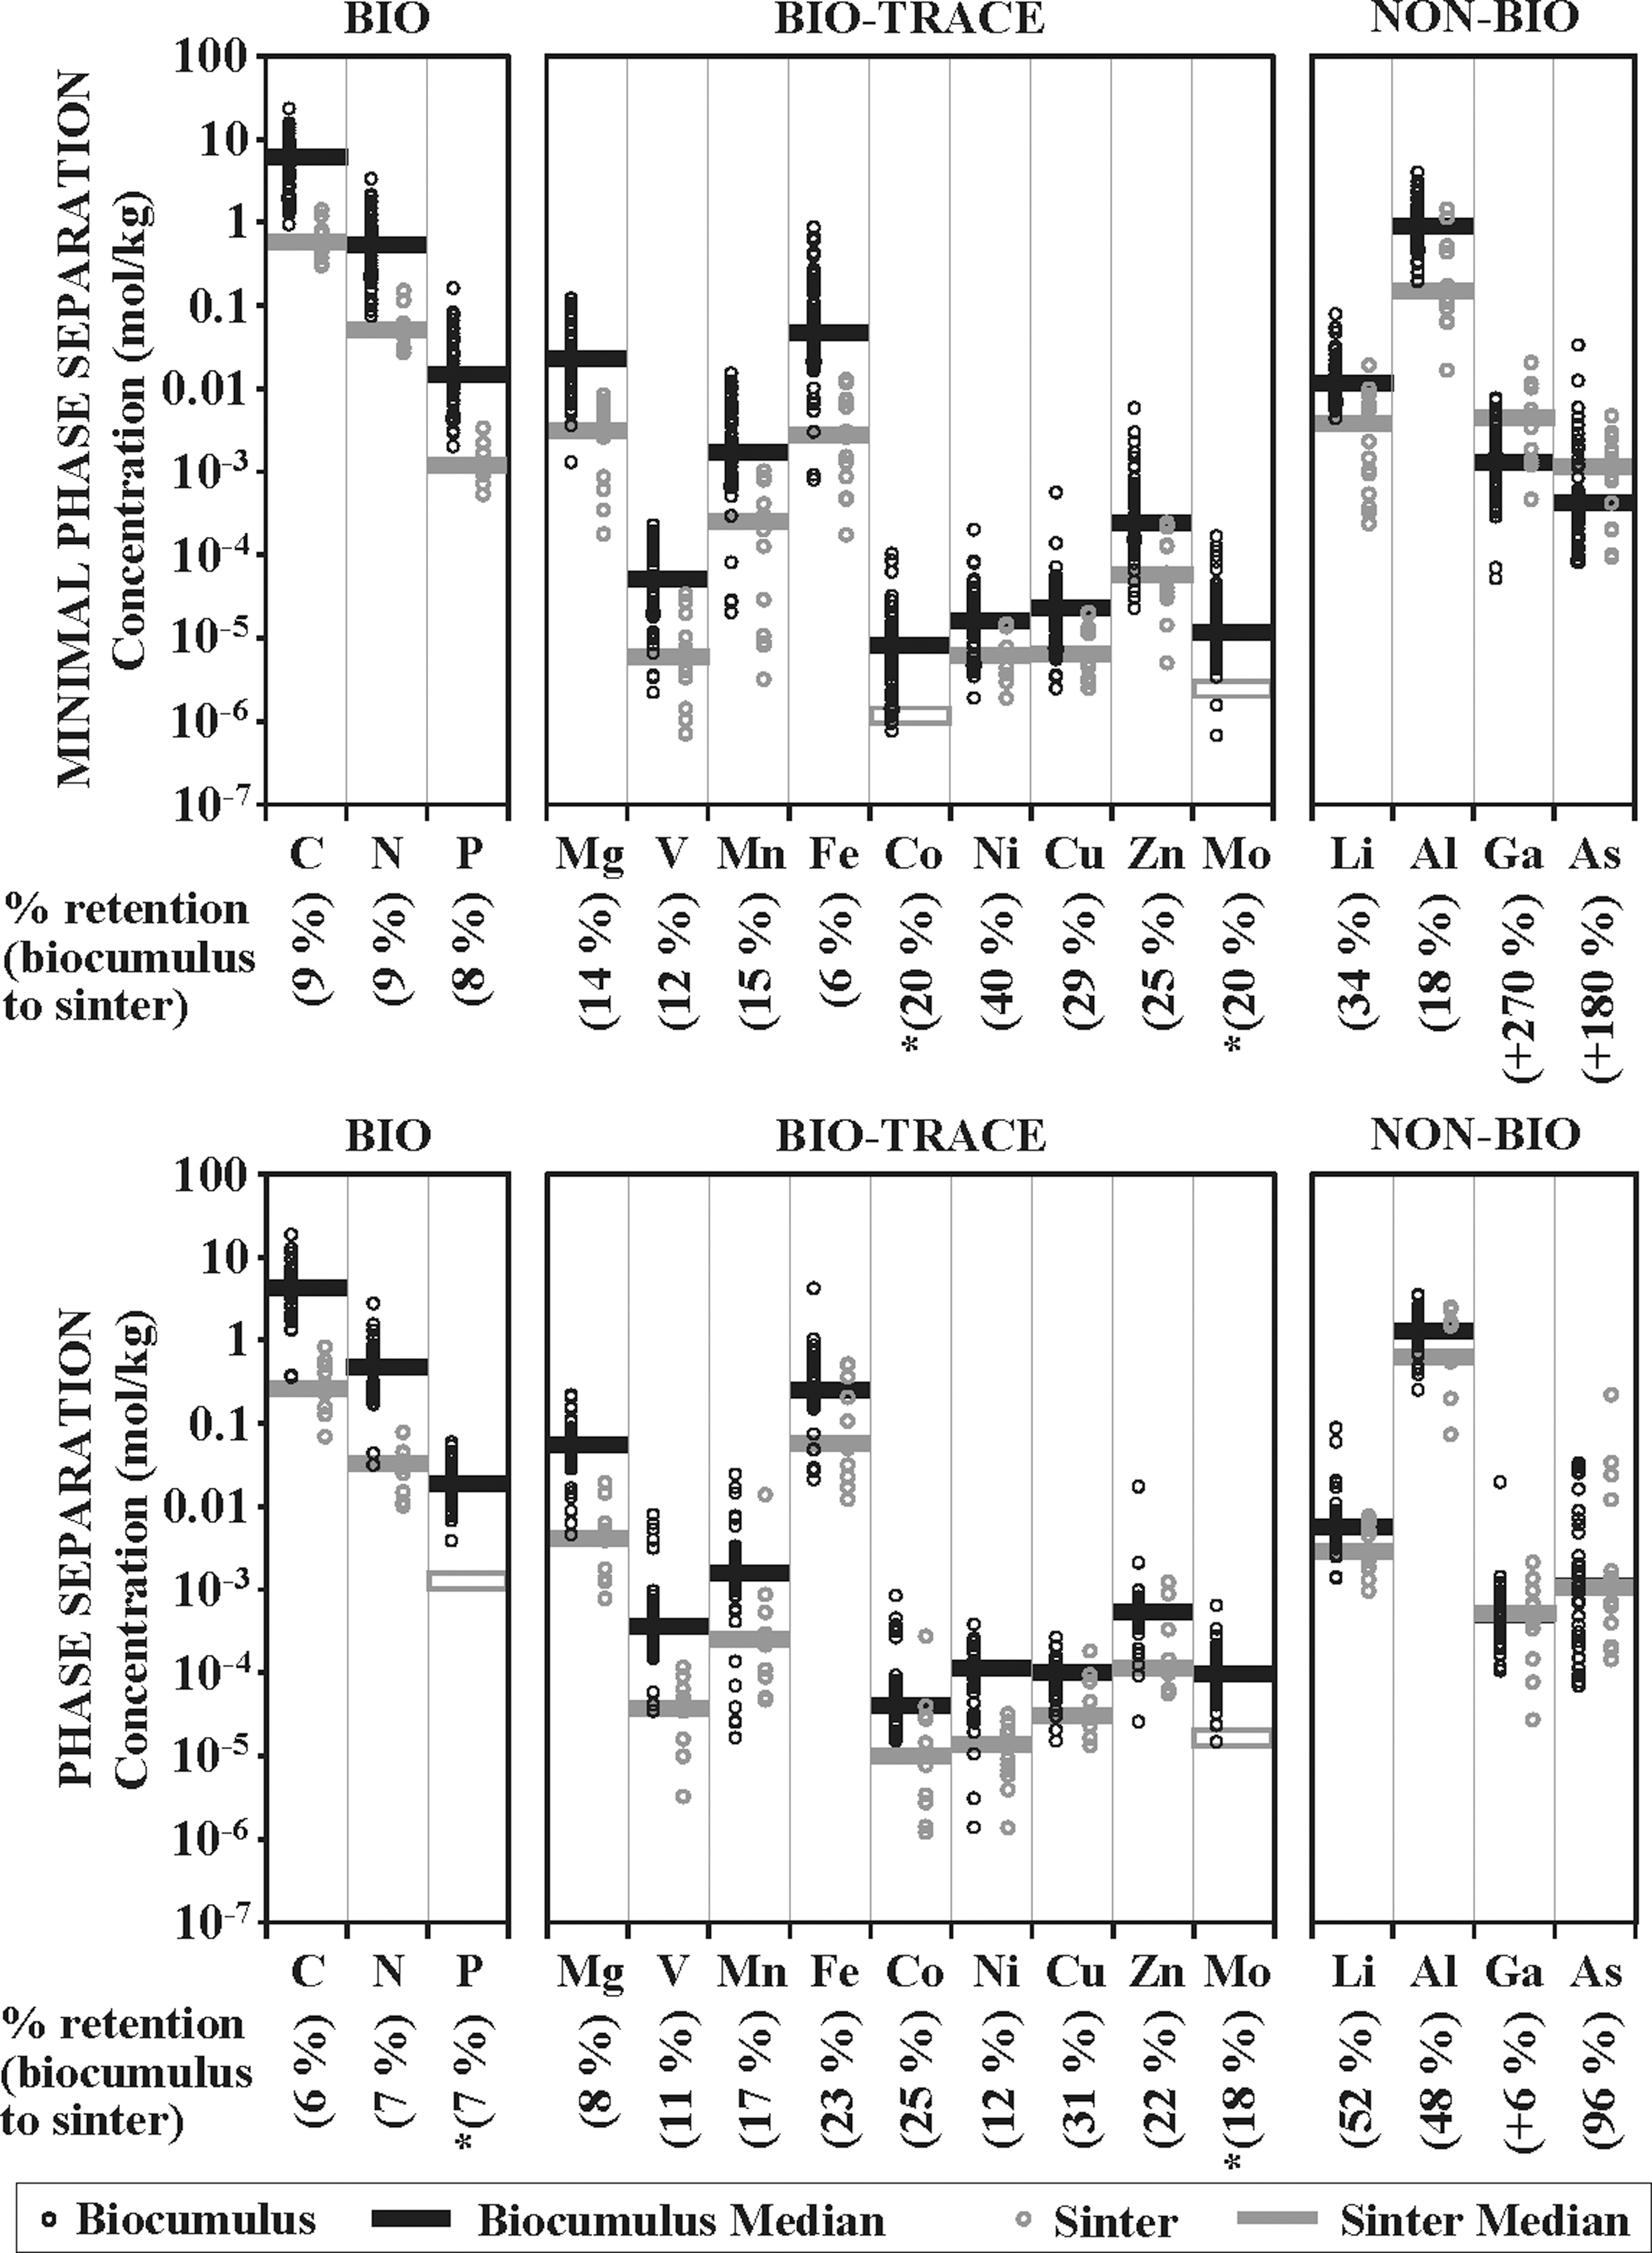
Elemental compositions and median values for top: no phase separation area biocumulus and sinter, and bottom: phase separation area biocumulus and sinter, both plotted against element in increasing atomic weight. Elements binned as described in Section 3.2. Data from this study and literature (Havig, 2009; Havig et al., 2011; Schuler et al., 2017; Hamilton et al., 2019; Havig and Hamilton, 2019a, 2019b). Percent retention between biocumulus median and sinter median given below each element column.
5.4.1. Biocumulus to sinter: MPS sites
Comparing biocumulus with sinter median values, all BIO elements exhibited similar retention rates of 8–9% C, N, and P through to sinter, suggesting that there was retention of biomass within the silica sinter matrix (assuming any exposed organic carbon would be broken down and removed). An overlap of low concentration biocumulus with high concentration sinter sample concentrations likely represents the continuum of biocumulus to sinter transition as biocumulus accumulates silica over time. However, it is our assumption that systematic retention of C, N, and P from the original biomass through this first step in diagenesis is a primary indicator for the preservation of biosignatures.
Similar to BIO elements, BIO-TRACE elements also exhibited evidence for a systematic retention of sequestered elements from the original biocumulus through to sinter, though there was a large range of retention rates between median values (Fig. 12). The lowest retention rate was exhibited by Fe (6%), and the highest retention rate by Ni (40%), with an overall average of 20% retention rate for the BIO-TRACE elements. The Co and Mo concentrations for sinter samples were near or below detection limits (data not shown), so a predicted median value based on the average retention rates for the other BIO-TRACE elements is shown. Retention rates for Li (34%) and Al (18%) fall within the range of BIO-TRACE elements, suggesting similar loss and retention pathways. The similarity in Al and BIO-TRACE element retention rates indicates that siliceous sinters derived from biocumuli may retain a signature of the allochthonous mineralogical particulate input. Retention of Ga and As, however, indicated no loss with transition from biocumuli to sinters. Retention of Ga is consistent with recent work, suggesting co-precipitation of Ga with silica associated with filamentous sheaths in MPS settings (Gangidine et al., 2020). Retention of As may be the result of microbial communities carrying out detoxification reactions precipitating As-bearing minerals, which may then be incorporated in silica precipitate. Further study is necessary to test these hypotheses.
5.4.2. Biocumulus to sinter: phase separation sites
Despite the differences in geochemistry from MPS hot springs, retention of elements across the transition from biocumulus to sinter in phase separation sites was surprisingly similar (Fig. 12). Retention of BIO elements C (6%) and N (7%) was less than what was observed at MPS sites. The P concentrations were too close to background levels, so reliable concentration values could not be recovered. A predicted P retention number is given based on what was observed in MPS sites (with P retention similar to that of C and N). A comparison of median values for biocumuli and sinters for BIO-TRACE elements showed retention of all elements analyzed, ranging from Mg with the lowest retention rate (8%) to Cu with the highest (31%), and an average retention rate of 18%. Sinter samples had Mo concentrations that were too close to background levels to return reliable numbers, and so the average retention rate for the other elements is shown as a predicted retention rate. The retention rates for Li and Al were similar (52% and 48%, respectively), and they were higher than the retention rates for BIO-TRACE elements. The higher retention rates for Li and Al suggest that these elements are also incorporated within the silica precipitate in the phase separation sites more than at MPS sites, possibly preserving an environmental indicator that could be used to differentiate between the environmental settings at the time of biocumulus formation. Similar to the MPS sites, Ga and As were completely retained in the transition from biocumulus to sinter, indicating that the processes that drove retention in MPS sites may also be occurring at phase separation sites. Given this, future work should be done to test whether the results reported by Gangidine et al. (2020) suggesting co-precipitation of Ga with silica associated with microbial filaments may also occur at phase separation sites, potentially providing a universal biosignature in this environment.
5.4.3. Conceptual model
This work paints with an admitted broad stroke, comparing biocumulus from a wide range of environmental conditions and a likely equally wide range of microbial community compositions. However, patterns of sequestration and retention through the initial phases of diagenesis indicate a general pattern suggesting fidelity in the preservation of signals from biomass/metabolic processes (C, N, P, BIO-TRACE elements, As), allochthonous mineralogical particulate inputs (Al, BIO-TRACE elements), and precipitation of primary minerals (silica) from the hydrothermal water (Ga). Although recent work suggests that the elemental compositions of cellular components of biocumuli may be similar to the biomass of other microbial communities (Neveu et al., 2016), separating and removing the input and impact of soil particulates as “contamination” neglects a significant fraction of major and trace element sources for the biocumulus samples, and it ignores the potential for biocumulus to act as an effective recorder of the geochemical environment driven by the intimate interactions and relationships between cellular biomass, EPS, primary mineral precipitates, and allochthonous particulates.
To represent the patterns observed in Yellowstone sites in this study, a conceptual model highlighting the sources of elements, sequestration of these elements, and then retention through earliest diagenesis is shown in Fig. 13. Breakdown of local rock and input of C, N, and P from local biota contributes to forming soils (Fig. 13, Step 1). Soils and hot spring water then serve as primary sources of elements, with hot spring water continuously bathing growing biocumulus with elements and physical transport mechanisms (wind, precipitation impact, runoff transport) delivering soil particulates (as well as direct and indirect biota inputs) to adhere to the inherently sticky biocumulus EPS (Figs. 4 and 13, Step 2). Biocumulus accumulate/sequester elements while building structures (e.g., mats, filaments, stromatolites), becoming increasingly silica enriched with time (Fig. 13, Step 3). Complete infilling with silica (often associated with loss of hydrothermal input due to avulsion of outflow channels and/or changes in hot spring water output) drives the transition from biocumulus to siliceous sinter, initiating the loss of BIO and BIO-TRACE elements associated with the biomass/EPS (Fig. 13, Step 4). Total loss of hot spring water input completes breakdown and loss of dead hydrothermal microbial community, further driving loss of BIO and BIO-TRACE elements, with retention of Ga and As incorporated within the silica precipitate (Fig. 13, Step 5). Silica that co-precipitated with microbial structures potentially preserve physical features (Fig. 13, insets for Step 5). Better constraining and connecting co-preservation of geochemical signatures with microbially produced micro- and macroscopic morphological features in modern settings will help to better interpret the rock record on Earth. If geochemical signatures can be fully characterized and quantified, there is greater potential for determining biogenicity in rocks where morphological features may have been lost through diagenetic processes.
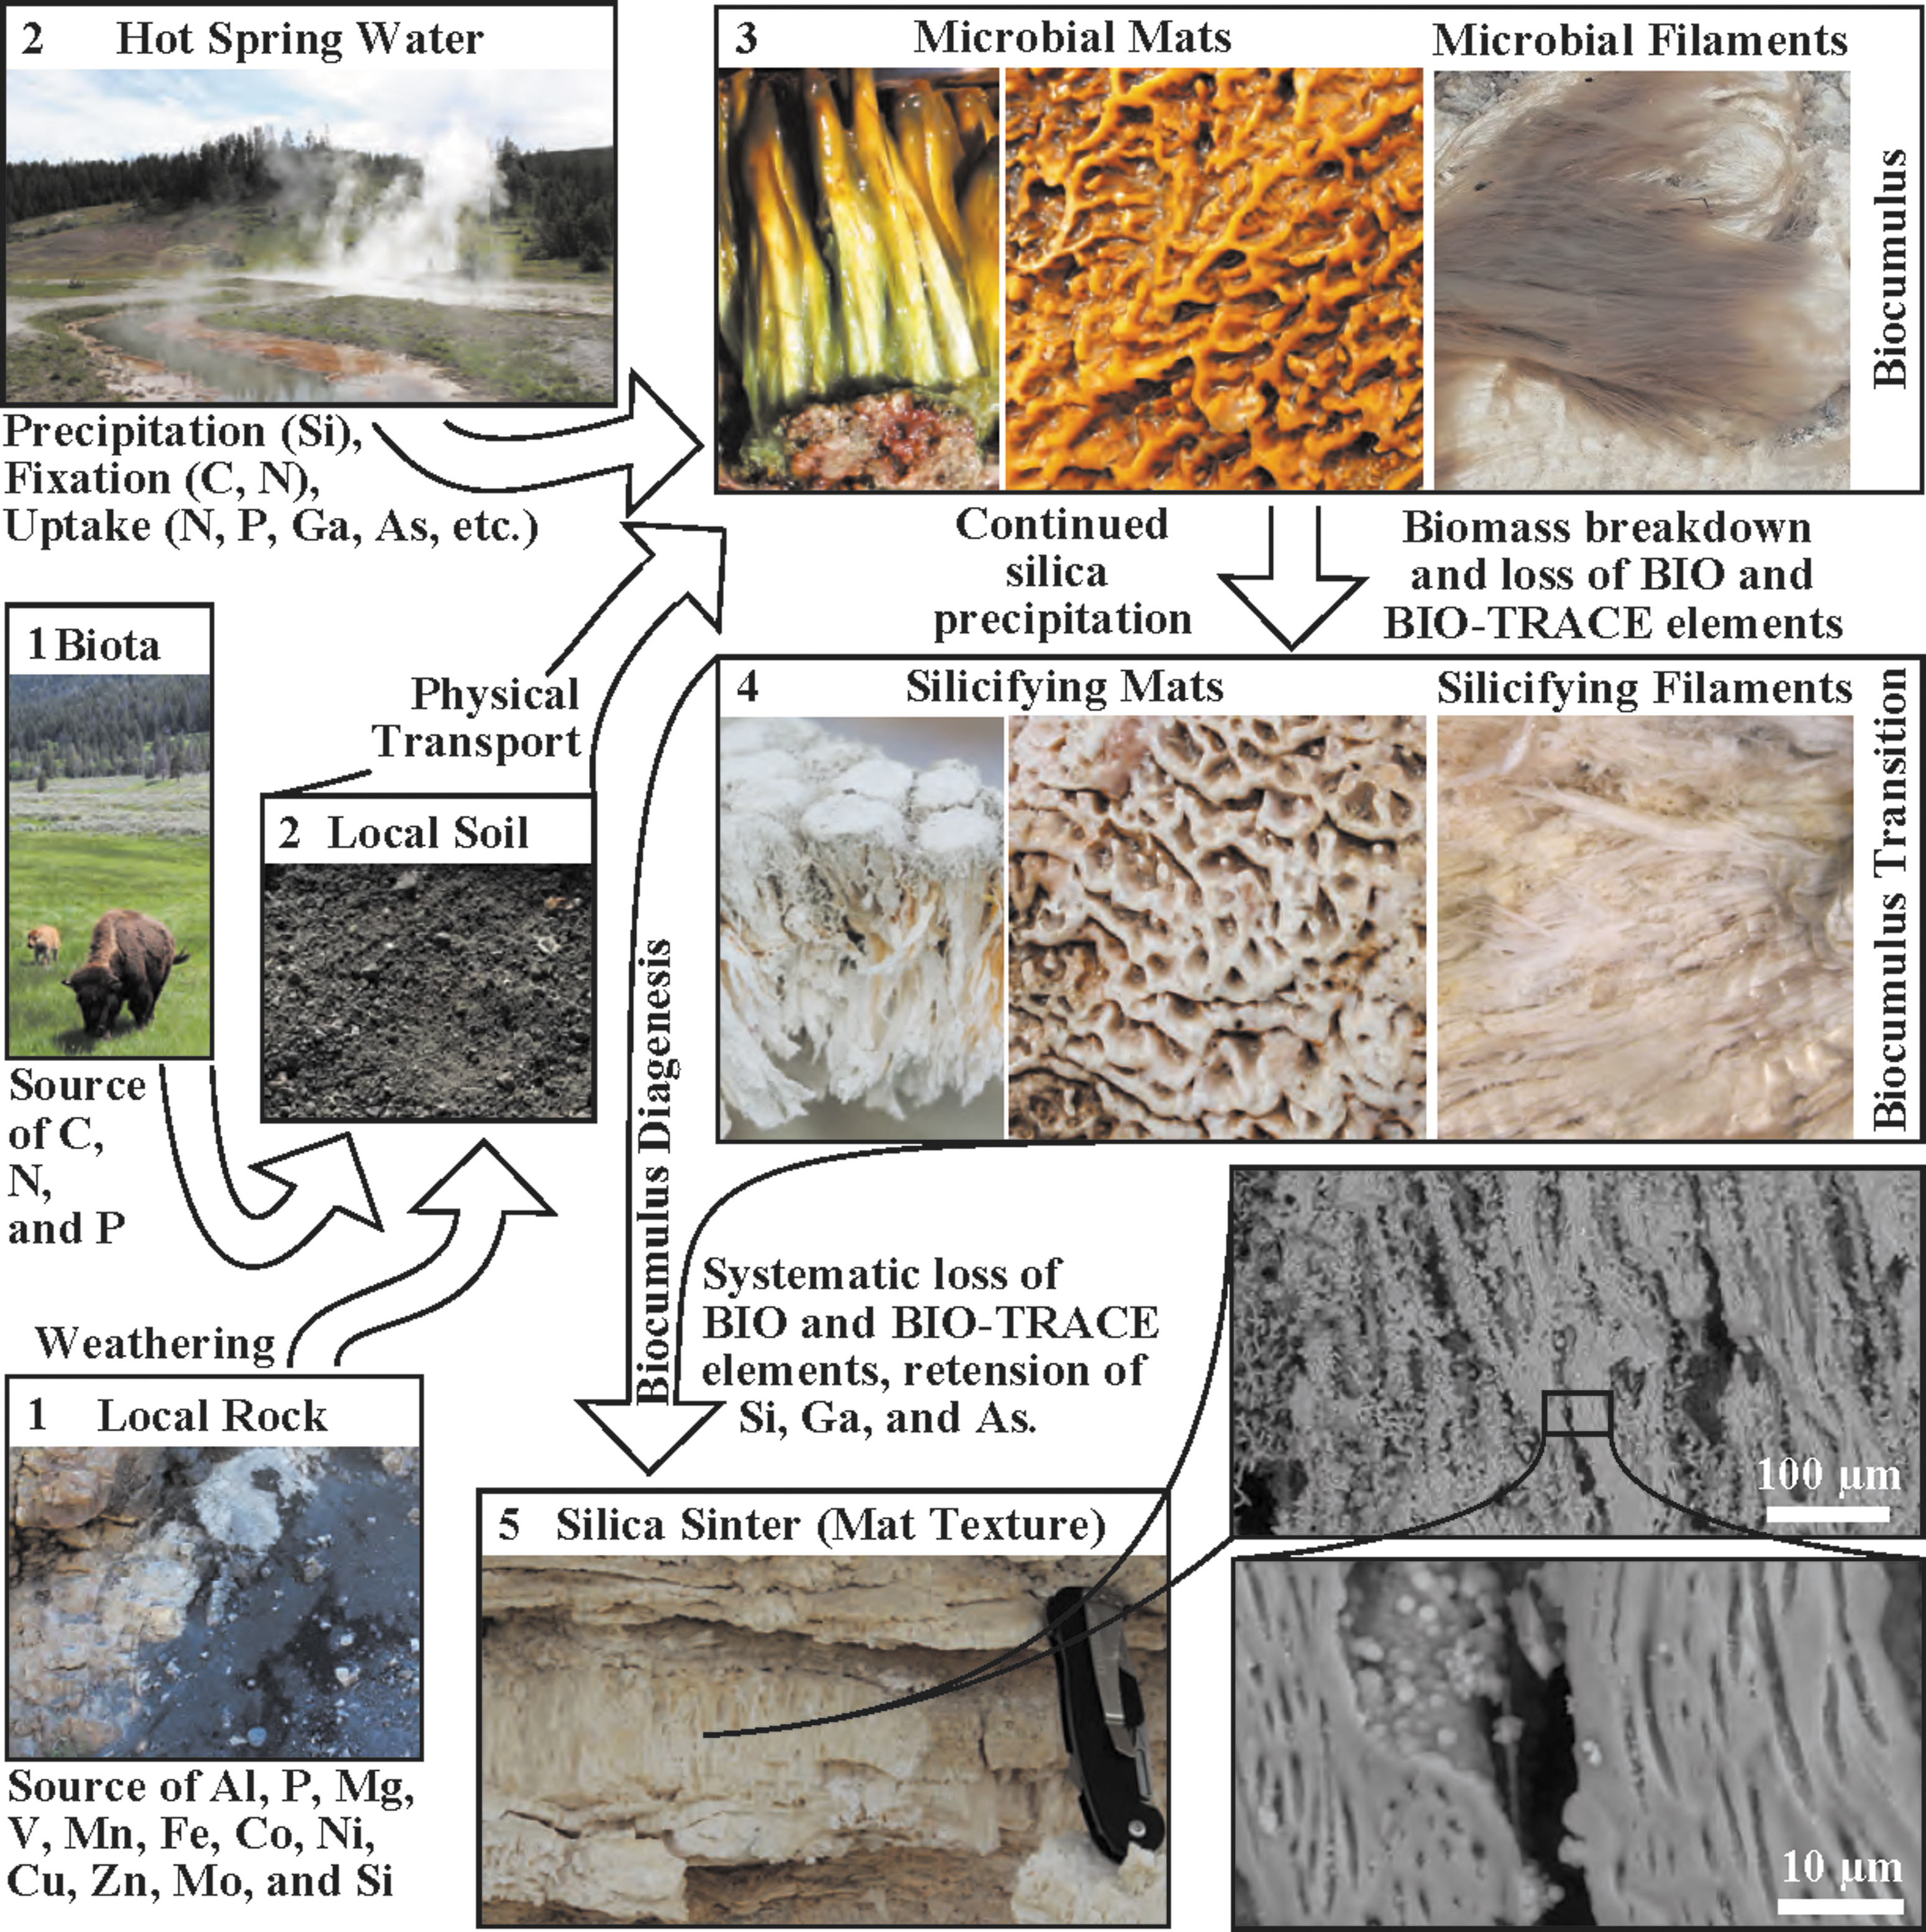
Conceptual model for flow of elements into hot spring biocumulus systems and retention/loss through diagenesis to silica sinter.
6. Summary and Concluding Remarks
Hot spring elemental concentrations are linked to subsurface processes that can lead to phase separation and varying inputs of liquid phase and vapor phase components, producing a varied geochemical landscape. In places where there is minimal subsurface boiling, the composition of the deep hydrothermal source water is preserved, generating hot springs with relatively uniform geochemical profiles. Where subsurface boiling occurs, some elements are elevated in vapor-phase dominated hot springs where low pH values leach elements from local sources (e.g., Al, P, Mg, V, Mn Fe, Co, Ni, Cu, Zn, and DOC), or are transported with the vapor phase [e.g., NH4(T)]. Others are enriched in the residual liquid phase during phase separation (e.g., Li, As, Mo, and DIC). The composition of biocumulus (microbial constructs composed of cellular biomass, EPS, allochthonous material, precipitated minerals, etc.) in silica saturated hot springs is primarily composed of silica, with trace elements controlled primarily by inputs of allochthonous soil particulates derived from the local rock. Despite differences in hot spring elemental composition between MPS systems and phase separation dominant systems, biocumulus compositions are nearly identical in C, N, and P content, and they are relatively similar with respect to biologically relevant trace elements, though phase separation biocumulus tends to be more enriched in BIO-TRACE elements (Mg, V, Mn, Fe, Co, Ni, Cu, Zn, Mo). The transition from biocumulus to sinter is heralded by a loss of biomass (as C, N, and P), and an accompanying loss in the biologically non-essential element Al as well as all BIO-TRACE elements. Trace element loss appears to behave in a systematic fashion, raising hope for the transfer of a trace element biosignature as well as environmental signature into the rock record. Retention of Ga and As in both MPS and phase separation sites through the transition from biocumulus to siliceous sinter suggests that these elements may hold particular interest for providing a novel biosignature.
This work raises many new and interesting questions to be explored: Does high element content biocumulus translate to high element content sinter? Is the range of biocumulus and sinter values reflective of age/diagenesis? How are elements delivered via soil particulates incorporated into biocumulus? What of the signal that is preserved as silica sinter can survive in the rock record for long periods of time? Answers to these questions can be found through continued work in hydrothermal systems and by replicating natural systems in laboratory settings to gain better control of variables. Future work constraining variables that may influence the accumulation and sequestration of elements would allow for more focused statistical analyses of the type of data presented in this work. These variables include, but are not limited to, microbial community composition and changes with time, the age of the biocumulus, hot spring geochemical fluctuations over time, hot spring temperature fluctuations over time, intra- and inter-hot spring physical and geochemical differences, flow rates, positive versus negative relief of hot springs, time of year of sampling, time from most recent thunderstorms, storm frequency during the development of the biocumulus, and local aeolian deposition rates.
Footnotes
Acknowledgments
J.R.H. would like to thank Panjai Prapaipong, Gordon Moore, and Natalia Zolotova for their help in early technique development; Everett Shock for discussions, guidance, and support; and Elizabeth Lundstrom for assistance with analyses. The authors would like to acknowledge the exhaustive work of three reviewers, which greatly improved this article. The authors would like to acknowledge the hard work of the USGS in sampling and analyzing data from Yellowstone hot springs, especially R. McCleskey, R. Chiu, D. Nordstrom, K. Campbell, D. Roth, J. Ball, and T. Plowman. The authors also greatly appreciate the Yellowstone Permitting Office for their support, especially Annie Carlson and Eric Oberg, and all research was conducted under Yellowstone Research Permit YELL-(2016 to 2019)-SCI-7020. The authors would like to acknowledge that the research conducted for this work was done in Yellowstone National Park, which was created from land stolen from multiple Native American Nations, especially the Tukudeka (as well as other Shoshone-Bannock and Eastern Shoshone peoples) forcibly relocated to the Fort Hall and Wind River Reservations) and Apsáalooke (Crow) forcibly relocated to the Crow Reservation. These acts were done in part through the guise of Article 2 of the 1868 Fort Bridger Treaty and Article 2 of the 1868 Treaty of Fort Laramie Treaty with the Crow. The authors support efforts to give the lands encompassing YNP back to the native peoples who call it home.
Author Disclosure Statement
The authors have no competing financial interests that exist regarding the material and content of this article.
Funding Information
J.R.H. would like to acknowledge financial support from PSARC at Penn State, and the University of Minnesota. T.L.H. would like to acknowledge financial support from the University of Minnesota and NASA Exobiology award number 80NSSC20K0614.
Supplementary Material
Supplementary Figure S1
Supplementary Figure S2
Supplementary Table S1
Supplementary Table S2
Abbreviations Used
References
Supplementary Material
Please find the following supplemental material available below.
For Open Access articles published under a Creative Commons License, all supplemental material carries the same license as the article it is associated with.
For non-Open Access articles published, all supplemental material carries a non-exclusive license, and permission requests for re-use of supplemental material or any part of supplemental material shall be sent directly to the copyright owner as specified in the copyright notice associated with the article.