
Abstract
Life in spaceflight demonstrates remarkable acclimation processes within the specialized habitats of vehicles subjected to the myriad of unique environmental issues associated with orbital trajectories. To examine the response processes that occur in plants in space, leaves and roots from Arabidopsis (Arabidopsis thaliana) seedlings from three GFP reporter lines that were grown from seed for 12 days on the International Space Station and preserved on orbit in RNAlater were returned to Earth and analyzed by using iTRAQ broad-scale proteomics procedures. Using stringent criteria, we identified over 1500 proteins, which included 1167 leaf proteins and 1150 root proteins we were able to accurately quantify. Quantification revealed 256 leaf proteins and 358 root proteins that showed statistically significant differential abundance in the spaceflight samples compared to ground controls, with few proteins differentially regulated in common between leaves and roots. This indicates that there are measurable proteomics responses to spaceflight and that the responses are organ-specific. These proteomics data were compared with transcriptome data from similar spaceflight samples, showing that there is a positive but limited relationship between transcriptome and proteome regulation of the overall spaceflight responses of plants. These results are discussed in terms of emergence understanding of plant responses to spaceflight particularly with regard to cell wall remodeling, as well as in the context of deriving multiple omics data sets from a single on-orbit preservation and operations approach. Key Words: Space biology—Proteomics—Gene expression—ISS. Astrobiology 15, 32–56.
1. Introduction
P
However, studies approaching plant adaptation to spaceflight at the level of the proteome have been limited. To date, the only true proteomic-scale study of plants in space has been a label-free analysis of membrane proteins isolated from Arabidopsis seedlings grown on the International Space Station (ISS) (Mazars et al., 2014). The distribution of differentially abundant proteins among three treatments (microgravity of the ISS, a 1g orbital centrifuge, and a 1g ground control) highlights familiar pathways in gravity signal transduction. Many of the membrane-associated proteins involved in auxin signaling cascades were less prominent in microgravity-grown plants, while many proteins typically associated with stress responses were more abundant. While there is not a one-to-one correlation with any gene set from a published spaceflight transcriptome, similar trends in the differential expression of genes important to auxin metabolism, and to a variety of stress responses, can be seen in the transcription profiles from several studies (see citations above). A proteomic survey in terrestrial altered-gravity environments also revealed a host of general stress proteins as well as those associated with auxin signaling (Tan et al., 2011). Although there is little specific overlap with transcriptome studies of plants exposed to similar environments, many of the trends in pathways affected by spaceflight are similar among the studies (Moseyko et al., 2002; Tan et al., 2011). With increased technical sensitivity and better access to space, the spaceflight responses contribute to a comprehensive picture of the strategies used by plants to cope with changes in their environment.
Comparative proteomics mass spectrometry (MS) methods can be used to reveal quantitative changes in the protein complement of cells and organs over a large scale between and among samples. The use of iTRAQ (isotope tags for relative and absolute quantification; Applied Biosystems) allows for quantitative comparisons of samples by labeling lysine residues and N-termini of peptides with mass reporter molecules, such that the samples can be combined into simultaneous analyses by MS. The relative amounts of every identified peptide from each sample are simultaneously revealed within the tandem mass spectra through the relative intensity of the differentially labeled ion peaks, enabling each peptide to be correlated to each sample through the mass of the reporter molecules. Several papers have demonstrated the effectiveness of iTRAQ analysis of Arabidopsis samples in the study of broad-scale proteomic changes (Zhao et al., 2010; Alvarez et al., 2011; Schenck et al., 2013; Li et al., 2014).
The major scientific goal of this study was to discover proteomics changes that characterize the physiological adaptation of Arabidopsis to the spaceflight environment. To accomplish this goal, we sought to examine proteomics changes on an organ-specific level by comparing the proteomics of roots and leaves between plants grown in space and plants grown on Earth. The samples were from Arabidopsis seedlings from three green fluorescent protein (GFP) lines that were germinated on the ISS and grown for 12 days before being preserved in the strong protein denaturant RNAlater and then frozen. The nature of these samples, having been preserved in RNAlater primarily for gene expression analyses, necessitated the development of methods for protein extraction from RNAlater samples and the processing of small amounts of proteins through iTRAQ and MS analyses. Therefore, the secondary and technical goal of this study was to examine proteomics based on samples from this preservation method, which is widely used in ISS spaceflight biology research, to discern whether this form of preservation could enable broad-scale proteomics of spaceflight samples. The resulting data demonstrate the technical success of the approach and show significant spaceflight-induced proteomic changes that were different between roots and leaves. These proteomics data are discussed in the context of adaptive physiologies in space and are also discussed in relation to gene expression changes that have been seen in similar plants in space.
2. Materials and Methods
2.1. Plant growth and harvest on the ISS
The data presented here are from plants harvested during one of several experiments launched to the ISS on STS-129, November 16, 2009 (specifically, Run 1B: 12/3/2009–12/15/2009), and returned on STS-130, February 8, 2010. Arabidopsis seeds were planted aseptically on the surface of 10 cm2 solid media plates (Paul et al., 2004). The samples come from a collection of three Arabidopsis lines. The three GFP [green fluorescent protein (Sheen et al., 1995)] reporter gene lines were Adh::GFP [alcohol dehydrogenase promoter (Manak et al., 2002)]; DR5r::GFP [synthetic auxin response element composed of five AuxRE elements; gift of T. Guilfoyle (Ulmasov et al., 1997)]; and 35s::GFP [driven by the CaMV35s promoter (Manak et al., 2002)]. Seeds and seeded plates were prepared in such a way as to maintain dormancy in light-tight coverings until the initiation of the experiment on orbit (Paul et al., 2012a). The plated seeds remained dormant until activated by exposure to light on the ISS, which initiated germination. Both the flight plates and ground control plates were grown in the Advanced Biological Research System, ABRS (NASA, 2011a; Paul et al., 2012a, 2013). The ABRS provided temperature control, light control, and circulation of air that was scrubbed to remove volatile organic compounds. On orbit, the dormant seeded plates were unwrapped from their coverings and installed in the GFP Imaging System (GIS) (Fig. 1A), which was then inserted into the ABRS. The GIS held the plates within the ABRS, facilitated access by the astronaut on orbit, and provided regular imaging (NASA, 2011b; Paul et al., 2012a). After growth, all plates were photographed by the crew (Fig. 1B), along with the comparable GIS/ABRS-grown ground control (Fig. 1C). The plates were then harvested on orbit to RNAlater-filled Kennedy Space Center Fixation Tubes (KFTs) (Fig. 1D and 1E) and then stowed below −80°C in the MELFI freezer on the ISS (Ferl et al., 2011) before return. The ground control plates were similarly housed in the GIS of an ABRS in the Orbital Environmental Simulator chamber in the Spaceflight Life Sciences Laboratory at Kennedy Space Center following a similar, but delayed, timeline as the plates on the ISS, with the use of environmental data such as temperature, relative humidity, light levels, and CO2 concentrations as was experienced by the plants on orbit. Further details on the operational outlines can be found in Paul et al. (2012a, 2013). The ground control samples received the same physical processing steps of harvest, freezing, thawing, and distribution in the laboratory as did the spaceflight samples.
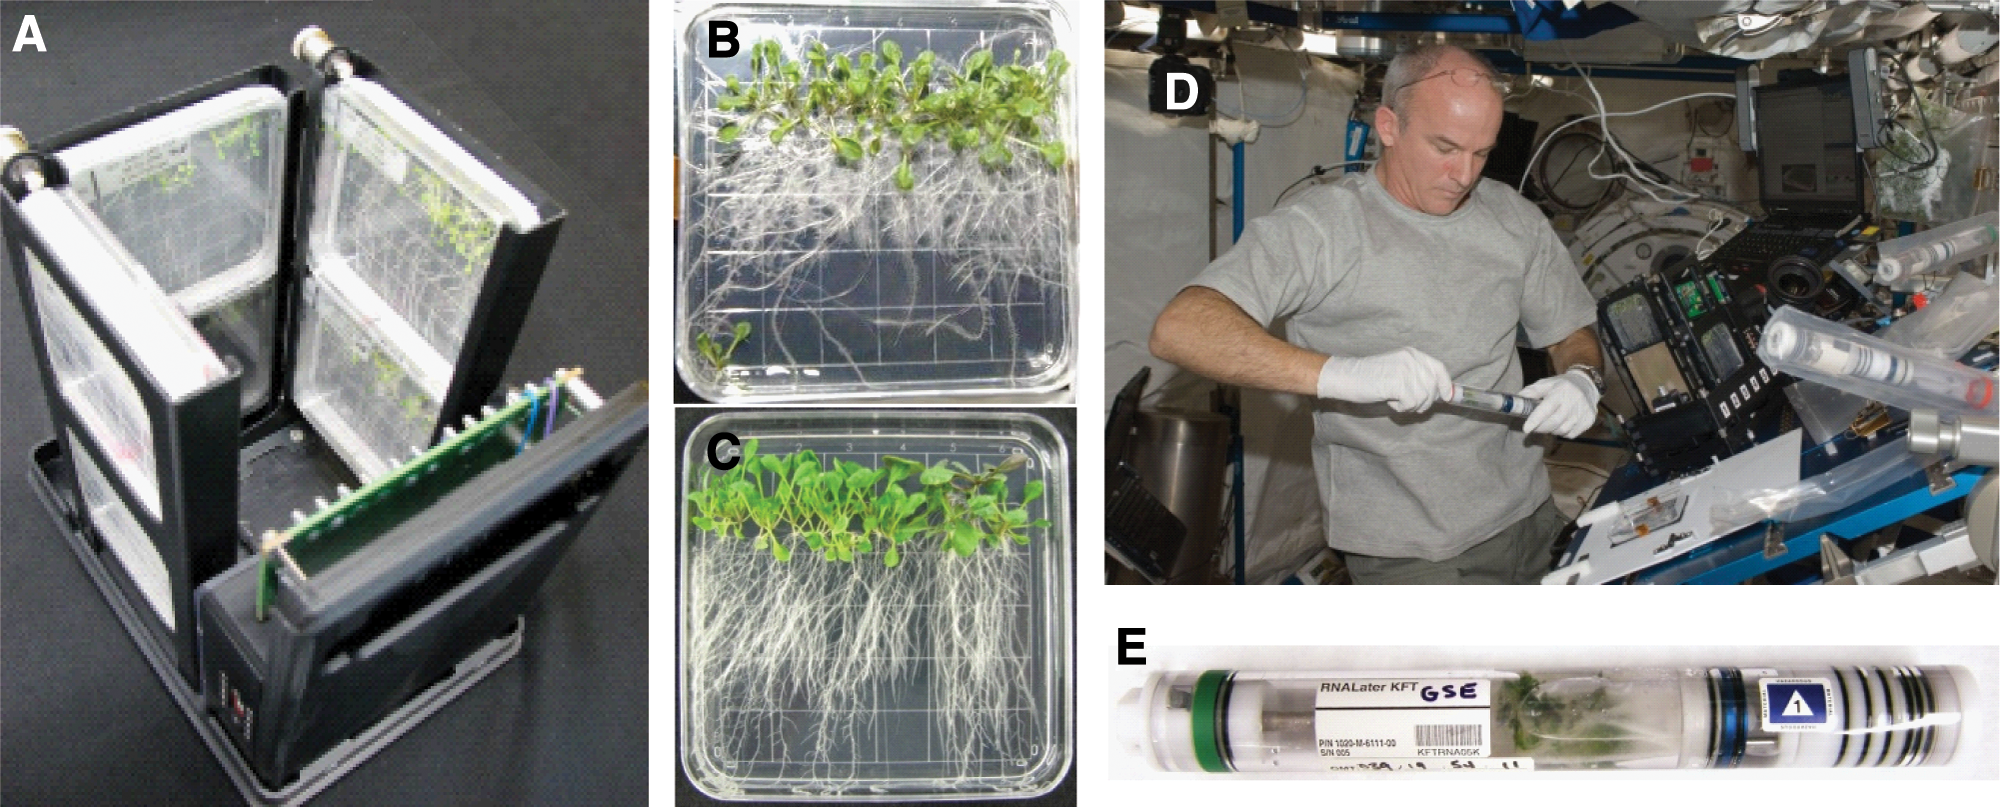
Plant growth, hardware, harvesting, and preservation in RNAlater on the ISS. The Petri plates within which the plants were grown were housed in the GIS unit of the ABRS (
2.2. Isolation of proteins from RNAlater-preserved Arabidopsis
The 12-day-old plants recovered from the frozen KFTs of both flight and ground control plants were thawed then dissected into roots, hypocotyls, and leaves, similar to the dissections performed by Paul et al. (2013). Approximately half the root material from 6–7 seedlings within a single Petri plate constituted each of three biological replicates for analysis of root proteins. For each replicate, 80 mg of RNAlater-fixed Arabidopsis root material was blotted with tissue to remove excess RNAlater and then ground in a liquid nitrogen–chilled pestle and mortar with 400 μL protein extraction buffer per sample [100 mM sodium phosphate (pH 7), 2 mM EDTA, 25 mM NaF, 5 mM MgCl2, 150 mM NaCl, 0.1% triton-X100, 10% glycerol, 1 mM dithiothreitol], commercial cocktails of protease (Set VI, Calbiochem) and phosphatase (Set I, Calbiochem) inhibitors. Samples were ground until completely homogeneous and then centrifuged at 13,000 rpm for 10 min at 4°C. The supernatant containing buffer-soluble proteins was collected, and proteins were purified as described by Koh et al. (2012). The leaf sample from flight and ground control plants was similarly prepared from half the material of a single Petri plate, constituting the leaves from seven plants. Protein assays were performed to quantify purified proteins by using the Pierce BCA Protein Assay Kit (Thermo Scientific, Rockford, IL, USA) with the SoftMax Pro Software v5.3 (Molecular Devices, Downingtown, PA, USA) under the SpectraMax M5 (Molecular Devices).
2.3. Protein digestion, iTRAQ labeling, and MS
For each sample (three replicate root samples and the single leaf sample for the flight and ground controls), 16 μg of the recovered proteins were reduced, alkylated, trypsin-digested, and labeled according to the manufacturer's instructions (AB Sciex Inc.). The three biological replicates of ground root samples were labeled with iTRAQ tags 113, 114, and 115, and those of flight root samples were labeled with 116, 117, and 118, respectively. The ground shoot sample was labeled with iTRAQ tag 119, while the flight shoot was labeled with 121. The combined labeled peptide mixtures were desalted with C18-solid phase extraction and dissolved in strong cation exchange solvent A [25% (v/v) acetonitrile, 10 mM ammonium formate, and 0.1% (v/v) formic acid (pH 2.8)]. The peptides were fractionated by an Agilent HPLC system 1260 with a polysulfoethyl A column (2.1×100 mm, 5 μm, 300 Å; PolyLC, Columbia, MD, USA) with a flow rate of 200 μL/min. Peptides were eluted with a linear gradient of 0–20% solvent B [25% (v/v) acetonitrile and 500 mM ammonium formate (pH 6.8)] over 50 min followed by ramping up to 100% solvent B in 5 min. Fourteen fractions were collected by monitoring the absorbance at 280 nm and lyophilized (Supplementary Fig. S1; supplementary data are available online at
A quadrupole-time-of-flight LTQ Orbitrap XL MS/MS system (Thermo Fisher Scientific, Bremen, Germany) was used for data acquisition as described previously (Makarov et al., 2006). It was interfaced with an Eksigent nano-LC AS2 system (Eksigent Technologies, Dublin, CA, USA) using high-energy collision dissociation. Each fraction was loaded onto an Agilent Zorbax 300SB-C18 trap column (0.3 mm i.d.×5 mm length, 5 μm particle size) with a flow rate of 5 μL/min for 10 min. Reversed-phase C18 chromatographic separation of peptides was carried out on a pre-packed BetaBasic C18 PicoFrit column (75 μm i.d.×10 cm length, New Objective, Woburn, MA, USA) at 300 nL/min with the following gradient: 5% B for 1 min as an equilibration status; 60% B for 99 min as a gradient; 90% B for 5 min as a washing status; 5% B for 10 min as an equilibration status (solvent A: 0.1% formic acid in 97% water, 3% acetonitrile; solvent B: 0.1% formic acid in 97% acetonitrile, 3% water).
2.4. Proteomics analyses
The MS/MS data were processed by a thorough search considering biological modification and amino acid substitution against the non-redundant uniprot Arabidopsis thaliana database (53,270 entries downloaded on June 14, 2014, at
The proteomics data are available for public access at the PRIDE Archive–proteomics data repository (
2.5. Comparison of proteomic data with microarray data
The proteomics data were compared with a previous gene expression study (Paul et al., 2013), which involved plants from the same experiment series on the ISS. In this comparison, we included 480 genes determined to be differentially expressed at the transcript level from that study and 546 differentially expressed proteins from this study. Among them, 34 genes exhibited differential expression at both transcript and protein levels. To examine the degree of concordance between transcript and protein expression levels for those commonly differentially expressed genes, correlation tests for which Pearson's r and Spearman's rho (r s) were used were conducted for a direct comparison of proteins and their corresponding transcript expression levels of those 34 genes using log2-fold change between ground and flight tissues. Those genes or proteins not differentially expressed at both the protein and transcript levels were not included in the correlation analysis.
2.6. Network analysis
The differentially abundant proteins were examined for cell wall associations by using SUBA3 searches (Tanz et al., 2013). The proteins returned with cell wall associations from SUBA3 were analyzed for interaction networking with GeneMANIA (Warde-Farley et al., 2010) with the Co-localization, Physical interactions, and Shared protein domains options, and Gene Ontology–based weighting.
3. Results
3.1. Protein recovery and identification in spaceflight material
RNAlater is widely used as an RNA preservative, primarily because it is a strong protein denaturant. Proteins can be recovered from RNAlater-preserved materials (van Eijsden et al., 2013), but because the tissues and proteins are denatured, the biological properties of the subcellular components or proteins were not used to pre-separate proteins into classes such as soluble, cytoplasmic, membrane, or cell wall proteins. Therefore, the proteins identified in this study are simply considered soluble proteins according to the protocol used for their extraction. Sufficient protein was recovered from each sample to proceed with iTRAQ methods. Over 1500 proteins were identified in the root and leaf samples at a global FDR of 5% against the decoy database, and over 1300 proteins in each sample at an FDR of 1% (see Supplementary Fig. S2). An FDR of 5% was chosen as the cutoff for further analysis of proteins in this study.
Of the 1570 proteins identified in the samples at 5% FDR, 1167 leaf proteins and 1150 root proteins were identified with three or more protein-unique peptides, thus allowing them to be accurately quantified across the various flight and ground control samples (Fig. 2).
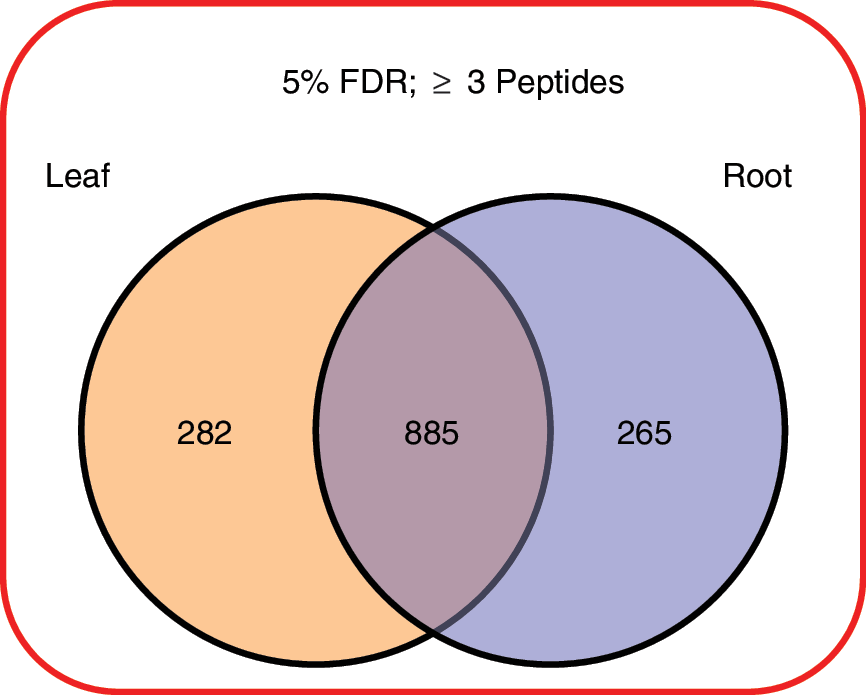
The number of proteins in the leaf and root samples meeting all the criteria for quantitation by iTRAQ. (Color graphics available online at
3.2. Differential protein abundance in spaceflight
A Fisher's test of combined probabilities was used to determine differences in quantitation values for each protein identified with three or more unique peptides. The Fisher's test accounted for the number of peptides identified in each sample, together with the biological replicates of the root samples, to produce a p value for comparison of spaceflight versus ground controls for leaves and roots. Volcano plots of the p values and differential abundance as fold change of the root and leaf samples are presented in Fig. 3. Currently, an iTRAQ method underestimates fold changes, implying small changes may indicate significant differences between samples (Bantscheff et al., 2008; DeSouza et al., 2009; Karp et al., 2010); thus, most iTRAQ studies use fold changes of <0.8 or >1.2. Therefore, proteins were considered differentially abundant with p values greater than the threshold value (α=0.05) and fold-change values in excess of 0.8 and 1.2. Figure 4 shows Venn diagrams of the number of proteins differing in abundance between spaceflight and ground control samples. Of the 1167 leaf proteins and 1150 root proteins that were able to be accurately quantified, 256 leaf proteins and 358 root proteins met the criteria of statistical significance by p value and differential abundance by fold change in the spaceflight samples. Only 41 of the significant differentially abundant proteins were shared between roots and leaves (Fig. 4).
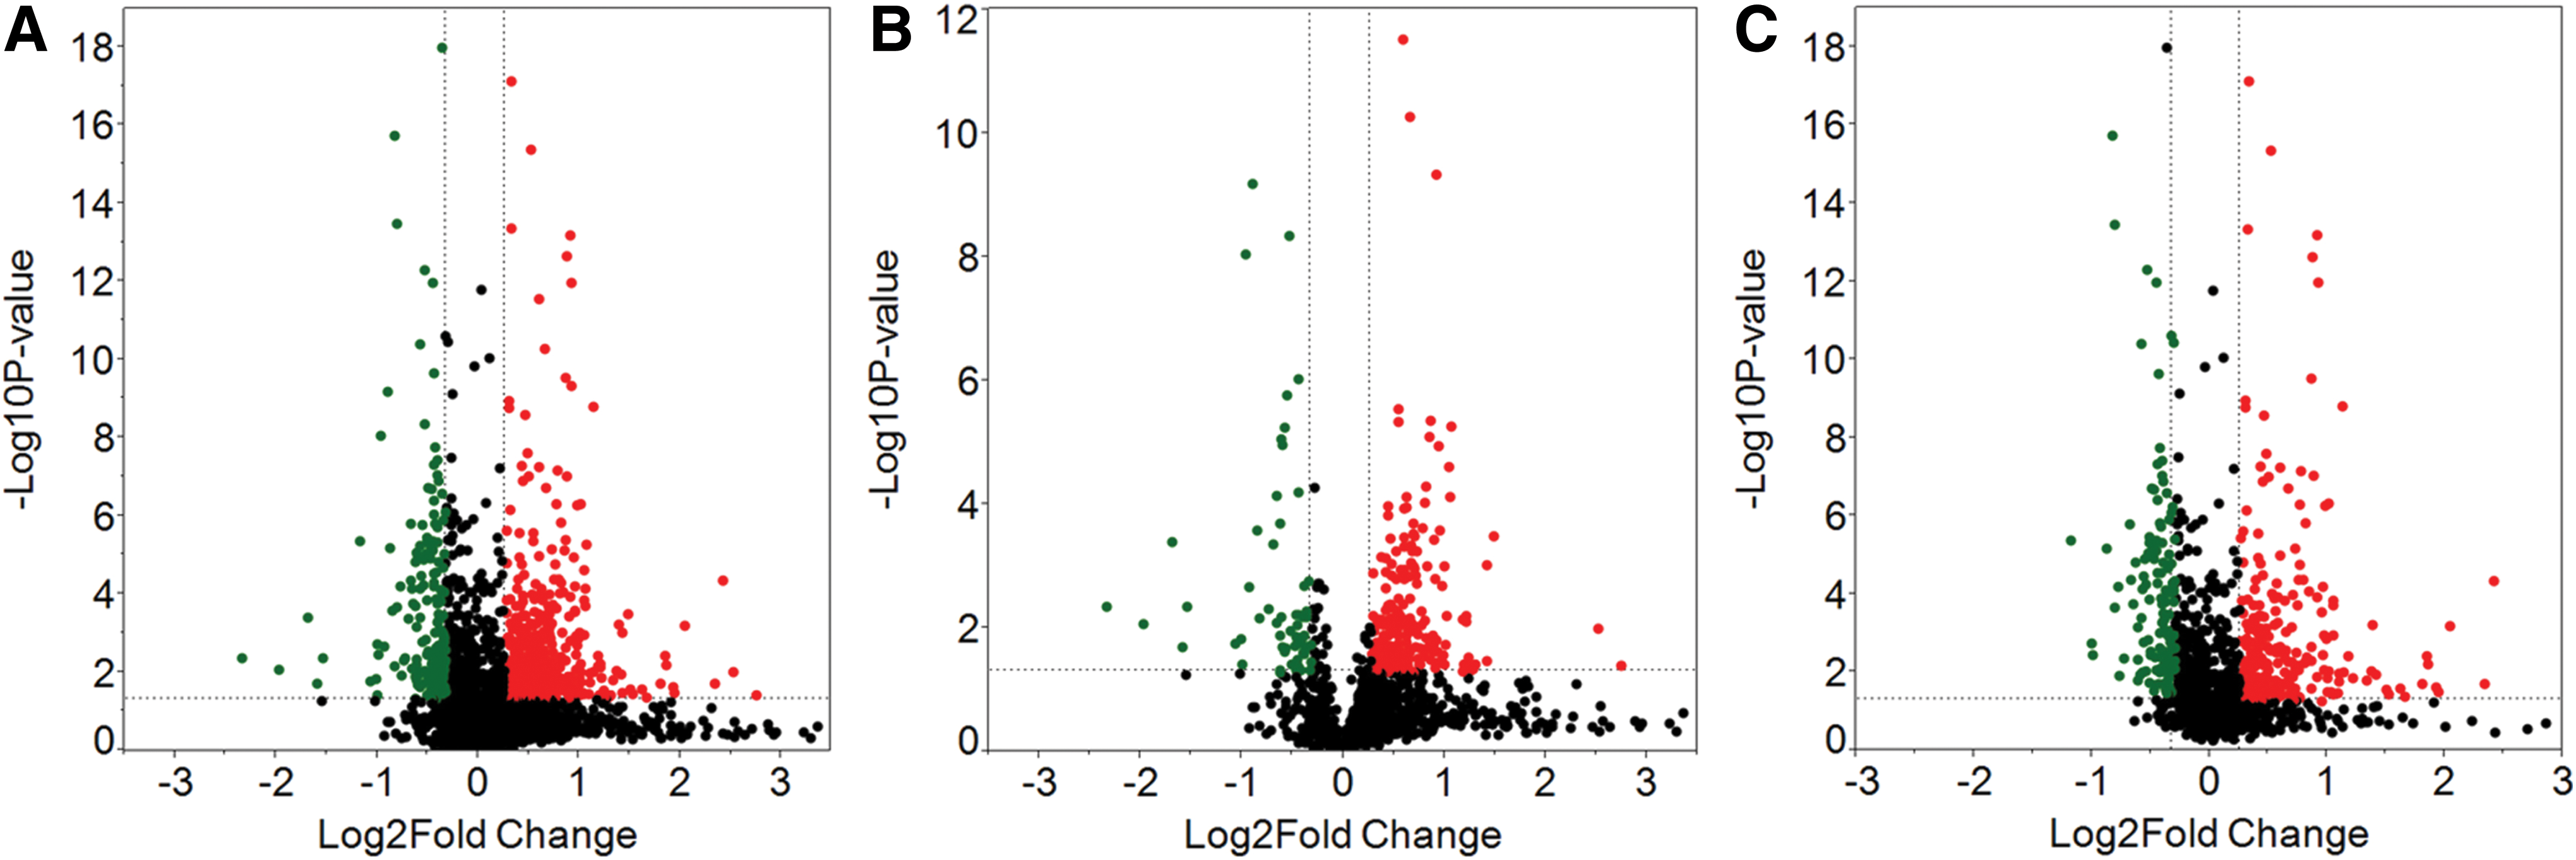
Volcano plots of differential expression between spaceflight and ground tissues. Negative log10 p values were plotted on the y axis with log2 normalized fold change expression levels on the x axis. Significant differential expression with p value threshold values α=0.05 were present in areas exceeding the 0.8 and 1.2 of fold change threshold values. Red and green dots indicate up- and down-regulated protein in flight tissues relative to ground tissues. (
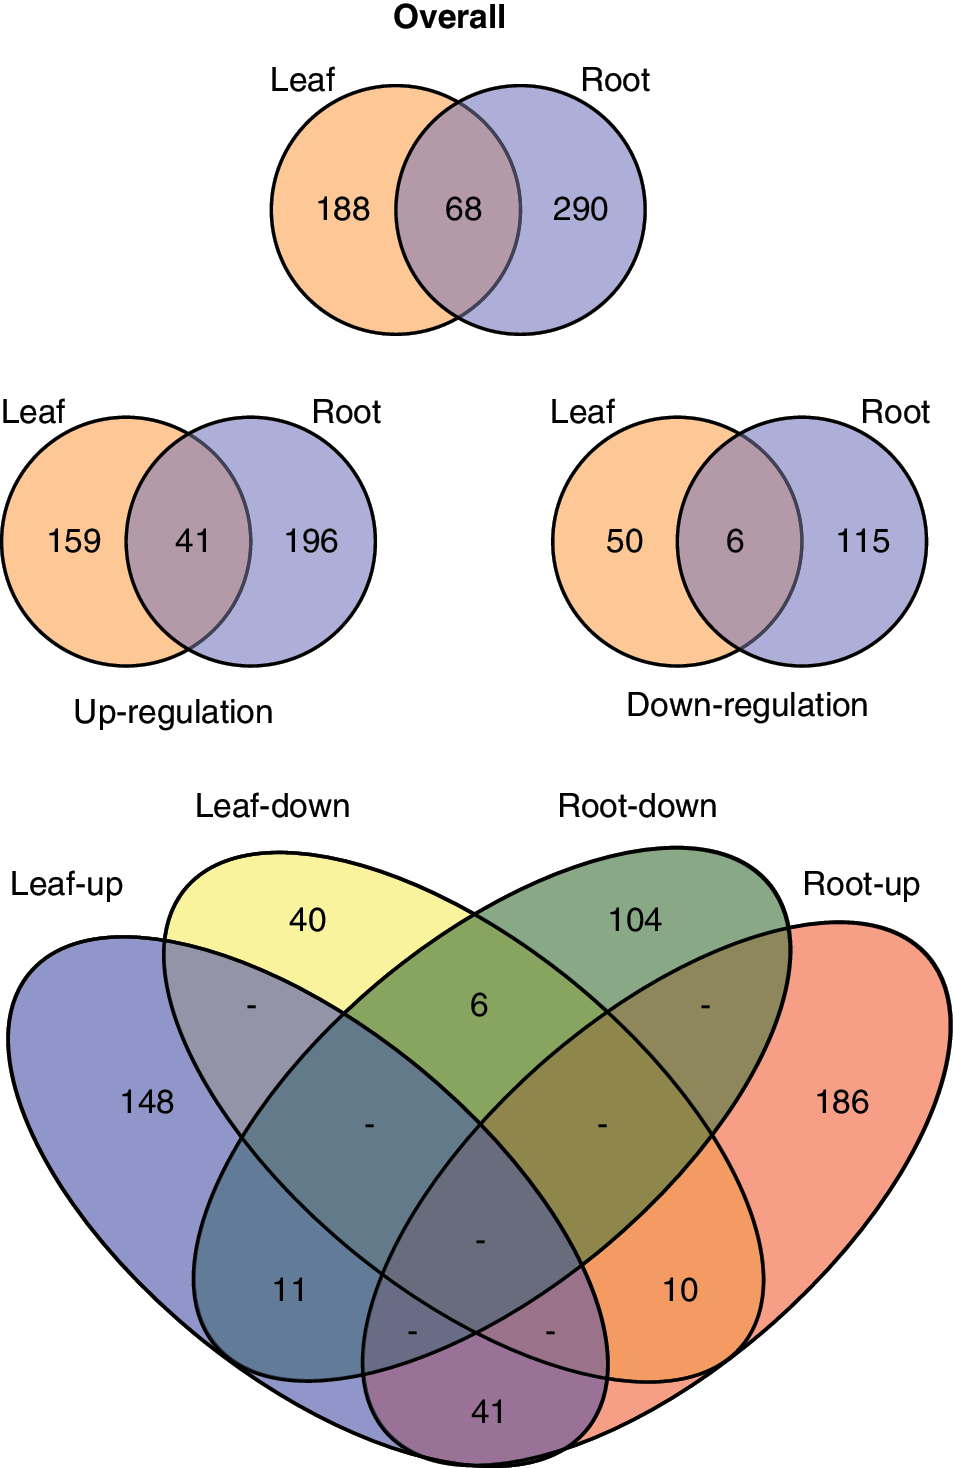
Summary of the differential protein accumulation in spaceflight samples compared to ground control. Overall, 358 root and 256 shoot proteins were differentially represented in the spaceflight sample. When parsed by whether the protein was increased or decreased in spaceflight, 237 root proteins and 200 shoot proteins were up-regulated and accumulated to more abundance in spaceflight, while 121 root proteins and 56 shoot proteins were down-regulated in spaceflight. (Color graphics available online at
In roots, 237 proteins were up-regulated in spaceflight, with an increase in abundance in the spaceflight samples meeting the significance criteria. In those same root samples, 121 proteins were found to be down-regulated and less abundant in spaceflight. For leaves, 200 proteins were more abundant in spaceflight, while 56 were less abundant. Again, few of these differentially regulated proteins were shared between the root and leaf samples. Only 47 proteins were similarly differentially abundant in both roots and leaves in spaceflight, being similarly increased or decreased in both tissues (Fig. 5). There were 21 proteins that were shared between roots and leaves but increased in one tissue and decreased in the other. A summary Venn diagram and table is presented at the bottom of Fig. 4.
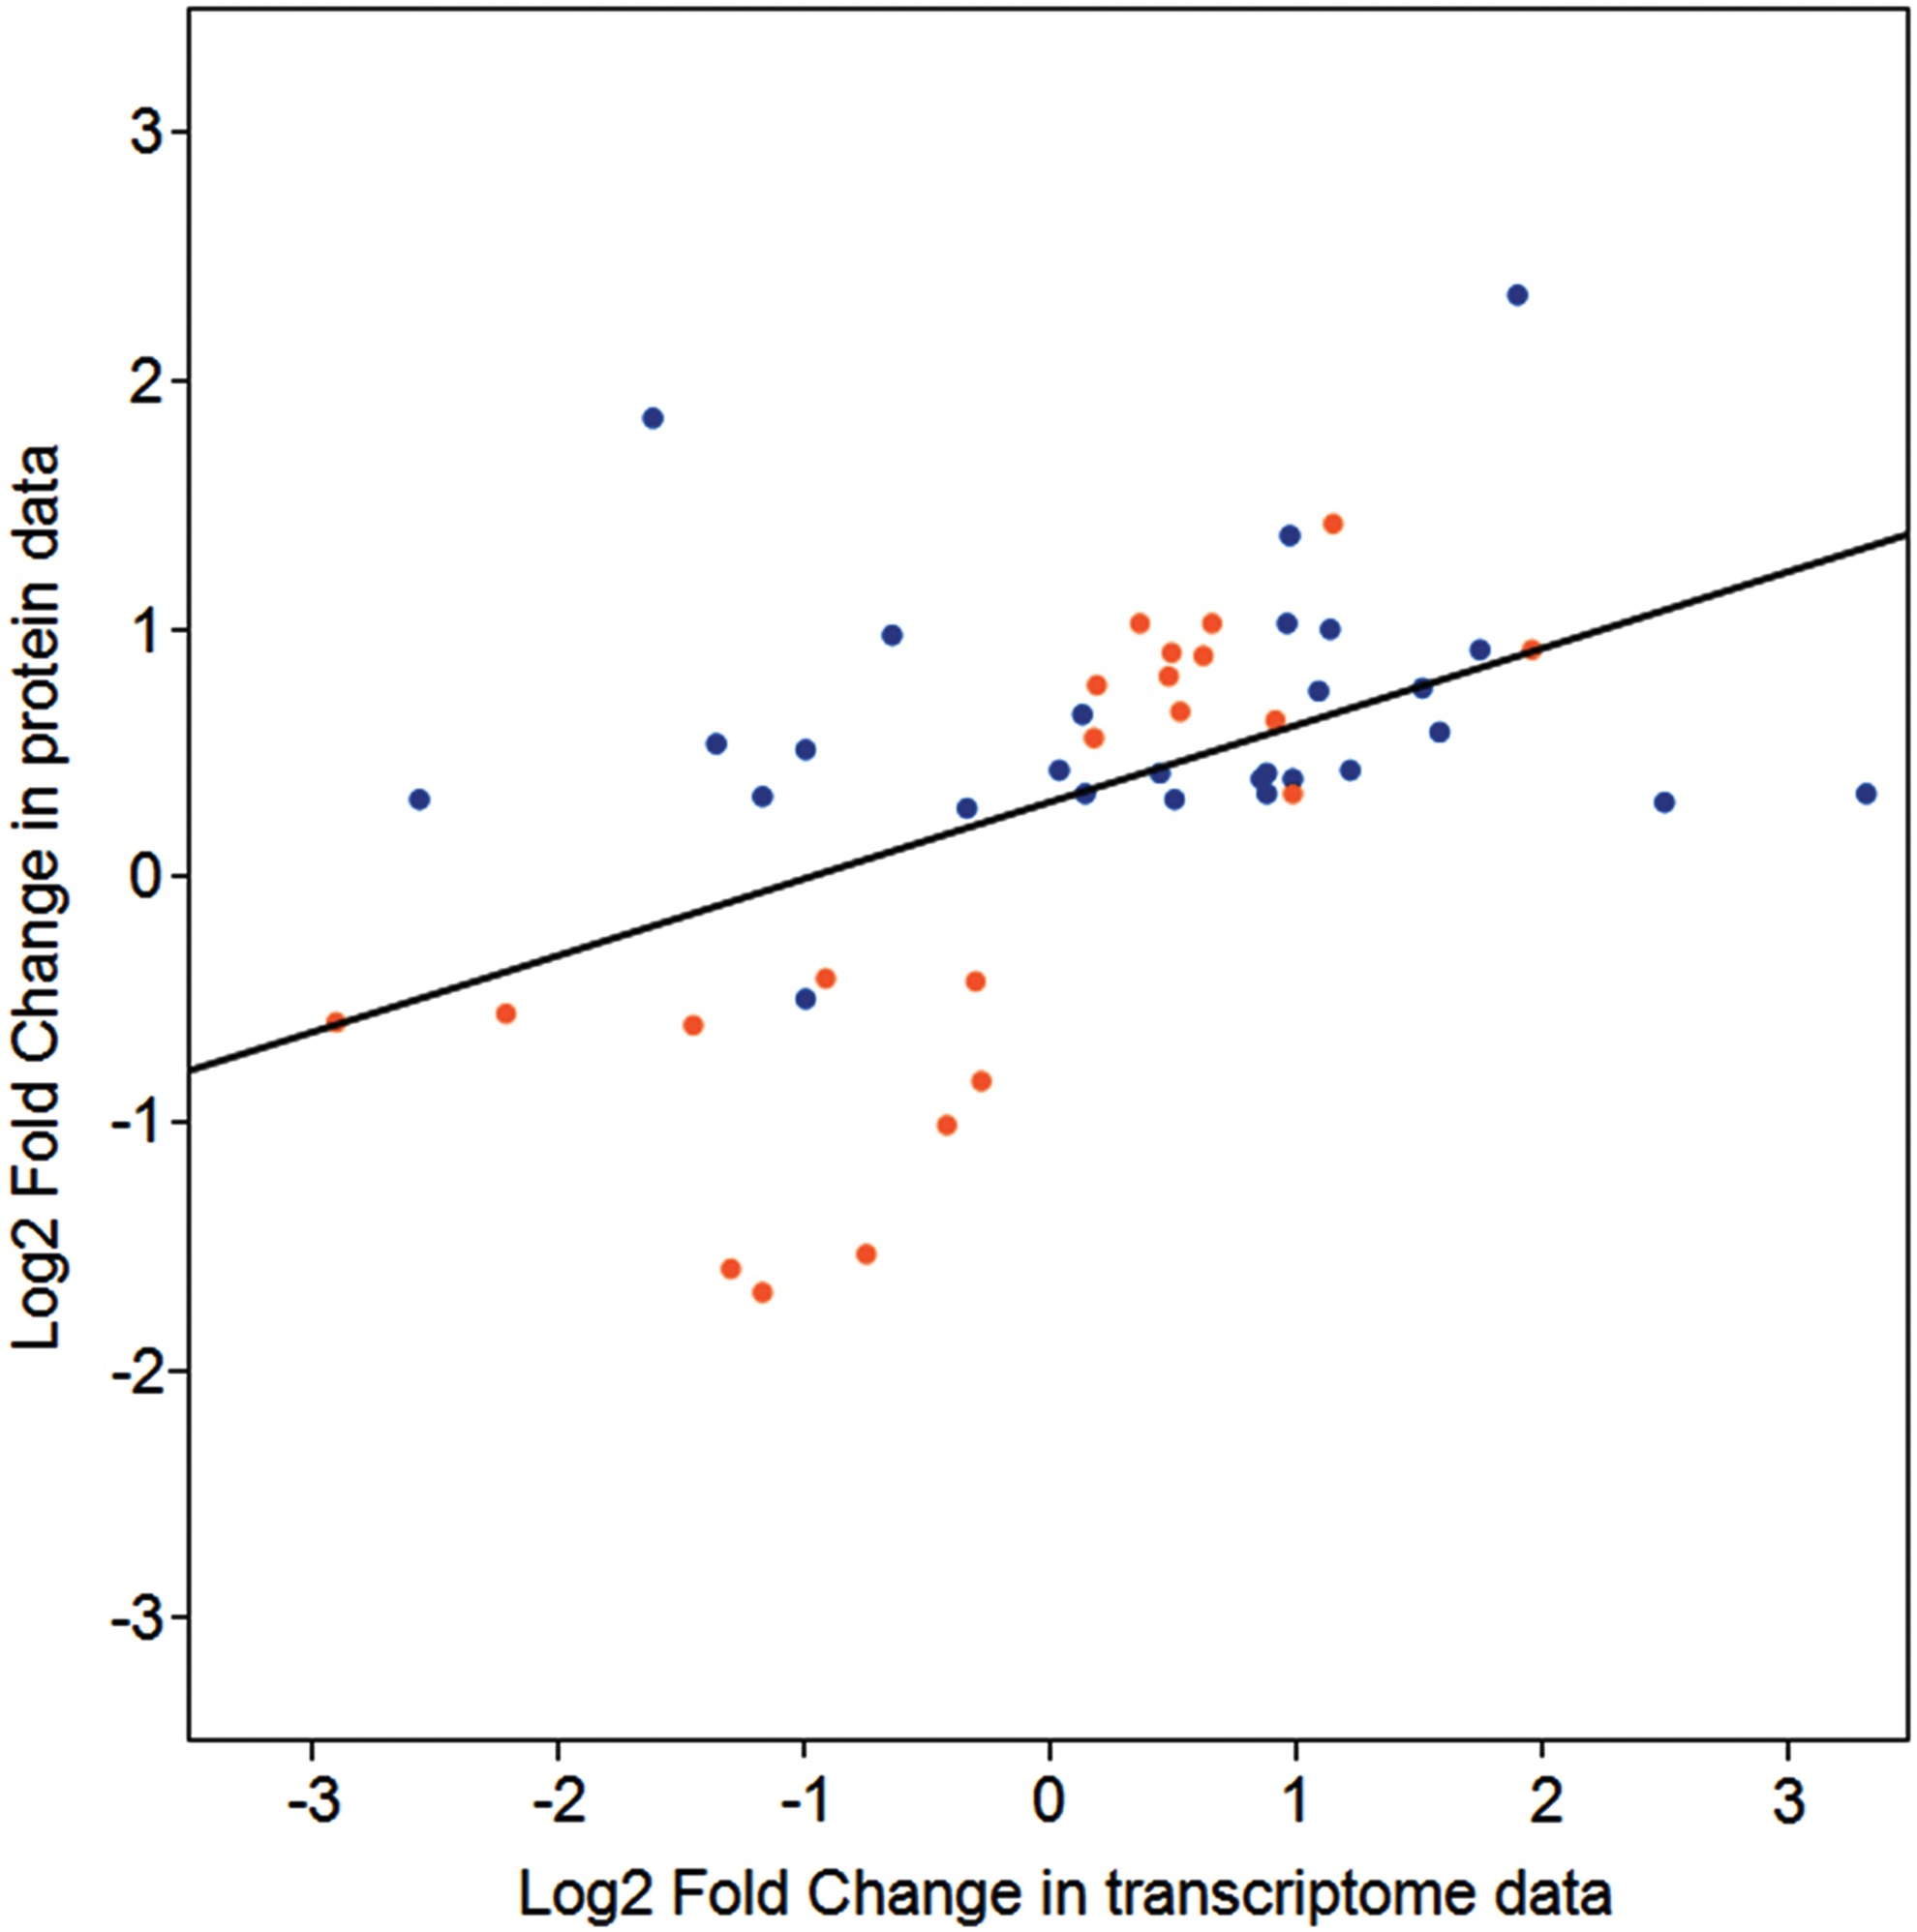
Comparison of gene and protein expression. Comparison of expression ratios from transcriptomic (x axis) and proteomic (y axis) profiling. Orange and blue dots indicate data from leaves and root tissue, respectively. (Color graphics available online at
The 546 proteins that exhibited different abundances between spaceflight samples and the ground control samples are presented in Table 1.
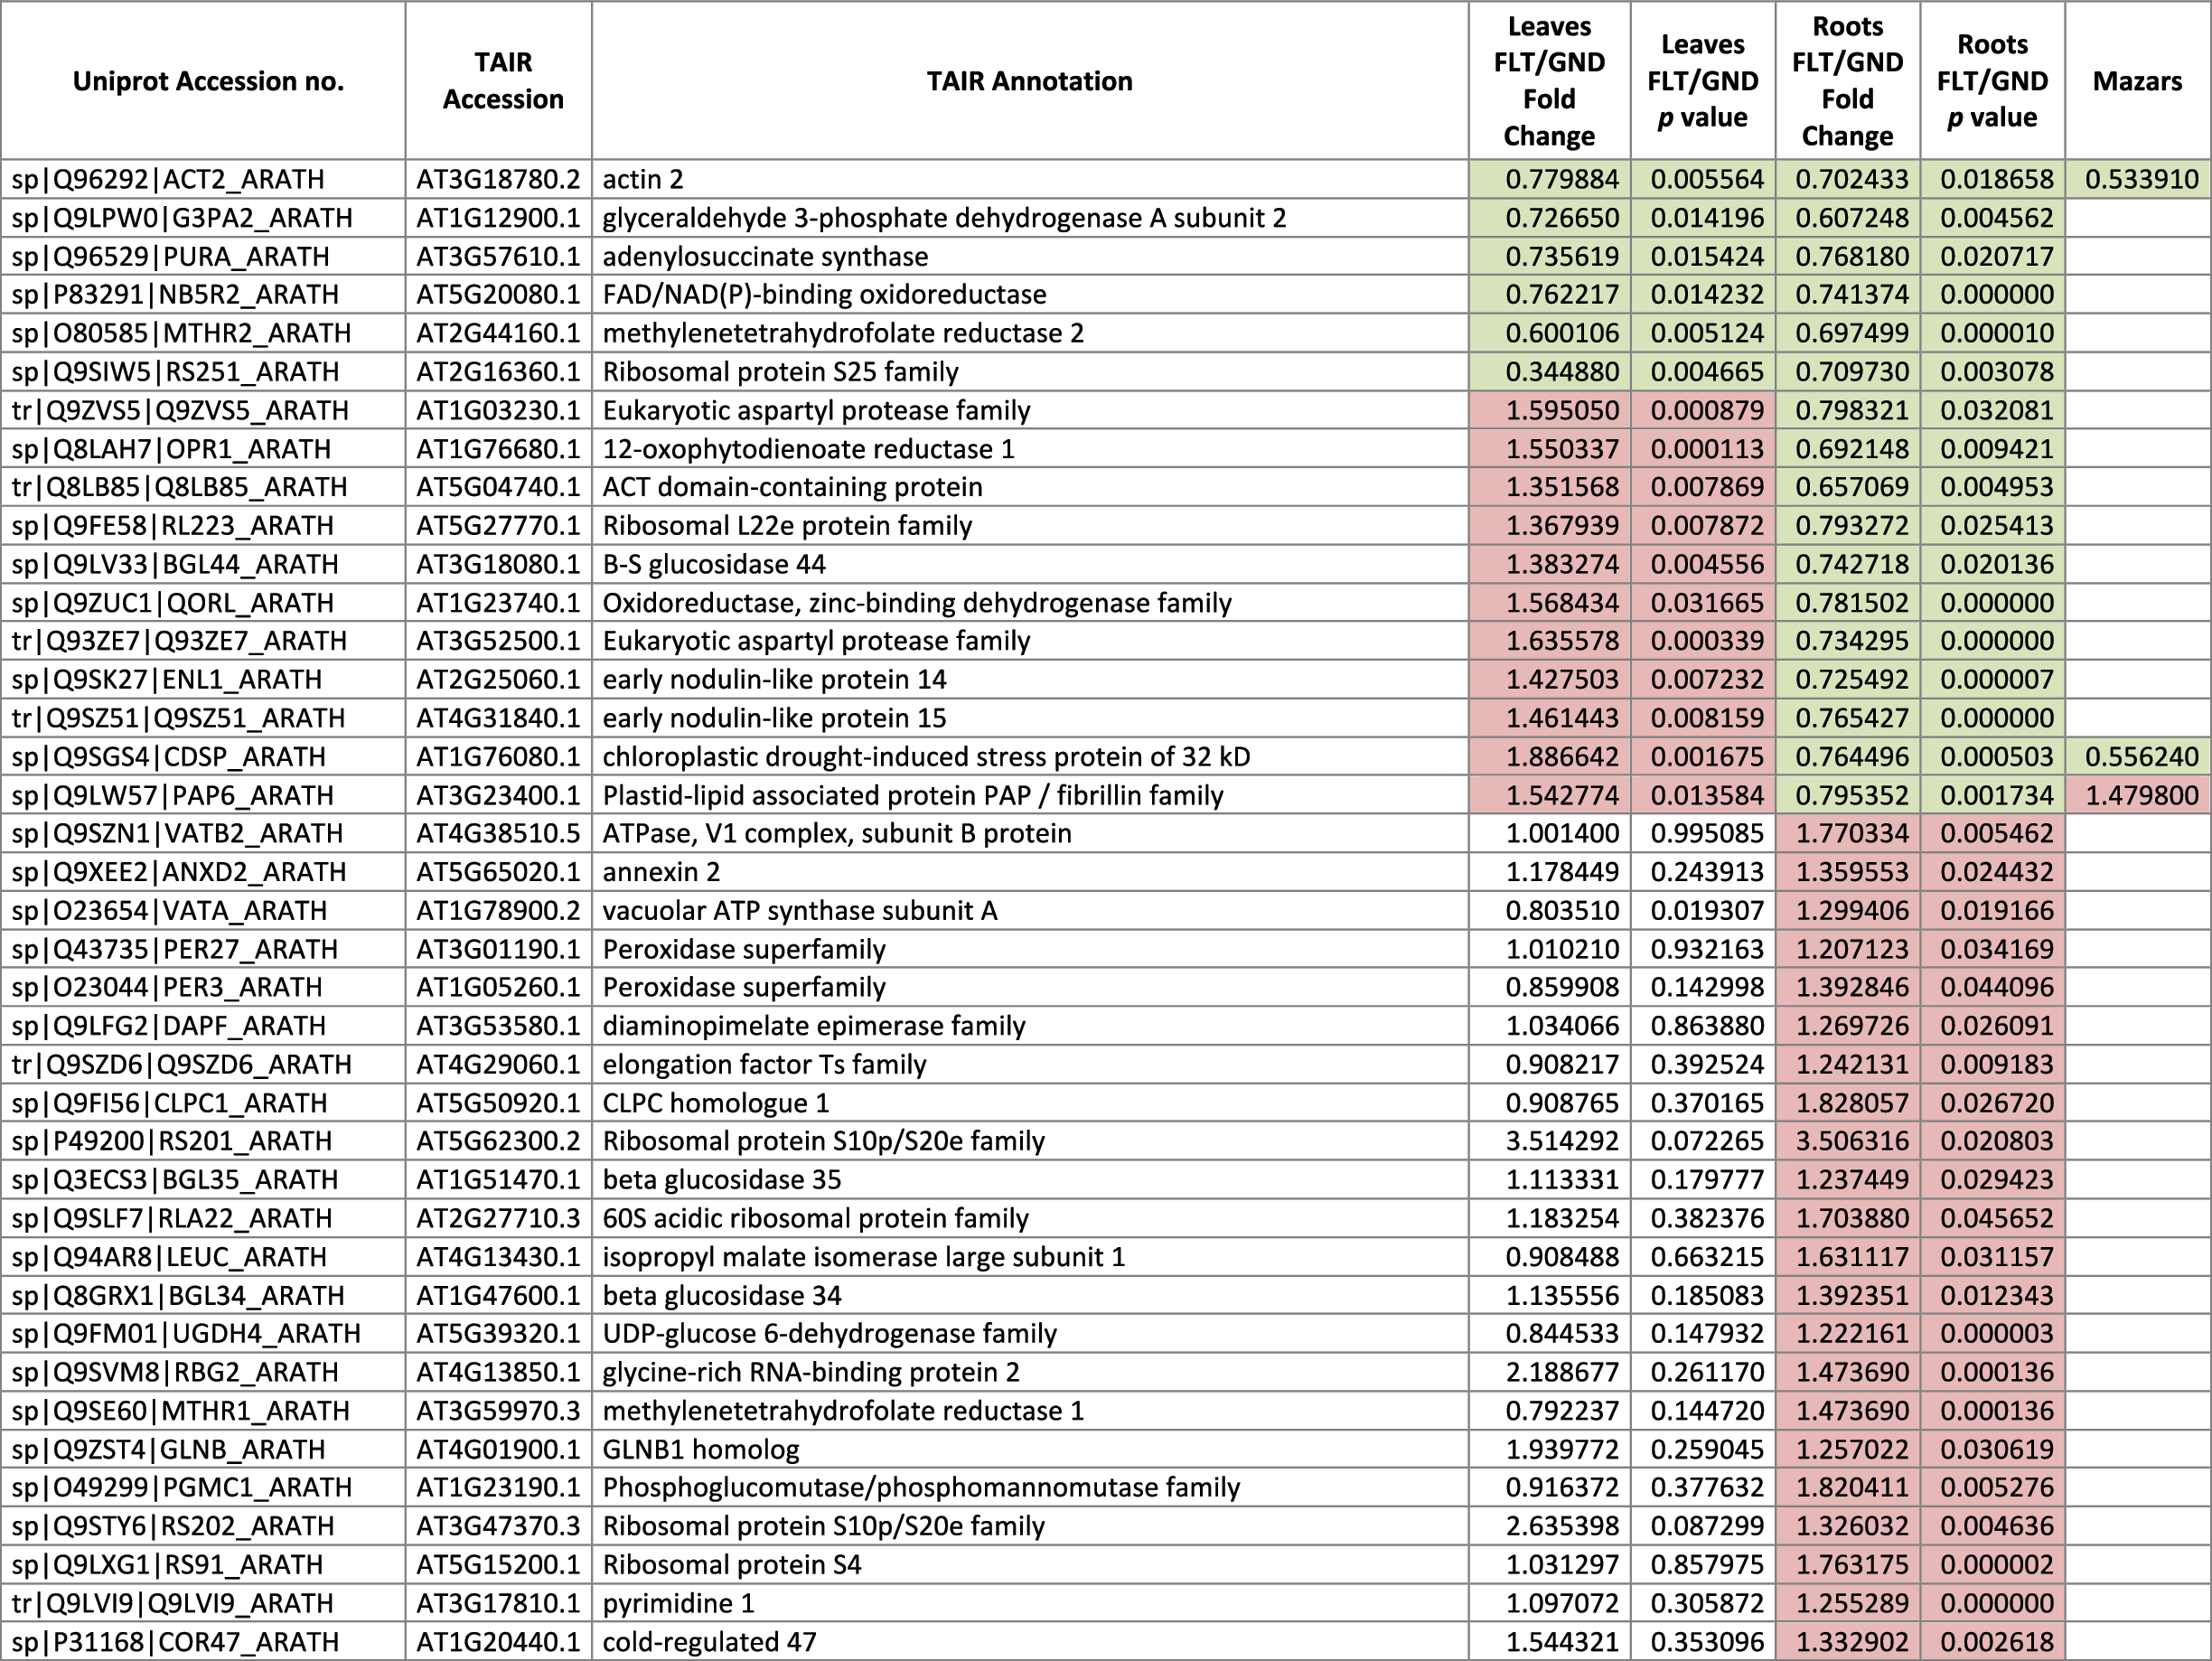
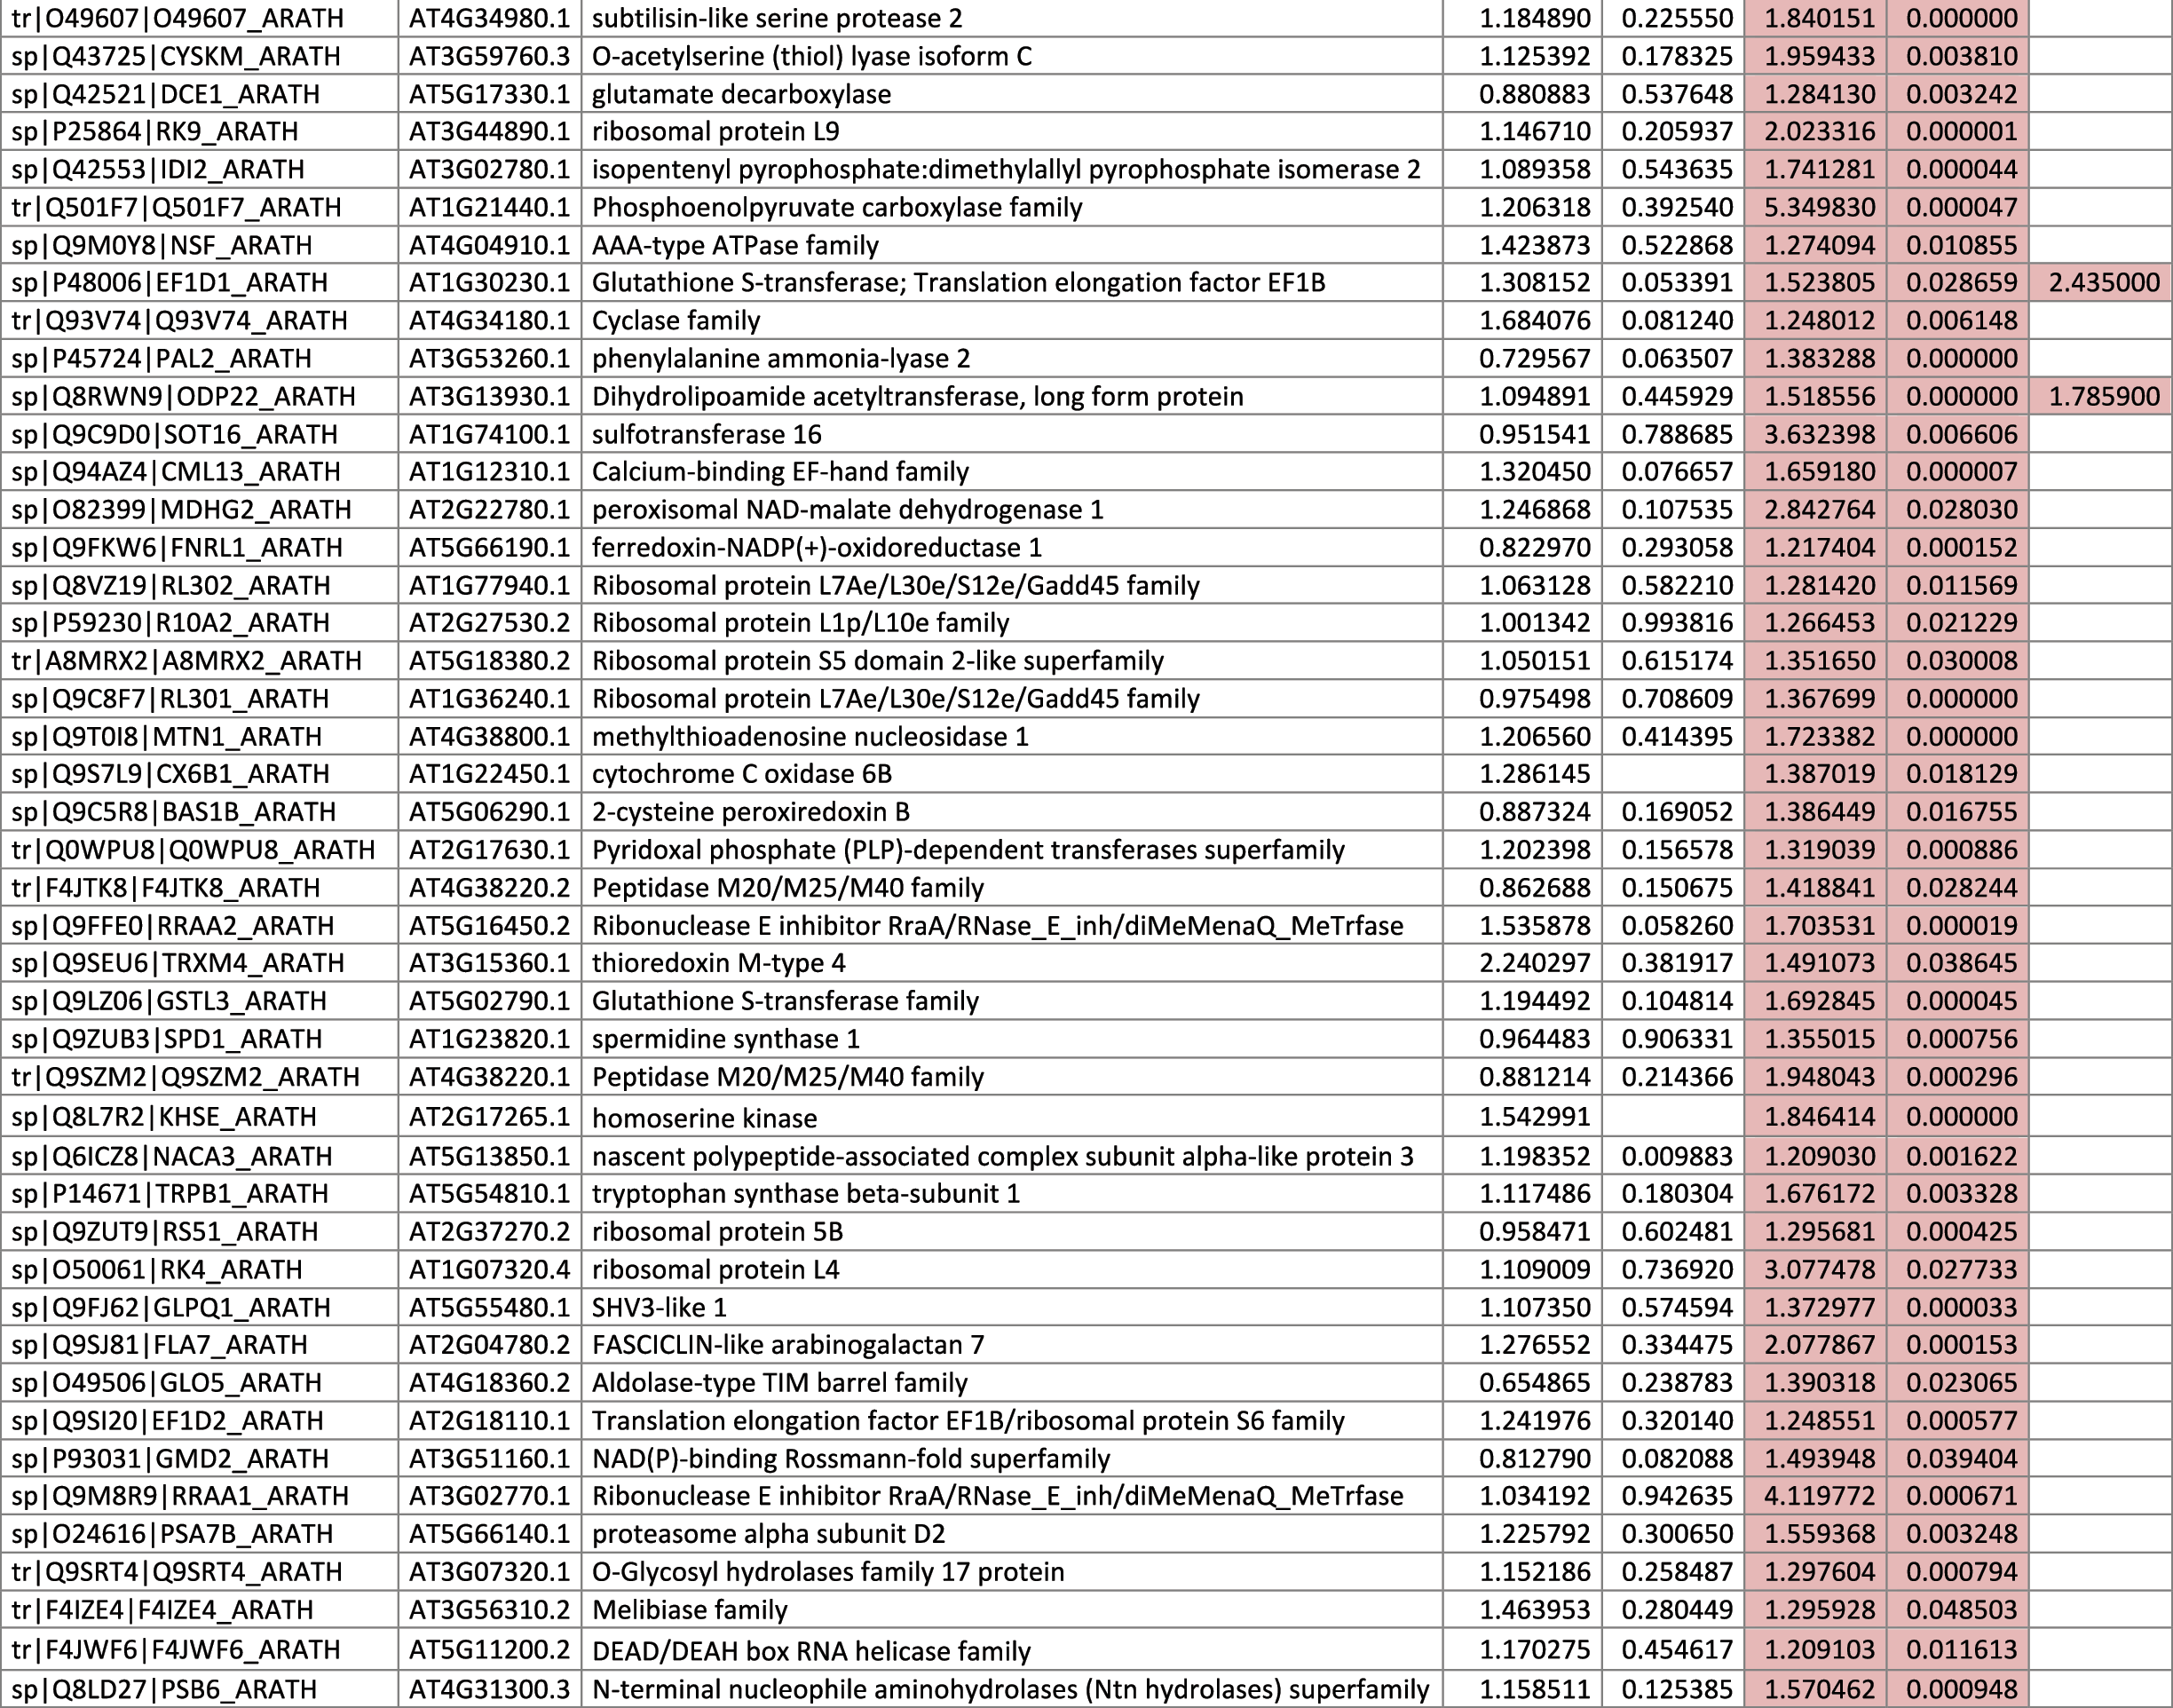
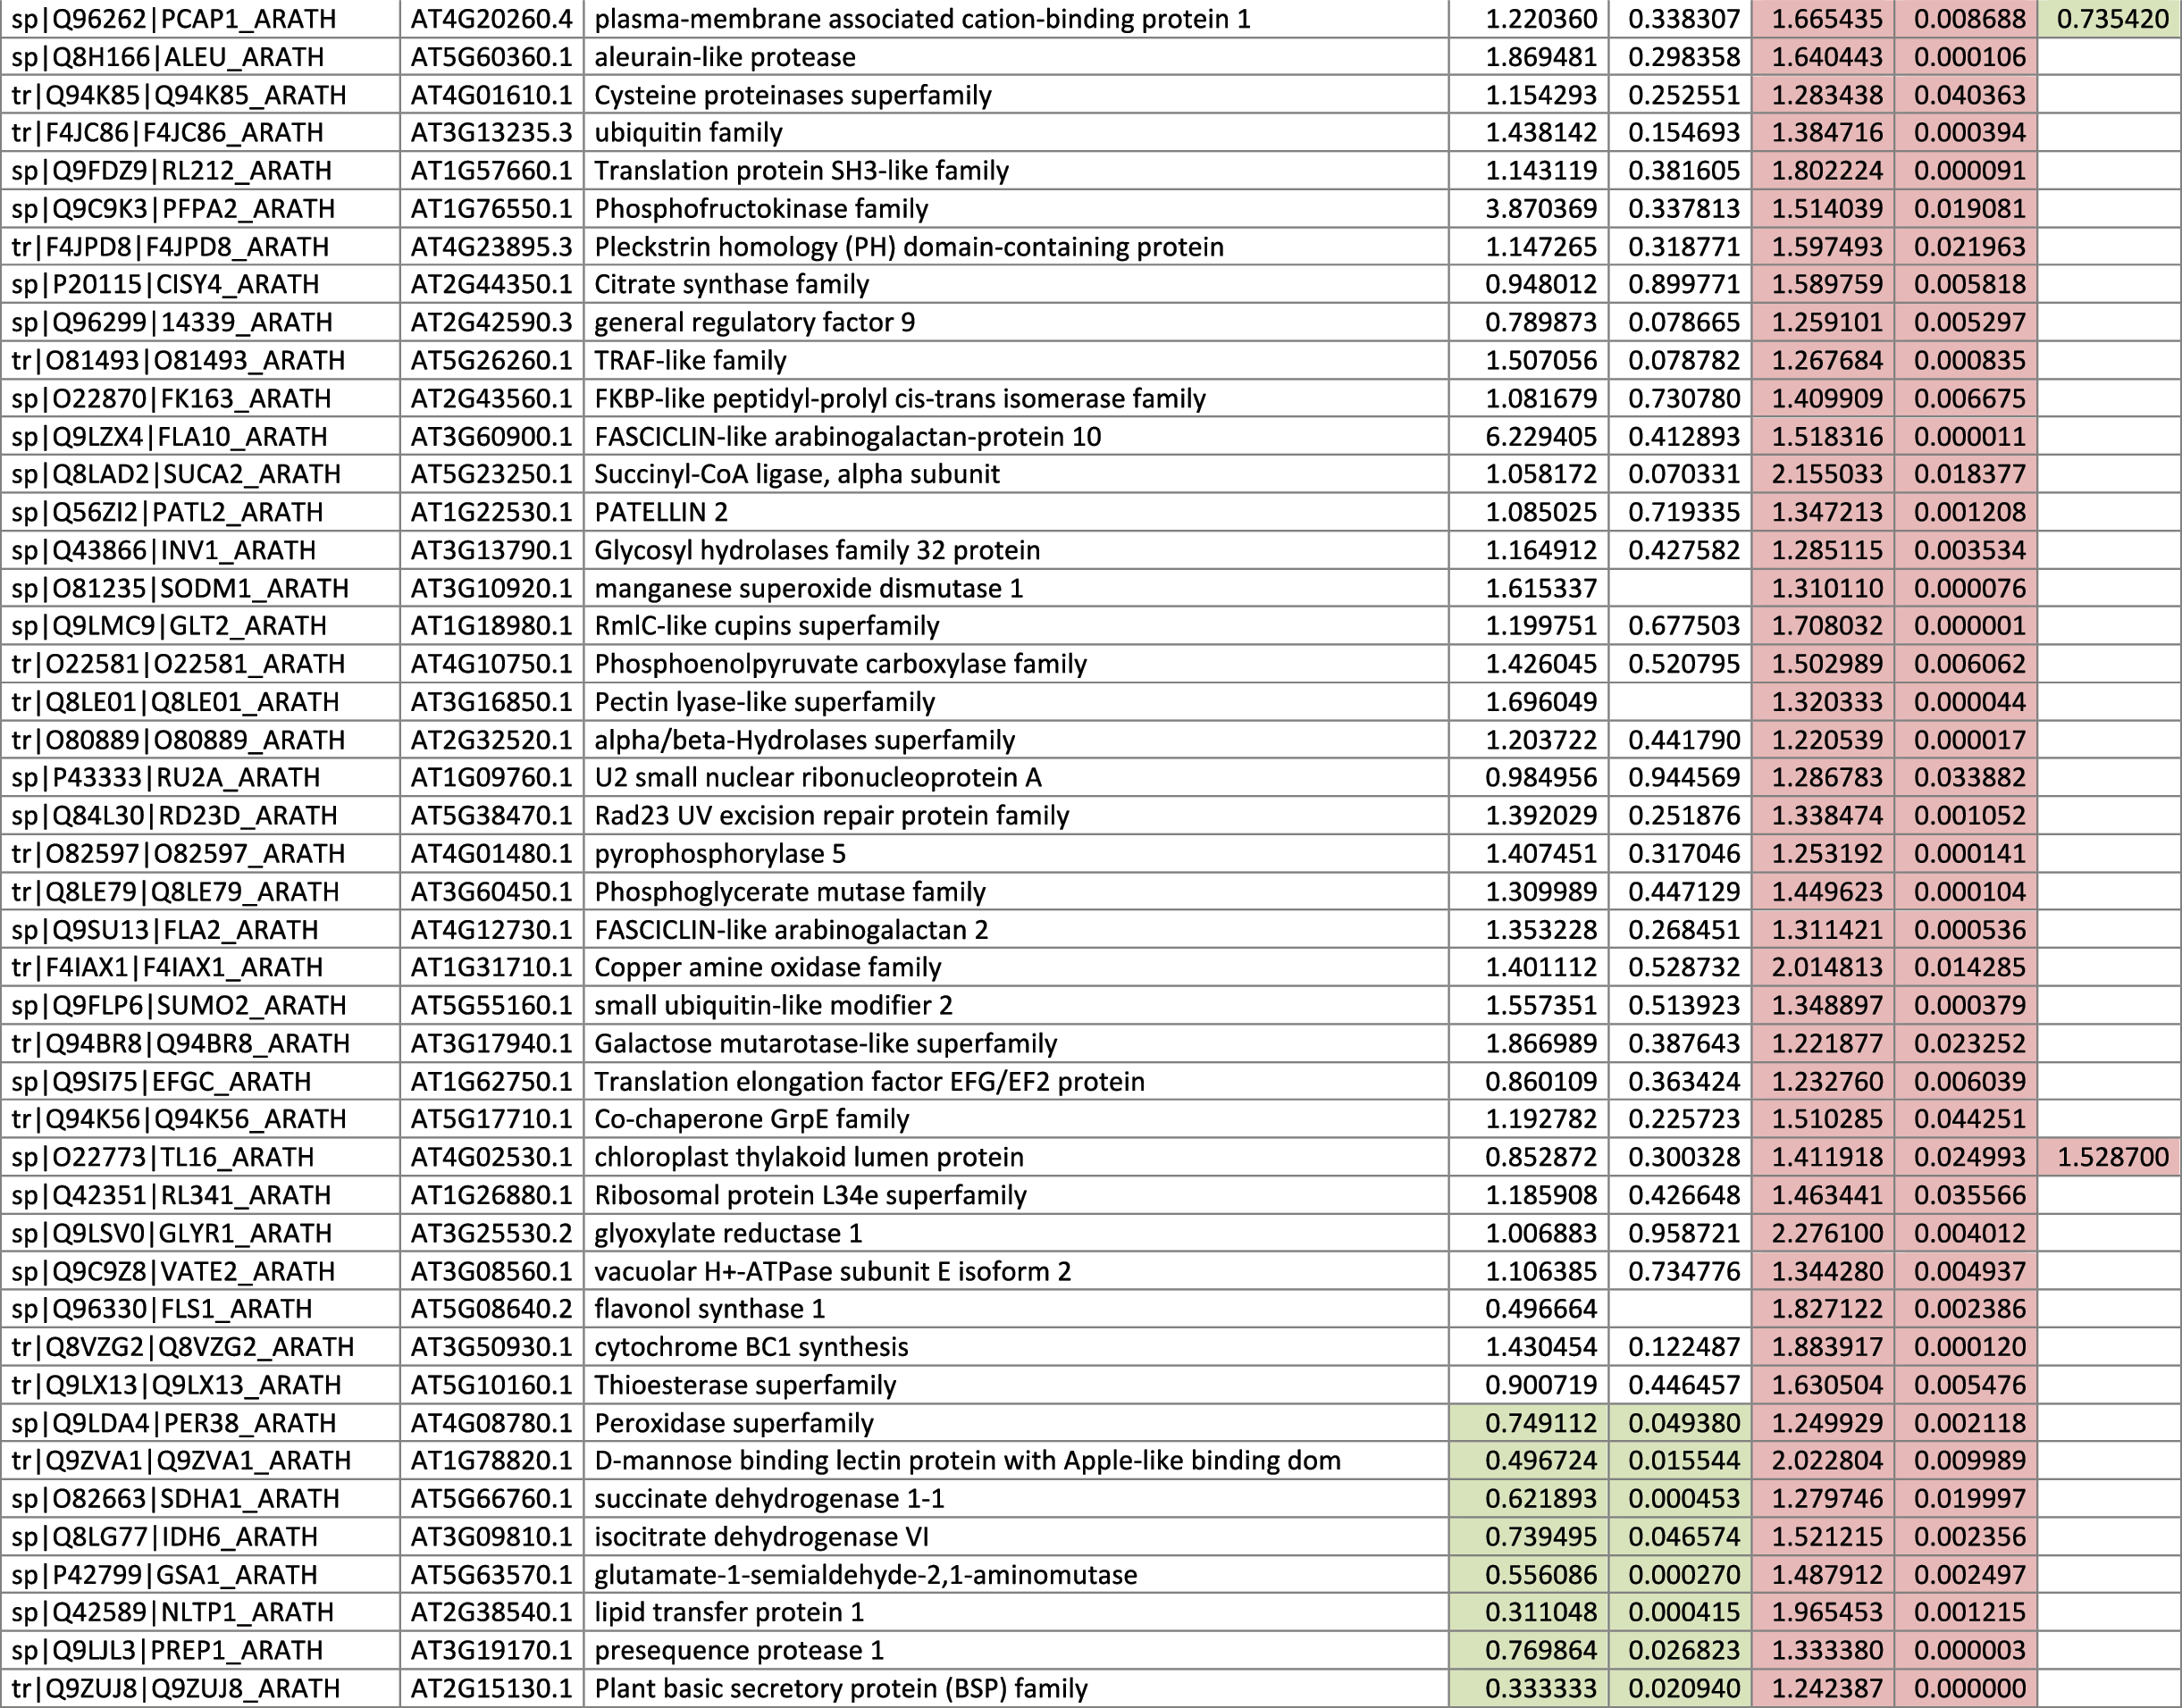
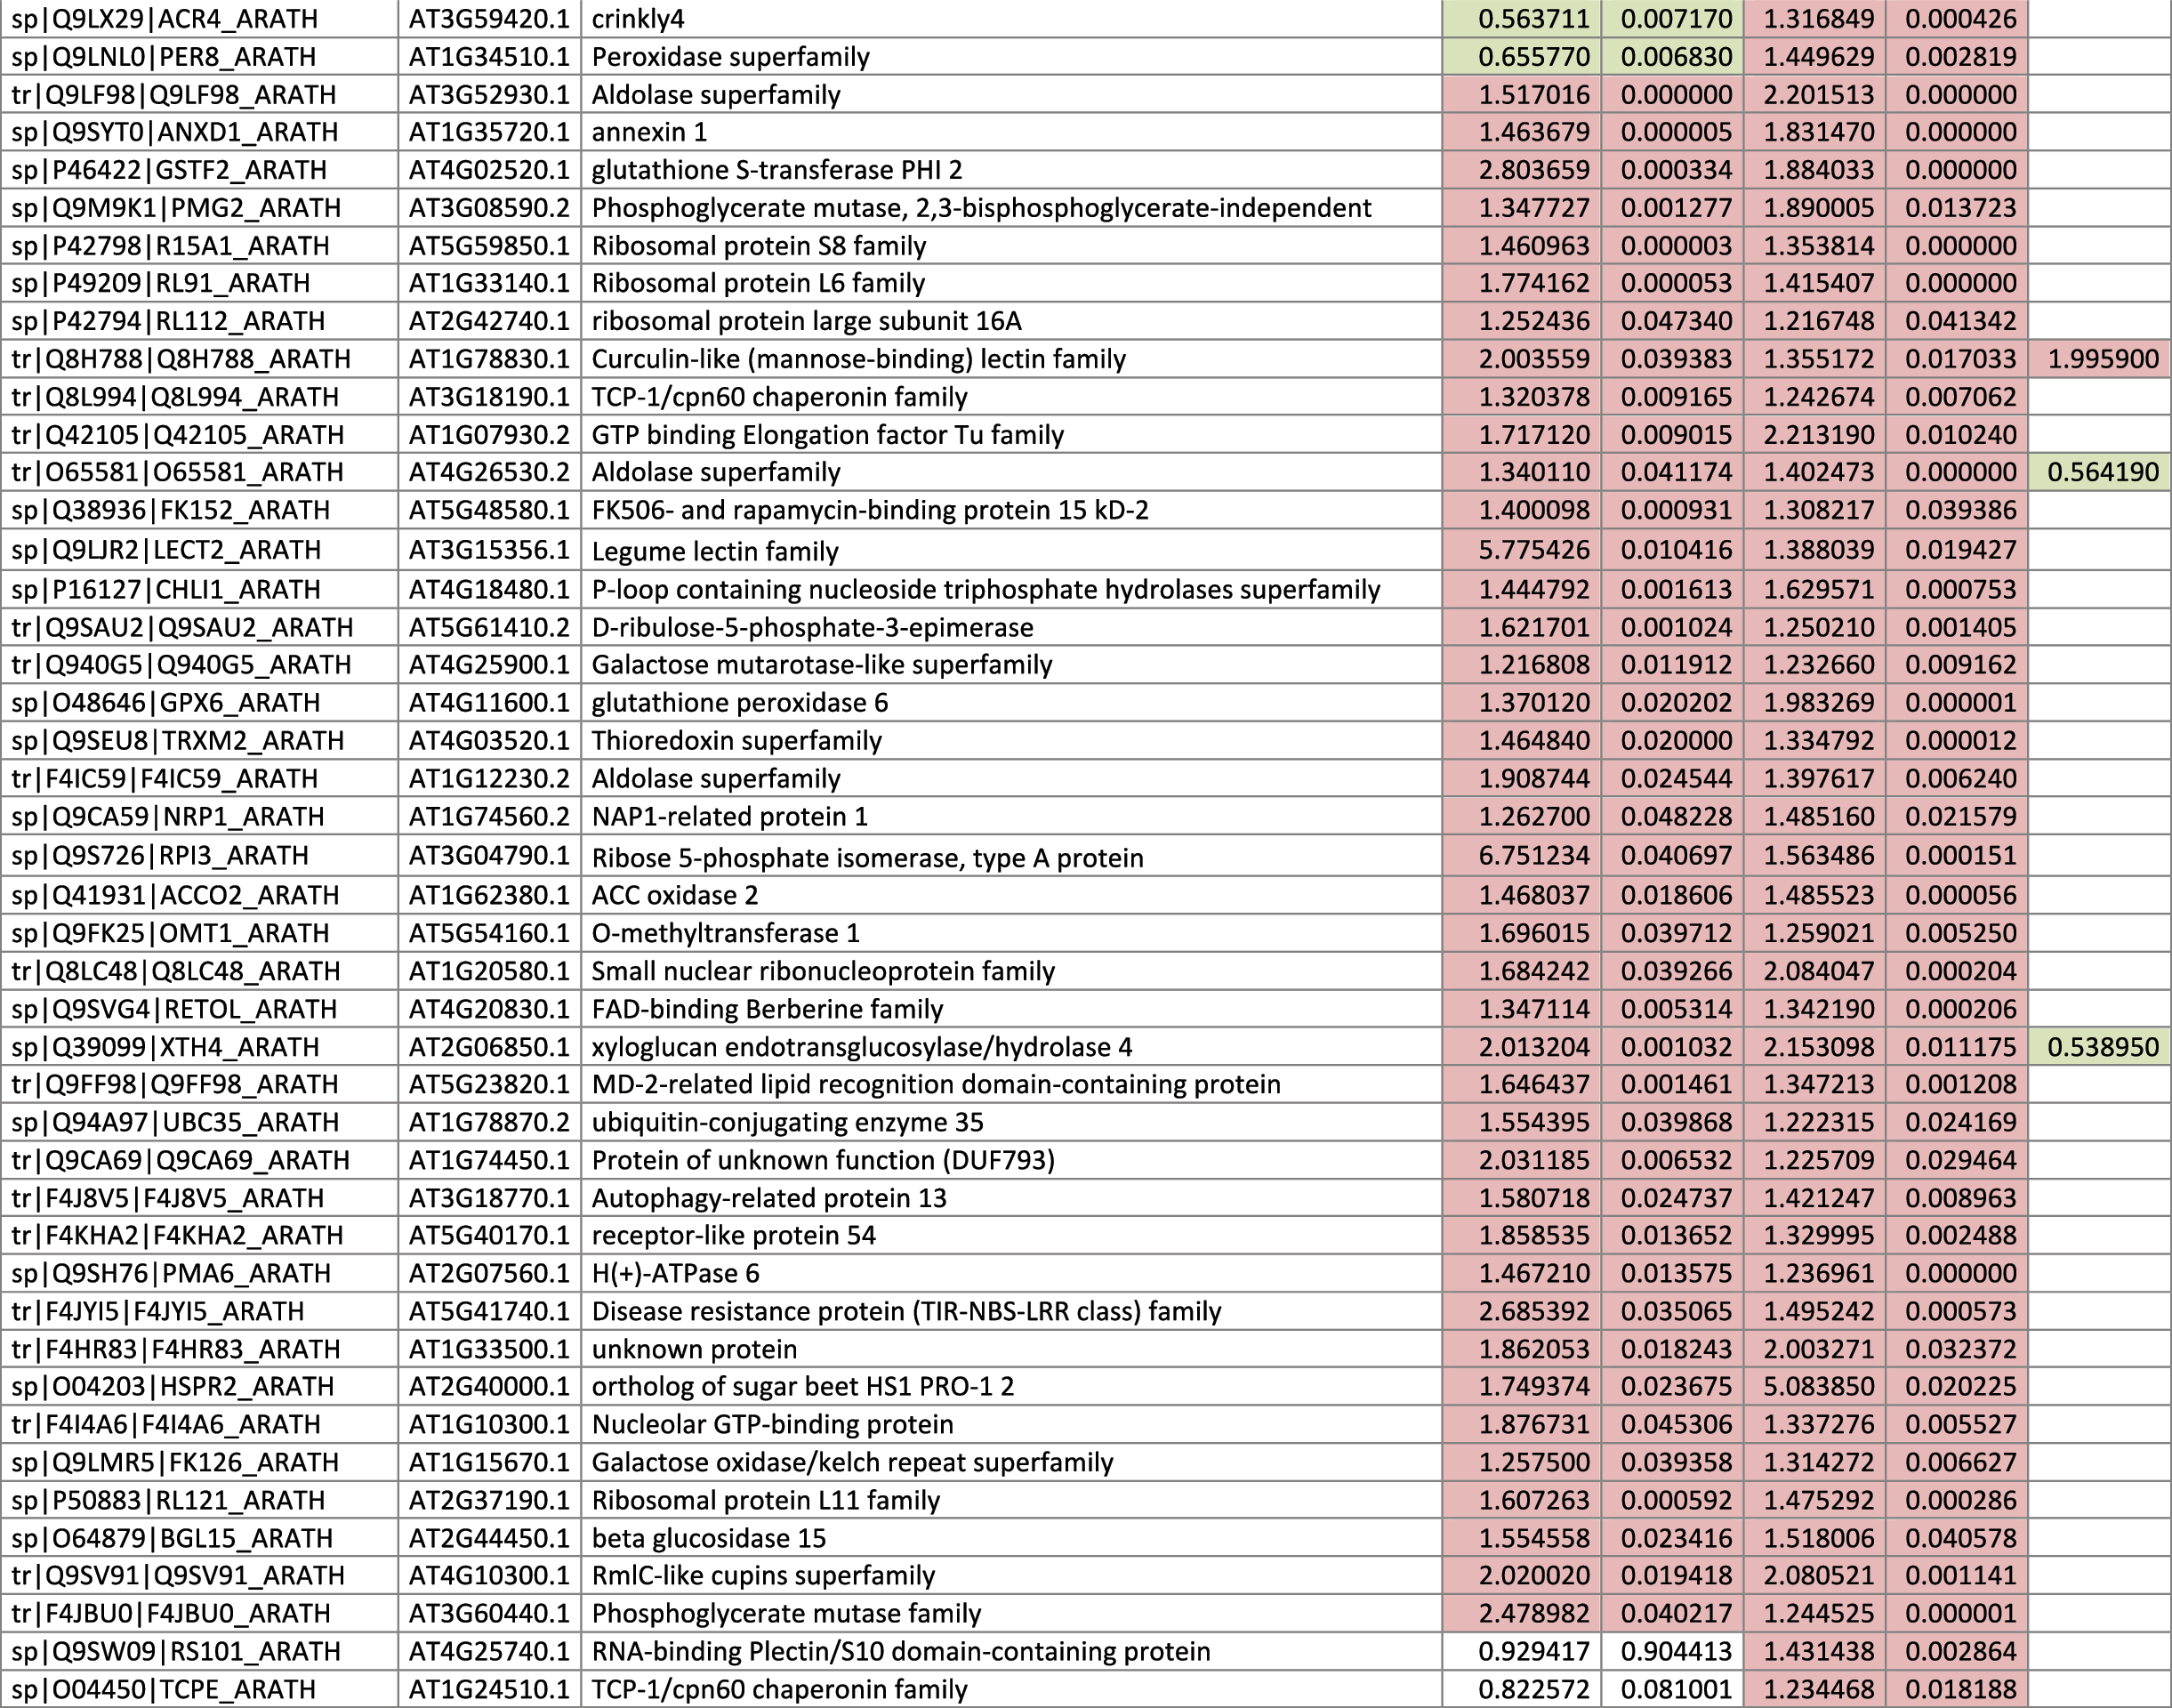
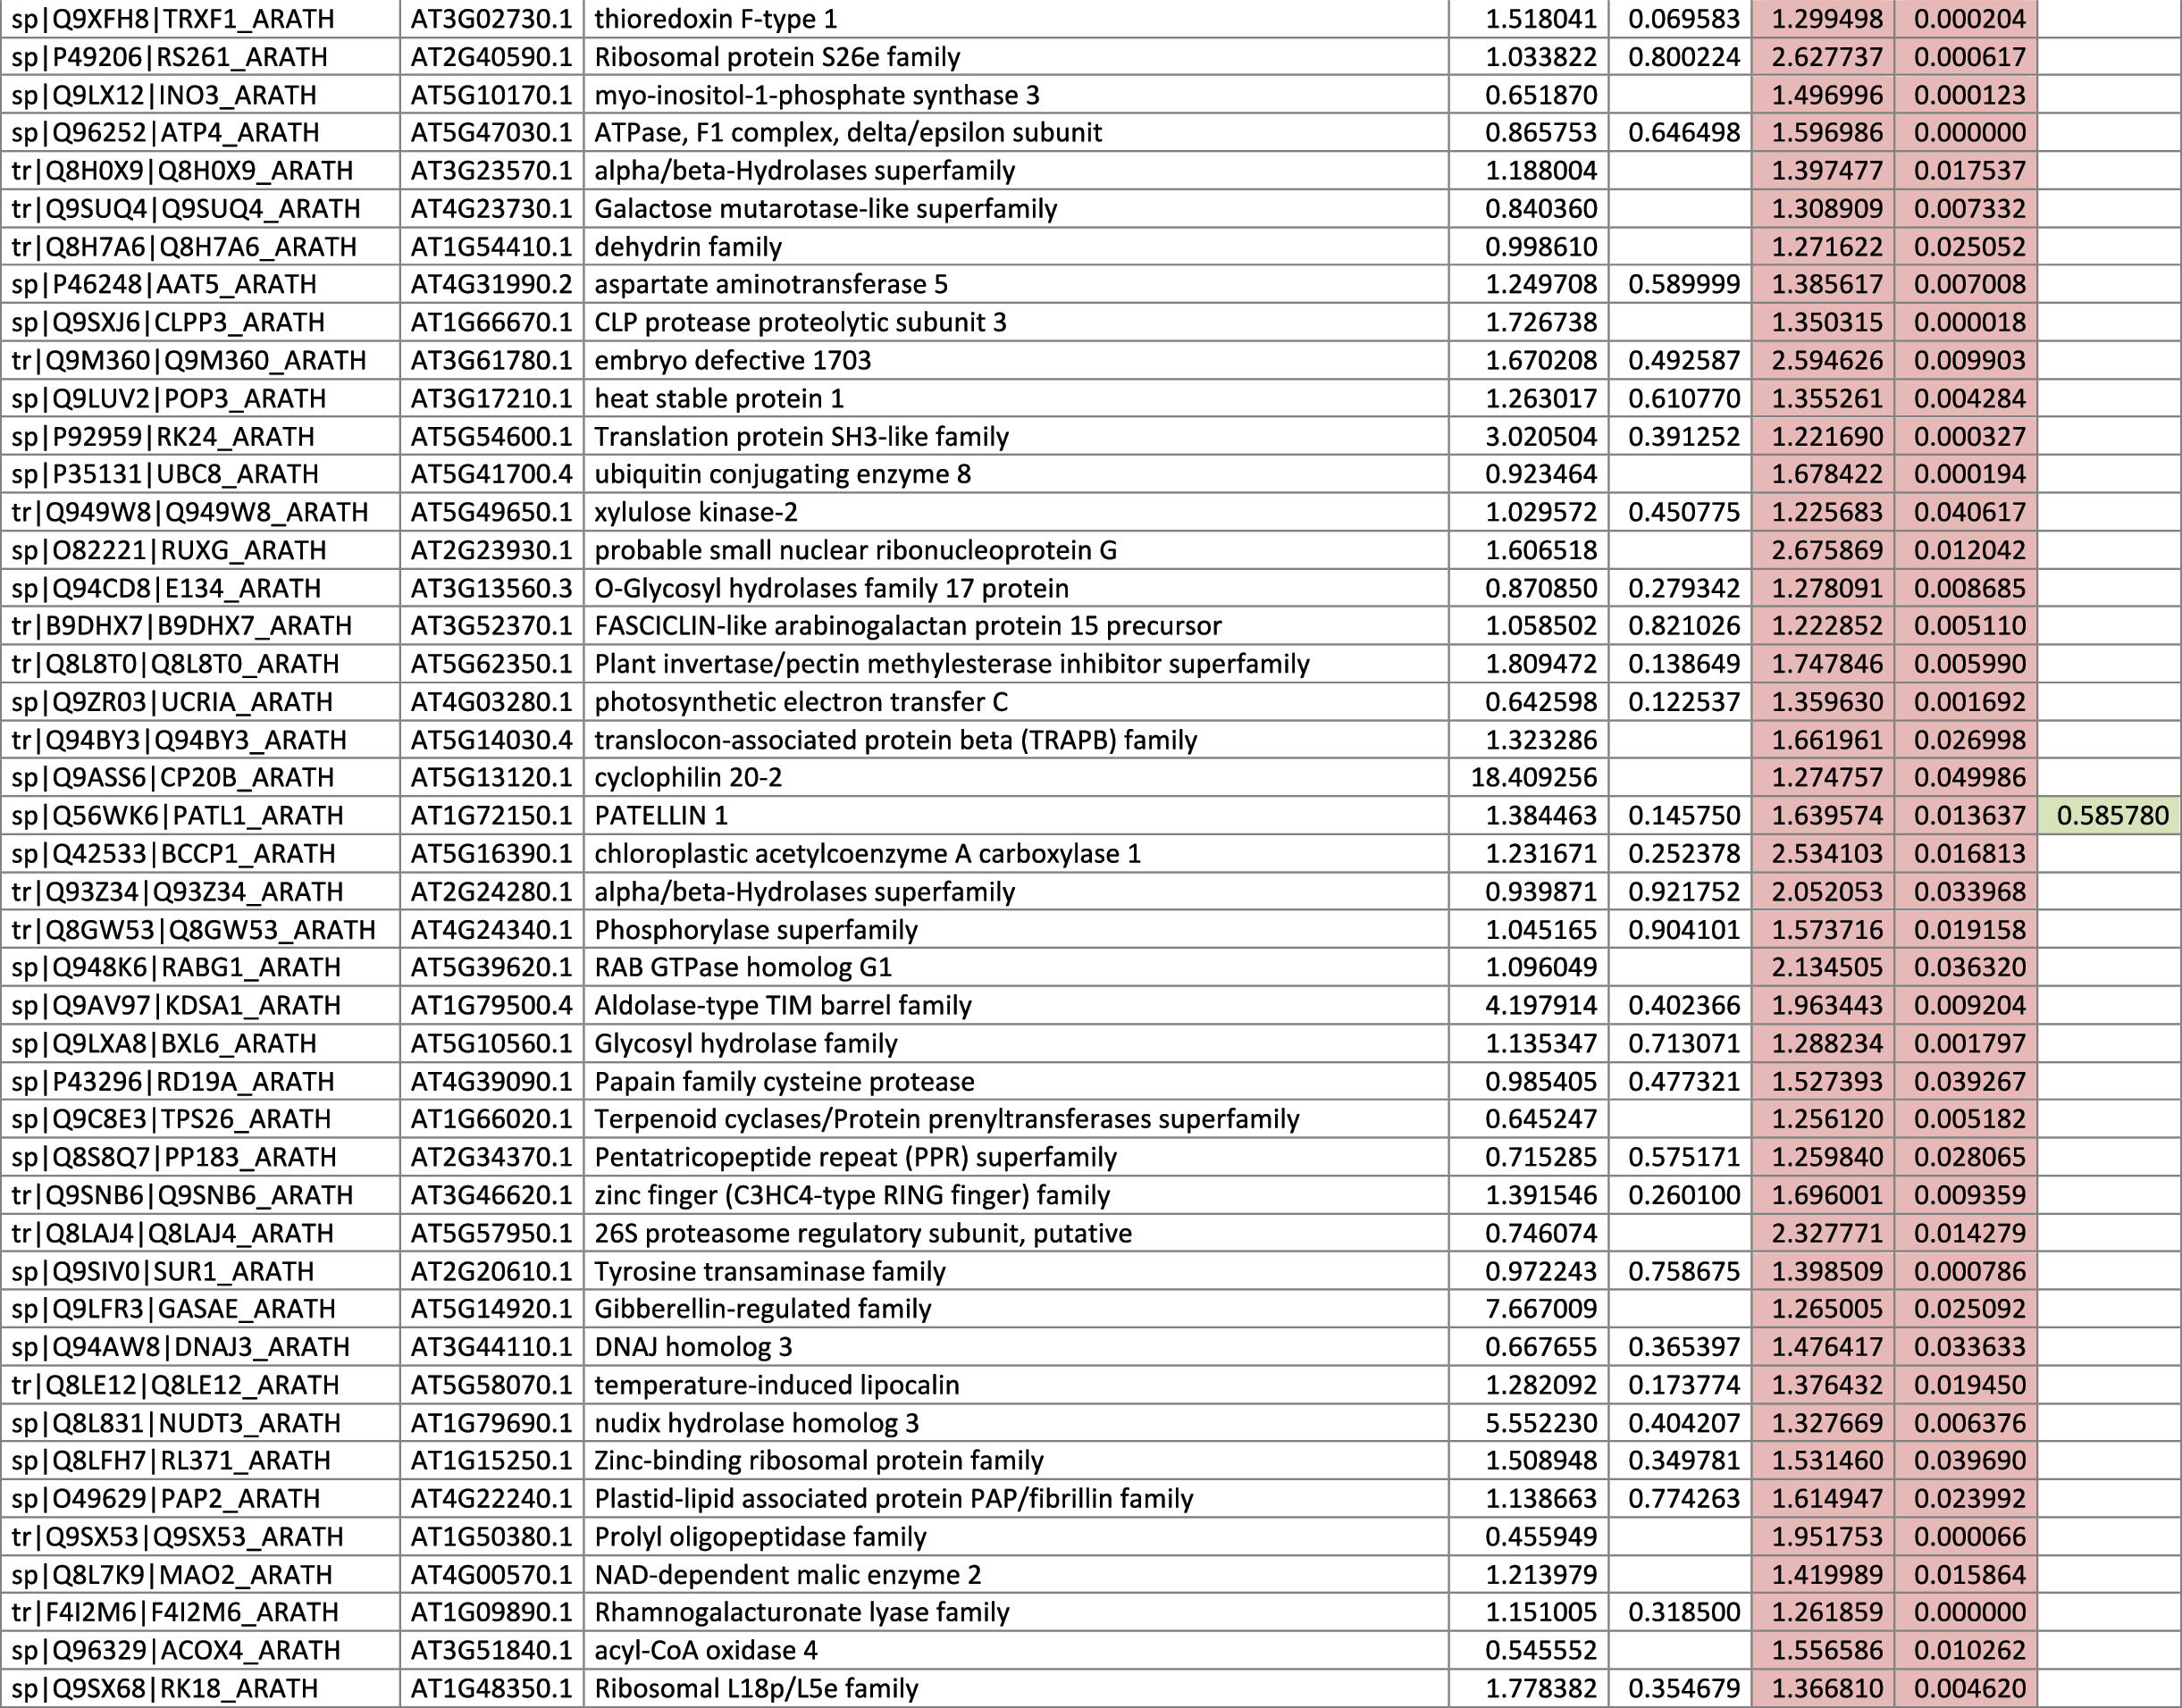
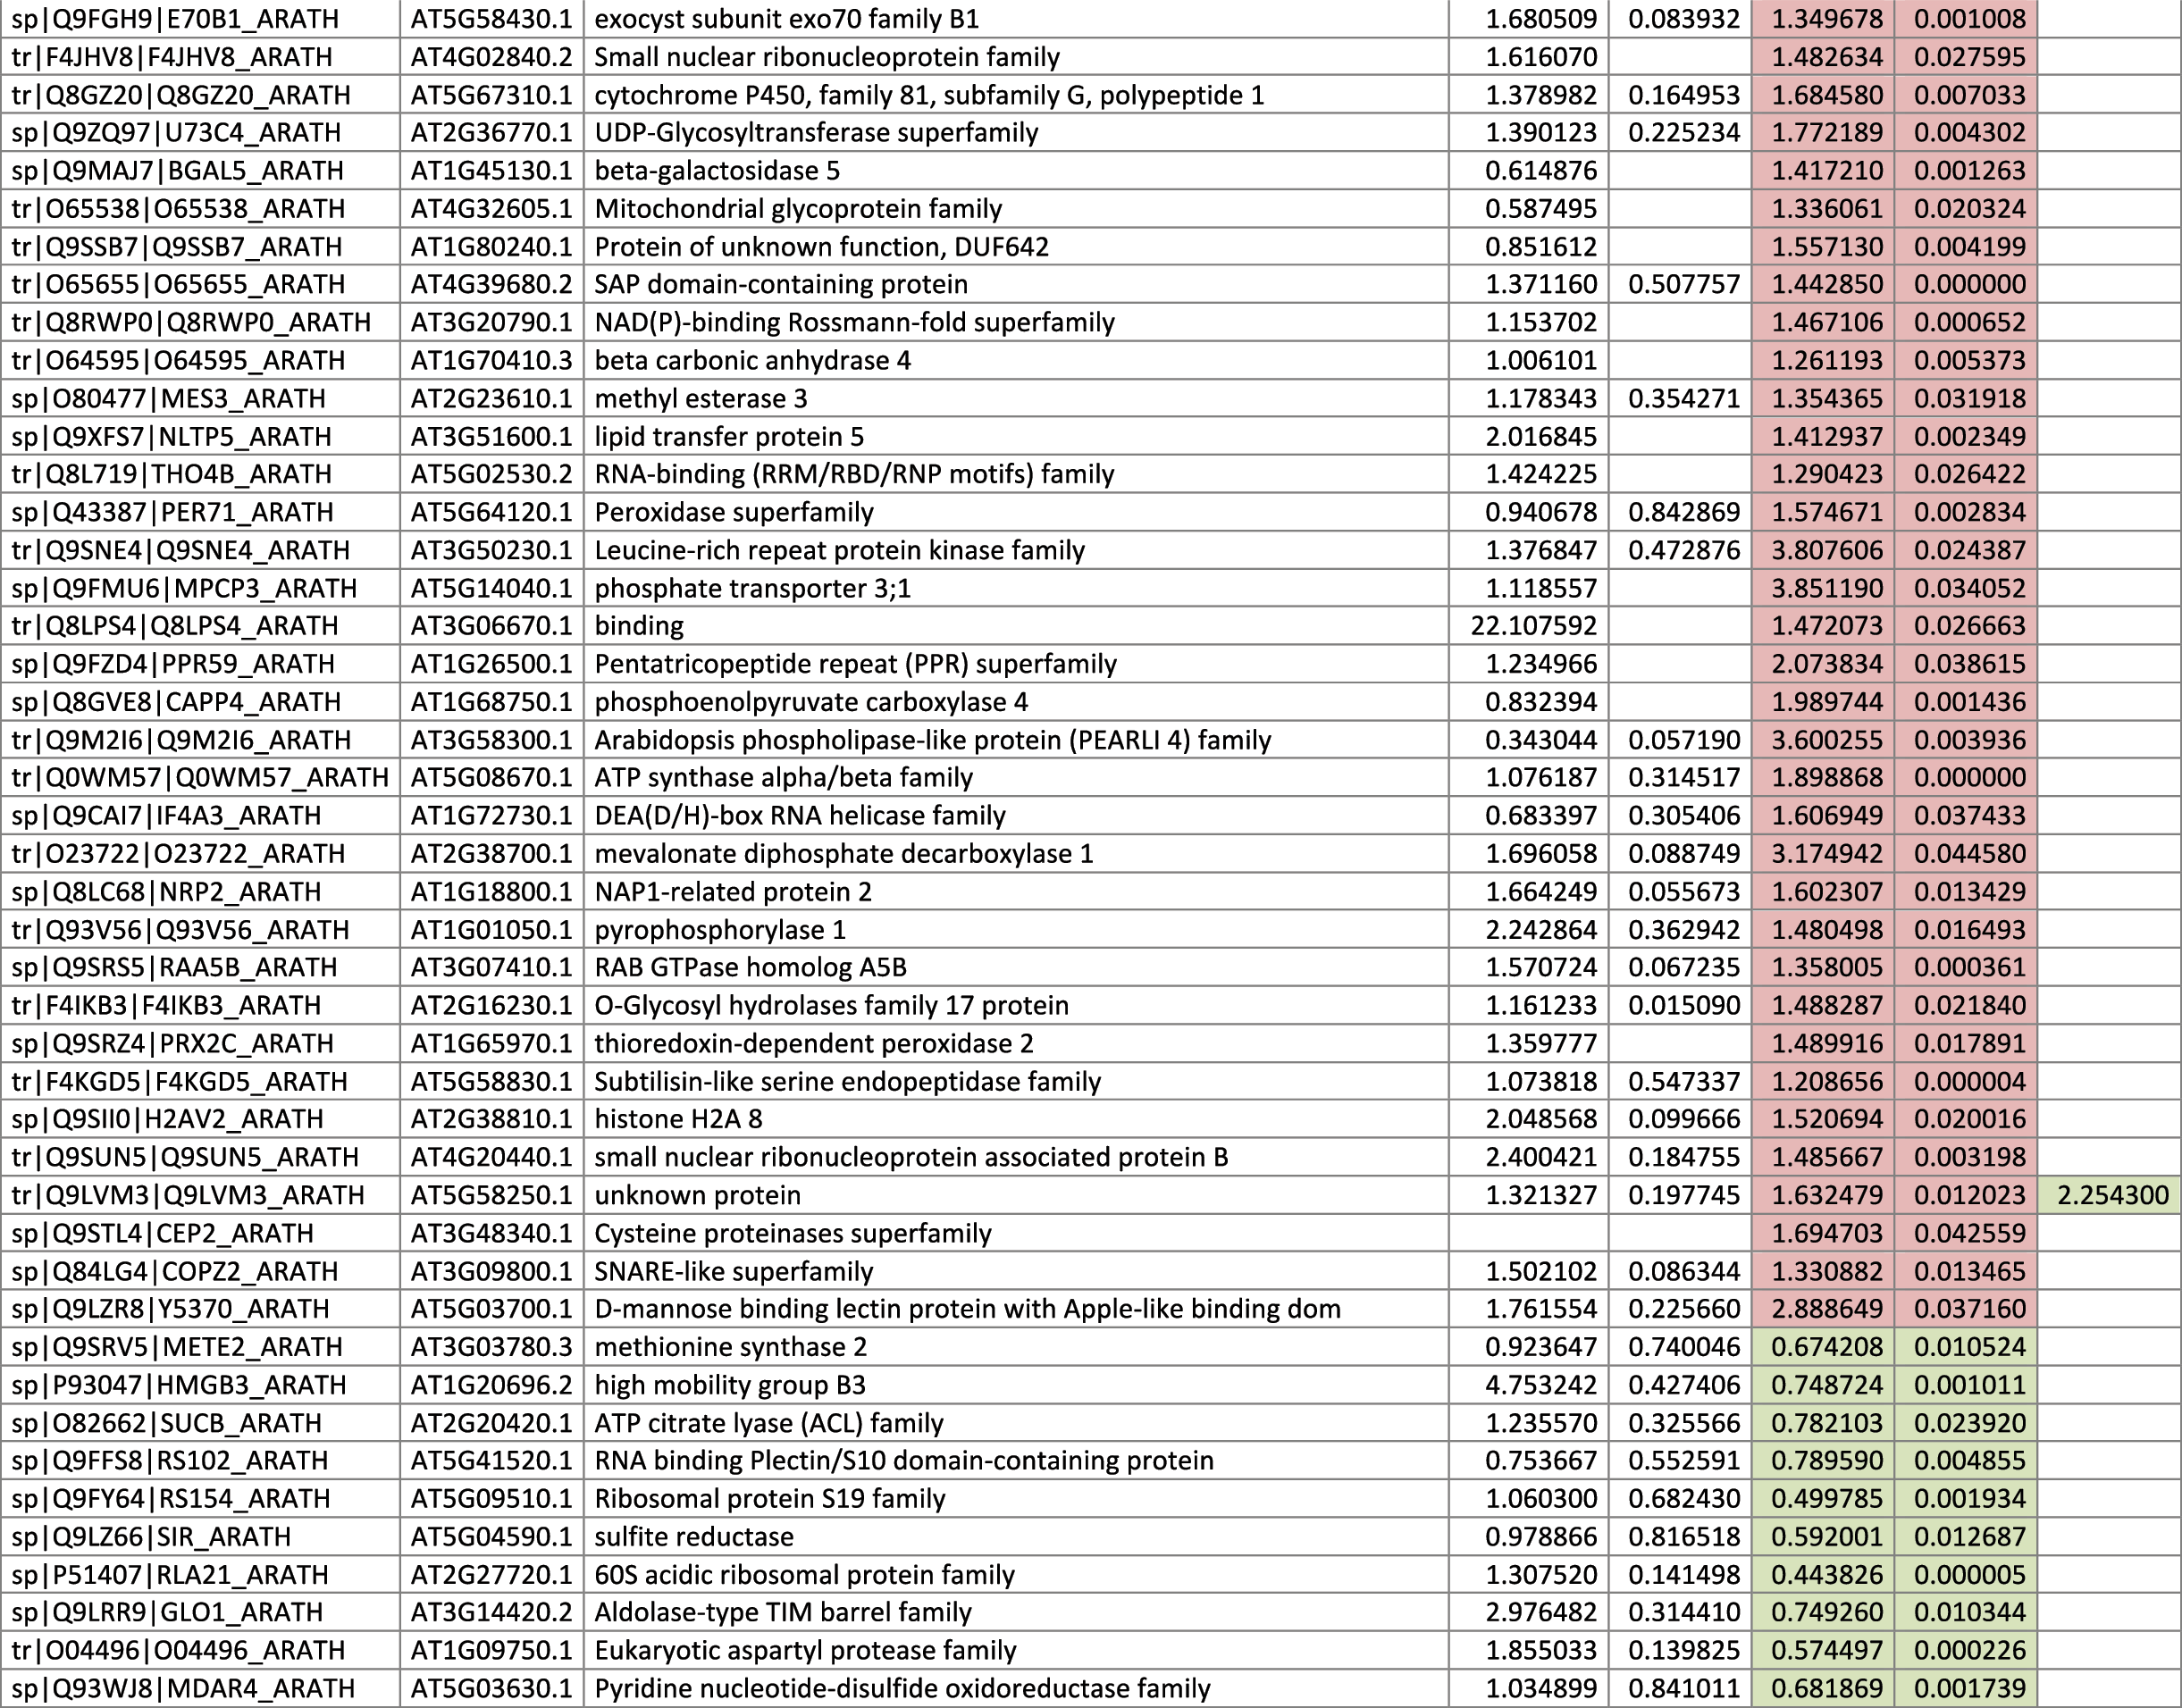
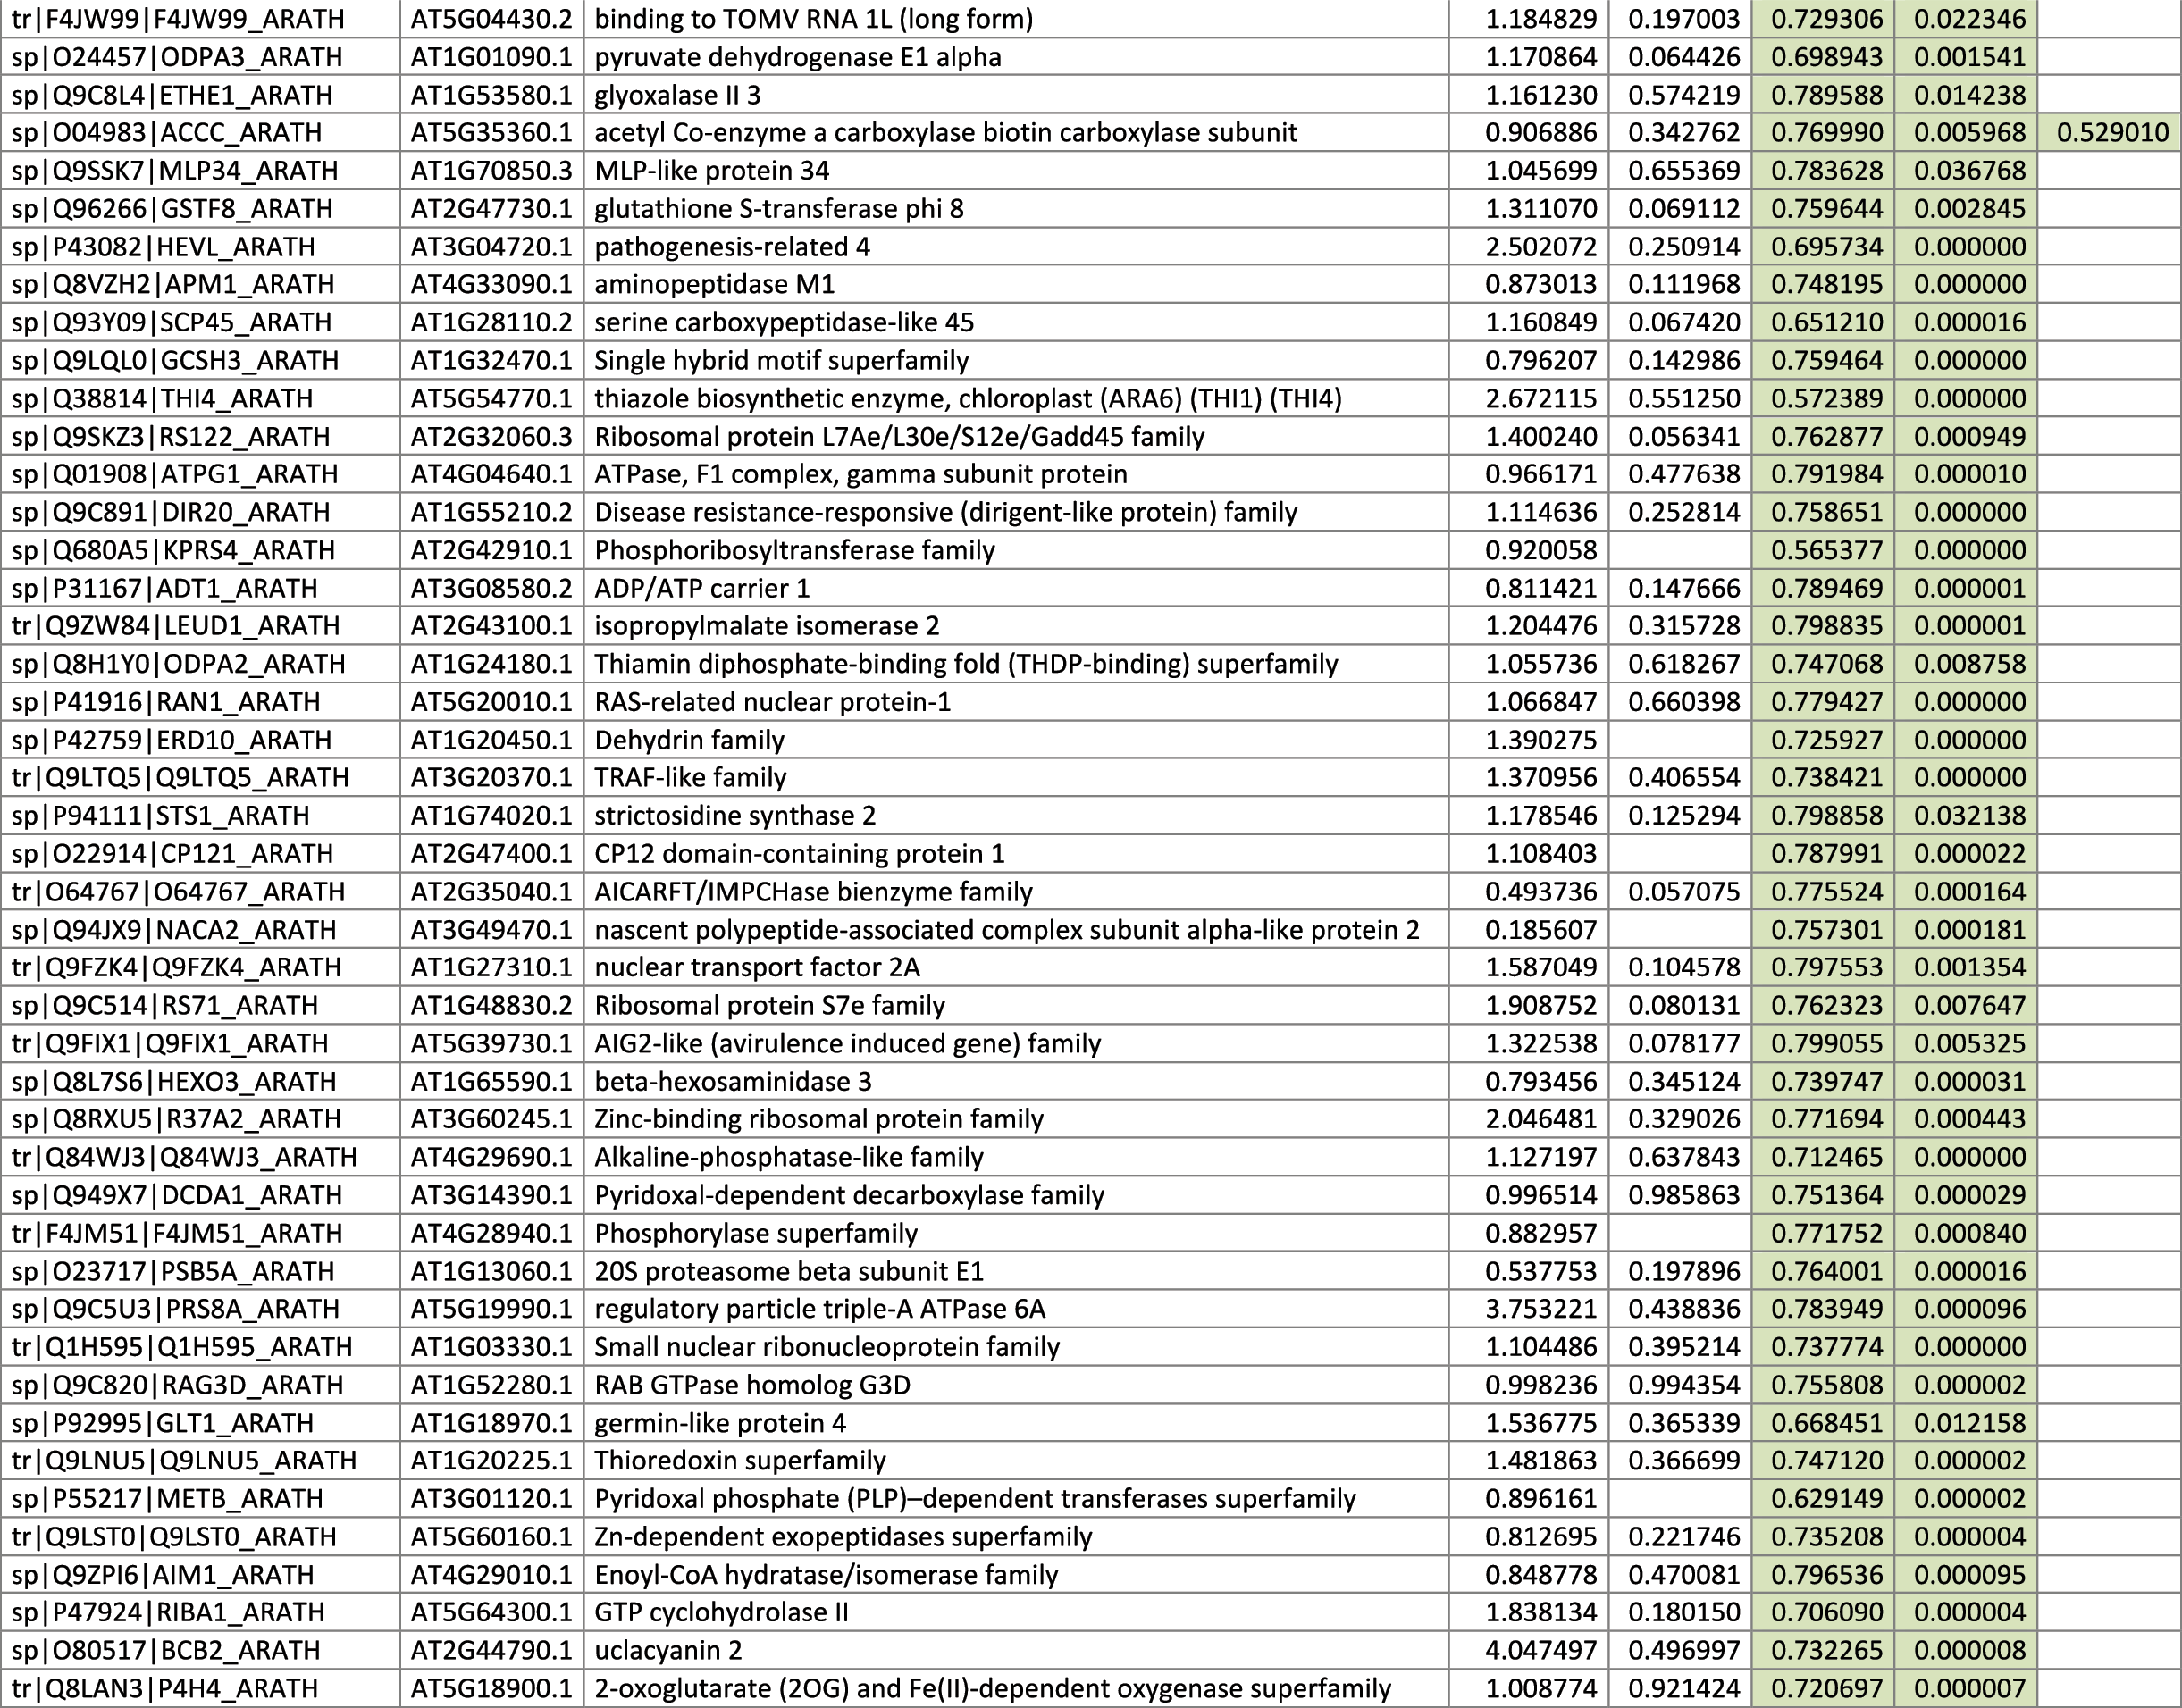
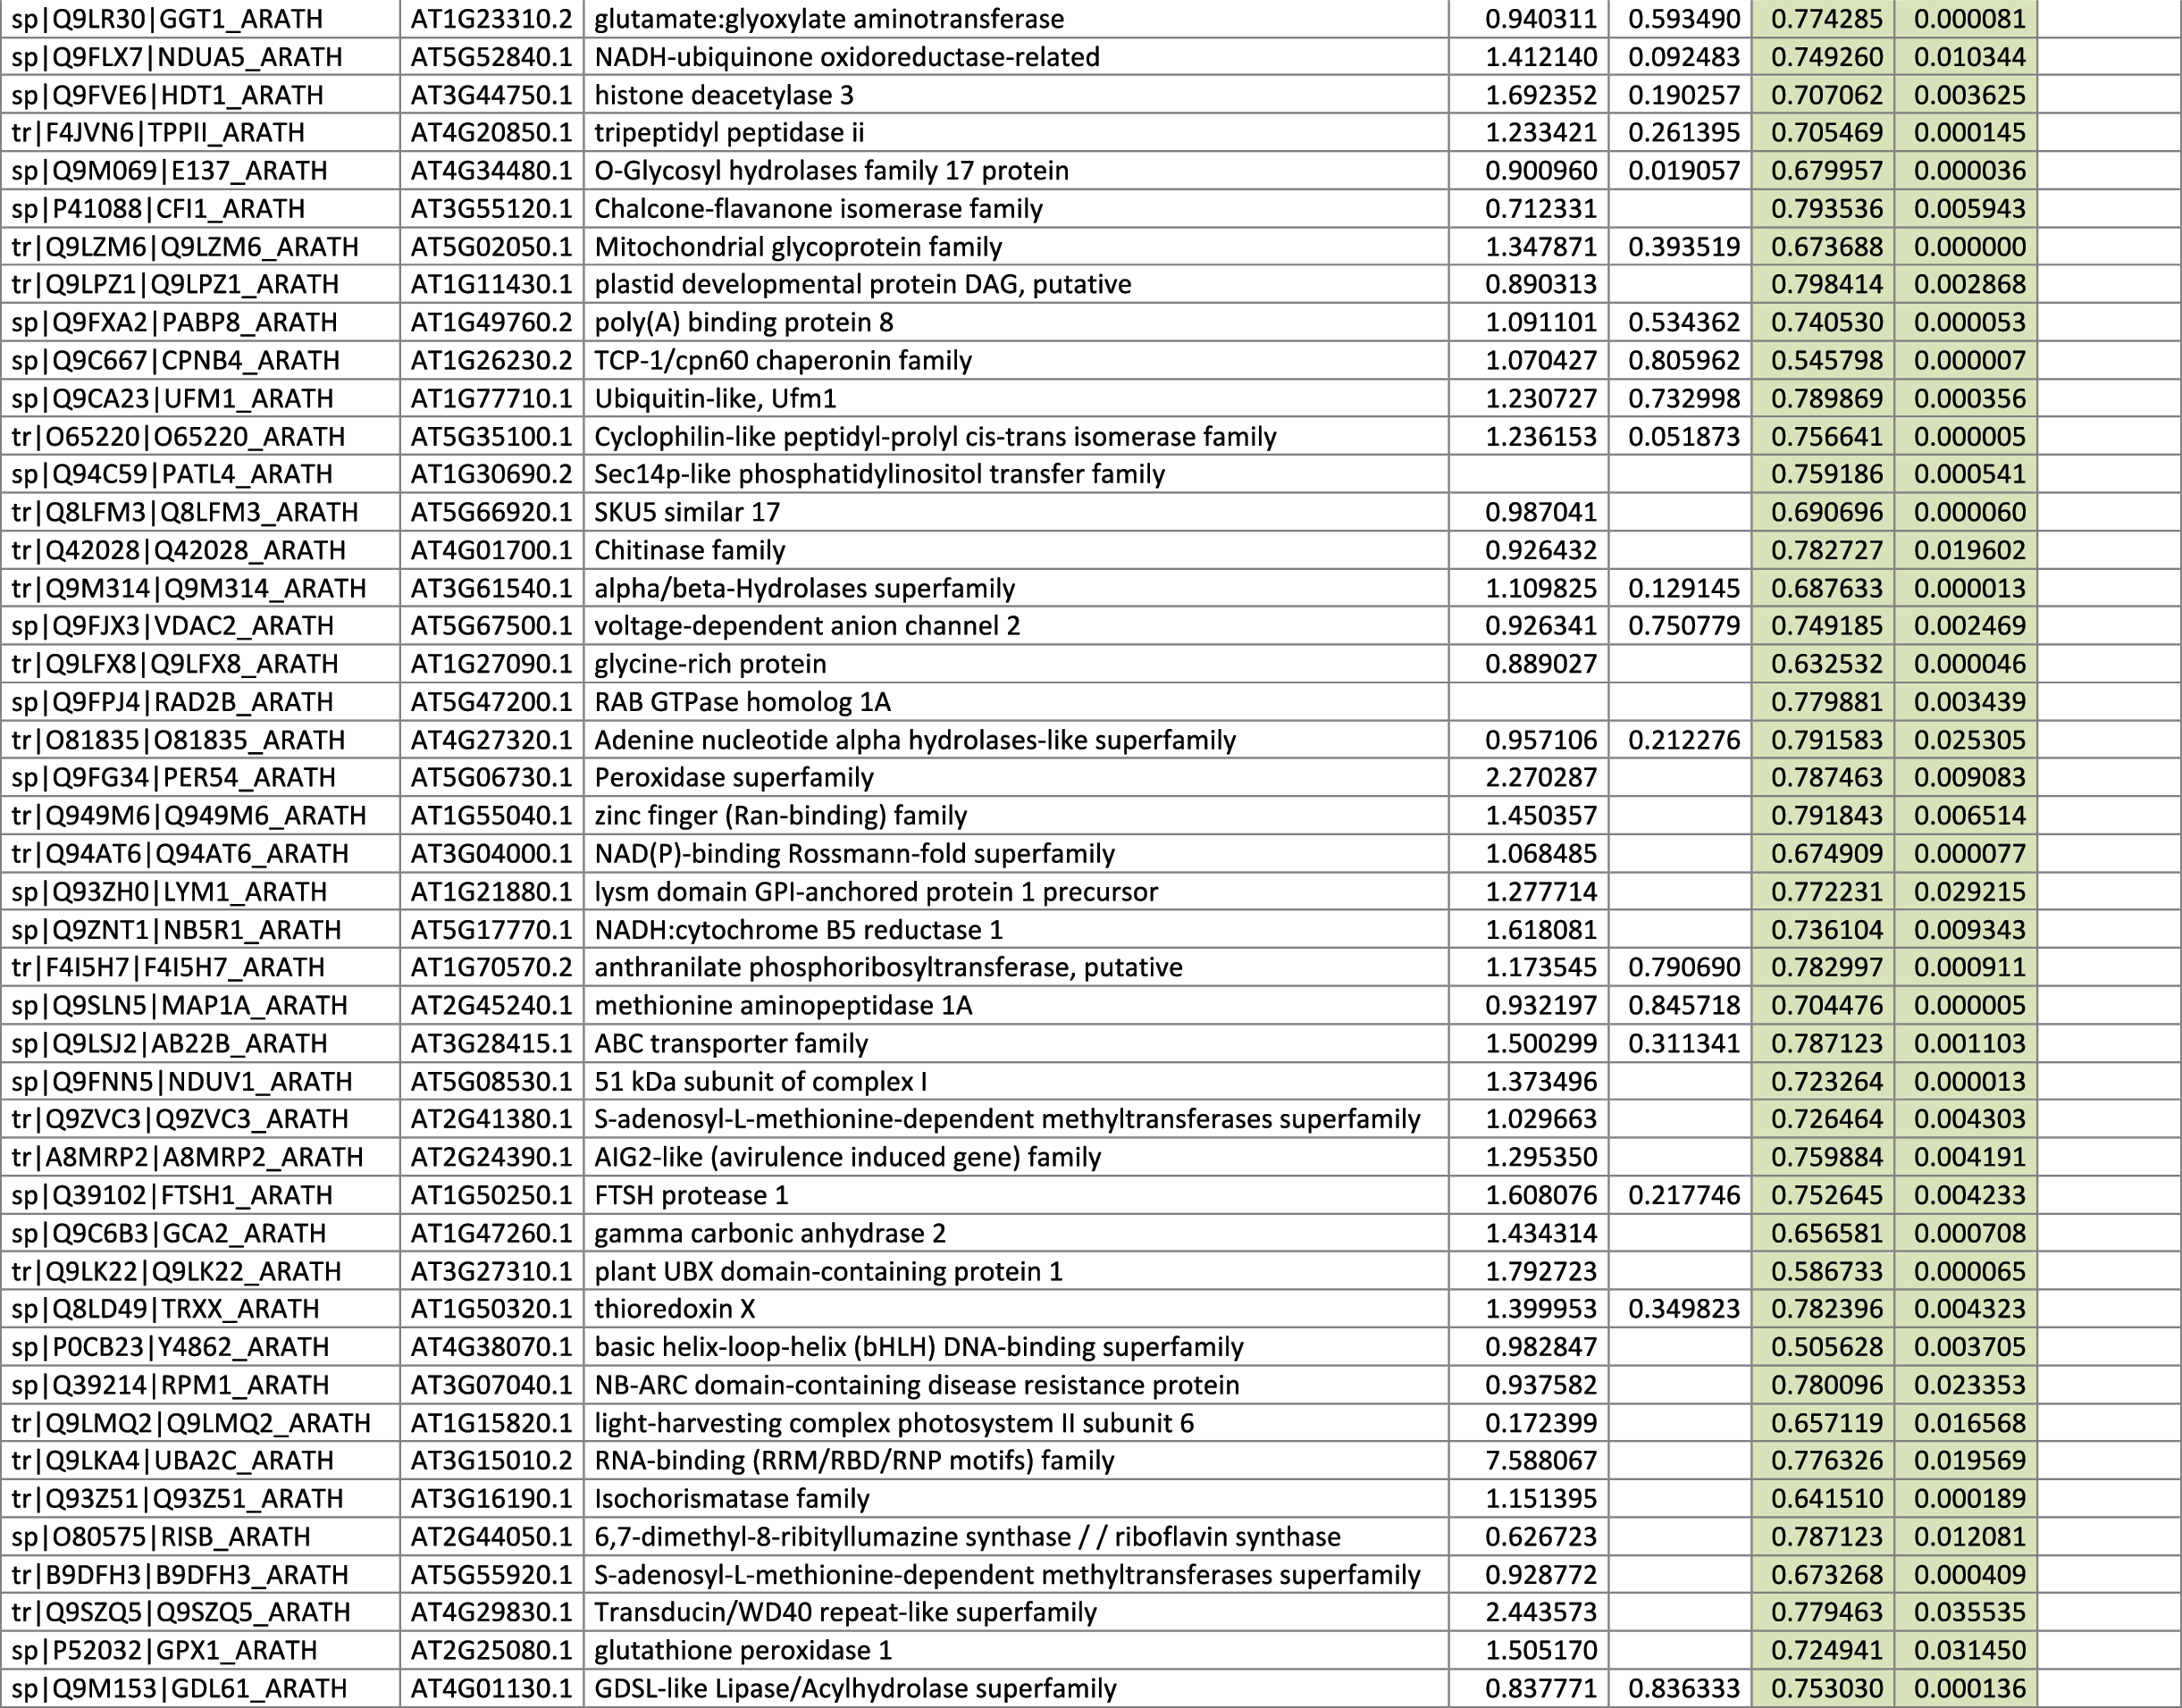
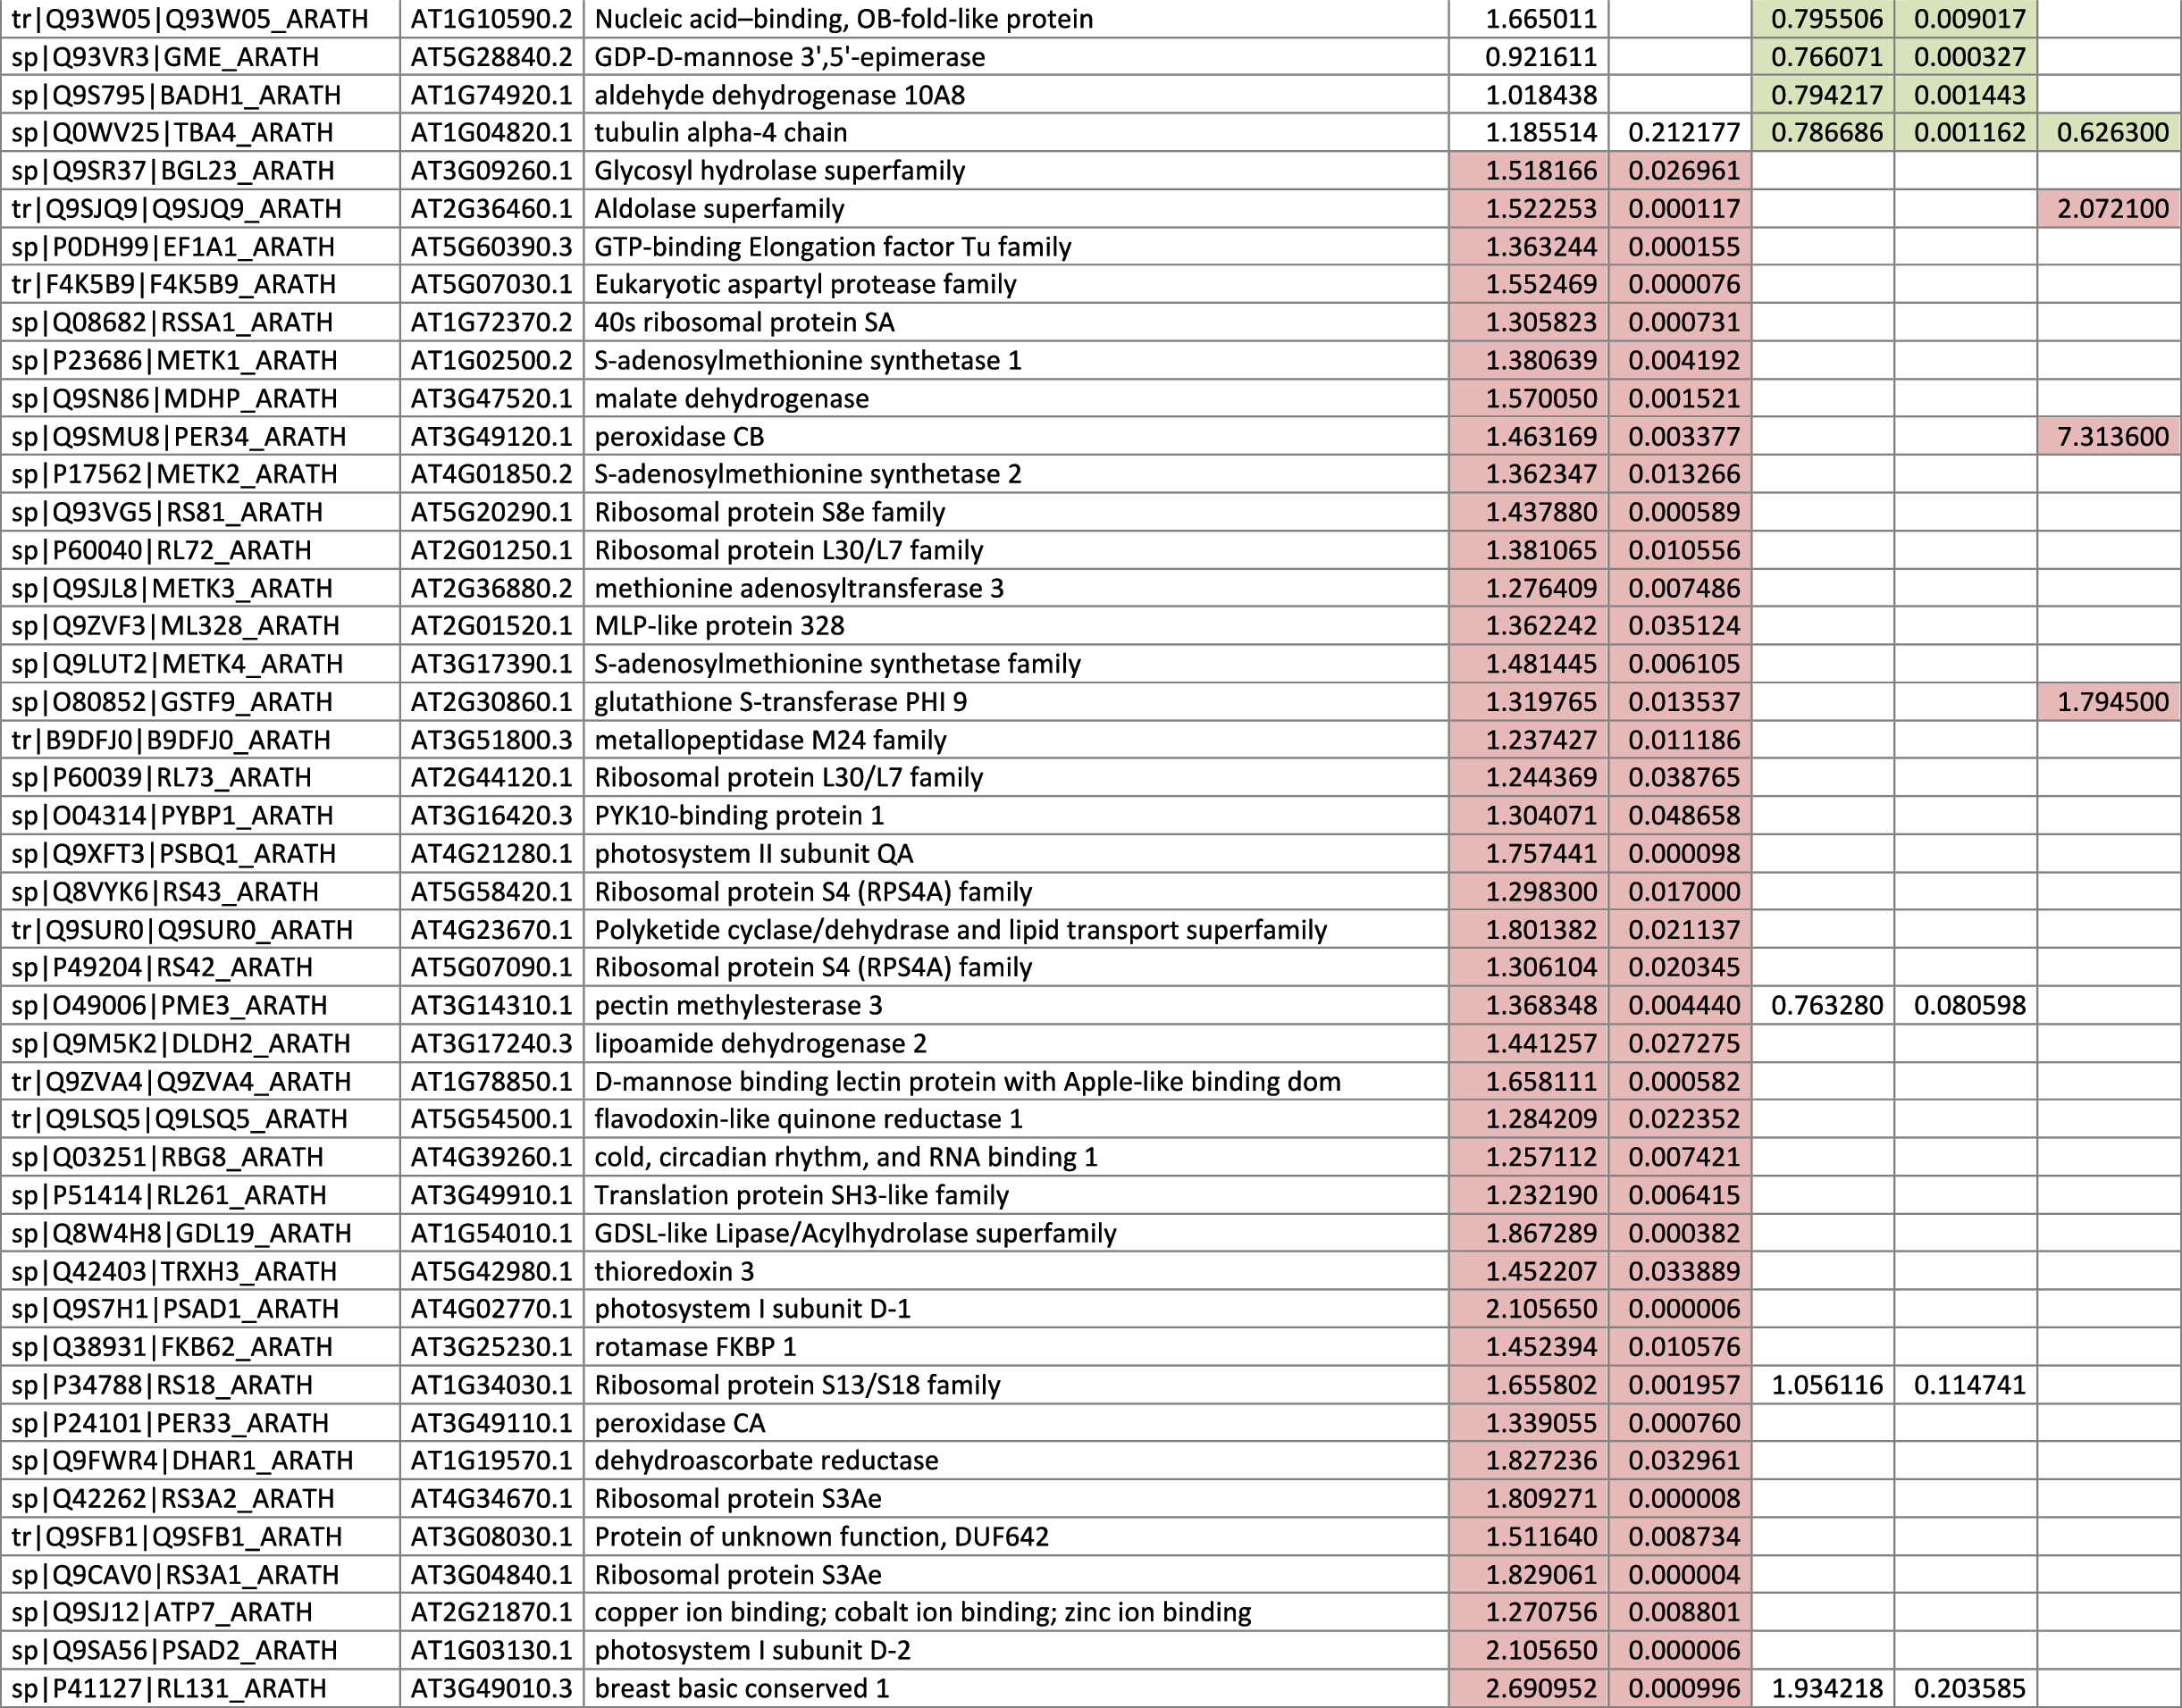
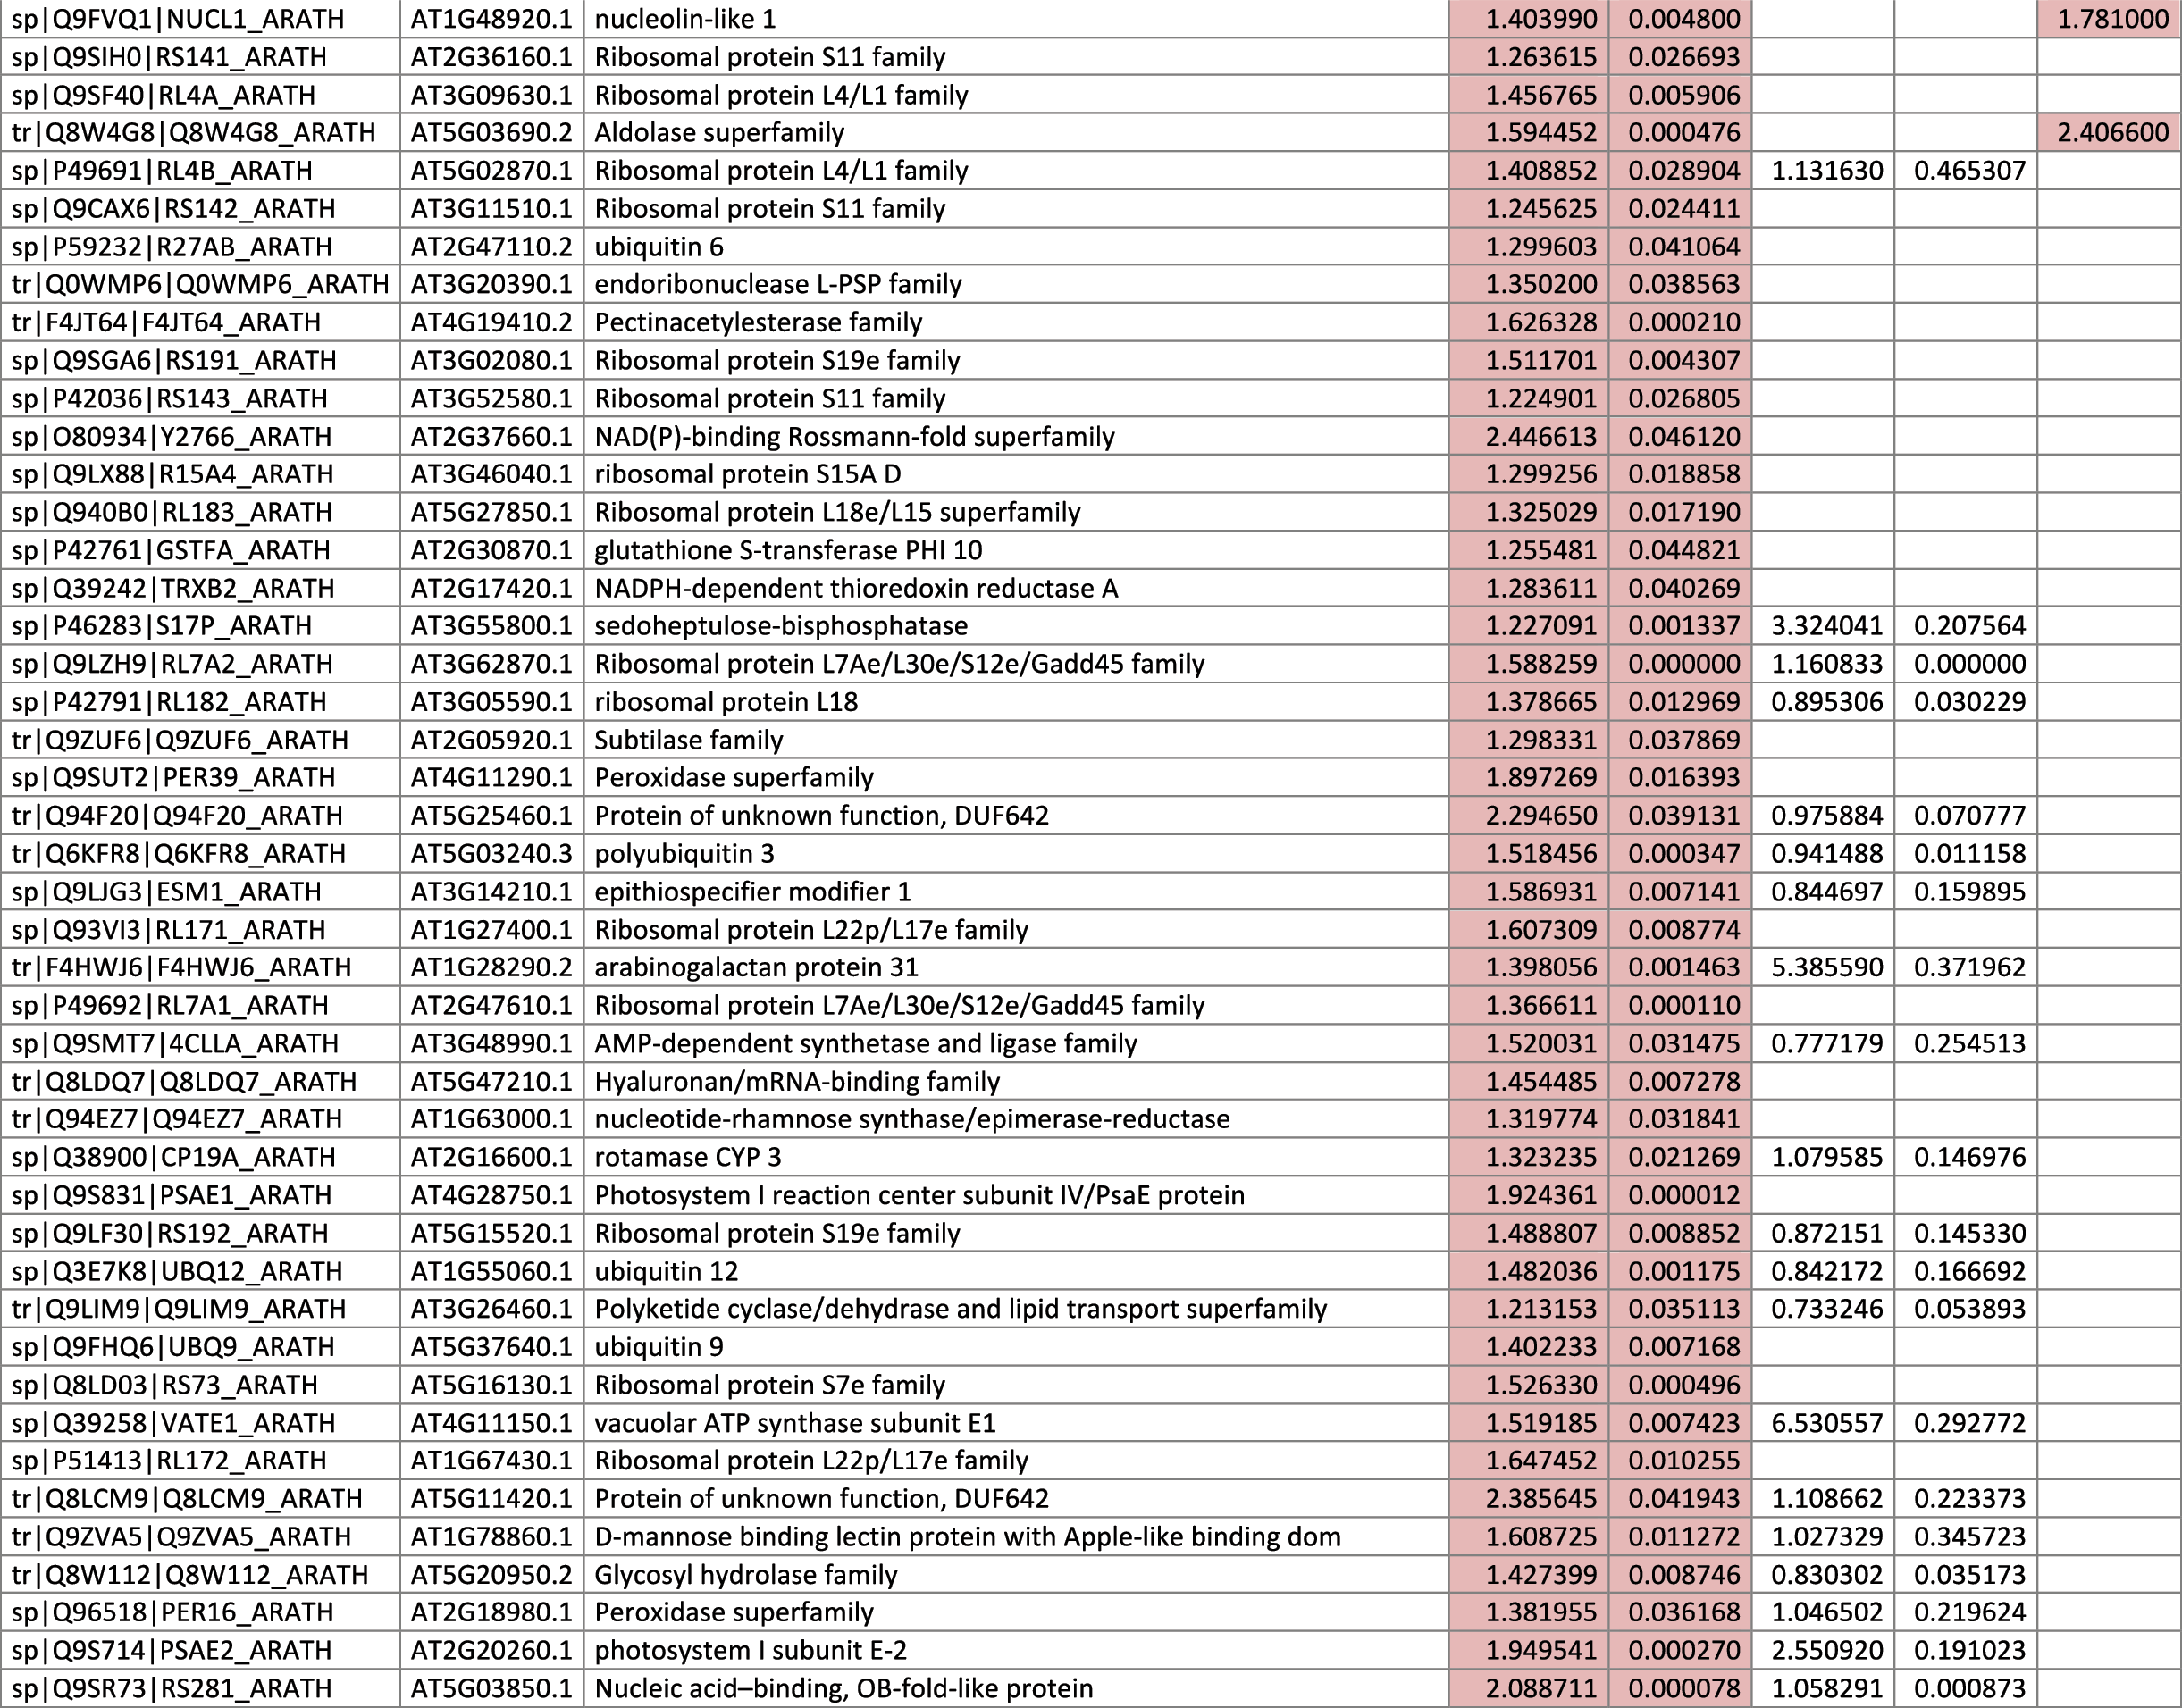
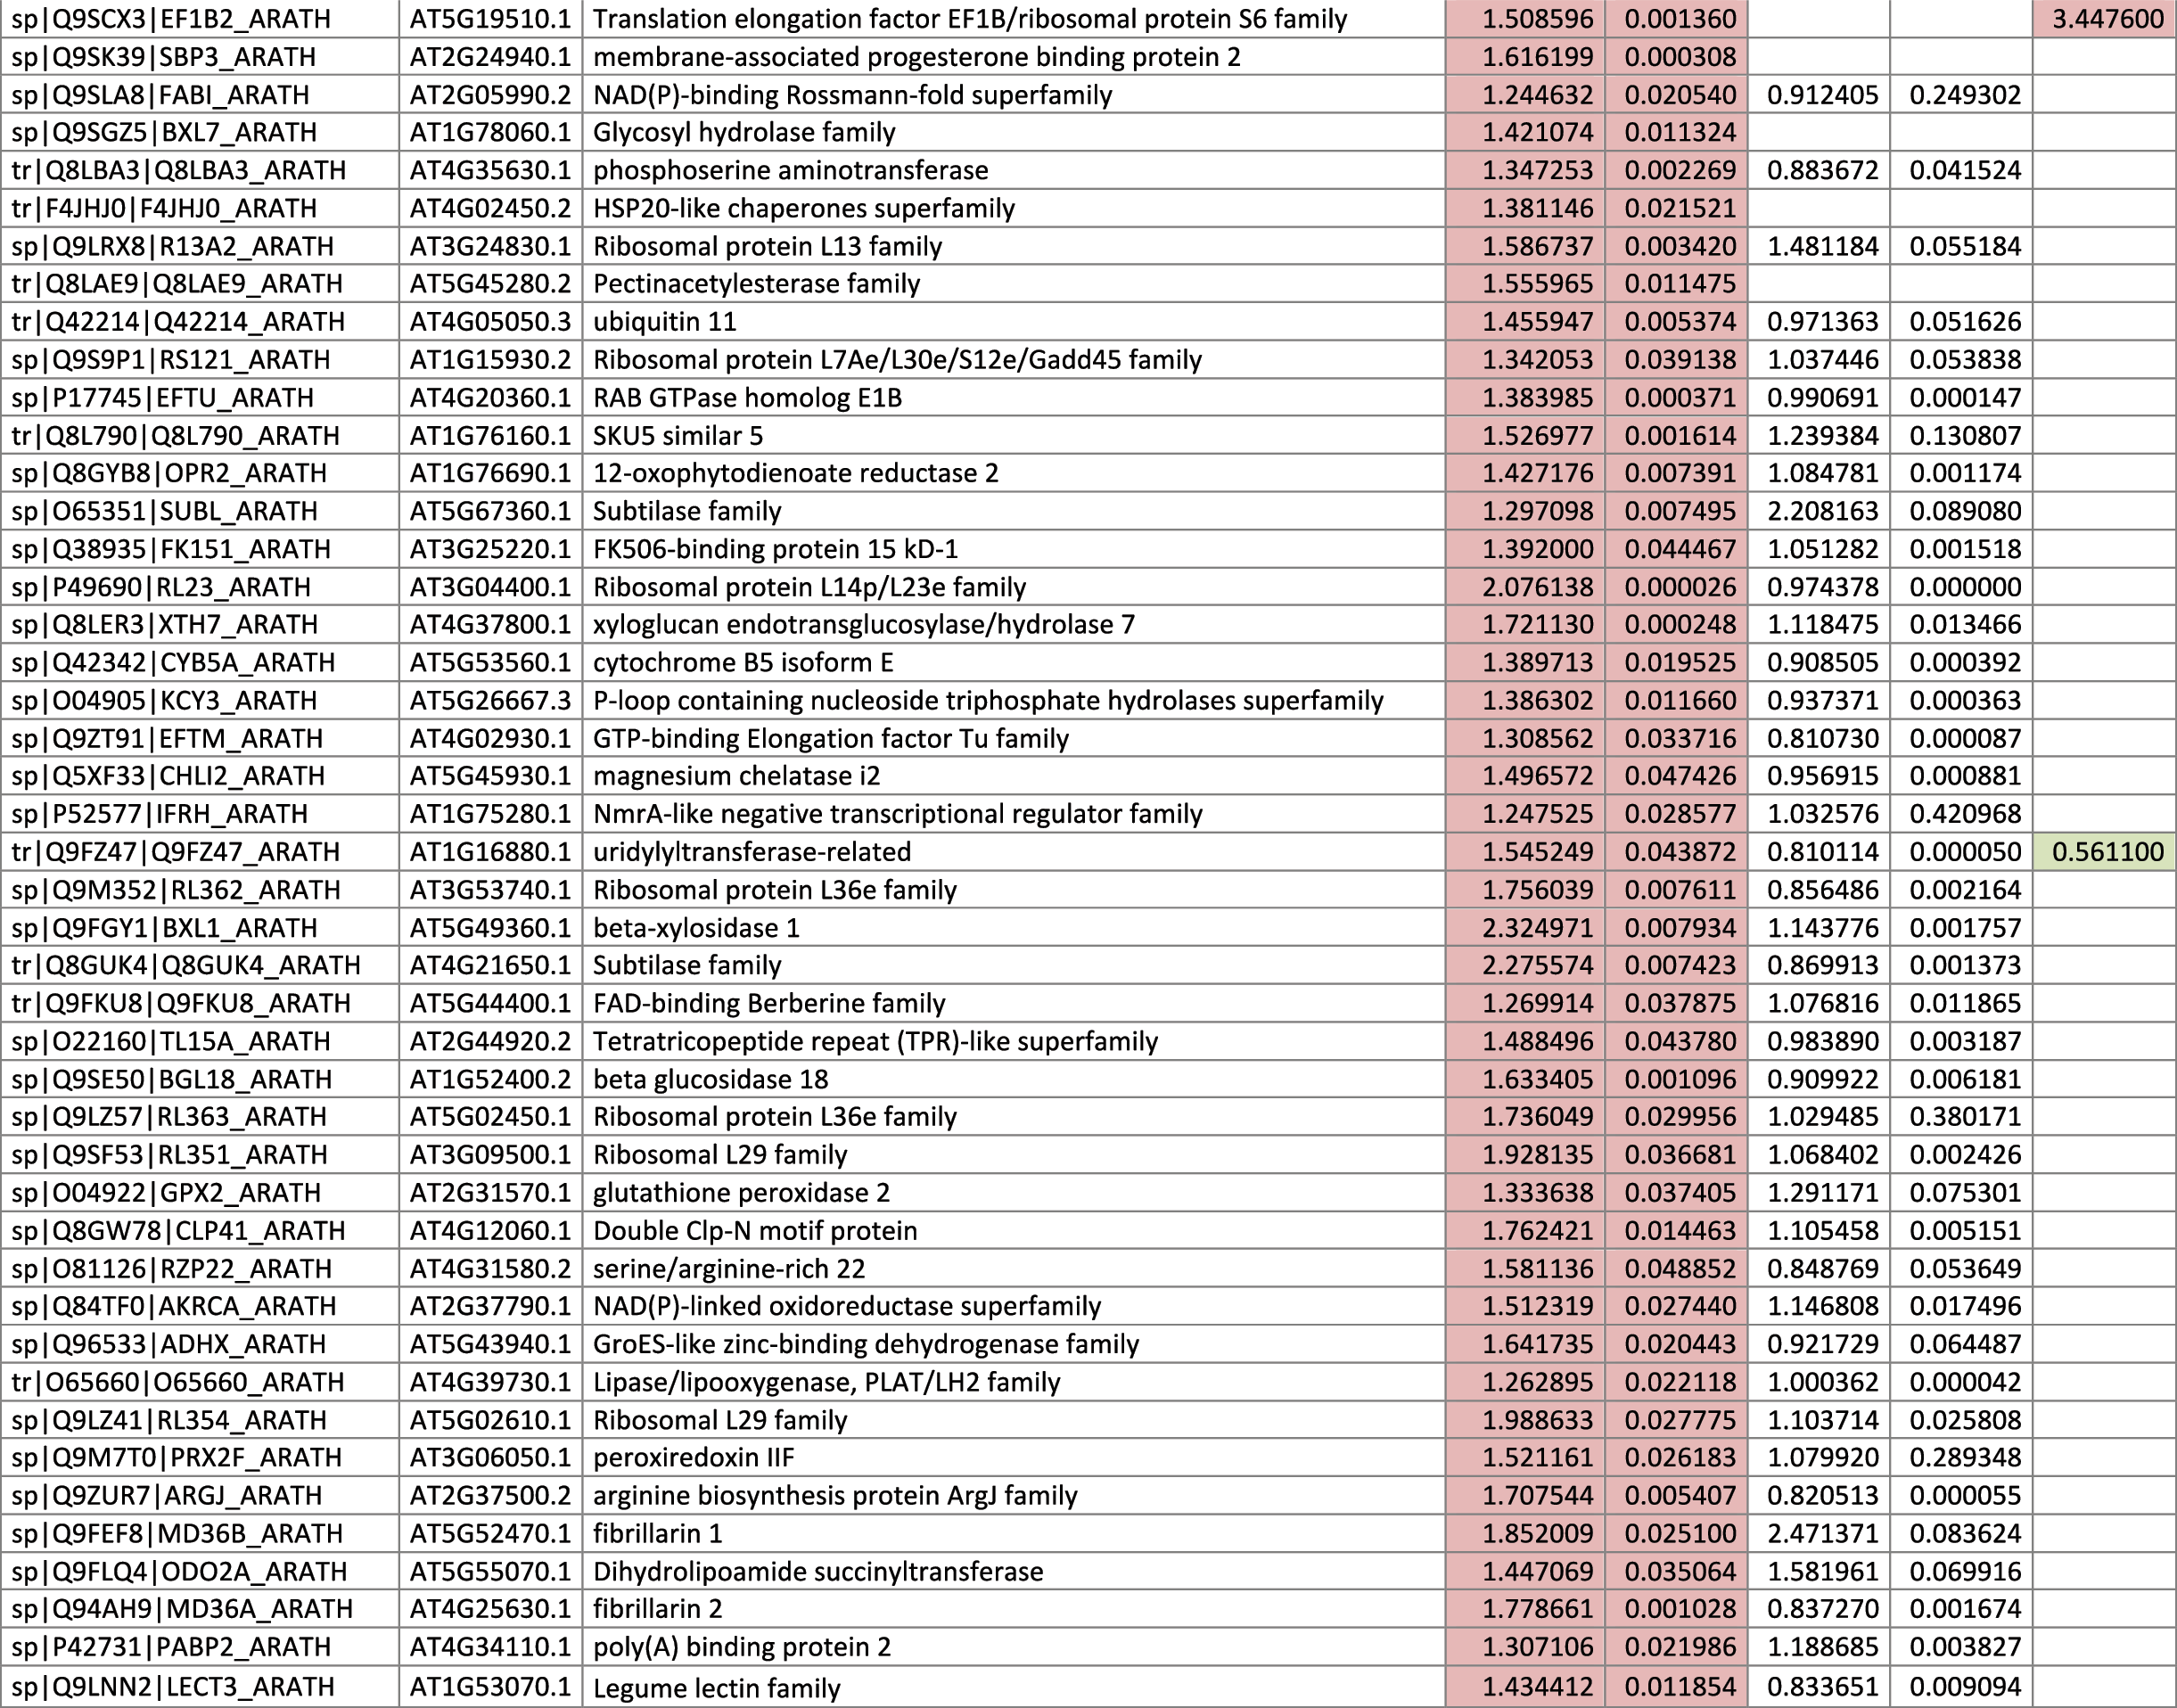
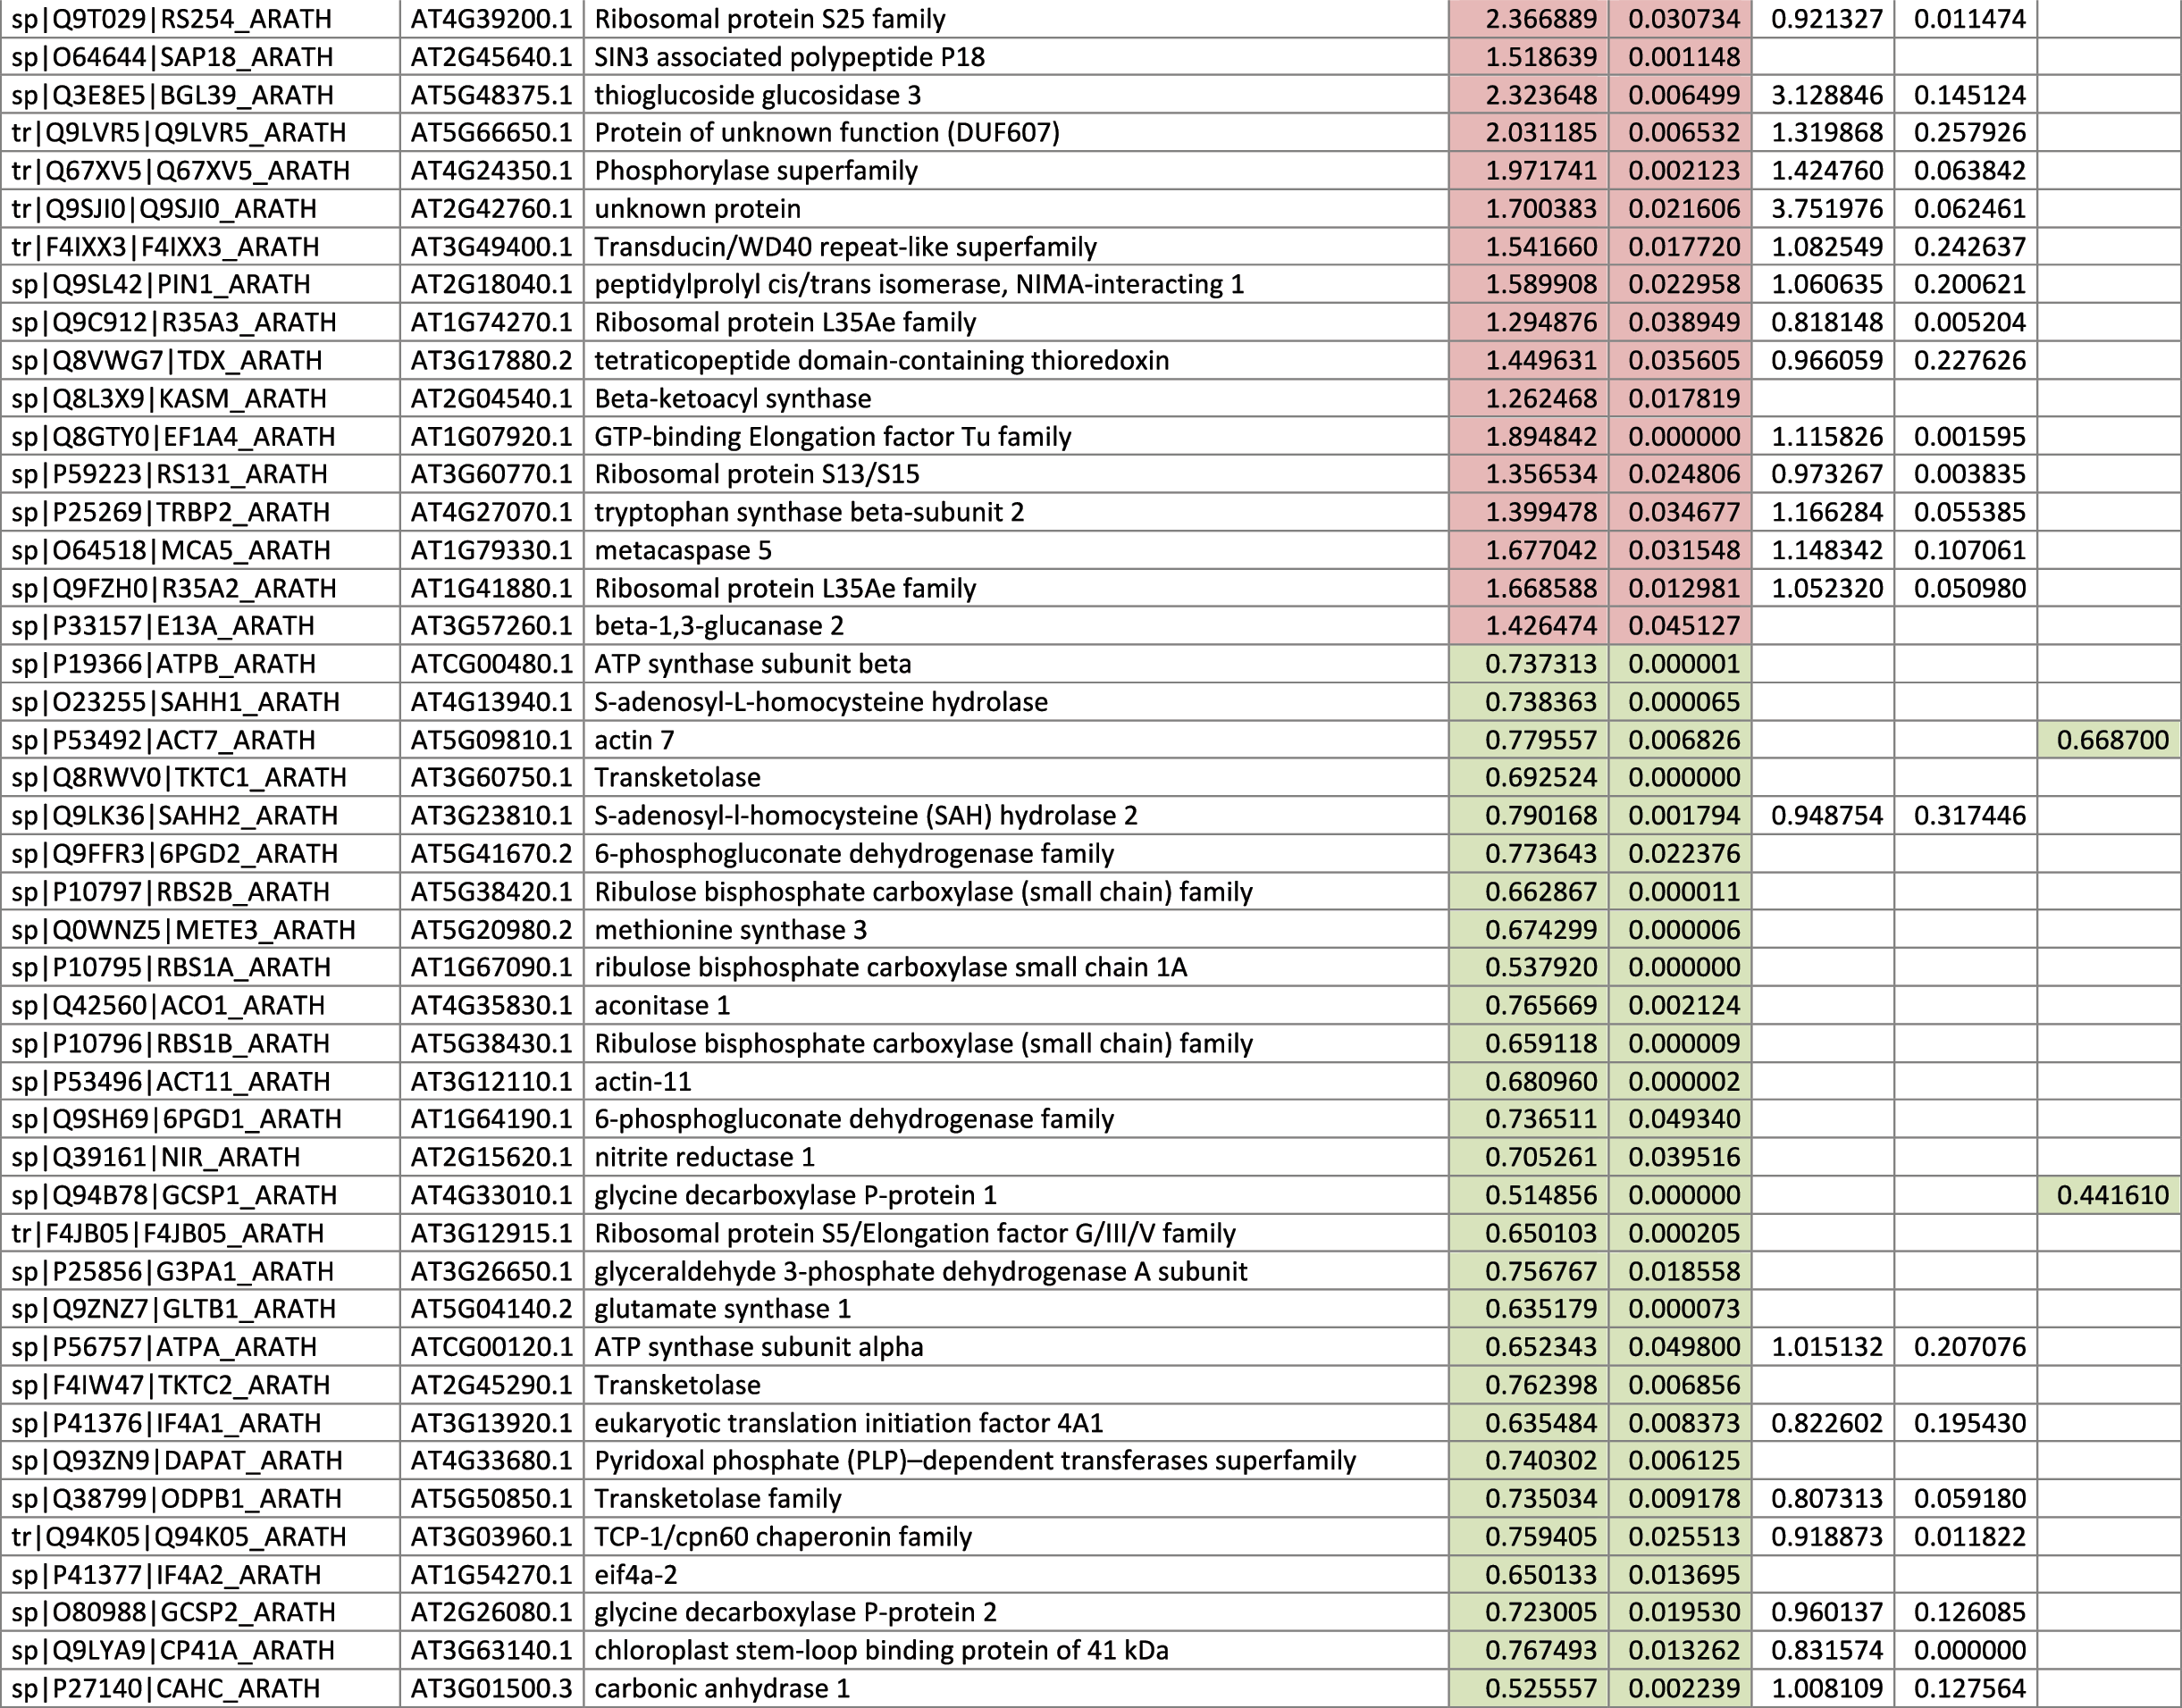
Blank cells indicate that the protein was not present or did not meet quantitation criteria in that sample. Green cells indicate that the protein is more abundant in the spaceflight sample. Red cells indicate less abundant in spaceflight. Where directly correlated by TAIR annotation, the microgravity results from Mazars et al. (2014) are indicated in the last column.
Table 1 is available in color online at
3.3. Functional analysis of proteins differentially abundant in spaceflight
When the proteomic changes were highlighted in global metabolic pathways (
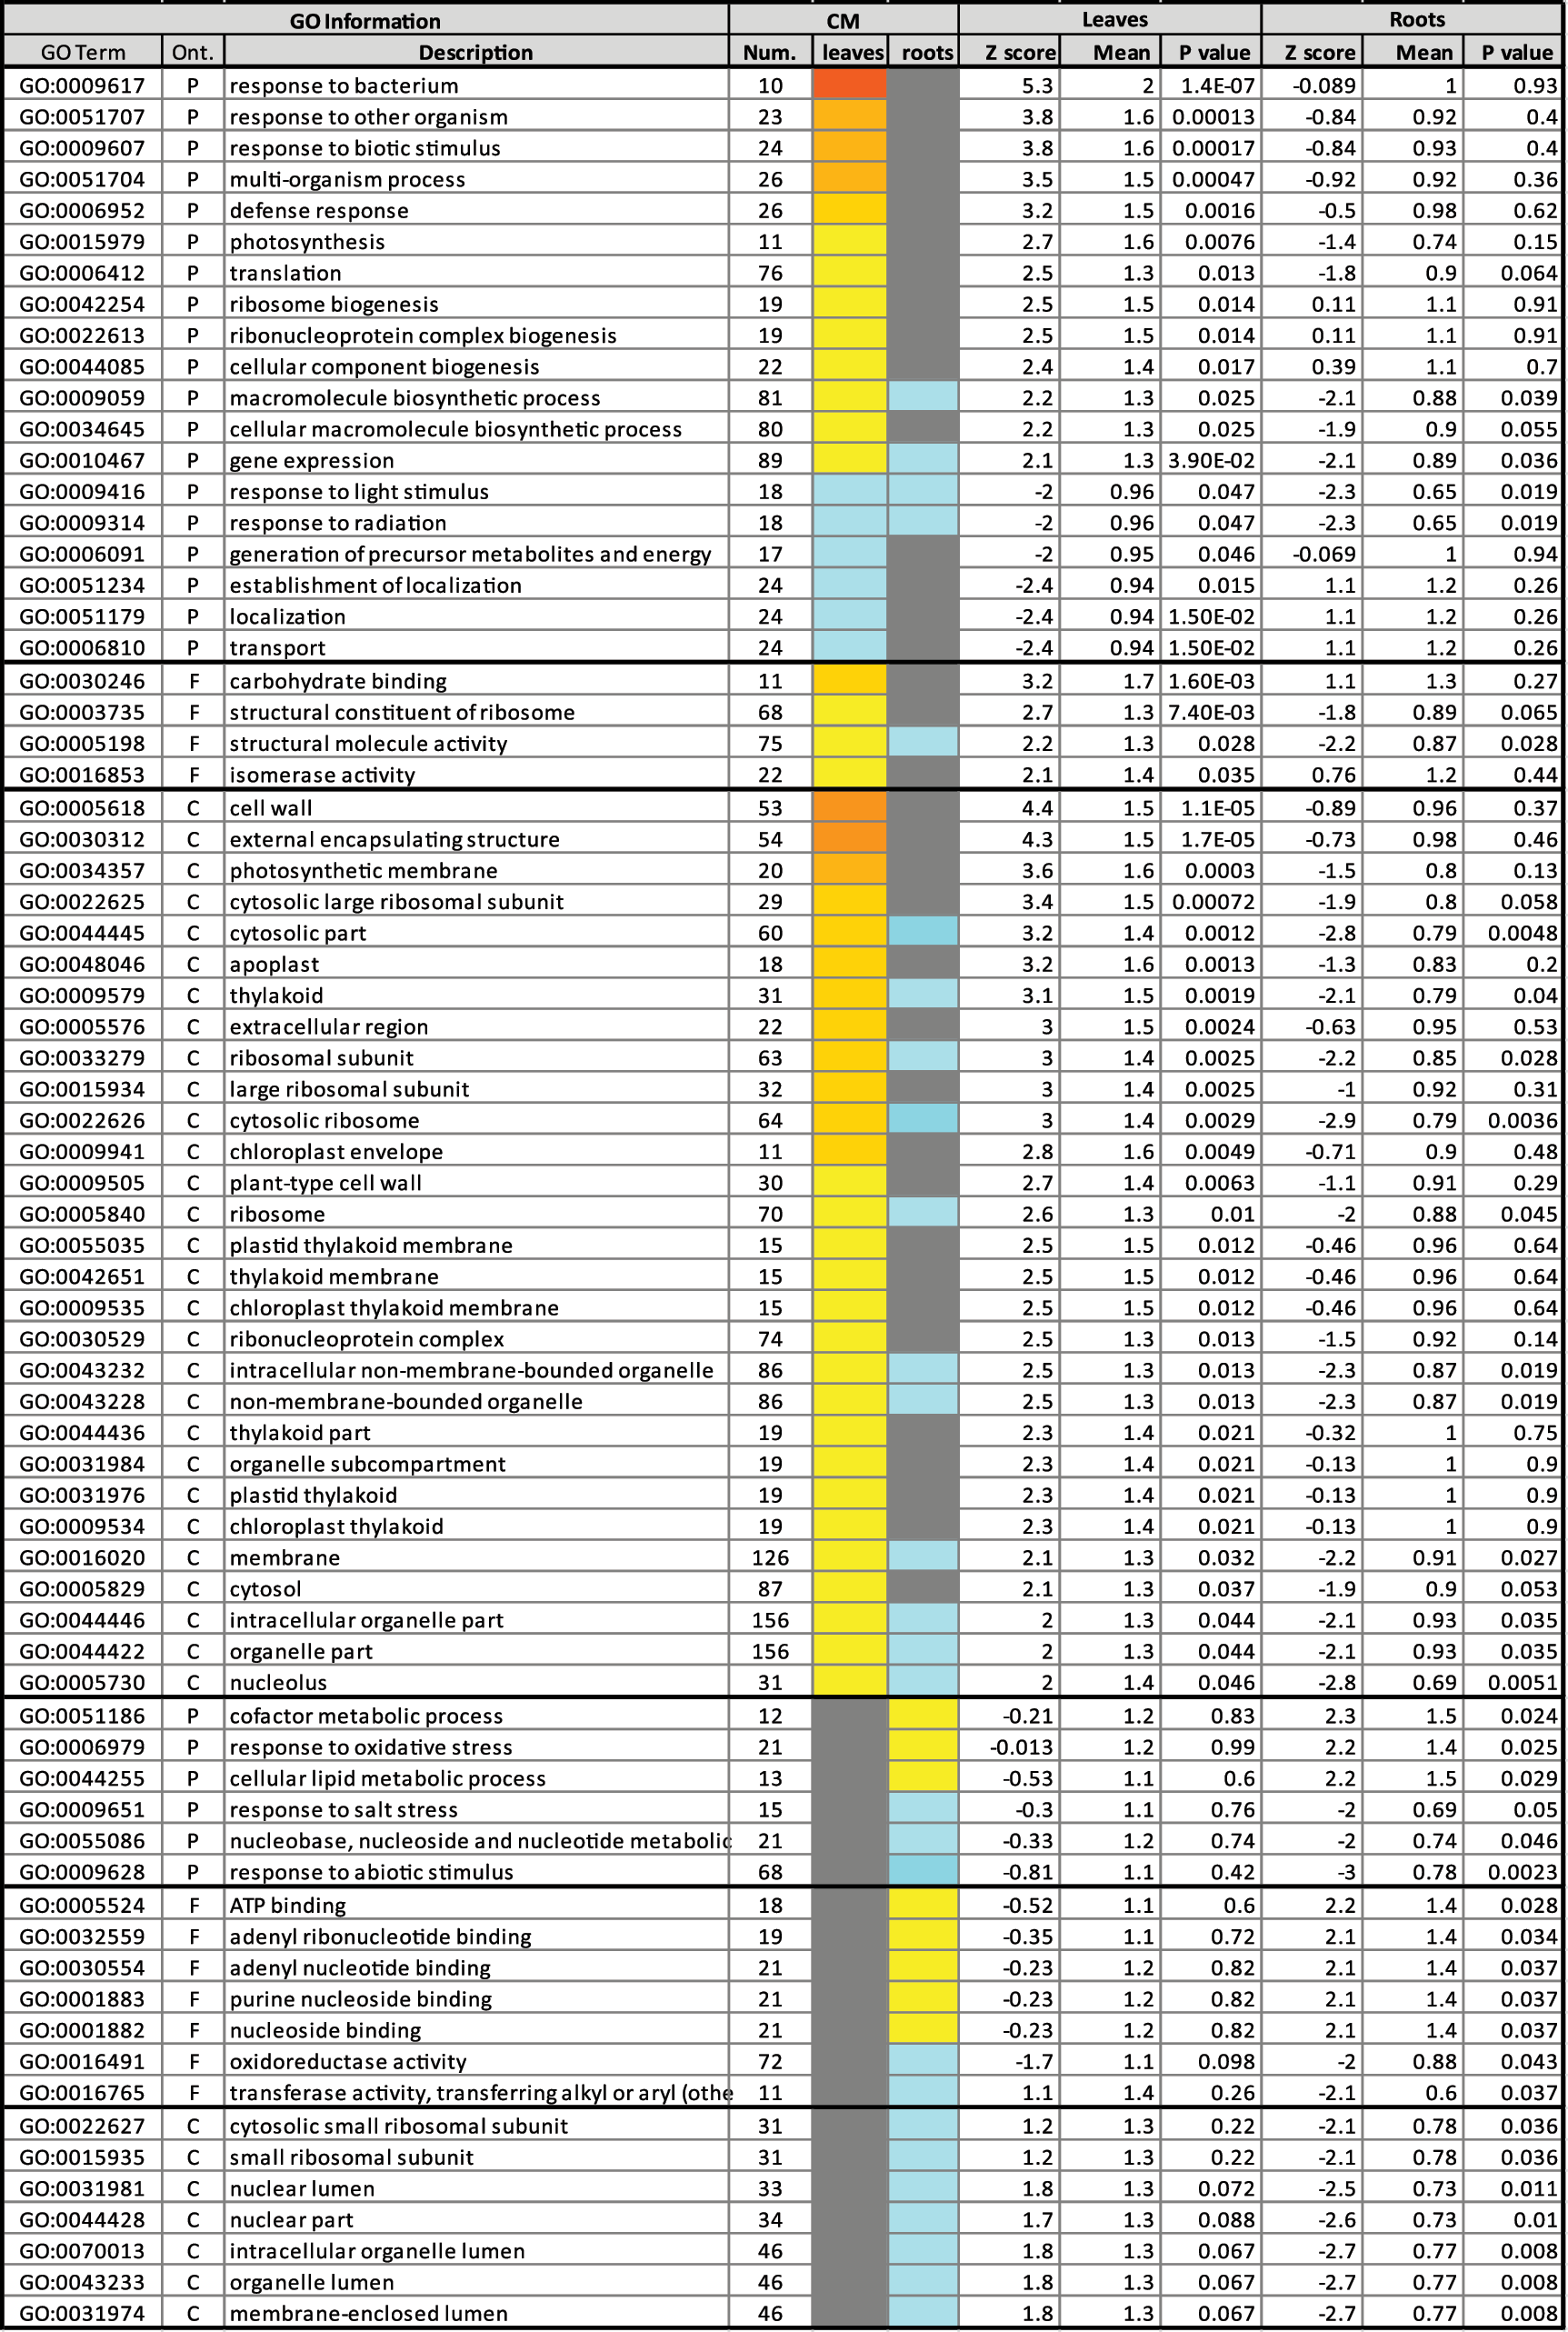
Yellow-to-red and cyan-to-blue color scales in color mode (CM) indicate that the representation of the proteins encompassed in that term is up- or down-regulated as a group in spaceflight samples relative to ground samples, respectively. Gray means no statistically significant difference among the samples. Number (Num.) represents the number of genes included in each GO term. For ontology (Ont.), P, F, and C stand for biological process, molecular function, and cellular component, respectively.
Table 2 is available in color online at
3.4. Comparison of proteomic and gene expression data
The proteomics data presented here were derived from Arabidopsis grown in Run 1B of the TAGES series of plant growth experiments. Gene expression from microarray data are available from Run 3A of the TAGES experiments (Paul et al., 2013), which involved similar-aged plants grown under very similar conditions on the ISS. The 546 differentially expressed proteins of the present study were compared to the 480 genes exhibiting differential transcript levels in the previous study. The genes encoding most of the proteins quantified in this study did not show a differential mRNA expression, and many of the proteins for genes differentially regulated at the mRNA level were not identified in this proteomics survey. A total of 34 genes exhibited differential expression at both transcript and protein levels. Their transcript and protein fold-change values are compared in Fig. 5. Among the genes and proteins that do show differential expression, there is a positive correlation between direction and degree of differential expression (r=0.4901177, p value=0.0003028; r s=0.5087163, p value=0.0001618). To examine the degree of concordance between transcript and protein expression levels, correlation tests for which Pearson's r and Spearman's rho (r s) were used were conducted for a direct comparison of proteins and their corresponding transcript expression levels of 34 genes by using log2-fold change between ground and flight tissues. As shown in Fig. 5, there is a positive correlation in direction and degree of differential expression between transcript and protein expression (r=0.4901177, p value=0.0003028; r s=0.5087163, p value=0.0001618).
3.5. Cell wall metabolism interaction network
An interaction network was constructed to investigate potential functional relationships among the spaceflight differential proteins that are potentially involved in cell wall interactions and metabolisms. Figure 6 shows the results of the interaction analysis with several key collections of proteins highlighted. Physical interactions, shared protein domains, and co-localizations draw nearly all the cell wall–identified proteins of this study into a codified network that links cell wall carbohydrate enzymology with cell-cell interactions and signaling.
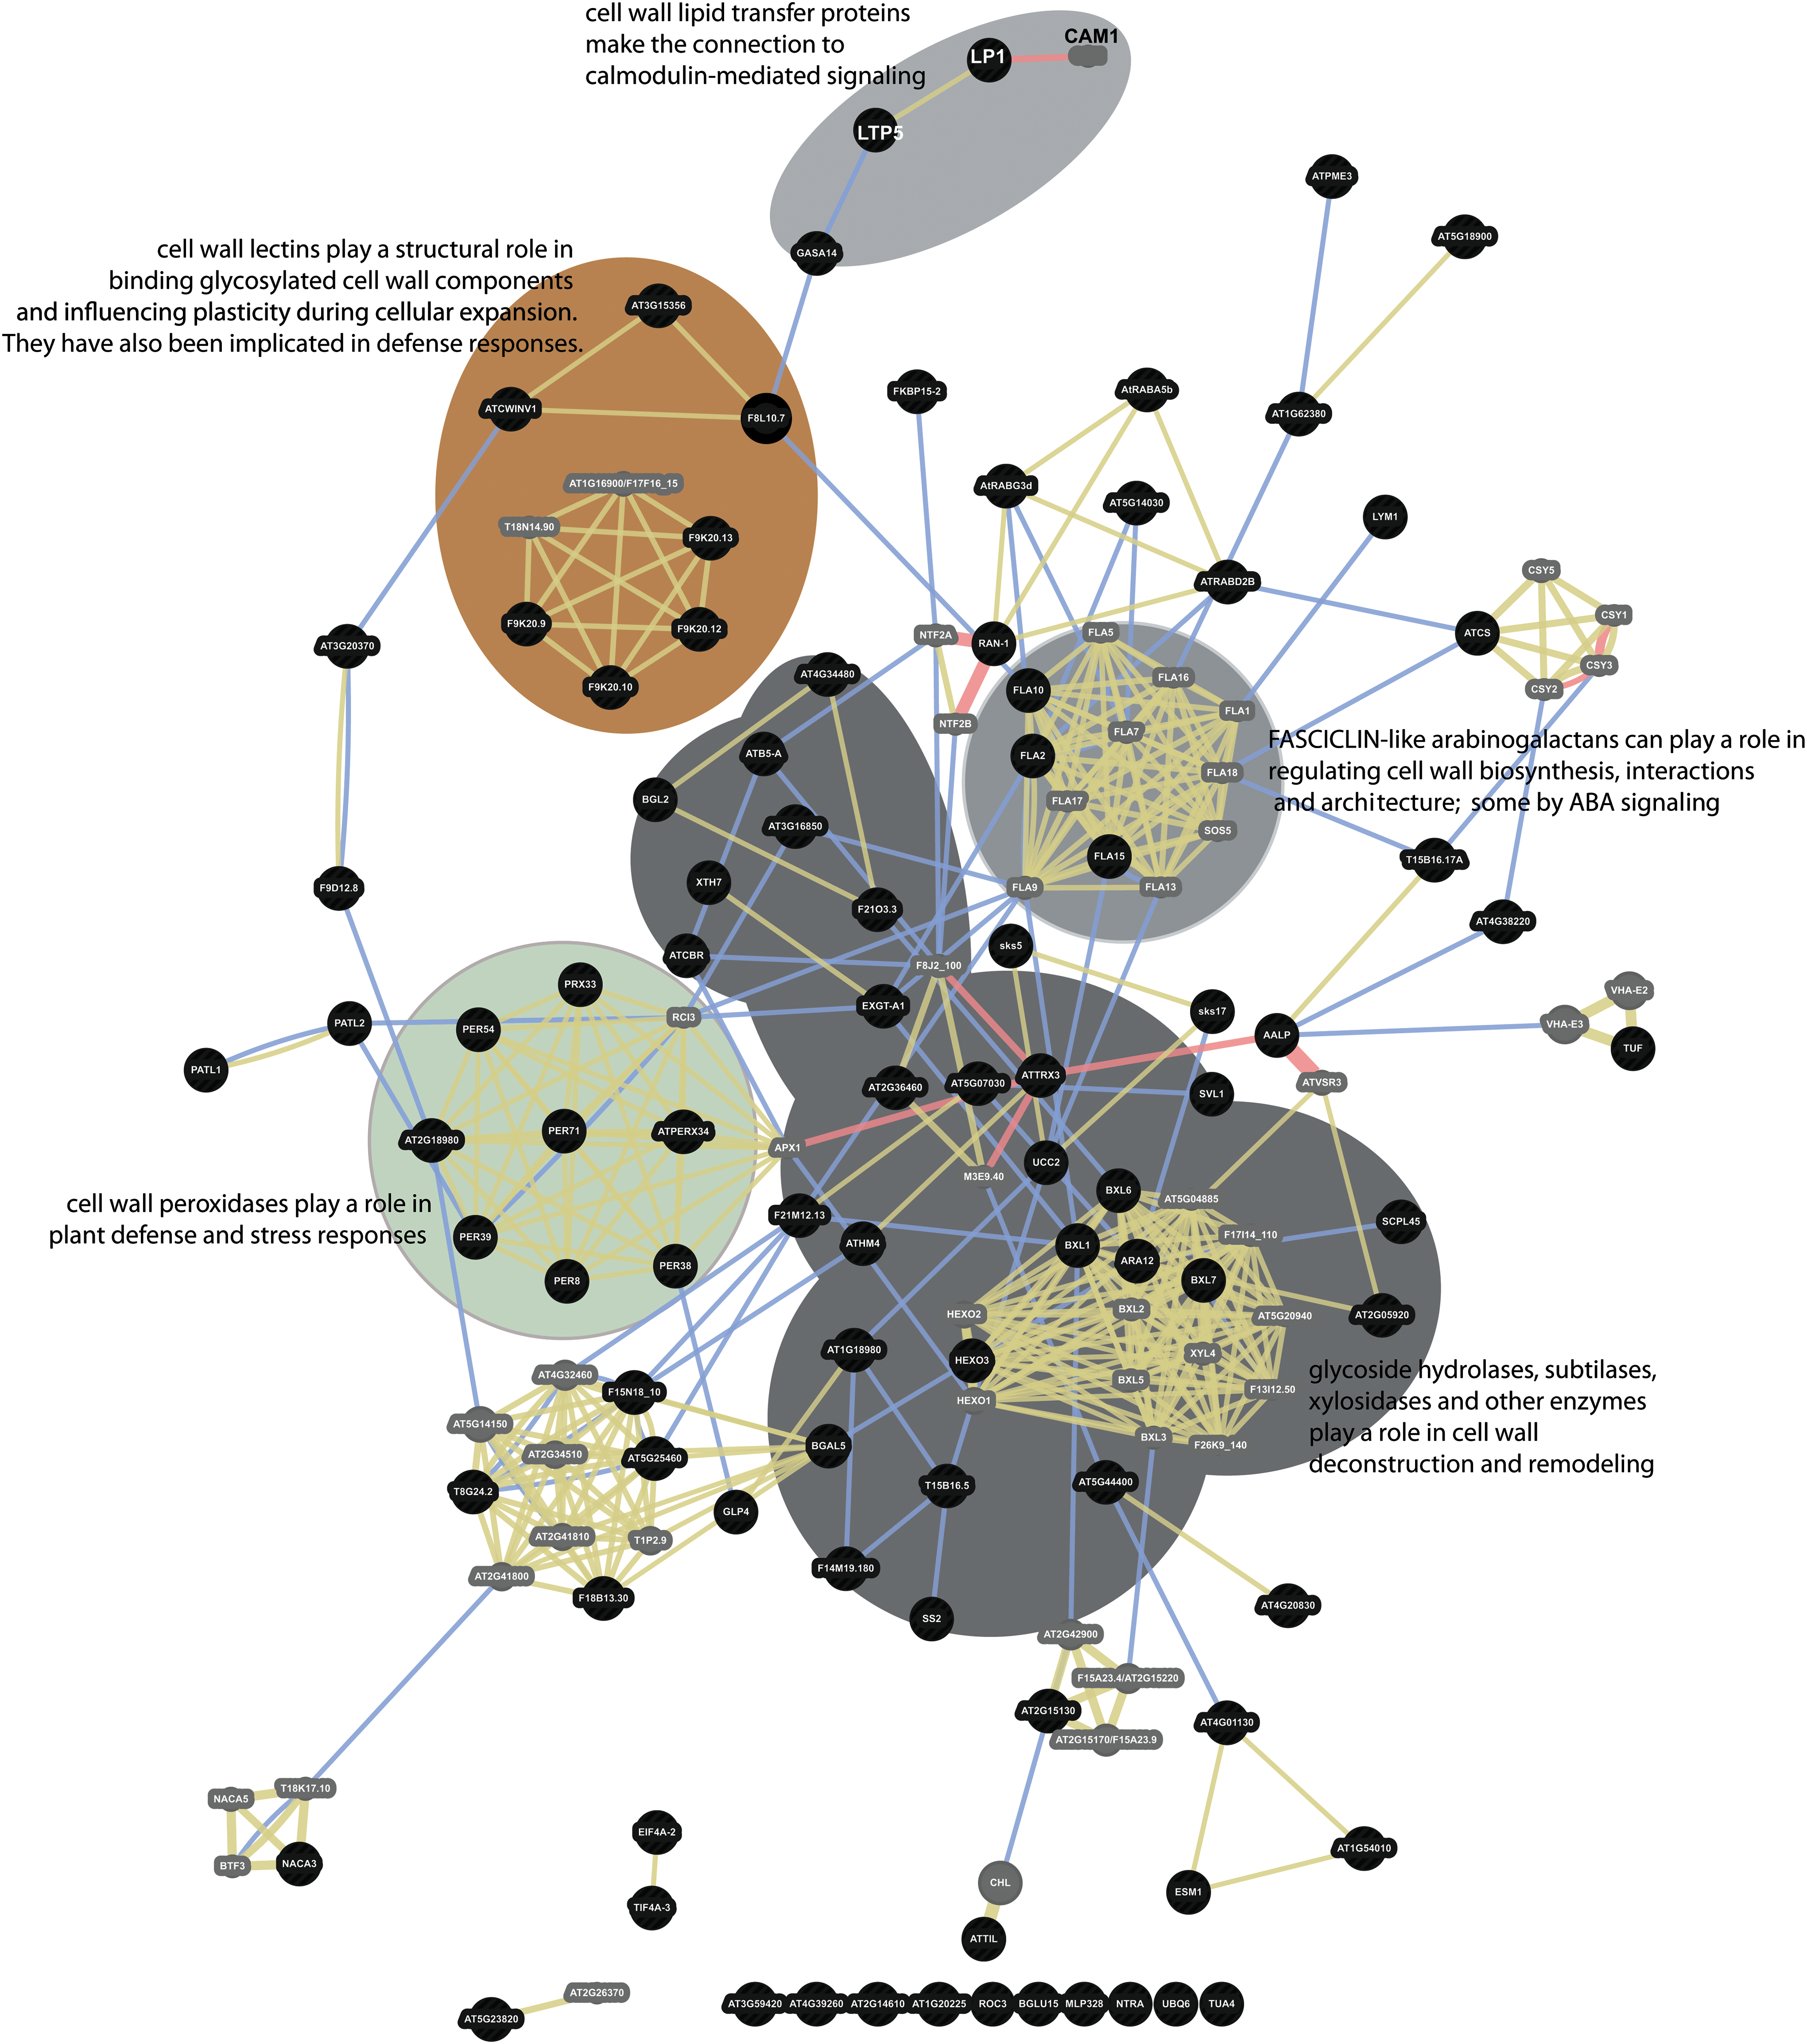
Interaction network of cell wall–related proteins differentially abundant in spaceflight. Ninety-five proteins identified by SUBA3 as having cell wall–related functions were analyzed by GeneMANIA to provide an interaction network to explore the relationships among the cell wall–related proteins. Black circles indicate the positions of the input proteins from this study. Smaller gray circles indicate proteins brought into the network by the software to provide additional connection resolution. Physical interactions are indicated by red connector lines. Shared physical location is indicated by blue connector lines. Shared protein domains are indicated by beige connector lines. The grouping of cell wall peroxidases is highlighted with a green background. Cell wall lectins are highlighted with a brown background. Lipid transfer proteins and signal connections are highlighted with a light gray background. Fasciclins are highlighted with a medium gray background. A dark gray background highlights enzymes with carbohydrate modifying activities. (Color graphics available online at
4. Discussion
The technical goal of this study was to test the feasibility of using RNAlater-preserved plant tissue, harvested and frozen on orbit, for broad-scale proteomics analysis of Arabidopsis spaceflight responses. RNAlater preservation of Arabidopsis within KFTs on orbit is commonly practiced, and a facile process pathway exists for harvesting to RNAlater and frozen sample return from the ISS. RNAlater-preserved plant materials from the ISS have been extensively used for gene expression analyses; however, to date, the use of RNAlater-preserved ISS material for proteomics has been limited to yeast (van Eijsden et al., 2013). The ability to conduct proteomics analyses on the same samples or on parallel samples returning from this established process pathway would advance the analysis potential for understanding Arabidopsis responses to spaceflight.
This study demonstrated that sufficient protein amounts can be isolated from ISS samples preserved in RNAlater to allow broad-scale proteomics studies. Basically, enough protein was recovered from roots and leaves of 12-day-old plants from half a 10 cm2 Petri plate to conduct proteomic analyses rich enough to return the identities of 1570 proteins and to conduct quantitation on 1432 proteins with iTRAQ methods and relying on at least three unique peptides per protein. Moreover, the methods are sufficiently robust that true biological replicates are consistent and can support statistical methods for evaluation of quantitative differences among sample treatments. These RNAlater iTRAQ methods join frozen native sample recovery and non-isotopic methods (Mazars et al., 2014) as methods that have had successful initial application to space proteomics analyses of plants. It is very likely that the rapid advances in MS currently occurring will raise the number of proteins that can be quantitated in similar future studies that use this or any other sample recovery strategy. And as orbital preservation methods mature and are more broadly applied, informative comparative analyses among various species, growth conditions, and experiment protocols on orbit will become increasingly effective.
The proteomic data from this study of three combined Arabidopsis lines support the general notion that plants engage specific metabolic responses to accomplish physiological adaptation to spaceflight, but that response is different among organs (Paul et al., 2013). The primary data supporting this conclusion are shown in Figs. 2 and 4. Of 885 proteins commonly quantified in roots and leaves, only 47 were similarly regulated in the spaceflight leaf and root samples. In contrast, 290 and 288 proteins in roots and leaves were uniquely differentially regulated by spaceflight in either one organ or the other. Moreover, pathway and process analysis of these differentially accumulated proteins indicates that roots and leaves are altering different pathways in response to spaceflight. There appears, broadly speaking, to be no single response at the proteomic level that is employed by all tissues of the plant in order to adapt to spaceflight. There are, however, a few common threads among the data sets.
These data complement results of Mazars et al. (2014), who used a non-isotopic proteomics approach to examine spaceflight microgravity effects on membrane proteins of whole Arabidopsis seedlings. Their study used seedlings that were grown within chambers in the European Modular Cultivation System (EMCS) for 12 days on the ISS, with the entire chambers frozen on orbit to allow recovery of frozen seedlings after return to Earth. Microsomal fractions were prepared from the whole seedlings and subjected to a label-free MS analysis. Thus, their analysis used different tissues, different preservation on orbit, different sample preparation that focused on microsomes, and different MS methods. Mazars and colleagues found that 69 microsomal proteins were specifically more abundant in microgravity (compared to ground and 1g controls), while 80 microsomal proteins were less abundant in microgravity. By using strictly TAIR AGI accession number as the link between their data and the data presented here, there are 23 proteins identified in common between the two studies. More generally, Mazars et al. (2014) concluded that proteins involved in signaling, trafficking, auxin metabolism, stress, and cell wall metabolism are influenced by microgravity, a conclusion that is supported and extended by the study presented here, with auxin signaling and cell wall remodeling being similarly identified here as altered by spaceflight.
Many of the proteins identified here as differentially abundant in spaceflight are associated with auxin metabolism, and a large number are associated with cell wall modification that makes sense in light of the morphologies demonstrated by spaceflight roots (Millar et al., 2011; Paul et al., 2013; Nakashima et al., 2014). Of the differentially represented proteins presented in Table 1, 95 are associated with cell walls or cell wall metabolism either by Gene Ontology annotation or by reference when using SUBA3 searches (Tanz et al., 2013). The interaction network in Fig. 6 shows that most of these cell wall–associated proteins can be considered within a framework of functionally interactive proteins engaged in cell wall activities. There are many enzymes, such as xyloglucan endotransglucosylases, involved in cell wall carbohydrate modification, deconstruction, and remodeling present in the heart of the network (dark gray highlight in Fig. 6) (e.g., Gilbert 2010). The well-represented FASCICLIN-like arabinogalactans (medium gray highlight in Fig. 6) (e.g., Seifert et al., 2014) and a SKU5-like protein are involved in cell shape and cell-cell interactions. For instance, SKU5-similar proteins encode an extracellular glycosylphosphatidylinositol-anchored glycoprotein involved in directional root growth in expanding cells. Mutants in this gene phenocopy the growth patterns seen on orbit in that they over-skew to the left (Sedbrook et al., 2002). FASCICLIN-like arabinogalactans have been shown to positively modulate ABA-regulated root growth patterns in plants exposed to abiotic stress, and it is postulated that they function by interacting with mediators of ABA in a plasma membrane subdomain (Seifert et al., 2014). Fasciclins are typically associated with the outer face of lipid rafts in the plasma membrane via their GPI (glycosylphosphatidylinositol) anchor (Johnson et al., 2003; Demir et al., 2013). Two cell wall–associated lipid transfer proteins are also differentially represented in the differential spaceflight proteome (light gray highlight in Fig. 6). There is strong representation of cell wall peroxidases (green highlight in Fig. 6) (e.g., Bellincampi et al., 2014) and cell wall lectins (brown highlight in Fig. 6) (e.g., Kauss and Glaser 1974; Albenne et al., 2009) in the network, connecting key metabolism, stress response, and cell expansion activities in the network of proteins differentially regulated by spaceflight. There are also a number of proteins that are connected by a domain of unknown function (DUF) deeply involved in cell wall metabolism (lower left in Fig. 6) (e.g., Garza-Caligaris et al., 2012; Vazquez-Lobo et al., 2012).
These proteomics studies offered an initial opportunity to potentially integrate information on spaceflight responses at the protein and mRNA levels in that these samples were derived from very similar grow-outs on the ISS to the transcriptomics studies of Paul et al. (2013). A direct comparison of differential protein levels and their corresponding transcript expression levels does show some correlation. However, only a small portion of the differential transcripts are represented in the differential protein levels, and vice versa. This is, however, in agreement with previous studies in yeast (Futcher et al., 1999; Gygi et al., 1999; Washburn et al., 2003), mice (Tian et al., 2004), Desulfovibrio vulgaris (Nie et al., 2006), E. coli (Ishihama et al., 2005), Tragopogon (Koh et al., 2012), and cotton (Hu et al., 2013), showing that transcript abundances only partially predict protein abundances and that a series of regulatory processes involved in translation, localization, modification, and protein degradation play a substantial role in controlling protein expression (Vogel and Marcotte, 2012). Nonetheless, conclusions based on the proteomics and transcriptomics levels closely interrelate when examining protein name or function as opposed to strict TAIR accession number. The exact same gene/protein may not be represented in the corresponding transcriptome, yet the differential proteome from these samples displays a similar engagement of cell wall remodeling tools in response to spaceflight as seen in the transcriptome from similar samples.
Roots and leaves adapt differently to spaceflight at the level of proteomics. While there are some commonalities among the spaceflight proteome changes in roots and leaves, such as cell wall metabolism, the present data indicate that roots and leaves invoke differential proteome responses to spaceflight. This is consistent with transcriptome data that also indicate differential spaceflight responses in leaves and roots (Paul et al., 2013).
It is likely that, as proteomics technologies as well as gene expression and other omics technologies achieve increased density of coverage and finer spatial resolution, it will be revealed that different cell types within organs respond differently to spaceflight. And as increased numbers of biological experiments are enabled on the ISS, it is likely that multiple approaches will combine to yield both cell-specific response pathways as well as more general principles involved in plant spaceflight adaptation. Cell wall modifications in spaceflight, in addition to or governed by auxin signaling, may be one of those general and recurring metabolic adaptations that may be in common among plants and plant tissues, even if enacted by various proteins and genes that differ among cell types or genotypes.
Footnotes
Acknowledgments
The authors thank the entire line of NASA space biology professionals that made this research possible. This research was supported by NASA grants NNX07AH270 and NNX09AL96G to R.J.F. and A.-L.P. Agata Zupanska, Eric Schultz, and Natasha Sng contributed to the handling of APEX data and samples. The proteomics analyses were conducted within the Proteomics core laboratory of the Interdisciplinary Center for Biotechnology Research at the University of Florida. The proteomics data are available for public access at the PRIDE Archive—proteomics data repository
Disclosure Statement
No competing financial interests exist.
Abbreviations
ABRS, Advanced Biological Research System; FDR, false discovery rate; GFP, green fluorescent protein; GIS, GFP Imaging System; ISS, International Space Station; iTRAQ, isotope tags for relative and absolute quantification; KFTs, Kennedy Space Center Fixation Tubes; MS, mass spectrometry; PAGE, parametric analysis of gene set enrichment.
References
Supplementary Material
Please find the following supplemental material available below.
For Open Access articles published under a Creative Commons License, all supplemental material carries the same license as the article it is associated with.
For non-Open Access articles published, all supplemental material carries a non-exclusive license, and permission requests for re-use of supplemental material or any part of supplemental material shall be sent directly to the copyright owner as specified in the copyright notice associated with the article.