
Abstract
Keywords
Abbreviations
AUDIT, Alcohol Use Disorders Identification Test [1], [2]; CAPS, Clinician Administered PTSD Scale [3]; EM, expectation-maximization; HADS, Hospital Anxiety and Depression Scale [4], [5]; MAR, missing at random; MCAR, missing completely at random; PCL, Posttraumatic Stress Disorder Checklist – Military version [6]; PTSD, posttraumatic stress disorder; RE, relative efficiency statistic [7], [8].
Cross-sectional missing data
Missing data are problematic: incomplete datasets may lead to results that are different from those that would have been obtained from a complete dataset. Where there is missing data the missing values can be imputed using the technique that minimizes these differences. This paper focuses on cross-sectional missing data, which is where there is missing data at a particular timepoint. For a discussion of missing data in longitudinal studies our companion paper should be consulted [9].
Despite recent advances in understanding missing data and imputation methods most researchers still report listwise deletion, perhaps because of a lack of adequate guidelines for handling missing data [10]. Most clinical researchers are familiar with the more common strategies, such as listwise or pairwise deletion and mean substitution that are readily available in statistical packages, such as the Statistical Package for the Social Sciences (SPSS) [11]. Those who are proficient in data analyses may use more complex methods, such as regression or ‘hot deck’. Others may use statistical packages, such as Mplus [12] or AMOS [13], which include sophisticated approaches, such as the expectation-maximization (EM) algorithm [14] or multiple imputation [15].
This paper provides guidelines for several commonly used and easy to calculate missing-value procedures. The intention is to inform those with limited statistical familiarity about the merits of different strategies.
Cross-sectional missing data occur for several reasons. There may be errors in the data or the data collection process may be inadequate (e.g. where a single page is missing from a particular questionnaire). Participants may refuse to provide data for reasons such as fatigue or the sensitive nature of the information. Finally, researchers may have adopted designs that involved planned missing data, such as surveys where some respondents are asked most questions but others are asked different questions.
The different reasons formissing data give rise to different types of missing data. Generally, there are two important types described by Little and Rubin [16] and Schafer [17] as ignorable and non-ignorable. Non-ignorable is where the probability of a missing datum is dependent upon its value and ignorable missing data is where the probability of a missing datum is not dependent upon its value.
There are three forms of ignorable missing data. The first is associated with sampling. Because in most situations it is neither efficient nor possible to obtain data from a whole population, probability sampling is widely used to obtain a representative population sample. This form of missing data is not considered further. The second form of ignorable missing data is missing at random (MAR) [18], [19] or recoverable [20]. Missing at random occurs where the pattern of missingness for a particular variable (Y) may vary for subsets. For example, MAR may occur if an item is more likely to be completed by men than women. A third form of ignorable missing data is missing completely at random (MCAR) [19], [21], where the missingness occurs at random across the whole dataset. For example, if one questionnaire accidentally had a page missing, the resultant missing values would be MCAR.
Non-ignorablemissing data occurs where the pattern of missingness is such that the missing values of Y cannot be reliably predicted from other dataset variables. This may be caused by an underlying process that leads to bias in the observed data [22], [23]. For example, where a respondent dislikes an interviewer and refuses to answer questions.
Even if the ‘true’ ignorability status of intermittent missing data is unknown, most missing data are recoverable through imputation [20], [24]. This is the position adopted for the present paper which examines the impact of various approaches to handling cross-sectional missing data.
This paper has been written to assist clinicians and researchers who have a basic understanding of missing data techniques. To achieve this, four strategies have been adopted. First, there are no complex algebraic notations. More mathematically and statistically comprehensive descriptions of missing-value approaches can be found elsewhere [25–29]. Second, in the main the approaches are those that clinicians and researchers are likely to be familiar with. Third, the present study uses ‘real’ data collected during clinical treatments rather than simulations [30]. Finally, the t-test is used as the basis for assessing the utility of the various missing data approaches.
Approaches for handling intermittent missing data
Six procedures for handling cross-sectional missing data are considered: listwise deletion; item (or vertical) mean substitution; two levels of person (or horizontal) mean substitution; regression imputation; and ‘hot deck’ substitution. Hair et al. [22] describe listwise deletion, mean substitution and regression imputation techniques. Hot deck imputation is explained succinctly by Fayers and Machin [31]. Two other state-of-the-art approaches are the EM algorithm [14] and multiple imputations [15]. Because these are relatively complex we have not included them in the data analyses although we provide brief descriptions.
Listwise deletion is the simplest procedure and is the default in many statistical packages [10]. This removes a case (case i) from an analysis if a datum is missing for case i on any variable that is included in the analysis [23]. The main concerns for listwise deletion are the loss of data that may have been time-consuming or difficult to collect, the reduction in sample size and the resulting bias in variance estimates (e.g. standard deviation).
Mean substitution takes two forms. In itemmean substitution, a missing value for case i on variable Y (hereafter Yi) is replaced by the mean value of all other participants that have a valid value for Y [32]. Where other information is not available, Tabachnick and Fidell [10], p. 62] regard the mean as the ‘best guess’. Item mean substitution is conservative because the sample mean does not change. However, the variance is underestimated. For the second form, person mean substitution [32], the imputed value for a variable with missing data is derived from the non-missing items for the case. Consider where a scale score (Y) is summed from 10 items (Y1, Y2,…, Y10) and, for case i, Yi3, Yi6 and Yi7 are missing. The value for Yi (i.e. Y for case i) is calculated:

The implicit assumptions are that: (i) the item response ranges are the same for all items (for a discussion see Curran et al. [23]); (ii) the missed items would have had the same values as the mean of the non-missing items; and (iii) that each item makes an equal contribution to the overall scale score. Personmean substitutions may lead to reduced variances. Obviously this has limited application where single variables are used (e.g. gender) or where all scale items are missing.
Regression imputation uses the relationship between two or more variables such that a missing value of Yi is estimated from the overall relationship between Y and other dataset variables. However, it reduces residual variance and assumes that other dataset variables have strong relationships with the variable of interest. For regression imputation, a missing value of Yi can be estimated from the relationship between Y and one or more conceptually different variables (e.g. X1, X2,…, Xp) measured at the same time. For the present study, the univariate regression imputation procedure uses a single independent variable.
The hot deck procedure selects a substitute value from another participant in the dataset (the deck). The deck may be selected according to one or more characteristics of case i for whom an imputed value is required. Consider where case i is missing data for the variable of interest (Yi) and has a value of ‘1’ for the dichotomized independent variable. The deck would constitute all valid values of Y for which cases have a value of ‘1’ for the independent variable. A substitute value for Yi would be selected at random from this deck. In the present study two decks are used; one for each level of another variable in the dataset (dichotomized Alcohol Use Disorders Identification Test (AUDIT) scores; see Method section).
The EMapproach, strictly, is not an imputationmethod, rather it estimates parameters for datasets with missing data. An iterative two-step (E-step and M-step) process is used. In the E-step, the missing data are estimated using a function (such as the normal distribution). The M-step then uses the (now) complete data to calculate parameters (e.g. means, standard deviations and regression coefficients). This process is iteratively continued until the change in the parameter estimate is below a specified minimum criterion. Unfortunately, descriptions of the EM algorithm are usually complex, although Bilmes [25] has constructed ‘A gentle tutorial of the EM algorithm’. Other useful references can be found in Enders [33], Little [28] and Meng and Rubin [34].
Finally, multiple imputation [15] builds, to some extent, on other missing data methods. It uses Monte Carlo simulation to produce a number (usually less than 10) of complete datasets derived from the initial dataset with missing values. These datasets are then analysed separately. This yields multiple parameter estimates which are combined to produce means and confidence intervals which reflect the uncertainty from the missing data in the original dataset. Further descriptions can be found in Schafer [29] and Schafer and Olsen [24].
Aim of the present study
Six missing-value procedures are compared in terms of the closeness of the average t-test values to the t-value for the full dataset. Several different percentages of missing data are tested. This illustrates differences between the techniques, thus enabling readers to make informed judgements about the approaches they should adopt when confronted with cross-sectional missing data.
Method
Participants
The participants were 1200 Australian male Vietnam veterans with a posttraumatic stress disorder (PTSD) diagnosis who were consecutive admissions to the Australian Department of Veterans' Affairs accredited PTSD treatment programs. The average intake age was 52.10 years (SD=4.89), 81% were married. Eighty-five per cent had served in the army, 10% in the navy and 5% in the air force. The mean level of clinically assessed PTSD, using the Clinician Administered PTSD Scale (CAPS) [3], [35], was 82.72 (SD=16.81).
Measures
The measures used in the study constitute a small component of a battery of instruments completed at program intake. Because the study was statistical in nature, the measures were selected more by reasons of convenience than by any substantive research question. Only those instruments used in this study are described. More details can be found in Creamer et al. [36].
The dependent variablewas the Posttraumatic Stress Disorder Checklist – Military version (PCL) [6] completed by the veterans at intake. The PCL comprises 17 items each scored on a five-point Guttman-type scale [37] from 1 (not at all) to 5 (extremely). Possible scores range from 17 (a low level of stress) to 85 (a high level of stress).
The second measure used was the AUDIT [1], [2], measured at intake. It comprises 10 items each measured on a Guttman-type scale. The first eight are scored from 0 to 4. Items 9 and 10 are initially scored on a scale with 0, 1 and 2, but rescaled to 0, 2 and 4. Possible scores range from 0 (low alcohol use) to 40 (high alcohol use). AUDIT scores were dichotomized using a median split to 0 (low alcohol use) and 1 (high alcohol use) thereby ensuring approximately 50% of cases in each group of the complete dataset. This was the independent variable in the t-tests.
The final measure used was the anxiety subscale of the Hospital Anxiety and Depression Scale (HADS) [4], [5]. It was chosen because it had the highest correlation with the PCL of any scale in the full dataset (r=0.59). It consists of seven items each measured on a Guttman-type scale from 0 to 3. Possible scores range from 0 (low anxiety) to 21 (high anxiety). The anxiety subscale was used in the regression imputation procedures.
Data analyses
Data analyses comprised the comparison of two sets of t-values. The first set were calculated where none of the data were missing. This produced a set of ‘true’ t-values. The second set were calculated for the same data, but where various percentages of the data were randomly made missing. In five of the six methods (all but listwise deletion), the missing values were imputed. For listwise deletion, t-values were calculated for the data that had not been made missing (i.e. the data remaining in the dataset). In all cases, only the PCL scores were made missing. Mean t-values were calculated for each of the six missing data procedures. For each procedure, three different levels of missing data were investigated: 20, 40 and 60%. For person mean substitution, the PCL values were made missing by randomly making some of the 17 PCL items missing. Two levels of missing items were used; nine (i.e. where eight items were present) and 13 items missing (i.e. where four items were present). In addition, the analyses were carried out for randomly selected samples of 25, 50, 100, 200 and 400 cases.
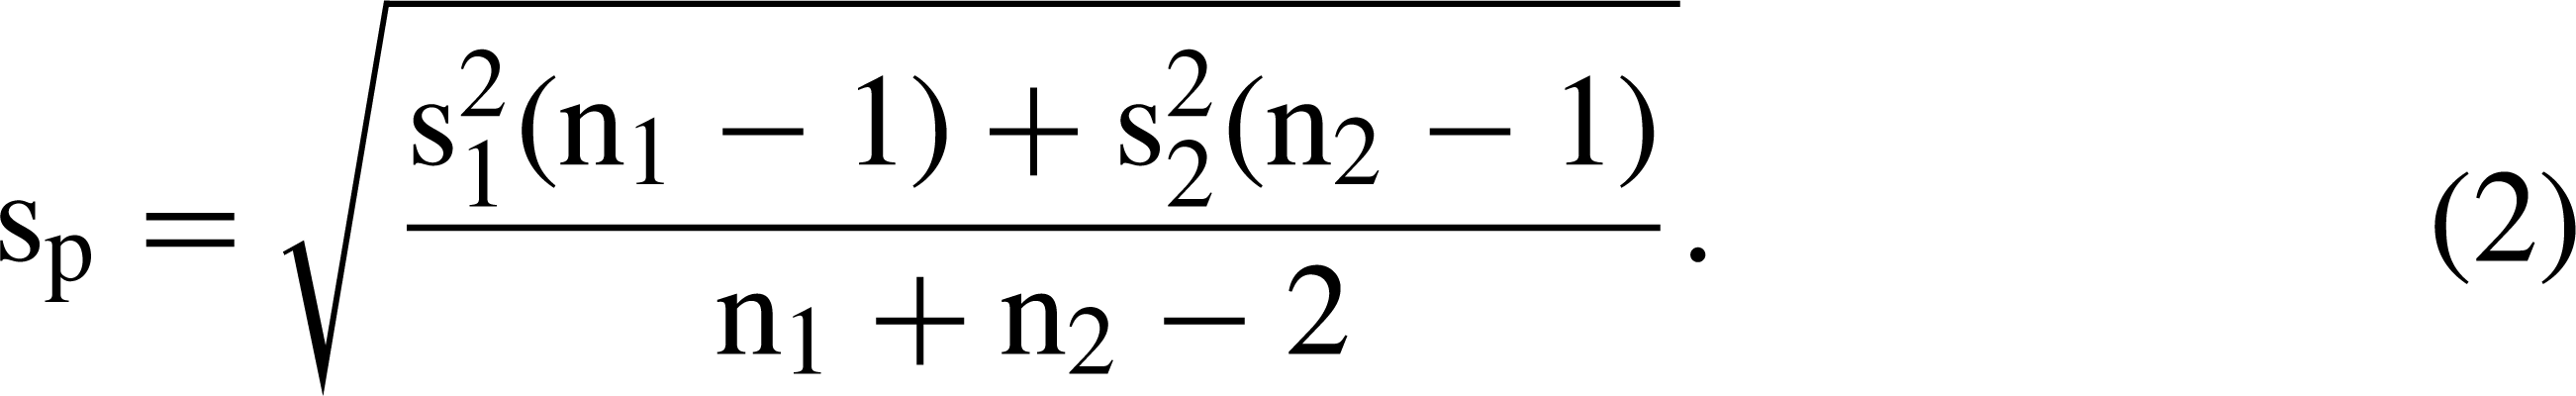
The t-test was used because it is a commonly used procedure which provides opportunities to understand the reasons for different results. The formula for the t-test is
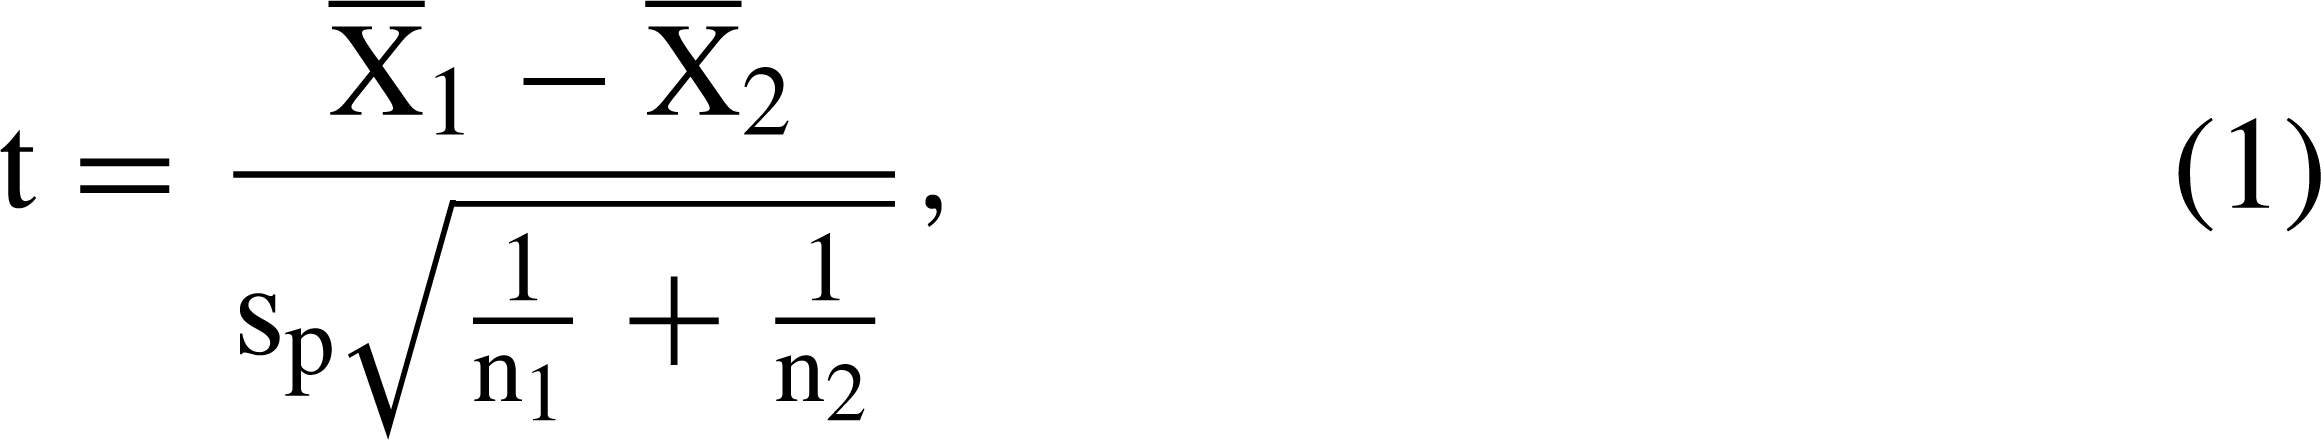
Higher t-values are associated with: (i) greater differences between group means (); (ii) larger sample sizes (n); and (iii) less variation between scores. It is likely that differences between means varied with both changes in sample size and missing data proportions because different participants were included in different t-tests. Hence, it is important to compare the mean values for different methods and levels of missing data both within a particular sample size as well as across particular sample sizes. It is possible that a missing data procedure will work better than others depending upon the particular levels of missingness with particular sample sizes. We were interested in the overall performance of the procedures.
In order to ensure parameter stability, for each combination of sample size, percentage of missing data and missing data procedure, the analyses were repeated 1000 times as an independent block of runs. Hence, the tables in the ‘Results’ section report the mean t-values for each combination of test conditions for each of the missing data approaches over the 1000 runs.
For the regression imputation, PCL scores at intake were regressed upon the HADS anxiety subscale scores.
To compare the different procedures, the difference between the true t-value and the mean obtained t-values for each specification's runs was computed. Average means were obtained and the results used to compute a modified variation of the relative efficiency (RE) statistic [7], [8]:

Results
The true t-value and the mean t-values using the six different missing data procedures are presented in Table 1.
True t-values and mean t-values for six intermittent missing data methods
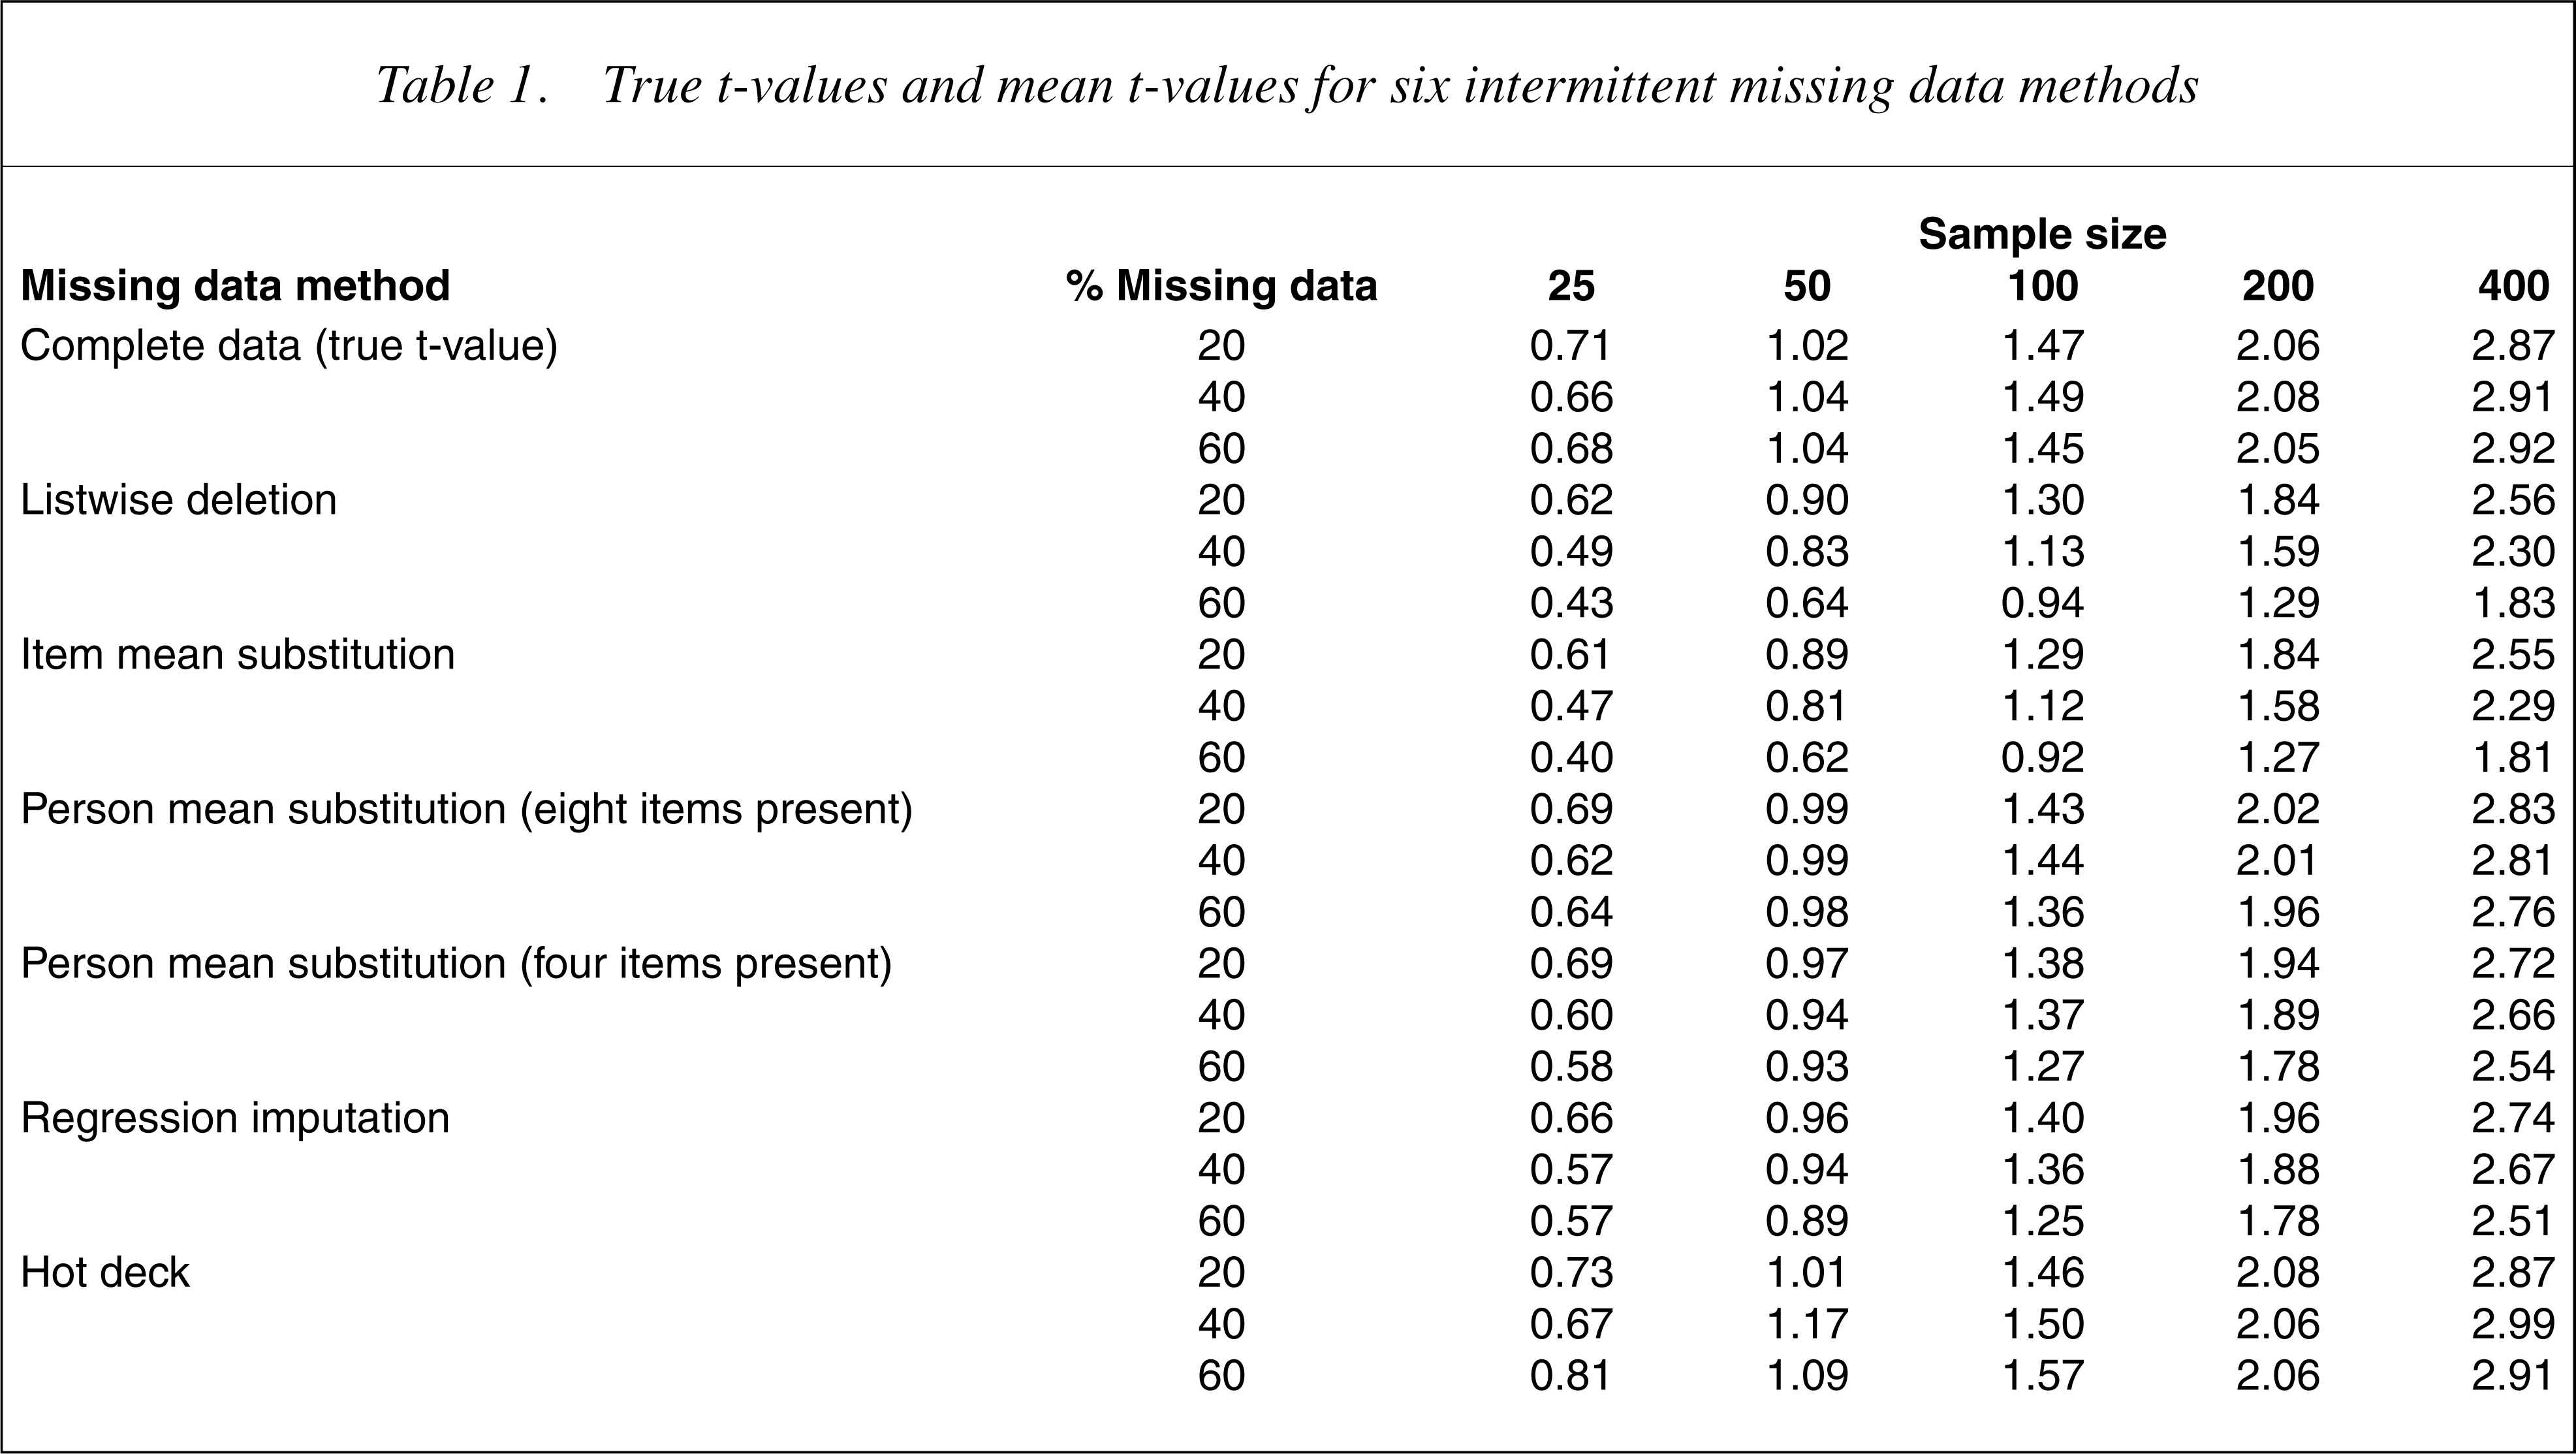
Table 2 shows the rankings of the procedures for each combination of sample size and percentage of missing data in terms of the closeness of the estimated t-values to the true t-values. A lower ranking indicates that the t-value estimated by the missing data method was closer in magnitude to the true t-value.
Rankings of six intermittent missing data procedures in terms of closeness to the true t-values
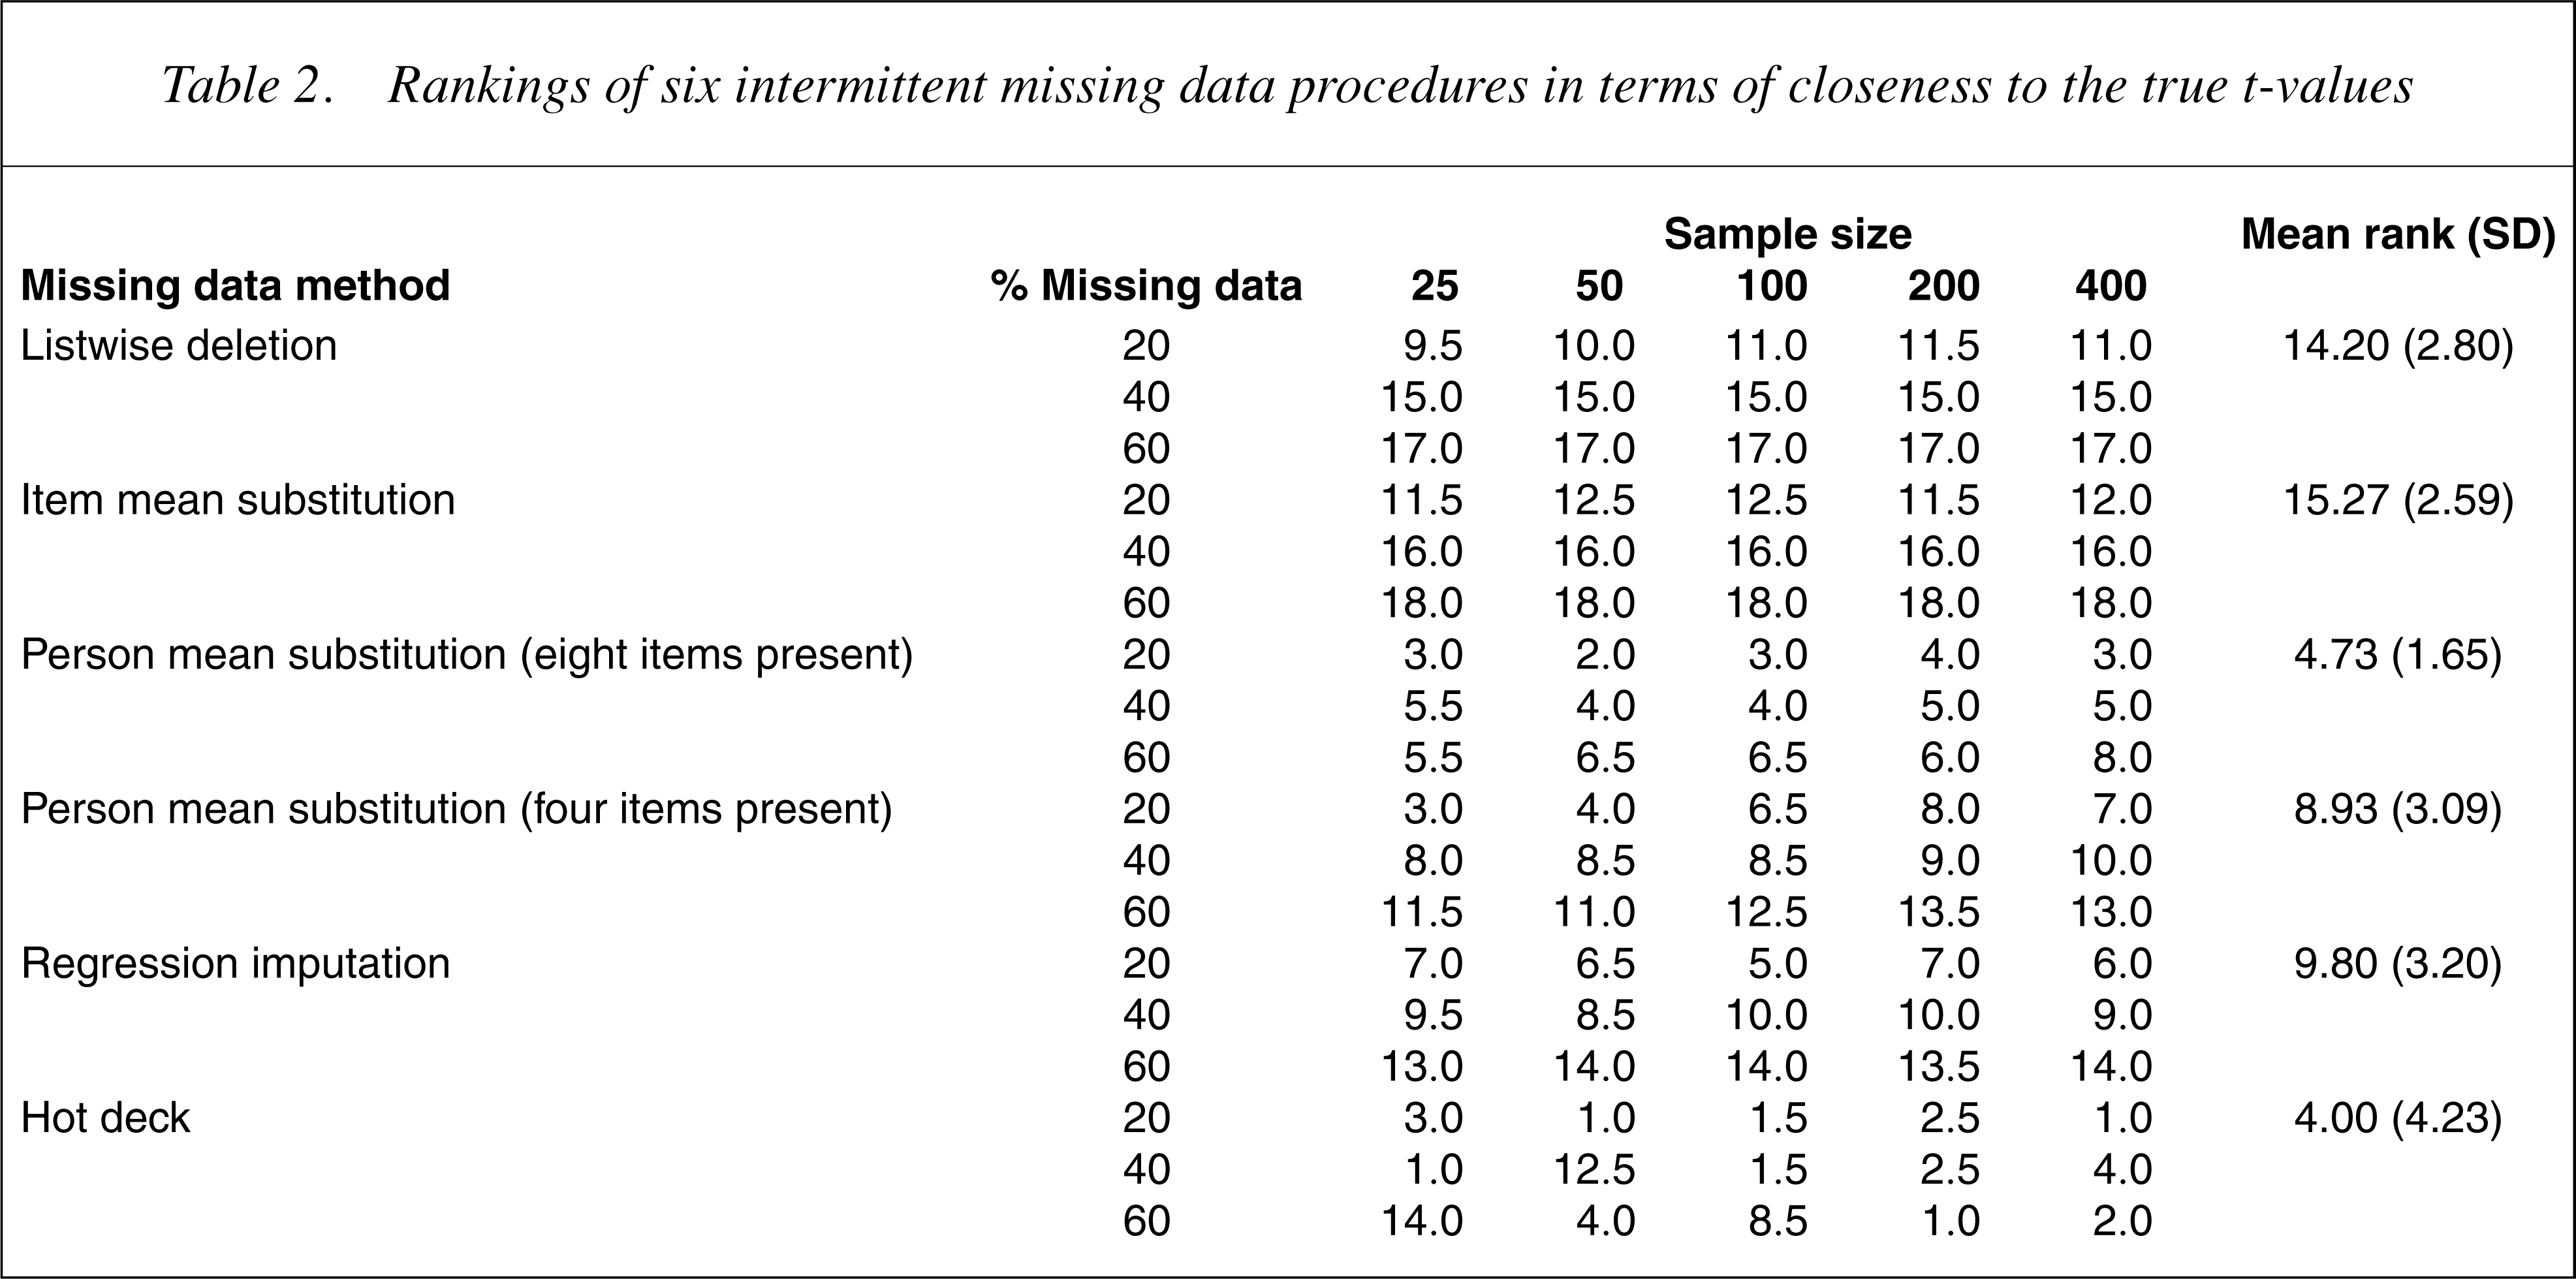
The data in Tables 1 and 2 suggest that the hot deck imputation and the person mean substitution method where there was data for eight of the 17 PCL items produced estimated t-values that were close to the true t-values. As expected, in all cases the t-values increased with sample size increases. In addition, the difference between the true t-values and those of the missing data methods increased as the percentage of missing data increased. Although the hot deck and person mean substitution both performed well overall, there was some evidence that the hot deck imputation was more robust for larger sample sizes.
Table 3 shows the differences between the procedures. The most efficient method was hot deck. When compared with this method, person mean substitution with eight items present was almost as efficient, followed by person mean substitution with four items present and regression imputation. Listwise deletion and item mean substitution performed particularly badly.
Relative efficiency (RE) of six intermittent missing data methods
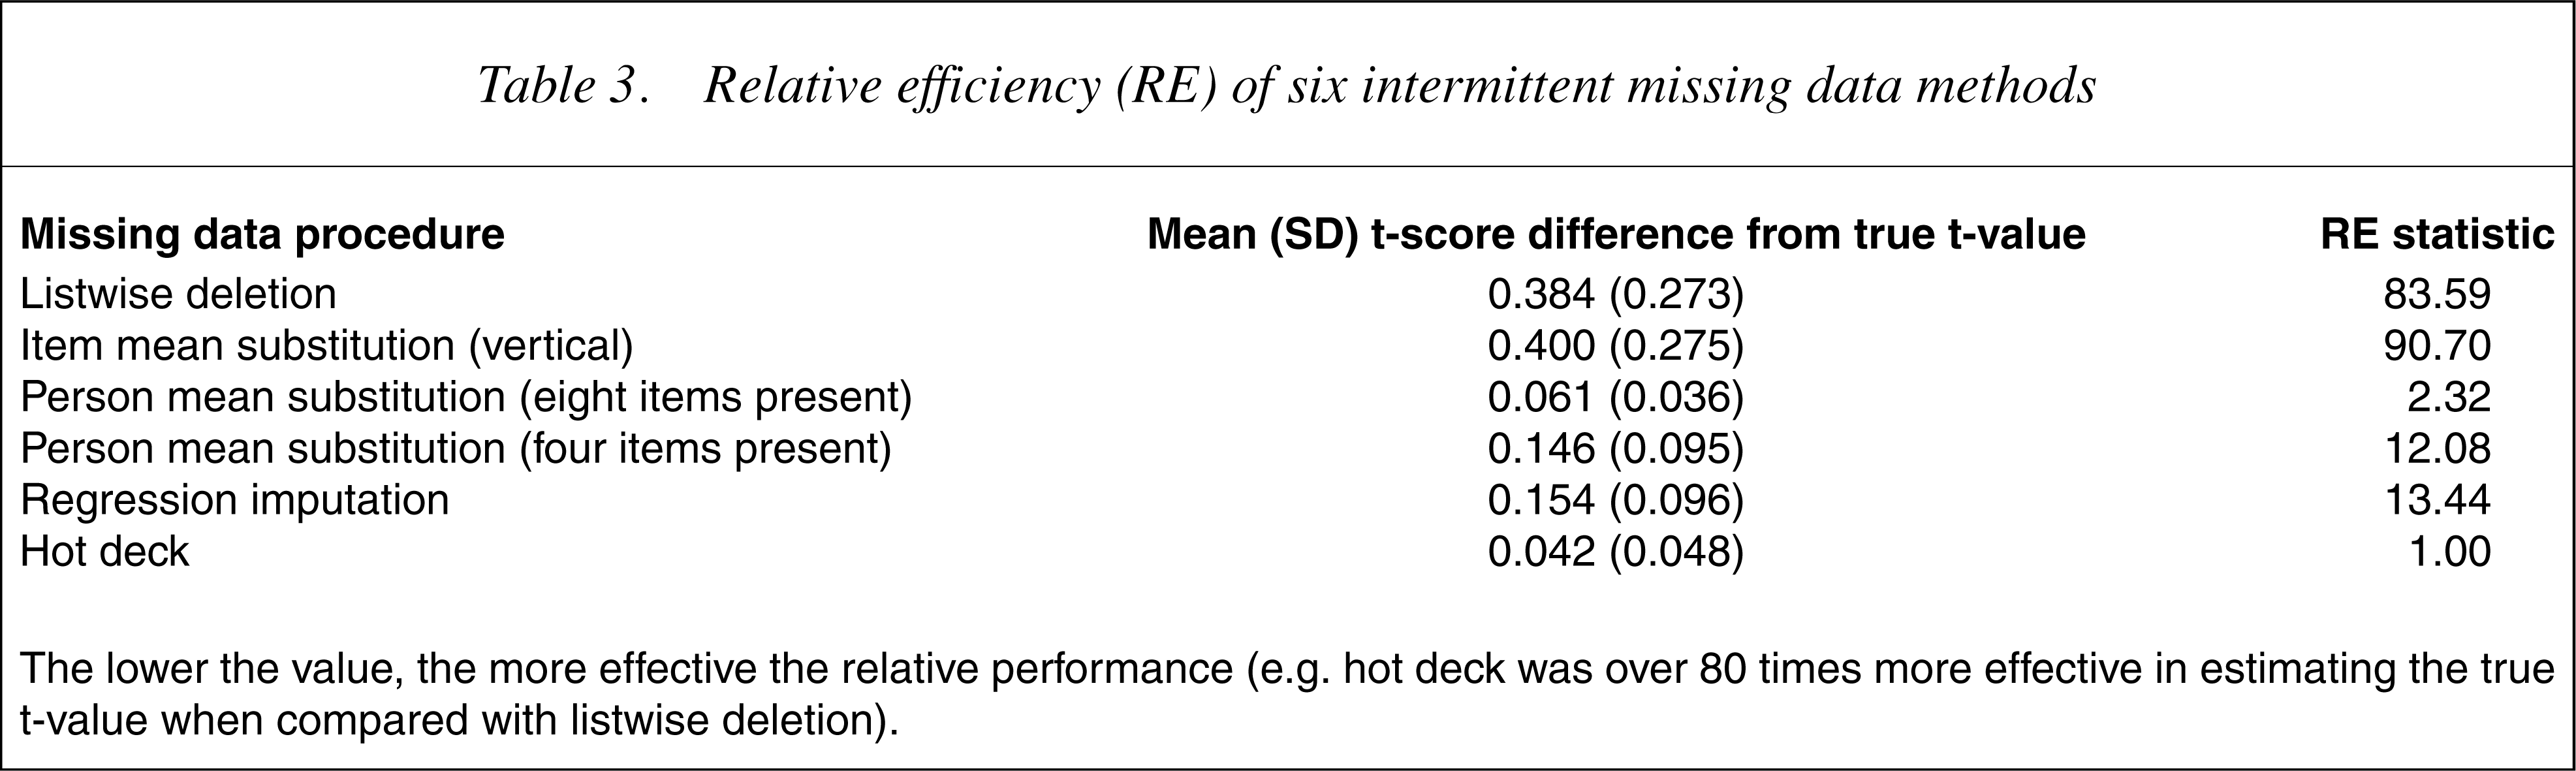
The lower the value, the more effective the relative performance (e.g. hot deck was over 80 times more effective in estimating the true t-value when compared with listwise deletion).
Discussion
A major issue with missing data relates to its status; it is important to identify ignorable from non-ignorable missing data [17]. If the missing data pattern for a particular variable is linked to the variable scores and it is not possible to confidently estimate the missing values from other dataset variables, then it is not possible to substitute new values for missing data [21]. Almost certainly, the results will be biased. Every effort should be made to collect full and complete datasets. Where data are missing, it is important to identify ignorable missing data and impute missing values.
Six popular methods for doing this were examined, namely listwise deletion, item mean substitution, person mean substitution with two levels of missingness, regression and hot deck imputation. When interpreting the findings, however, it should be borne in mind that these methods constitute only a selection of those potentially available. Better results may have been obtained from the more sophisticated procedures, such as the EMalgorithm or multiple imputation. The study has, nevertheless, examined the methods commonly reported and provides advice concerning the selection of appropriate methods.
The findings suggest that hot deck imputation and person mean substitution (with approximately half the items present) are superior to the other procedures – a finding consistent with that of earlier researchers [38]. Evenwhen less than 25% (four out of 17) of items were completed, person mean substitution performed better than listwise and item mean substitution. Caution, however, should be exercised since increases in the number of missing items will influence the results due to correlations between items within scales [32]. Of particular interest is the observation that the two most popular missing data methods, item mean substitution and listwise deletion, performed poorly, particularly where there were high levels of missing data. This finding is consistent with that reported by Downey and King [32].
We advocate using person mean substitution over hot deck imputation for scale scores because of its ease of computation. Unlike hot deck, because the mean substitution strategy uses the non-missing items in a particular scale, all available data is used.
Of concern is the poor performance of listwise deletion and item mean substitution, given that they are the most commonly reported and are the default methods in many statistical software packages. The t-values in Table 1 suggest that where missing data are MCAR, as is the case in our study, these procedures may lead to excessive null findings or Type II errors. For listwise deletion with MCAR data the group means and variances are likely to stay the same. Hence, the t-value will decrease as the sample size reduces, primarily because of the reduced degrees of freedom. For item mean substitution there are two possible outcomes when imputingMCAR data. If the values are imputed across all study participants, the differences between group means will decrease and, hence, the t-values will also be smaller. If the values are imputed within study groups, the differences between group means will increase and the t-values will be larger.
Regarding the study limitations, there may have been better ways of carrying out the regression analyses. Values for missing data were generated for PCL at intake from HADS anxiety scores. Thus imputed values were calculated regardless of the participants' AUDIT class. The results for the regression imputations may have been closer to those of the complete dataset if separate regression lines were calculated for each AUDIT class. We did not do this because it would have necessitated calculating a new set of missing values for each analysis – a procedure that few researchers would be willing to undertake on a day-to-day basis. Additionally, the results of the regression imputations might have been further improved if the correlations between PCL at intake and the independent variable had been stronger. The correlation with PCL at intake was moderate (r=0.59 with HADS anxiety), a situation that is typical of many research datasets.
The comparisons were based on the disparity between the true t-values and the estimated t-values. It is possible that different results may have been obtained for alternative statistical tests, such as correlation or regression coefficients. Hence, there may be value in comparing other parameter estimates for complete datasets with those derived from datasets with imputed values. There may also be benefit from making further comparisons between person mean substitution and hot deck imputation. This study found that these two methods produced similar results when about half of the items were present. Given that the person mean substitution method with about half of the items present was superior to the person mean substitution method with about one-quarter of the items present, there may be a level of missing items beyond which person mean substitution becomes better than hot deck imputation.
Finally, the results may have been affected by distribution and covariation within the particular dataset used. We have no reason to suspect this was the case, but further research with other datasets is needed.
Conclusion
This study examined several popular and simple procedures for handling missing data. The relative merits of each procedure were examined under a variety of sample sizes and with differing levels of missing data, where the criteria were the true t-values for the entire sample. The results suggest that there are important differences between the procedures. In particular, they suggest that it is difficult to justify using listwise deletion or item mean substitution. Since these are the most widely reported methods of handling missing data and are the default methods in many statistical software packages, the findings have broad implications. Given the limitations of the study, replication is important.
Subject to the study limitations, where data are missing from instrument scales, the results suggest that if there are at least half of the items of a scale present, the appropriate procedure would be person mean substitution or hot deck imputation. Where no items have been completed for a scale, or where the measure consists of a single item, hot deck imputation should be the preferred method.
Footnotes
Acknowledgements
This study was funded as part of a block grant to the Australian Centre for Posttraumatic Mental Health by the Australian Common wealth Department of Veterans' Affairs. We thank Dirk Biddle for his helpful comments on themanuscript and also those veterans who completed long evaluation forms at the time when they were seeking helpwith mental health problems. The ethics approval for data collection from veterans was given by the Australian Common wealth Department of Veterans' Affairs Human Ethics Committee.