
Abstract
Keywords
Abbreviations
AUDIT, Alcohol Use Disorders Identification Test [1], [2]; CAPS, Clinician Administered PTSD Scale [3]; EM, expectation maximization; LVCF, last value carried forward; also referred to as last observation carried forward (LOCF); MAR, missing at random; MCAR, missing completely at random; PCL, Posttraumatic Stress Disorder Checklist – Military version [4]; PTSD, posttraumatic stress disorder; RE, relative efficiency statistic [5], [6].
Missing repeated measures data
Missing data in repeated measures datasets is a problem in psychiatry because it may play a major role in clinical trials and longitudinal studies. Although there are some well-accepted procedures, these may reflect logical criteria rather than underlying data patterns. For example, in pharmaceutical trials, last value carried forward (LVCF) is recommended because this reflects costs incurred. Despite these conventions and the recent growth in imputing missing data methods, many researchers appear unaware of the range of techniques available and the conditions of their use. We found, based on a random sample of research articles listed in MEDLINE for 2003 that approximately 80% ignored missing data, a situation scarcely better than that reported 10 years earlier [7].
When repeated measures datasets containmissing data, researchers can adopt one or more strategies. They can simply delete the cases with missing data, or impute values from other dataset data. They can use complex algorithms which take account of the missingness to estimate parameters, such as the expectation-maximization (EM) algorithm [8] that are available in various statistical packages (such as mixed effects models). Finally, researchers can take amultiple imputation approach [9], [10]. In a companion paper we examine missing data imputation methods for cross-sectional research [11]. This paper compares six common repeated measures missing data methods that could be used by those with limited expertise. The examination of complex algorithms and multiple imputation strategies is beyond the scope of this paper.
Three sources of missing data are particularly pertinent to repeated measures psychiatric research. First, participants who were included at baseline may not be available at follow-up (e.g. a person travelling to another country). Second, some data may not yet be available (e.g. it is not possible to record data for a 2-year post-treatment follow-up if, for some participants, the 2 years have not yet expired). Finally, a whole measure within a questionnaire may be ‘skipped’ by a respondent (e.g. where a page from a questionnaire is missing).
For a discussion of missing data types, the reader should consult our companion paper [11]. Briefly, there are two general types, designated as ignorable and non-ignorable [12], [13]. Ignorable missing data can be missing at random (MAR) ormissing completely at random (MCAR). Under these circumstances, imputation strategies can produce a more complete dataset that is not adversely biased [9], [14]. Where missingness is related to the scores individuals would have obtained if they had completed the items, then it is not appropriate to use the methods investigated in this paper. For a discussion of non-ignorable missing data, see Conway [15], Fairclough [16] and Little and Rubin [12].
The missing data methods examined are: listwise deletion, LVCF, standardized score imputation, regression and two versions of a ‘closest match’ strategy. To make the study particularly relevant to practitioners, only basic algebraic notation is presented and we have used real data collected in the course of clinical treatments. We used the well-known t-test as the basis for comparisons between the different methods.
Listwise deletion (see Hair et al. for a description [17]), is the default for many widely used statistical packages, such as SPSS [18]. This removes a respondent (case i) from an analysis if any of the variables have missing data (plural) or datum (singular). Unlike other missing data procedures, listwise deletion does not impute (or calculate) a replacement value. However, information that may have been expensive and time-consuming to collect is lost [19].
Last value carried forward (LVCF; also known as last observation carried forward [LOCF] and endpoint analysis [20]) can be used when missing data occur after the first timepoint. Case i's missing datum is replaced by the previous non-missing datum. Although conservative in nature, there is an implicit assumption that the individual's score remains constant over time.
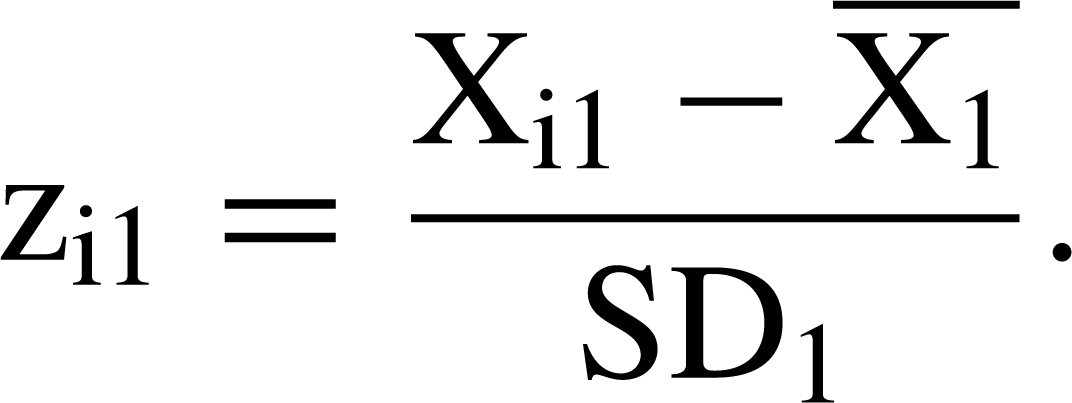
Standardized (z-) score imputation uses the score derived at one timepoint to impute a value at another timepoint [20]. This assumes that the z-score at the timepoint for which the datum is missing is the same as the z-score for the timepoint forwhich the datum is present. Consider where case i has a score (X) on a variable at timepoint 1, denoted Xi1, but does not have the variable score at timepoint 2, denoted Xi2. First, the means and standard deviations for all participants for whom data are available are calculated at timepoints 1 and 2, denoted and SD1 for timepoint 1 and and SD2 for timepoint 2, respectively. The case i z-score at timepoint 1 is
The advantage is that the imputed value takes account of both the overall change in scores from one timepoint to another and the distribution of scores at timepoint 1. The disadvantages are that scores are assumed to be normally distributed at both timepoints and that the relative position of a respondent does not change between the two timepoints (i.e. that each respondent's z-score is a constant over time).
Regression imputation predicts a missing value for a particular timepoint using the relationship between variable scores measured at another timepoint(s) [17]. For example, assume case i has a missing datum for a measure, Y, at timepoint 4. A regression equation expressing the relationship between scores for the whole sample present at both timepoints 3 (Y3) and 4 (Y4) could be
Two missing data methods, closest match and average closest match, are also examined. These are variants of hot deck imputation, described in our companion paper [11]. Closest match replaces a case i's missing datum with a value obtained from one or more participants who have similar scores on the samemeasure assessed at other timepoints [20], [22], [23]. Where a measure is administered at four timepoints and case i completed it at timepoints 1, 2 and 3, but not at timepoint 4, the closest match is the participant with the lowest sum of absolute differences between case i's scores and other participants' scores at the three timepoints where data are present. Only participants who have valid scores for all four timepoints are closest match candidates. The score obtained by the closest match at timepoint 4 replaces the missing datum for case i.
For ‘average closest match’, the four participants who have the smallest absolute difference scores are identified. The mean score at timepoint 4 for these four participants is used as the replacement for the missing datum for case i.
Aim of the present study
The present study compared the six missing imputation methods in terms of the closeness of their t-test values to the true t-value derived from the dataset with no missing data. The purpose was to explicate differences between the methods so that researchers could make informed judgements about the consequences of selecting one method over another.
Method
Because the primary study focus was methodological, only a brief description of participants and measures is provided. See Creamer et al. [24] for a comprehensive description.
Participants
The participants were 804 Australian male Vietnam veterans participating in posttraumatic stress disorder (PTSD) treatment programs. The average intake agewas 52.04 years (SD=4.58); 78% were married. The clinical assessment intake mean PTSD level was 82.30 (SD=16.39), using the Clinician Administered PTSD Scale (CAPS) [3], [25].
Measures
The study measures constitute a small component of an instrument battery completed on four occasions: program intake and at 6, 12 and 24 months follow-up. The dependent variable was the Posttraumatic Stress Disorder Checklist – Military version (PCL) [4]. It comprises 17 items scored on a five-point summative scale from 1 (not at all) to 5 (extremely). The possible scores range from 17 (low stress level) to 85 (high stress level).
The Alcohol Use Disorders Identification Test (AUDIT) [1], [2] has 10 items. The first eight are scored on a five-point scale from 0 to 4. Items 9 and 10 are initially scored on a three-point scale with possible scores of 0, 1 and 2, but are rescaled to 0, 2 and 4 for consistency with other items. Scores range from 0 (low alcohol use) to 40 (high alcohol use). Using a median split, AUDIT scores were dichotomized into group 1 (low alcohol use) and group 2 (high alcohol use). These groups constitute the levels of the independent variable (alcohol usage level) in the independent samples t-tests.
Data analysis
Analyses involved comparison of two sets of t-values. Set 1 from the complete sample were designated ‘true’ t-values. Set 2 ‘estimated’ t-values were calculated for the same sample, but a certain percentage of the PCL scores data was randomly made missing. Missing values were imputed using one of the imputation methods, except for listwise deletion where t-values were calculated for remaining cases only. Three different levels of missing data were investigated: 20, 40 and 60%. Analyses were carried out for five different sample sizes: 25, 50, 100, 200 and 400. The samples were randomly selected from the total of 804 participants.
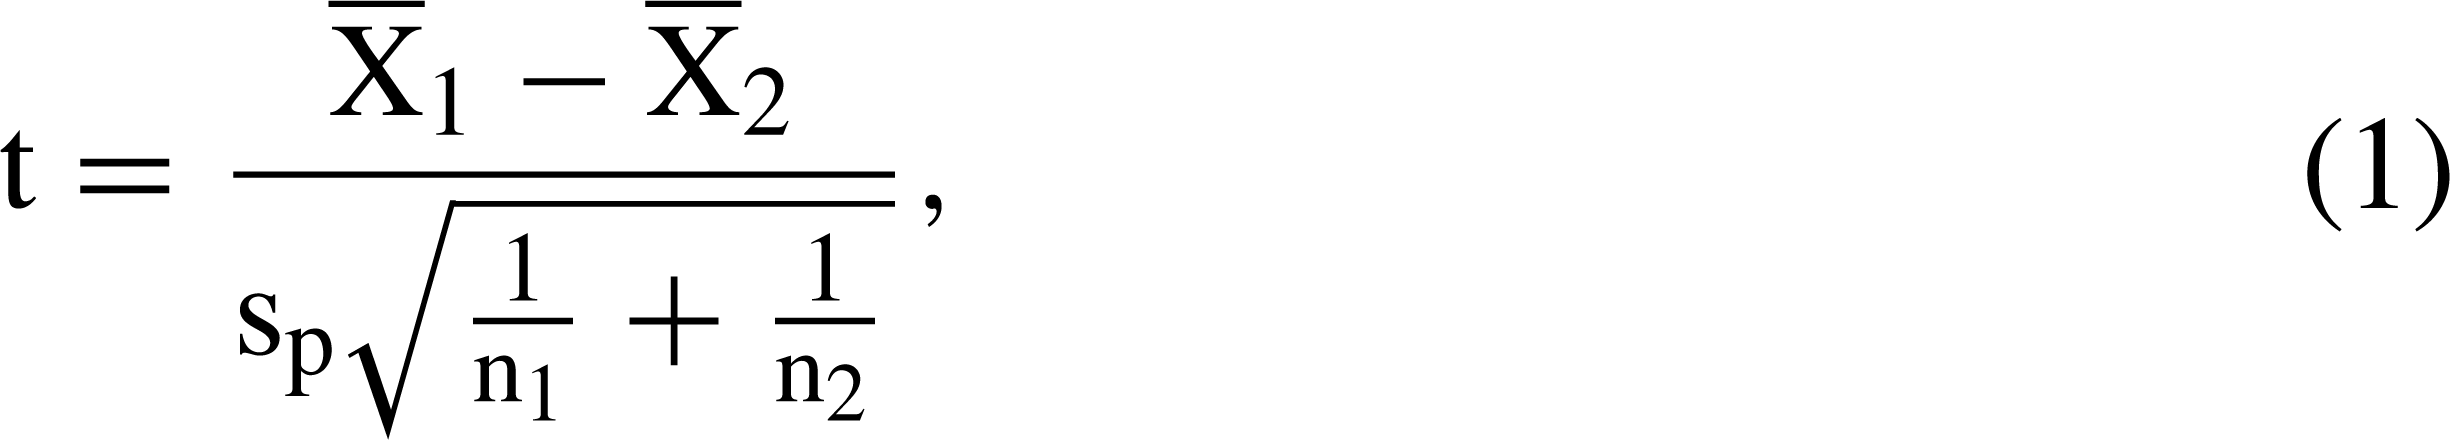
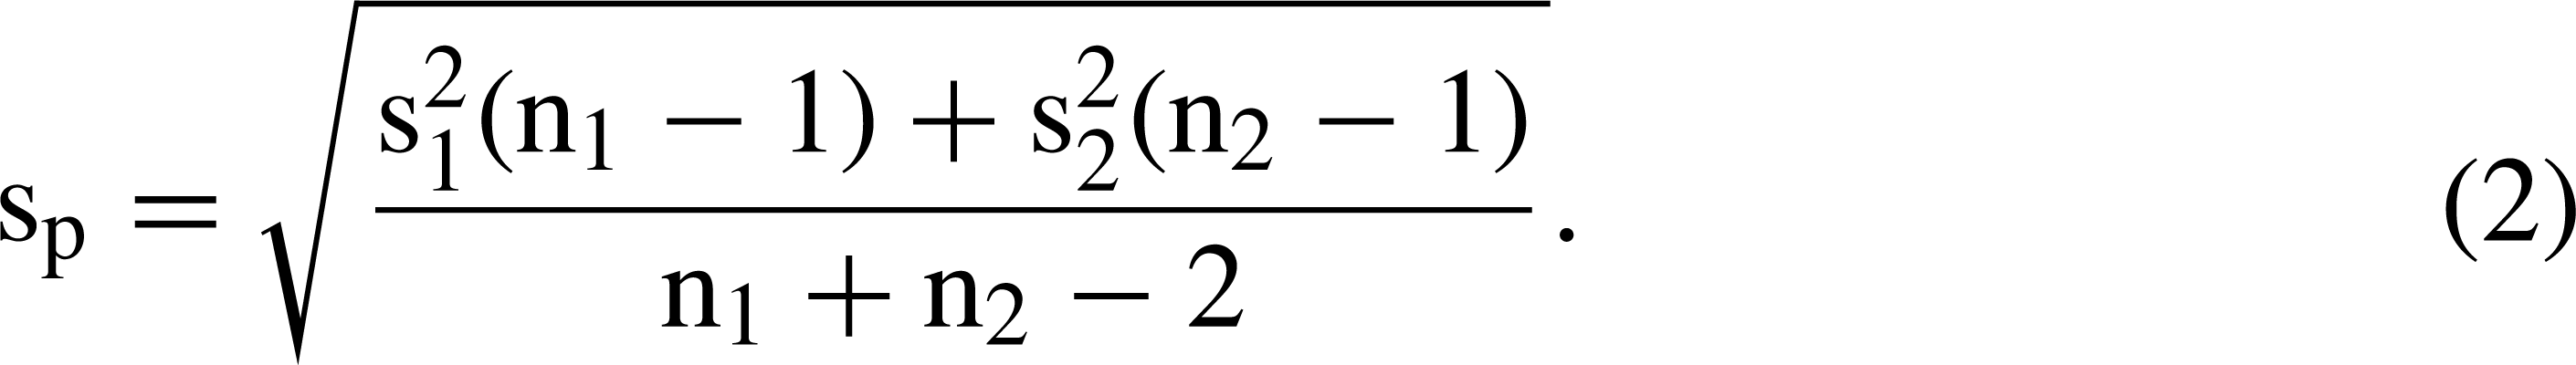
An independent samples t-test and a repeated measures t-test were used because they are widely understood and provide opportunities to understand the reasons for different results. The formula for the independent samples t-test is


For both, higher t-values imply greater differences between group means, larger sample sizes (n) and less variation of scoreswithin groups. Although all the samples were drawn from the same dataset, because they contain different individuals the group means and standard deviations varied with changes in sample size.
To ensure parameter stability, for each combination of sample size, percentage of missing data and missing data method, the analyses were repeated 1000 times. Mean t-values are reported for each combination of test conditions for each of the missing data methods.
For all analyses, the dependent variable was the PCL at 24 months. For independent samples and repeated measures t-tests the independent variables were alcohol usage group and PCL score at 12months, respectively. For regression imputations, PCL scores at 24 months were regressed on PCL scores at 12 months after intake (r=0.712, p < 0.001).
To compare the different procedures, the difference between the true t-value and the estimated mean t-value was computed and used to calculate a modified relative efficiency (RE) statistic [5], [6]:

Results
Part 1: Independent samples t-tests
The true t-value and themean estimated t-values for all six imputation methods are presented in Table 1 along with the mean rankings for the methods for each combination of sample size and percentage ofmissing data. The ranks were determined by the closeness of the estimated t-values to the true t-value; the lower the rank the closer to the true t-value. Also shown is the mean difference between the estimated and true t-values and the RE statistic for each of the methods.
True and estimated mean independent samples t-values, mean rankings and RE statistics for six missing data procedures
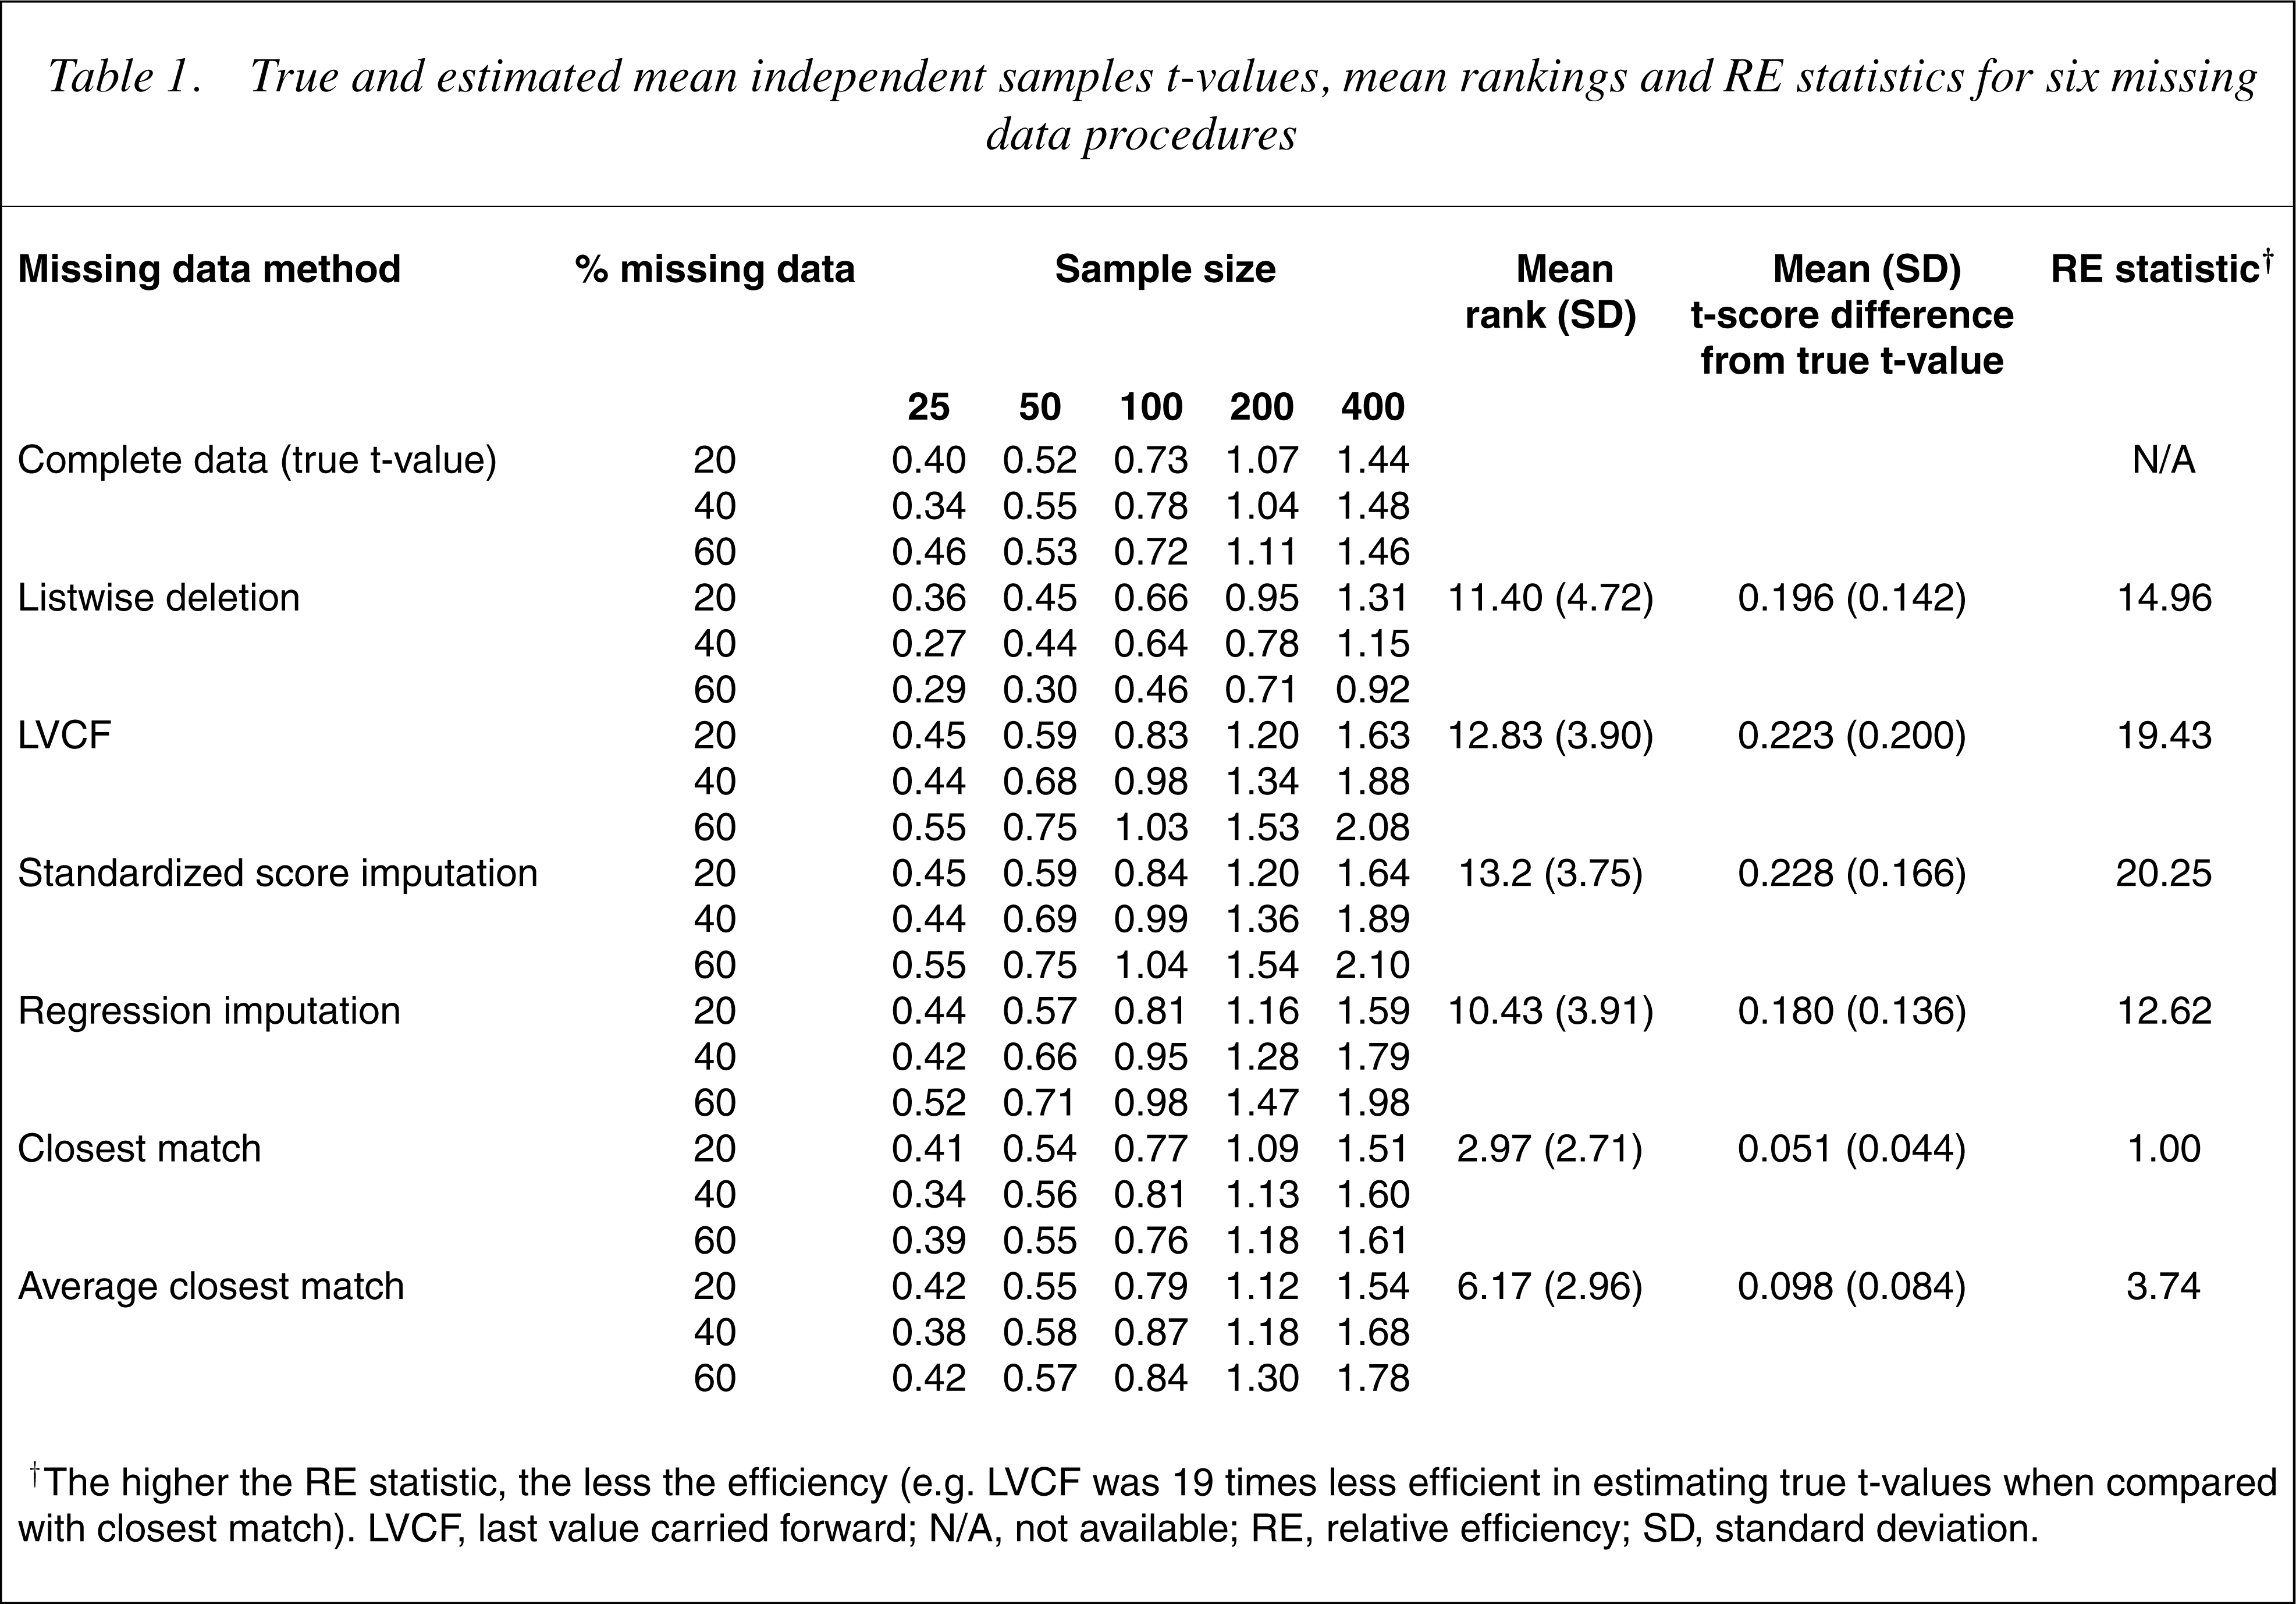
† The higher the RE statistic, the less the efficiency (e.g. LVCF was 19 times less efficient in estimating true t-values when compared with closest match). LVCF, last value carried forward; N/A, not available; RE, relative efficiency; SD, standard deviation.
There were large differences between the methods. The most efficient method was closest match, followed by average closest match, then regression and listwise deletion. Last value carried forward and standardized score methods were least efficient. As expected, the tvalues increase with increases in sample size and the mean estimated t-values tend to have larger differences from the true t-values as the percentage of missing data increase. To understand the trends in Table 1, the group means and standard deviations, averaged across 1000 runs, for each combination of sample size and percentage of missing data were calculated. Table 2 provides these statistics for the largest sample size (400) and greatest percentage of missing data (60%).
Illustrative group means and standard deviations for independent samples t-tests with 60% missing data and a sample size of 400
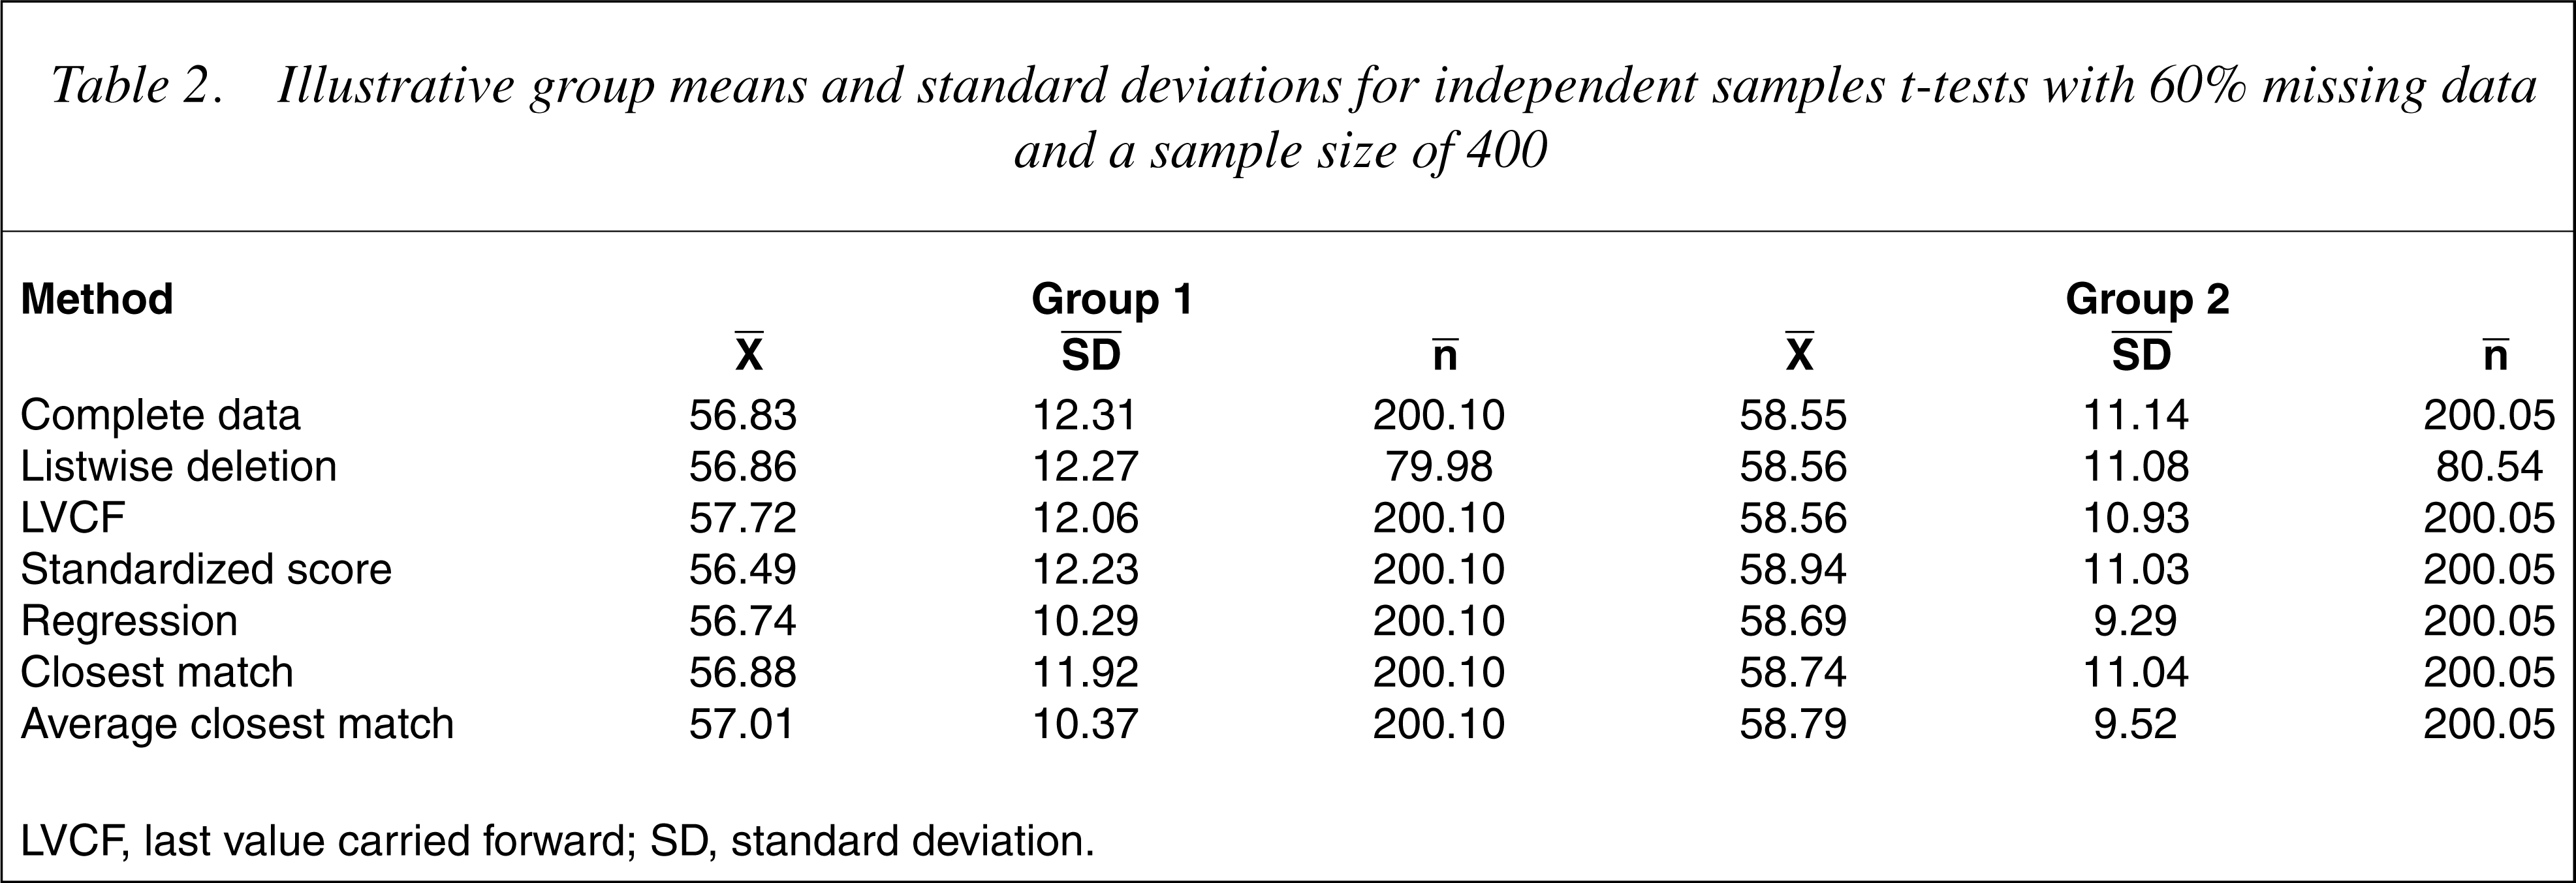
LVCF, last value carried forward; SD, standard deviation.
The procedure least affected by the increase in missing values was closest match where the group means were very close to those derived from the complete dataset. The standard deviations were slightly smaller, thus producing slightly higher t-values. The second best method was the average closest match. Again the estimated t-values were larger than the true t-values, primarily because of reductions in group standard deviations. The averaging of the 24-month PCL scores from the closest four individuals at the other three timepoints tended to produce imputed values closer to the group means, thus reducing the variance but having little impact on group means.
The next best procedures were, in decreasing order of efficacy, regression imputation, listwise deletion, LVCF and standardized score imputation.
The results for regression were similar to those of the average closest match; the PCL group means were similar to those of the complete dataset. However, even smaller group standard deviations were obtained because all of the imputed values fell on the regression line. Therefore the regression t-values from the imputed data were considerably inflated.
Listwise deletion produced means and standard deviations that were very close to those of the complete dataset. As expected, the t-values were lower because of the reductions in the group sample sizes.
The LVCF group means were higher than for those generated from the complete dataset because PCL scores at 12 months were generally higher than scores at 24 months. However, the changes in group means (complete dataset) were not the same over the 12-month period. For the high alcohol consumption group (group 2), the mean PCL score decreased by 2.59 units while the low alcohol consumption group (group 1) decreased by 1.45 units. Consequently, the mean 24-month PCL score for group 2 increased to a greater extent than did group 1, leading to increased group differences and larger t-values. For the LVCF procedure to be unbiased, the change in the mean PCL score from 12 to 24 months would need to be the same for both groups.
The standardized score imputation method was the least efficacious, primarily because it polarized the group means. With increases in missing data the average PCL score of the group with the lower mean at 24 months (group 1) decreased, whereas it increased for the group with the highermean (group 2) resulting in a larger difference between means and therefore larger t-values. The reason for this polarization was the difference in standard deviations of PCL scores at 12 and 24 months. For the complete dataset the standard deviations of the PCL scores at 12 and 24 months were 11.397 and 11.770, respectively. Hence, the difference between the mean PCL score and any particular standardized score will be less at 12 months than at 24 months. It is apparent that the efficacy of the standardized score imputation method will depend upon the equivalence of the standard deviations of the two sets of scores.
Part 2: Repeated measures t-tests
Table 3 provides the true and mean estimated t-values for the repeated measures t-tests for the sixmissing data methods. Again, mean rankings and differences between true, estimated t-values and RE statistics are shown. The two closest match procedures were superior to the other procedures, albeit in the reverse order. Listwise deletion and LVCF were similar, followed by regression and standardized score imputations. In all cases, the t-values increased with sample size increases. In addition, the difference between the true and estimated t-values increased with missing data increases.
True and estimated mean repeated measures t-values, mean rankings and RE statistics for six missing data procedures
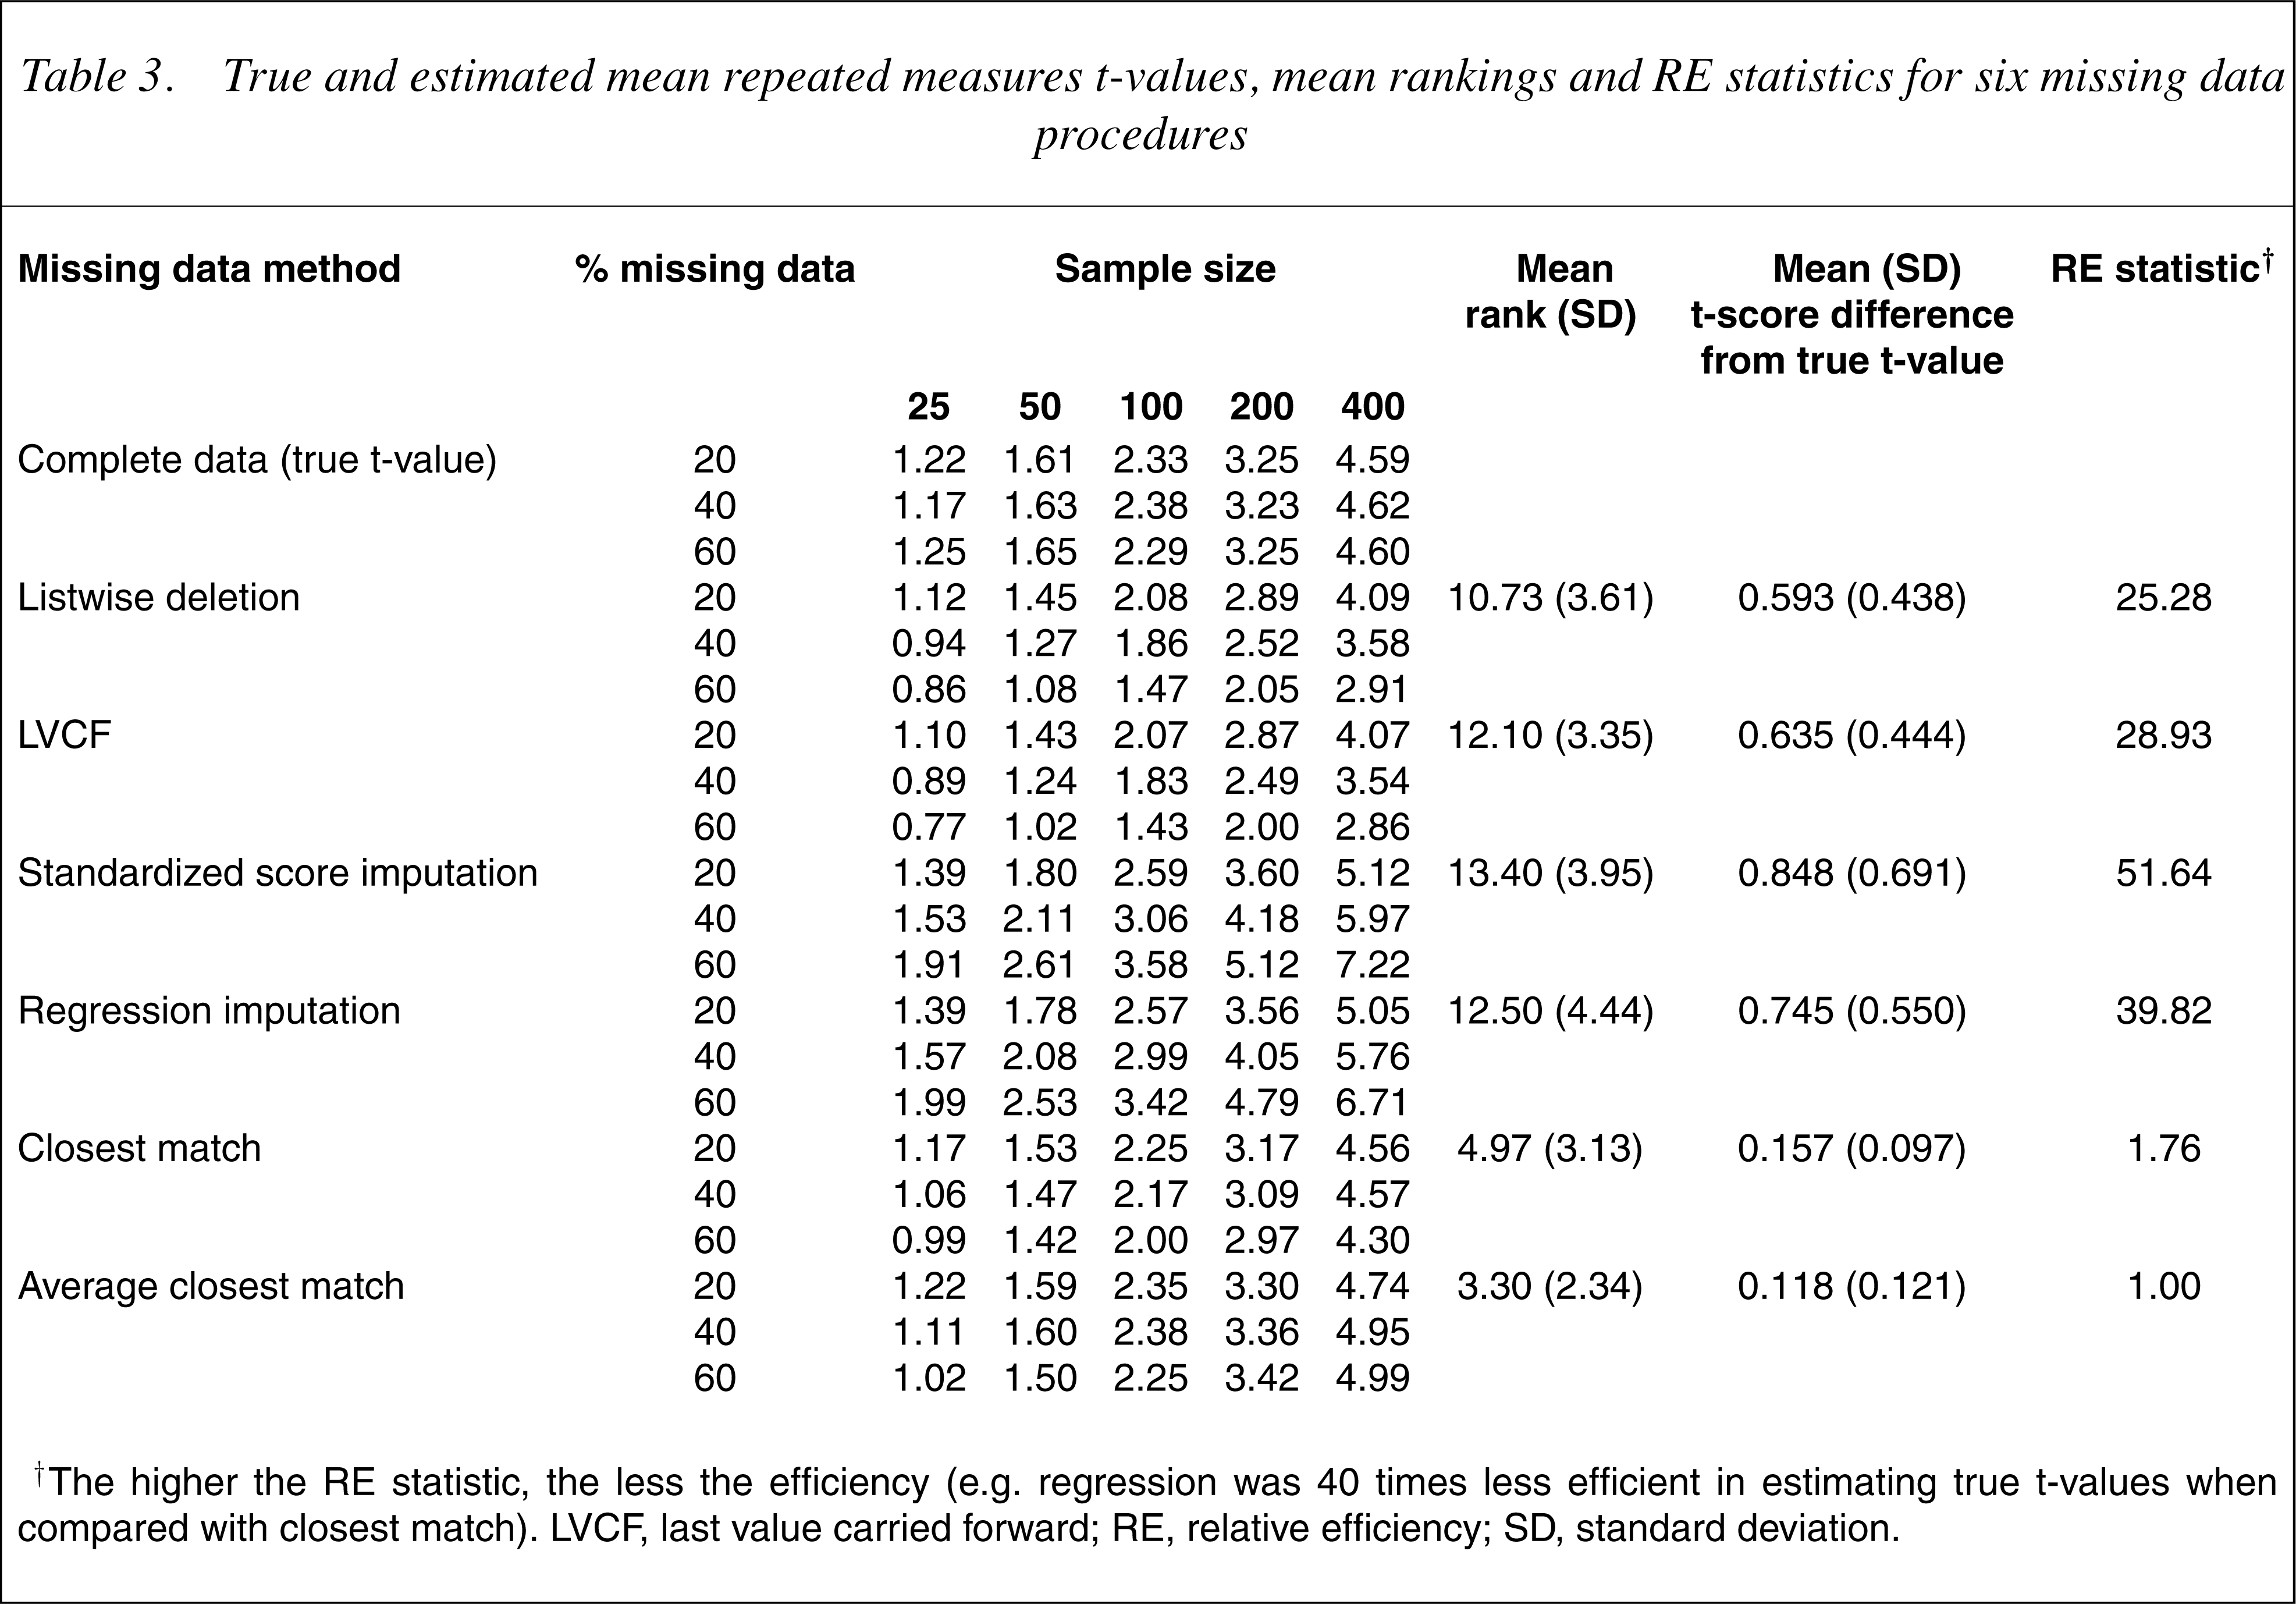
† The higher the RE statistic, the less the efficiency (e.g. regression was 40 times less efficient in estimating true t-values when compared with closest match). LVCF, last value carried forward; RE, relative efficiency; SD, standard deviation.
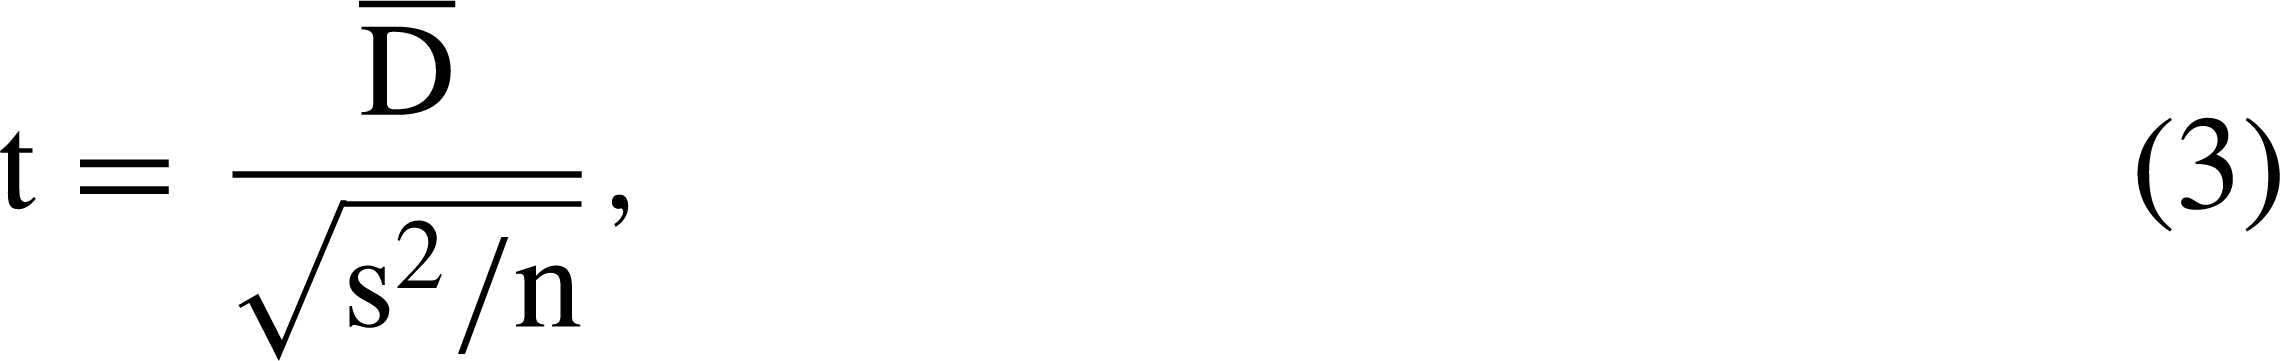
The observed statistics were means and standard deviations for each timepoint, the mean differences between timepoints and the standard errors of the differences between timepoints. These latter two are particularly relevant for understanding the t-values given that these are calculated directly from them (Eqn 3). Because there was no missing data at the first timepoint (12 months), the means and standard deviations are the same for all the procedures, except listwise deletion (where differences from the true t-values were very small). Because the repeated measures t-test was used, the sample size at each timepoint was identical. An illustrative example of the means and standard deviations at each timepoint, the mean differences between timepoints and standard errors of the differences is presented in Table 4.
Illustrative group means and standard deviations for dependent samples t-tests with 60% missing data and a sample size of 400
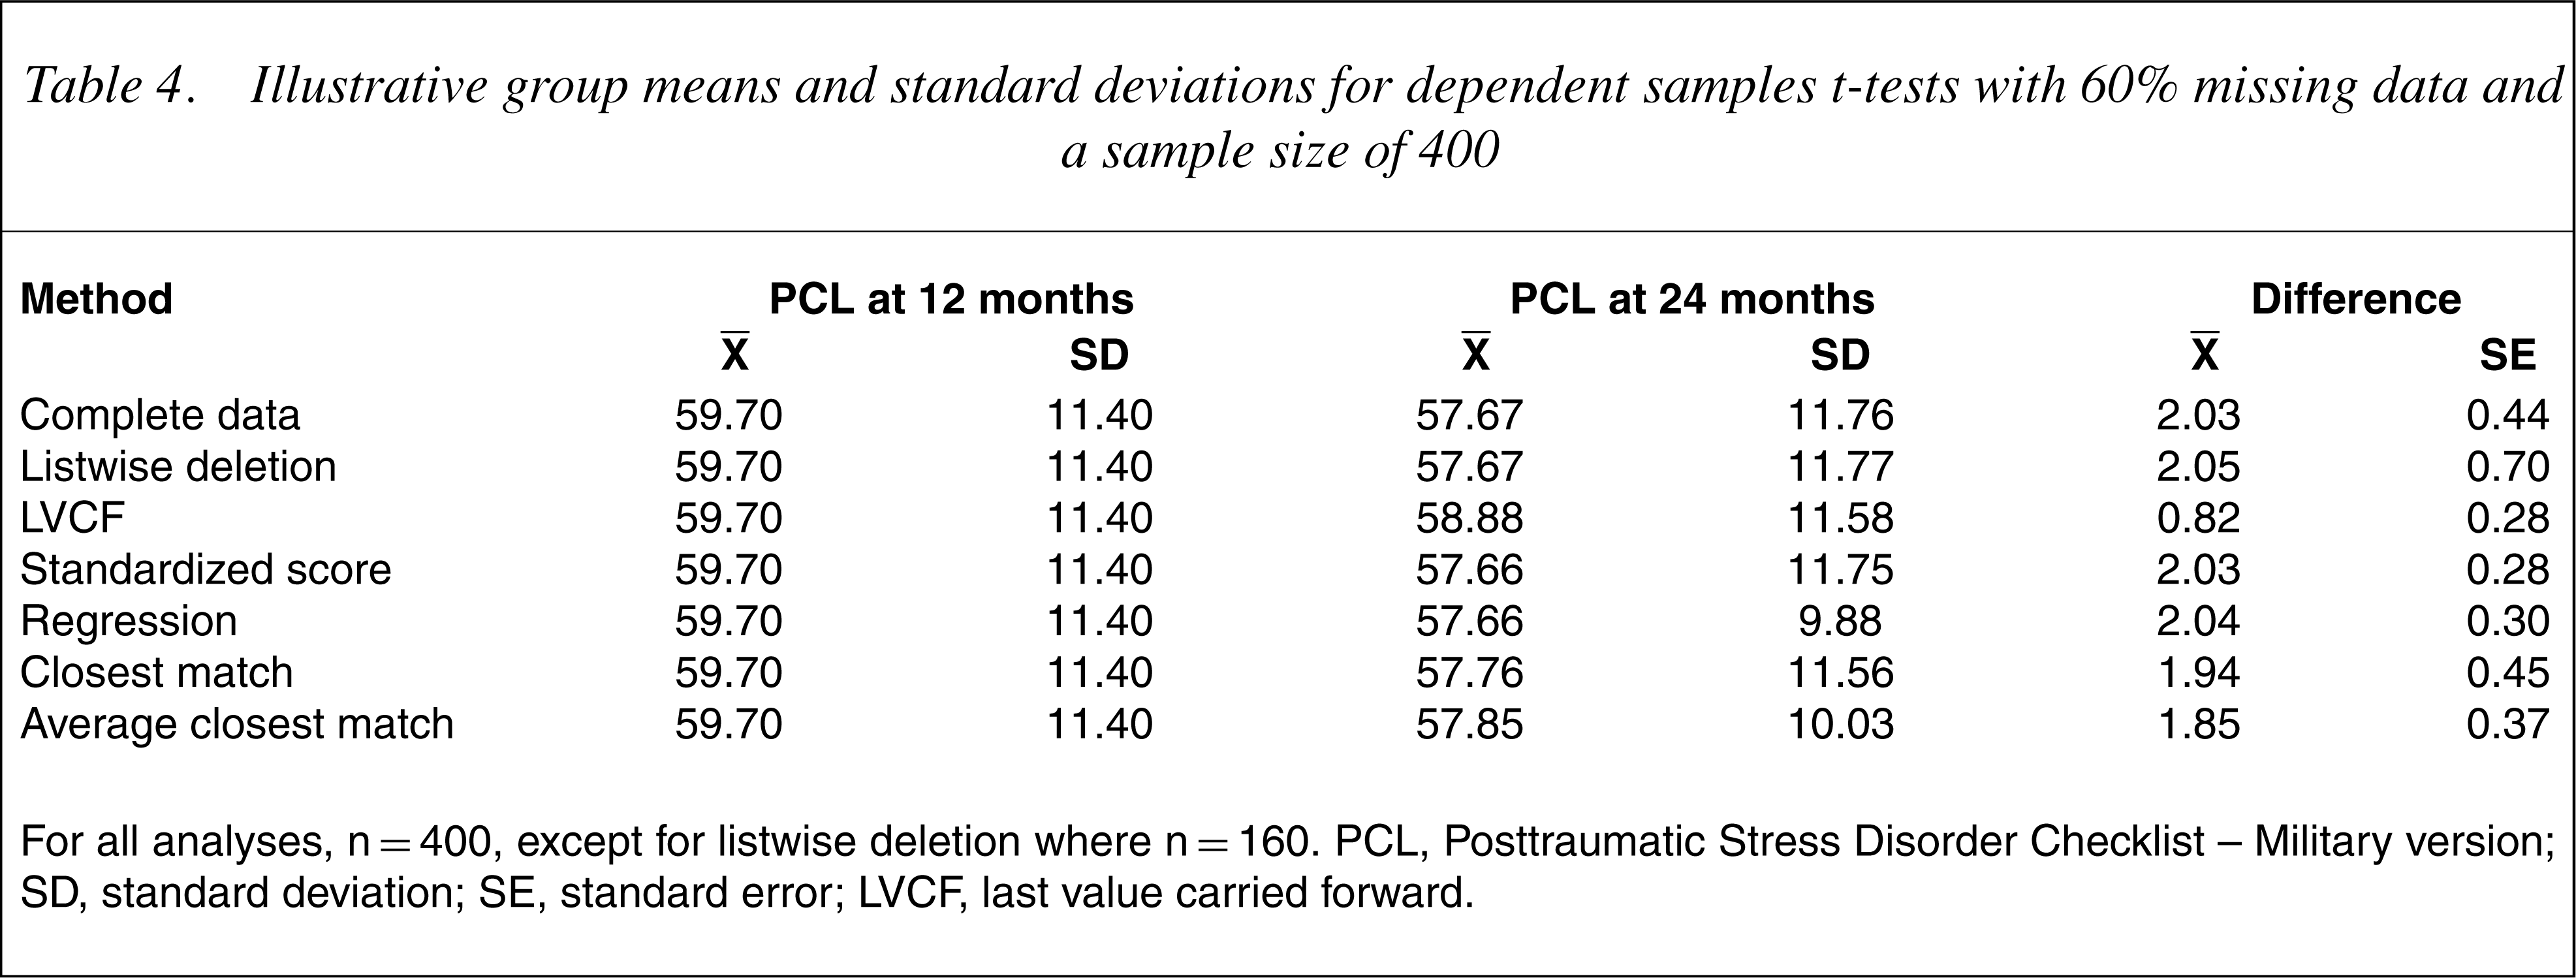
For all analyses, n=400, except for listwise deletion where n=160. PCL, Posttraumatic Stress Disorder Checklist – Military version; SD, standard deviation; SE, standard error; LVCF, last value carried forward.
In general, estimated t-values were slightly higher than true t-values for average closest match and slightly lower for closest match. For closest match, using the 24-month PCL score of a single individual who had similar scores at the other timepoints resulted in differences between 12- and 24-month PCL values that were slightly lower than that for the complete data, while the standard errors of the differences were similar. In contrast, for average closest match, the differences between 12- and 24-month values were lower than that for the complete data, but were largely compensated for by lower standard errors.
For listwise deletion the standard error of the differences was much larger than for the complete data because of the reduced sample size. The LVCF method was similarly impacted by increases in missing data. Setting the 24-month PCL value to the 12-month PCL value had the effect of reducing the differences in the PCL values between timepoints and to reducing the variation in difference scores (by setting the difference between time 1 and time 2 scores to zero for each missing datum). The reduction in the standard error was not, however, sufficient to compensate for the reduction in the difference between PCL scores, resulting in generally lower t-values.
The regression and standardized score imputation procedures were able to accurately predict 24-month PCL scores, but suffered from a consistent depression of the standard error in PCL values between the two timepoints. Both methods used a simple formula to impute 24-month PCL scores from 12-month PCL scores. As such, the pattern of 12-month PCL scores and imputed 24-month PCL scores was determined by the respective formulae resulting in differences that had considerably less variation than those in the complete dataset. As the percentage of missing data increased, the number of cases with more consistent differences in PCL scores increased, resulting in lower standard errors of the difference scores and higher t-values.
Discussion
For this sample, the closest match and average closest match procedures were the most efficient for the independent samples and repeated measures t-tests, respectively. Both appear to be superior to the other methods regardless of the type of statistical test used, the sample size or the percentage of missing data. These methods are conceptually simple, suffer minimally from distributional complications and are relatively robust with a large amount of missing data. Closest match is preferred to average closest match because it is easier to compute and performs better for the independent samples t-test and similarly for the repeated measures t-test.
Distributional properties played an important role in determining the efficacies of the different procedures. For standardized score and regression imputation, the independent samples t-values were influenced by biasing the group standard deviations of the PCL data at 24 months. In contrast, the repeated measures t-values were affected more by a reduction in the variation of the PCL scores at the two timepoints. In both cases, the estimated t-values became increasingly larger than the true t-values.
For the LVCF procedure, the imputed independent samples t-values were affected by the relative (i.e. within group) changes in PCL scores from 12 to 24 months. This finding, and that LVCF performed less well than listwise deletion, has implications given that LVCF is widely recommended for use in clinical trials where costs are incurred (e.g. in pharmaceutical trials). If this finding were replicated, there would be a case for reviewing the use of LVCF in such trials.
The repeated measures t-values were adversely affected by a tendency for themean of the 24-month PCL scores to approach the mean of the 12-month PCL scores as missing data increased. Hence, the repeated measures t-values were generally lower than those of the complete data, while the independent samples were generally higher. Such distributional properties are likely to be present in most datasets. These distributional influences are quite different from the problems associated with listwise deletion where lower t-values were mostly a function of the smaller sample sizes.
Caveats include that the efficacies of the missing data procedures seemed to rest heavily on the data distributional properties. Other datasets may have yielded somewhat different results, although this is unlikely given the assumptions about distributional properties implicit in the procedures themselves. In addition, the current study examined only the results of t-tests in determining the efficacy of the missing data procedures. Hence, there is a need for further investigations using different clinical samples and other statistical procedures to validate, or otherwise, the findings of this study.
This study examined six commonmethods for handling missing data where variables were measured on subsequent occasions. The relative merits of each method were investigated under a variety of sample sizes and with differing levels of missing data, where the criteria were the true t-values for the entire sample. The results suggest that a reliable and efficacious basis for missing data imputation is closest match, which substitutes case i's missing timepoint datum with a value from the participant in the dataset who has the closest scores on the same variable measured at other timepoints. That the LVCF and standardized scoremethods performed so poorly is of concern since these are often recommended. Likewise, listwise deletion was an ineffective strategy for handling missing data. As listwise deletion is one of the most widely reported methods and is the default option in many statistical software packages, the findings have broad implications. Given the limitations of the study, replication is important.
Footnotes
Acknowledgements
This study was funded as part of a block grant to the Australian Centre for Posttraumatic Mental Health by the Australian Commonwealth Department of Veterans' Affairs. We thank Dirk Biddle for his helpful comments on themanuscript and also those veterans who completed long and onerous evaluation forms at the time when they were seeking help with mental health problems. Ethics approval for data collection from veterans was given by the Australian Commonwealth Department of Veterans' Affairs Human Ethics Committee.