
Abstract
Youth 2000, a national survey of the health of 9699 young people in New Zealand was conducted in 2001 and the initial results from this study have been reported by Watson et al. [1]. The Reynold's Adolescent Depression Scale (RADS) was embedded into the survey questionnaire which consisted of a total of 523 items on health and emotional well-being, behaviour and factors thought to contribute to resilience and risk.
The Reynolds Adolescent Depression Scale was developed as a measure of the severity of depressive symptomatology in adolescents [2]. It is a self-rated questionnaire that consists of 30 items and uses a fourpoint response format (‘almost never’ to ‘most of the time’). Test scores range from 30 to 120, with scores of over 77 indicating that clinically significant depression may be present. The test includes 6 ‘critical’ items. These items have been shown to discriminate between depressed and non-depressed individuals. The recommendation in the RADS manual [3], is that those who score over the cut off of 77 or who score 3 or 4 in at least 4 of the 6 critical items on two consecutive occasions should see a mental health professional for a more accurate diagnosis.
The RADS is easily administered and is a useful tool in detecting and monitoring depressive symptoms [4]. It is used in clinical and research situations in New Zealand, despite a paucity of data on its reliability and validity for New Zealand adolescents. The Youth2000 survey provided an opportunity to examine some aspects of the reliability and validity of the scale in the major ethnic groups in this population.
This paper aims to examine measures of internal reliability, content validity, construct validity and convergent validity and compare them to the measures found in the original testing of the scale, in order to assess the reliability and validity of using the scale with New Zealand adolescents.
Method
The Youth2000 survey sampling frame consisted of all the 390 schools in New Zealand, which had more than 50 students in Year 9 through to Year 13. From this group, 133 schools were randomly selected and invited to participate in the study. Approximately 15% of students were then randomly selected from the school rolls of participating schools. Students who were fee paying non-New Zealand residents, had insufficient English language skills (equivalent to Year 6) or a disability which prevented them from using a standard laptop computer were excluded from the study.
The survey was administered using a laptop based Multimedia-Computer Assisted Self Interview (M-CASI). It has been shown that there is no significant difference in the psychometric properties of psychological scales which are completed on a computer, compared to written instruments [5], so it is expected that the properties found in this study are transferable to the written format of the RADS instrument.
All 30 items required to calculate a RADS score were embedded in the survey. In order to have a valid RADS score a student is required to answer at least 24 questions [3]. Students who answered at least 24 questions but less than the full complement had their scores scaled to total for 30 questions as advised by the RADS manual. Because some of the responses to questions are reversed, data from students who answered all of the questions with a maximum value or with a minimum value were considered invalid and removed.
Assessment of reliability and validity
The internal reliability of the scale was tested using Cronbach's coefficient alpha [6]. This test is based on the average correlation of items within the scale. Coefficient alpha values of 0.80 or greater are generally regarded as a good indication that the scale is internally reliable [7].
In line with the original testing of the scale [3], an assessment of content validity was made using item-total score correlations. Convergent validity was assessed by conducting Spearman correlations of the RADS score with other questions in the survey pertaining to depression and to questions on suicidal ideation, which is known to be related to depression [8–10].
To test construct validity, the factor structure of the RADS has been investigated. Reynolds reports a rotated factor model in his manual. A rotated factor analysis, which is a multivariate dimension reduction technique used to examine the latent variable structure of the data, was conducted for the overall population and for each ethnic group of New Zealand young people in the study.
Results
Demographics
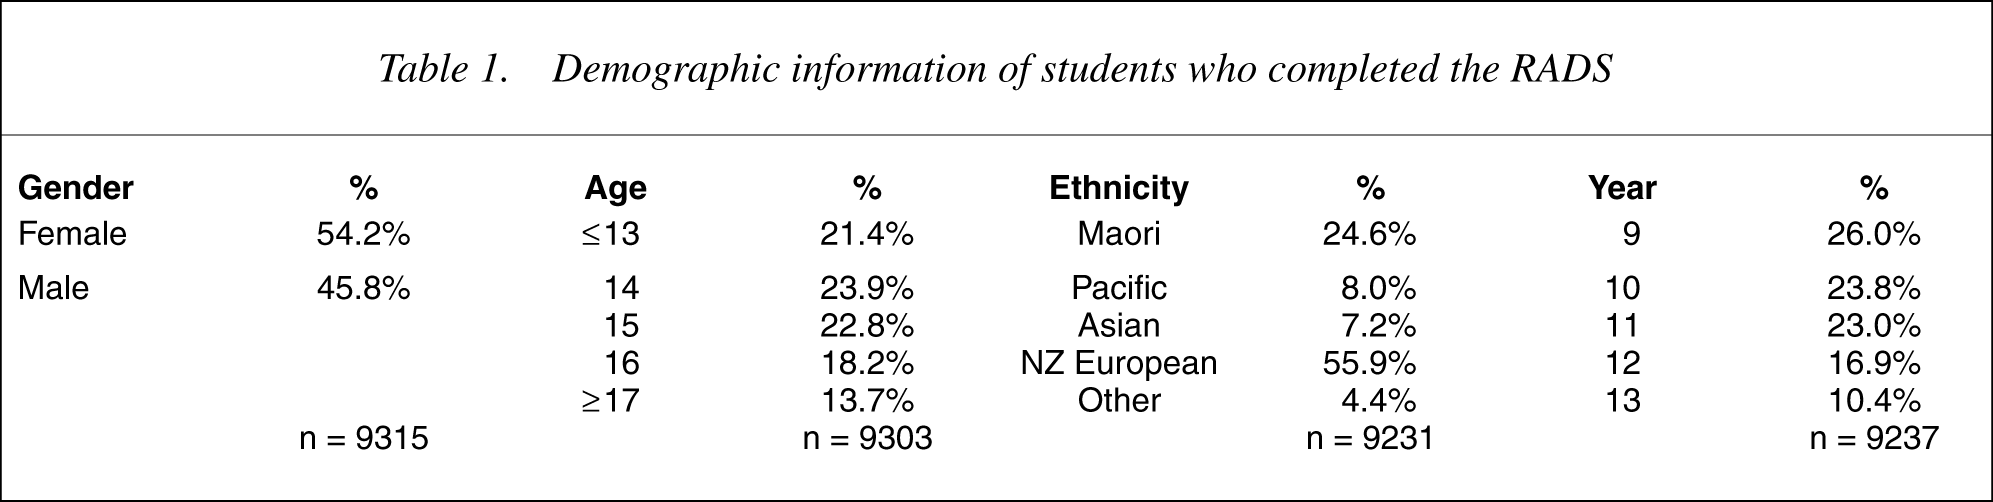
One hundred and fourteen (85%) schools agreed to participate in the survey and overall, 9699 students completed the whole survey. The demographics for the sample have been reported in detail and give a reasonable representation of the overall population of New Zealand young people [1]. The demographic characteristics of the 9315 students who completed the RADS appropriately are summarized in Table 1.
Demographic information of students who completed the RADS
The mean RADS score for the whole sample was 59.0 (± 0.6 standard error). The mean score for female students of 61.6 (± 0.7) was significantly higher than for male students who had a mean score of 55.9 (± 0.5) (Mann–Whitney test, p < 0.001). This difference was also reflected in those students categorized as displaying clinically significant depressive symptoms [8.8% (± 1.0%) of male students and 18.3% (± 1.3%) of female students].
Reliability and validity
Internal reliability
The overall Cronbach's Coefficient Alpha value for the Youth2000 survey was 0.936, which is well above the benchmark of 0.80 [6] and higher than the overall Reynolds value of 0.922. The coefficient alpha values for males students (0.930) and female students (0.938) are higher than their Reynolds counterparts (0.912 and 0.937, respectively). The scores for all of the main ethnic groups were also greater than 0.9.
Content validity: item-total score correlations
The correlations between each of the items and the overall RADS score, from both the Youth2000 survey and the Reynolds Handbook were examined. The correlations for every item are at least as strong in the Youth2000 survey as those reported by Reynolds. As with Reynolds, the correlations for the female students are generally higher than those for the male students. The item-total correlation for 25 of the 30 items was above 0.5, with a median correlation of 0.62 (compared to 0.53 for Reynolds). The item-total correlations for each ethnic group followed a similar pattern to the overall correlations. Correlations between individual RADS items and the overall score are available from the authors.
Convergent validity
The RADS had a correlation of 0.51 with the suicide-ideation question (‘During the last month have you thought about killing yourself?’), a correlation of 0.55 with the general well being question (‘In general, how are you feeling?’) and a correlation of −0.63 with the question on student's happiness (‘Are you feeling happy or satisfied with your life’).
Construct validity: factor analysis
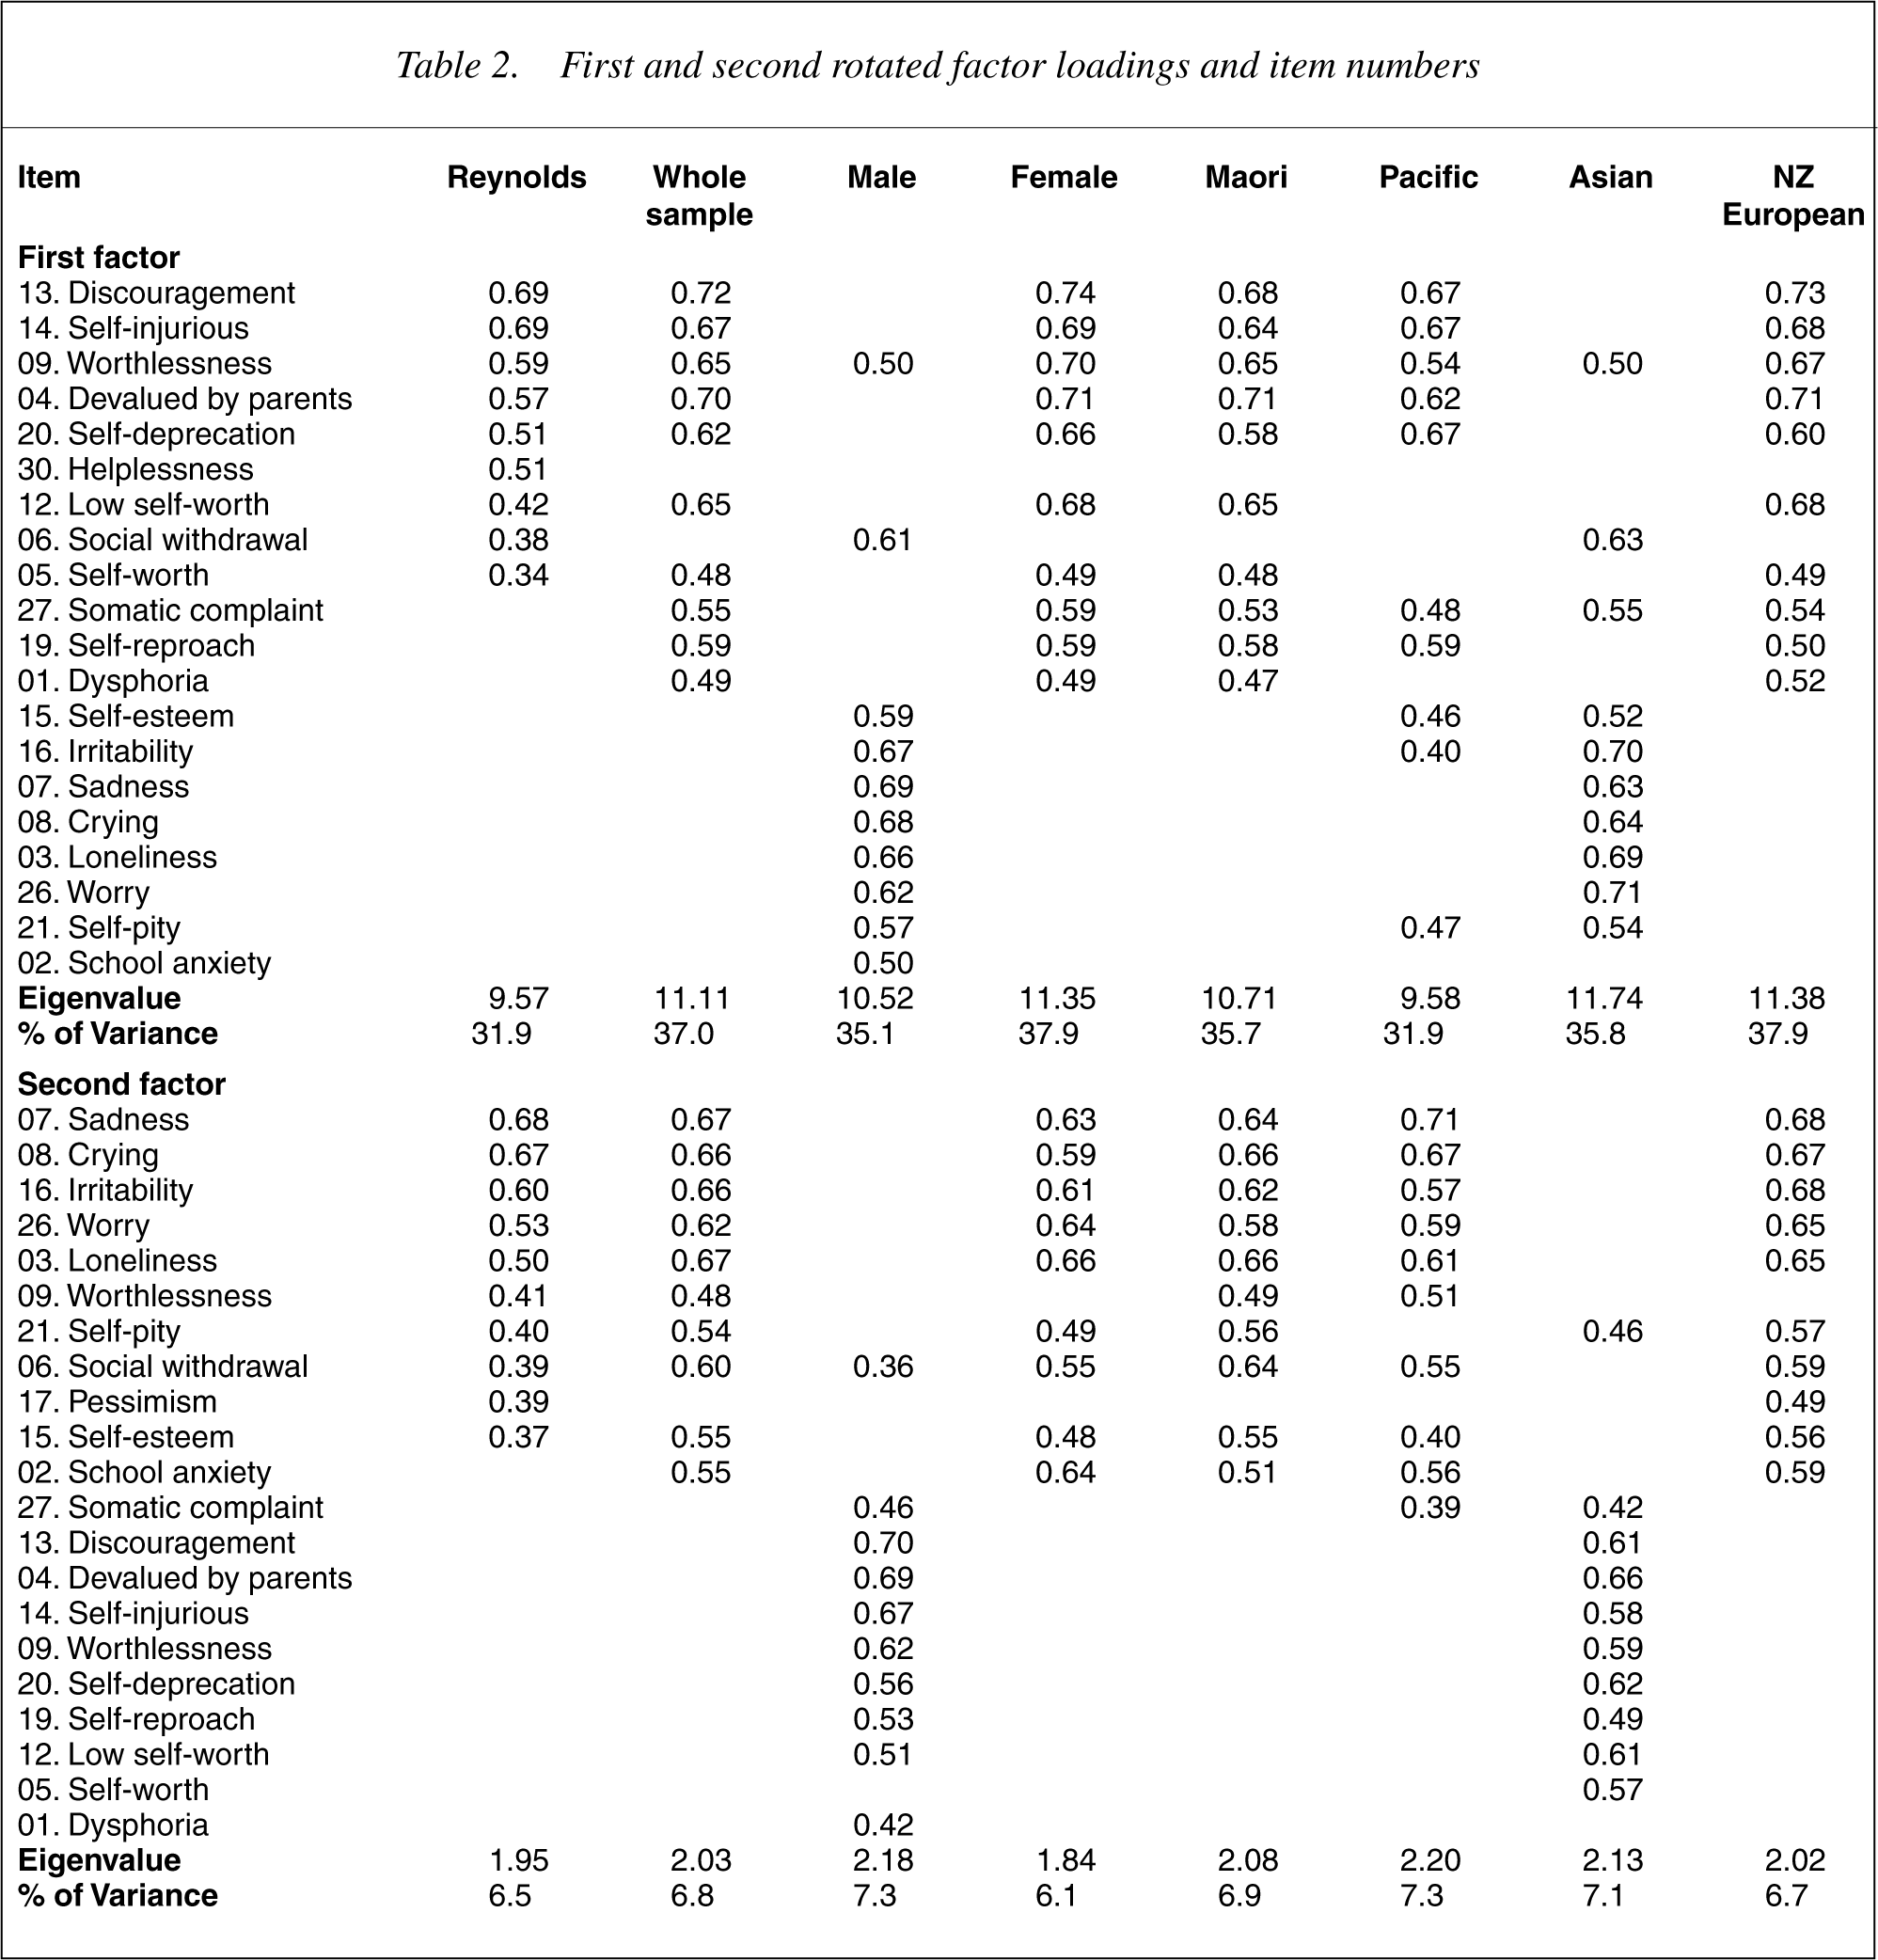
The factor loadings and order of items for the first two factors of the factor analysis are shown in Table 2. Furthermore, the first four factors were computed for the New Zealand population and found to be remarkably similar to those reported by Reynolds. There is a strong first factor, accounting for approximately 35% of the variation and the items follow a similar order throughout each factor. Within the ethnic and gender subgroups the items grouped into the four factors are similar, although for male students and Asian students, the first and second factors were reversed and the third and fourth factors were reversed. Consequently, the variance explained by the factors differs for these two groups.
First and second rotated factor loadings and item numbers
Discussion
This analysis supports the use of the RADS in New Zealand in all ethnic groups with an internal consistency, content and convergent validity and factor structure that compare well with populations of young people on whom this scale was originally validated.
There are many similarities between the results of the RADS in the Youth2000 survey and the results in the RADS manual. The average scoring and distributions of scores were similar, whilst measures such as the Cronbach's coefficient alpha for internal reliability were stronger in the Youth2000 survey data than in the original data presented by Reynolds. The overall mean RADS score of 59 was slightly below Reynolds value of 60, with the mean values for both male and female students being correspondingly lower than the Reynolds counterparts.
The performance of a scale is judged in terms of its reliability and validity. Reliability refers to the extent to which all the items of the scale measure one construct and consistency of the scale in measuring the same construct every time. Traditionally there are four approaches to measuring reliability: the internal consistency or the ability of different items to relate to each other, the total score and in turn the underlying construct; test-re-test reliability or stability of the measure over time; interrater reliability or agreement between different raters; parallel reliability or agreement between similar forms of a scale.
The internal consistency of the RADS in this sample is stronger than that reported by Reynolds [11]. The high Cronbach's coefficient alpha shows that the responses for all of the items are highly correlated, indicating that they are all asking about the same underlying trait. The item-total score correlations, which are also higher than those found by Reynolds, demonstrate that the individual items are measuring the various symptoms of depression. The consistency and strength of the correlations supports the summation of the items to get a total score (as it did with the original RADS testing).
The validity of a scale is the extent to which it measures what it was designed to measure. There are three major types of validity: content, construct and criterion validity.
Content validity is an assessment of whether a test is representative of a specific behavioural or emotional domain. Content validity may be partially inferred from item-total score correlations as there should be a tendency for those who endorse specific symptoms of depression to have a higher total score of depression overall. This indication of content validity is supported by the results of the tests of convergent validity. Correlations are shown to other depression related questions, such as suicidal ideation, which is known to be related to depression [8–10].
Construct validity is shown if the scale is shown to tap a theoretical construct and that it has ‘discriminant’ and ‘convergent’ validity. Factor analysis is one way of examining a scale's convergent and discriminant validity.
Overall the factor analysis for this population is remarkably similar to that originally reported by Reynolds. Reynolds describes the first as ‘a general demoralization factor’, with items measuring helplessness and hopelessness, the second factor as one of ‘despondency and worry’, the third as a somatic-vegetative factor and the fourth as one of anhedonia.
All subgroups had very similar items in the first two factors. For Asian students and male students, however, the order of the factors was reversed, with items relating to despondency and worry loading on the first factor and the second factor being more related to demoralization. The reason for this is due to the nature of the factor analysis method rather than any significant differences in the pattern of responses for male students and Asian students. The order of the factors is related to the percentage of variance that is explained by each factor and is based on the covariance structure of the data. The scores for each item can only comprise of a collection of 4 possible values (1–4), which limits the scope for differences between the covariances. This means that a subtle difference in the scores can create enough of a shift in the covariance structure to alter the order of the factors [12], as can be seen by the reversing of the factors for the male students and Asian students.
Criterion validity is established by assessing the correlation between the scale and other measures of the same or related constructs. In this study we have been unable to assess predictive validity but have assessed concurrent validity by measuring correlation with other measures of depression and with suicidal ideation which should correlate with the RADS score. Our study shows that concurrent validity within the New Zealand context is similar to the original measures reported by Reynolds in the RADS manual.
There are limitations to this study. There are a number of measures of reliability and validity that have not been carried out due the nature of the data collected. The content validity has not been assessed adequately. Ideally this would be done by comparing the scores in the RADS with some for of ‘gold-standard’ assessment of depression, for instance a clinical diagnosis. Testretest reliability could not be assessed because data were collected at one time point only. Inter-rater reliability and parallel reliability were not relevant to this data set.
Internationally, research has been done on the use of the RADS across different countries and ethnicities. As with the Youth2000 analysis, studies in Canada [13], Hong Kong [14] and Australia [15] all found the RADS to have strong internal consistency (Cronbach's alpha greater than 0.8) in their respective populations, although their respective sample sizes provided lower levels of consistency than the Youth2000 data. A factor analysis of the Australian data showed some similarities in terms of the general factors structure, although the factors explained a much lower percentage of the variation of the data than the Youth2000 data or the original Reynolds validation work. The RADS has also been used as a measure for Mexican–American [16] and Latino-American [17] adolescents.
Conclusion
The evidence provided by this study suggests that the RADS is a valid and appropriate instrument to use with New Zealand adolescents. It demonstrates consistency and validity which is at least as strong as the original testing and overseas studies. The next logical step in the study of the RADS with New Zealand adolescents is to compare its performance to a ‘gold-standard’ assessment of depression.
Footnotes
Acknowledgements
We thank the people who participated in the survey, staff from the participating schools, the members of the Adolescent Health Research Group, the Maori and Pacific advisory groups, and Suzanne Pitama and Fiva Fa'alau.
This research was supported by grant 00/208 from the Health Research Council of New Zealand and a grant-in-aid from the Alcohol Advisory Council of New Zealand. Additional support for the laptop computers was provided by Portables Plus and the Starship Foundation.