
Abstract
Keywords
The Reynolds Adolescent Depression Scale (RADS) [1], [2] has been recommended as the instrument of choice for screening for depression in community adolescent samples [3]. There are situations and settings, however, where time needed for completion is a major constraint in the use of the RADS. For this reason the 10-item short form of the RADS (RADS-SF) was developed as a brief self-report measure of depressive symptomatology in adolescents aged 11–20 [Reynolds WM: personal communication, 2006]. Results have shown that the RADS-SF purportedly has similar psychometric properties to the RADS.
We have previously published data on the reliability and validity of the RADS in New Zealand adolescents [4], showing consistency and validity as strong as the original testing done by Reynolds and in overseas studies. The present study examined the internal reliability, criterion validity and construct validity of the RADS-SF in comparison to its full-length version in this population.
Method
Participants
This is a secondary analysis of data collected in 2001 in the Youth2000 [5]. A total of 133 schools that had more than 50 students in Year 9 through to Year 13 were randomly selected and invited to participate in the Youth2000 survey. Approximately 15% of students were then randomly selected from the school rolls of each participating school. Students were excluded if they were not New Zealand residents, had insufficient English language skills (inferior to Year 6) or a disability preventing them from using a standard laptop computer. Details of the demographics, methodology and early findings have been reported in detail elsewhere [4–7].
Measures
The RADS is a 30-item, self-rated questionnaire with responses made on a 4-point scale, ranging from 1 (‘almost never’) to 4 (‘most of the time’). According to the RADS manual, test scores range from 30 to 120 and higher scores indicate depression symptoms, with scores >77 indicating that clinically significant depression may be present [1]. There are also six critical items that discriminate between depressed and non-depressed adolescents. It has been recommended that those who reach a critical level in at least four of the six items should be viewed as needing professional assessment regardless of their overall score [1]. The RADS-SF consists of 10 items from the RADS, with a possible test score ranging from 10 to 40. The RADS-SF items are numbers 1, 3, 6, 7, 14, 19, 20, 22, 28, 30, including six critical items (item numbers: 3, 6, 14, 19, 20, 30). The RADS-SF has been shown to have psychometric properties similar to the RADS in the US population [Reynolds WM: personal communication, 2006].
Assessment of reliability and validity
Internal consistency reliability was measured using Cronbach's alpha coefficients that indicate good reliability if ≥0.70 [8]. Criterion validity was assessed using Pearson product-moment correlations between the RADS-SF and the RADS for the total sample and subgroups (see below). Construct validity was assessed using both convergent validity and factor structure of the RADS-SF. As evidence of convergent validity, Spearman correlations between the RADS-SF and other questions in the survey related to depression (i.e. suicidal ideation and well-being) were assessed. The suicidal ideation question (‘In the last 12 months have you thought about killing yourself (attempting suicide)?’) was measured on a 4-point scale (anchored by 1 = not at all and 4 = three or more times), with higher scores indicating higher suicidal ideation. The general well-being question (‘In general, how have you been feeling?’) was measured on a 3-point scale (anchored by 1 = in a good mood, 2 = my moods go up and down, and 3 = in a bad mood), with higher scores indicating lower general well-being. Student's happiness (‘Are you happy or satisfied with your life’), was measured on a 4-point scale (anchored by 1 = not at all happy or satisfied and 4 = very happy/satisfied), with higher scores indicating higher happiness. These questions are known to be related to depression [6], [9], [10].
The factor structure of the RADS-SF was assessed through confirmatory factor analyses testing a single factor model of depression, in which all 10 items load on a single latent factor. These analyses were performed using LISREL and maximum-likelihood estimation procedures [11], taking the observed covariance matrix as the input. Sixty participants with all cases missing were excluded, and multiple imputation using the EM algorithm [12] was conducted to replace isolated missing values (0.27%). Four measures of fit were considered to assess the degree to which the data fit the RADS-SF model: comparative fit index (CFI), the root mean square error of approximation (RMSEA, and its 90% confidence interval (CI)), and the standardized root mean square residual (SRMR). Models with CFI, RMSEA and SRMR having values close to 0.95, 0.06 and 0.08 or better indicate acceptable fit [13]. Multigroup confirmatory factor analyses were performed to test for configural invariance of the RADS-SF across gender and five age groups (≤13, 14, 15, 16, and ≥ 17) and ethnic groups (Maori, Pacific, Asian, NZ European, and other). Configural invariance is tested by constraining the factorial structure to be equal across groups, and it is satisfied if the basic model structure is invariant across groups [14]. CFI and RMSEA were used as fit statistics for the configural invariance test.
Classifications of students into those with clinically significant levels of depressive symptoms using the critical items, consistency criteria and the RADS cut-off point of 77 [2] were compared with those using the critical items, consistency criteria and the recommended cut-off point of 26 on the RADS-SF [Reynolds WM: personal communication, 2007]. The agreement between the two forms was assessed using kappa statistics, with higher values indicating higher agreement. Alternative cut-off points in the RADS-SF were investigated using receiver operating curves in order to maximize the classification agreement between the RADS-SF and RADS in the New Zealand sample.
Results
Demographics
One hundred and fourteen schools (85%) agreed to participate in the survey and overall, 9567 students took part in the survey. The demographics of these students are broadly representative of the overall population of New Zealand young people [4]. The demographic characteristics of the subset of 9288 students who completed at least eight of the RADS-SF items and had a score for the RADS are summarized in Table 1. Reynolds reports a mean score of 51.87 (SD = 9.54) for a school sample [Reynolds WM: personal communication, 2006]. The RADS-SF scores for the Youth2000 sample ranged from 10 to 40 (median = 20), with mean of 20.16 (SD = 6.05).
Demographic data and mean RADS and RADS-SF scores
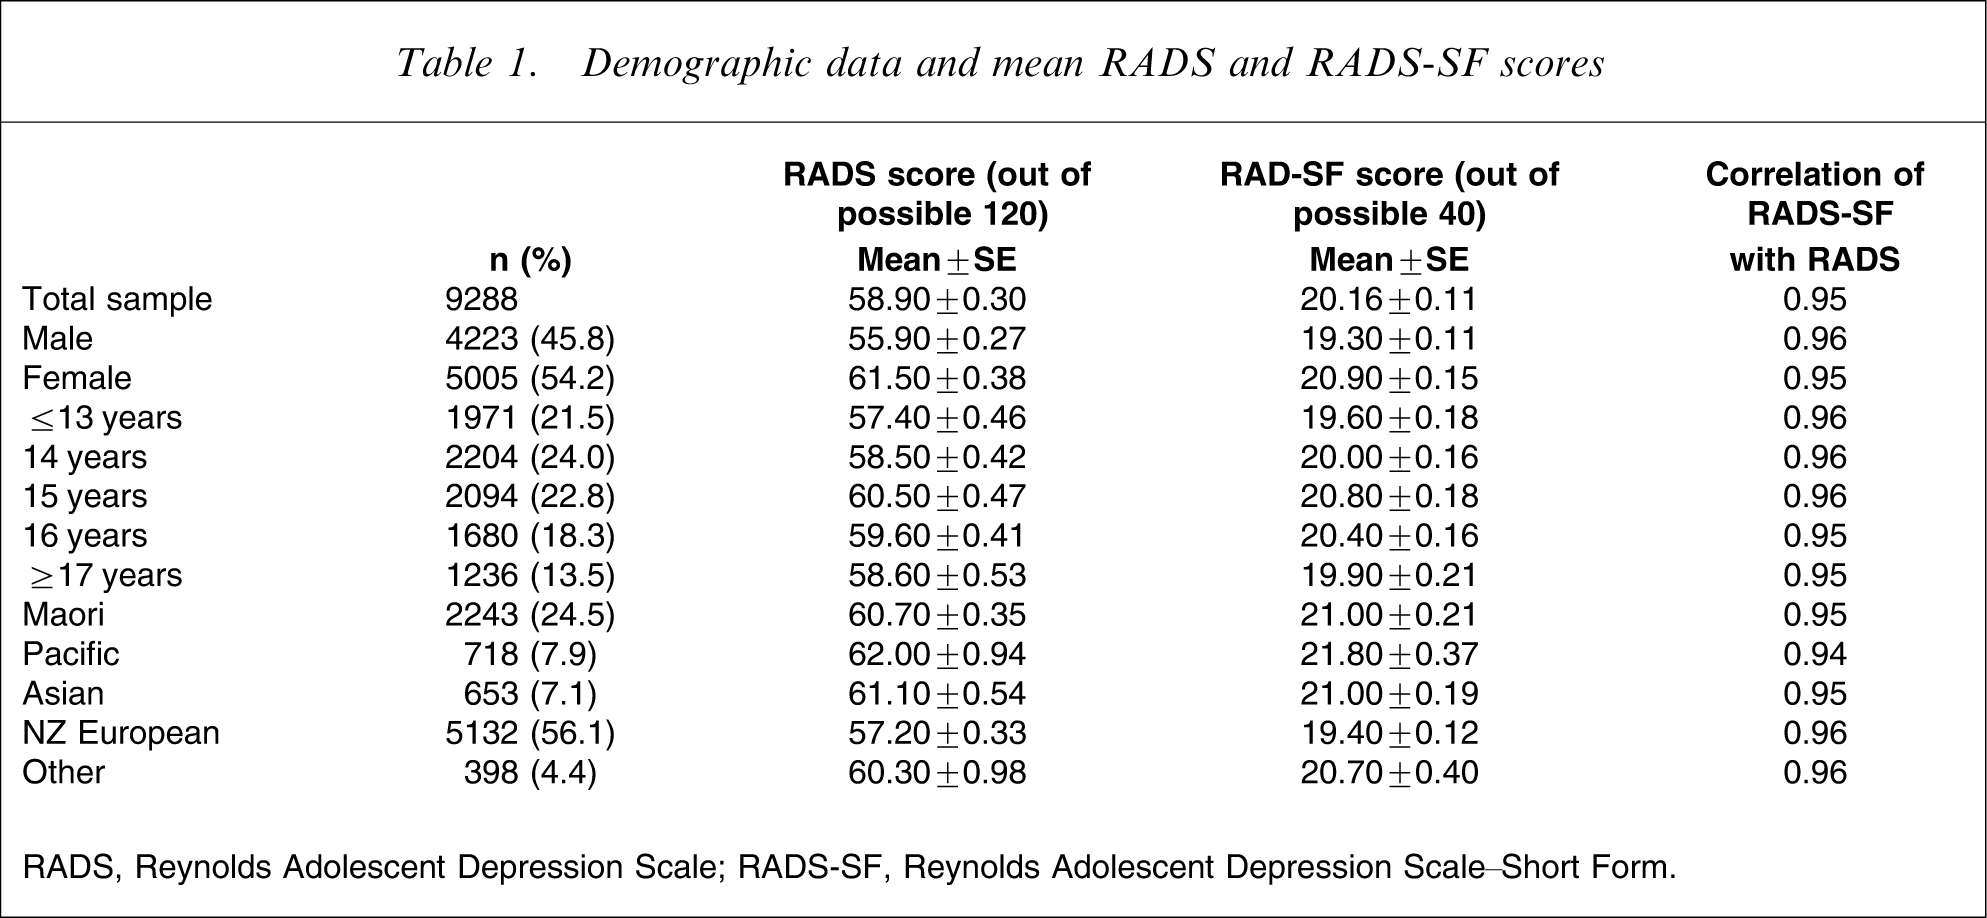
RADS, Reynolds Adolescent Depression Scale; RADS-SF, Reynolds Adolescent Depression Scale–Short Form.
Reliability and validity
Internal reliability
Cronbach's alpha was 0.88 for RADS-SF and 0.94 for RADS. The value found for the RADS-SF was higher than the value (0.86) found by Reynolds [Reynolds WM: personal communication, 2006], and also above the optimum level of 0.70 [8]. Correlations between individual RADS-SF items and the overall score ranged from 0.45 to 0.71 (Table 2).
Item-total correlations for the RADS-SF
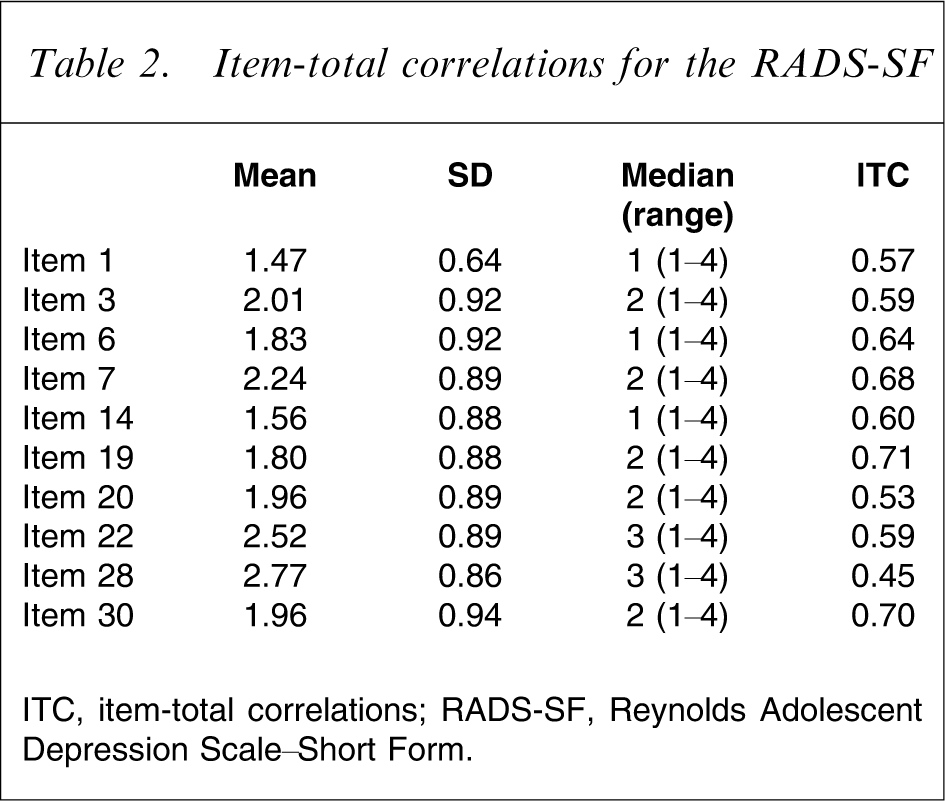
ITC, item-total correlations; RADS-SF, Reynolds Adolescent Depression Scale–Short Form.
Criterion validity
The correlations between the RADS-SF and the RADS were calculated as an indication of criterion validity. Reynolds reports a correlation of 0.96 between the two forms [Reynolds WM: personal communication, 2006]. The correlation for the New Zealand population was 0.95. This correlation was consistent across age, sex and ethnicity, with all correlations between 0.94 and 0.96 (Table 1). Although a strong correlation is expected due to item overlap, this result indicates congruence between the two forms. The differences in mean scores for these subgroups were comparable between the RADS-SF and the RADS (Table 1).
Construct validity
The correlations of the RADS-SF with measures of related constructs were performed as an indication of convergent validity. The RADS-SF had a correlation of 0.48 with the suicidal ideation question (‘In the last 12 months have you thought about killing yourself?’), a correlation of 0.53 with the general well-being question (‘In general, how have you been feeling?’), and a correlation of −0.60 with the question on student happiness (‘Are you happy or satisfied with your life’). Similar correlations were also obtained for the RADS: 0.49, 0.55, and −0.61, respectively.
Confirmatory factor analyses were performed to further assess construct validity. The RADS-SF had acceptable fit (χ2=2701.43, df = 35, CFI = 0.97, RMSEA = 0.091, 90%CI = 0.088–0.094, SRMR = 0.042), and all parameters from the manifested indicators to the latent variable were statistically significant (t > 1.96, p < 0.05) and high (Figure 1). This indicates that all 10 RADS-SF items serve as good indicators of their underlying latent construct (i.e. depression). Results from multigroup confirmatory factor analyses indicated that configural invariance of the RADS-SF was satisfied across gender (χ2=2654.88, df = 70, CFI = 0.97, RMSEA = 0.089, 90%CI = 0.087–0.092), and the five ethnic groups (χ2=2491.60, df = 175, CFI = 0.97, RMSEA = 0.089, 90%CI = 0.086–0.092) and age groups (χ2=2728.22, df = 175, CFI = 0.97, RMSEA = 0.089, 90%CI = 0.086–0.092).
Standardized coefficients for confirmatory factor analysis of the short form of the Reynolds Adolescent Depression Scale (RADS-SF). All coefficients are statistically significant at the 5% level (t > 1.96, p < 0.05). Arrows without origin indicate error terms. Fit indices are reported in text.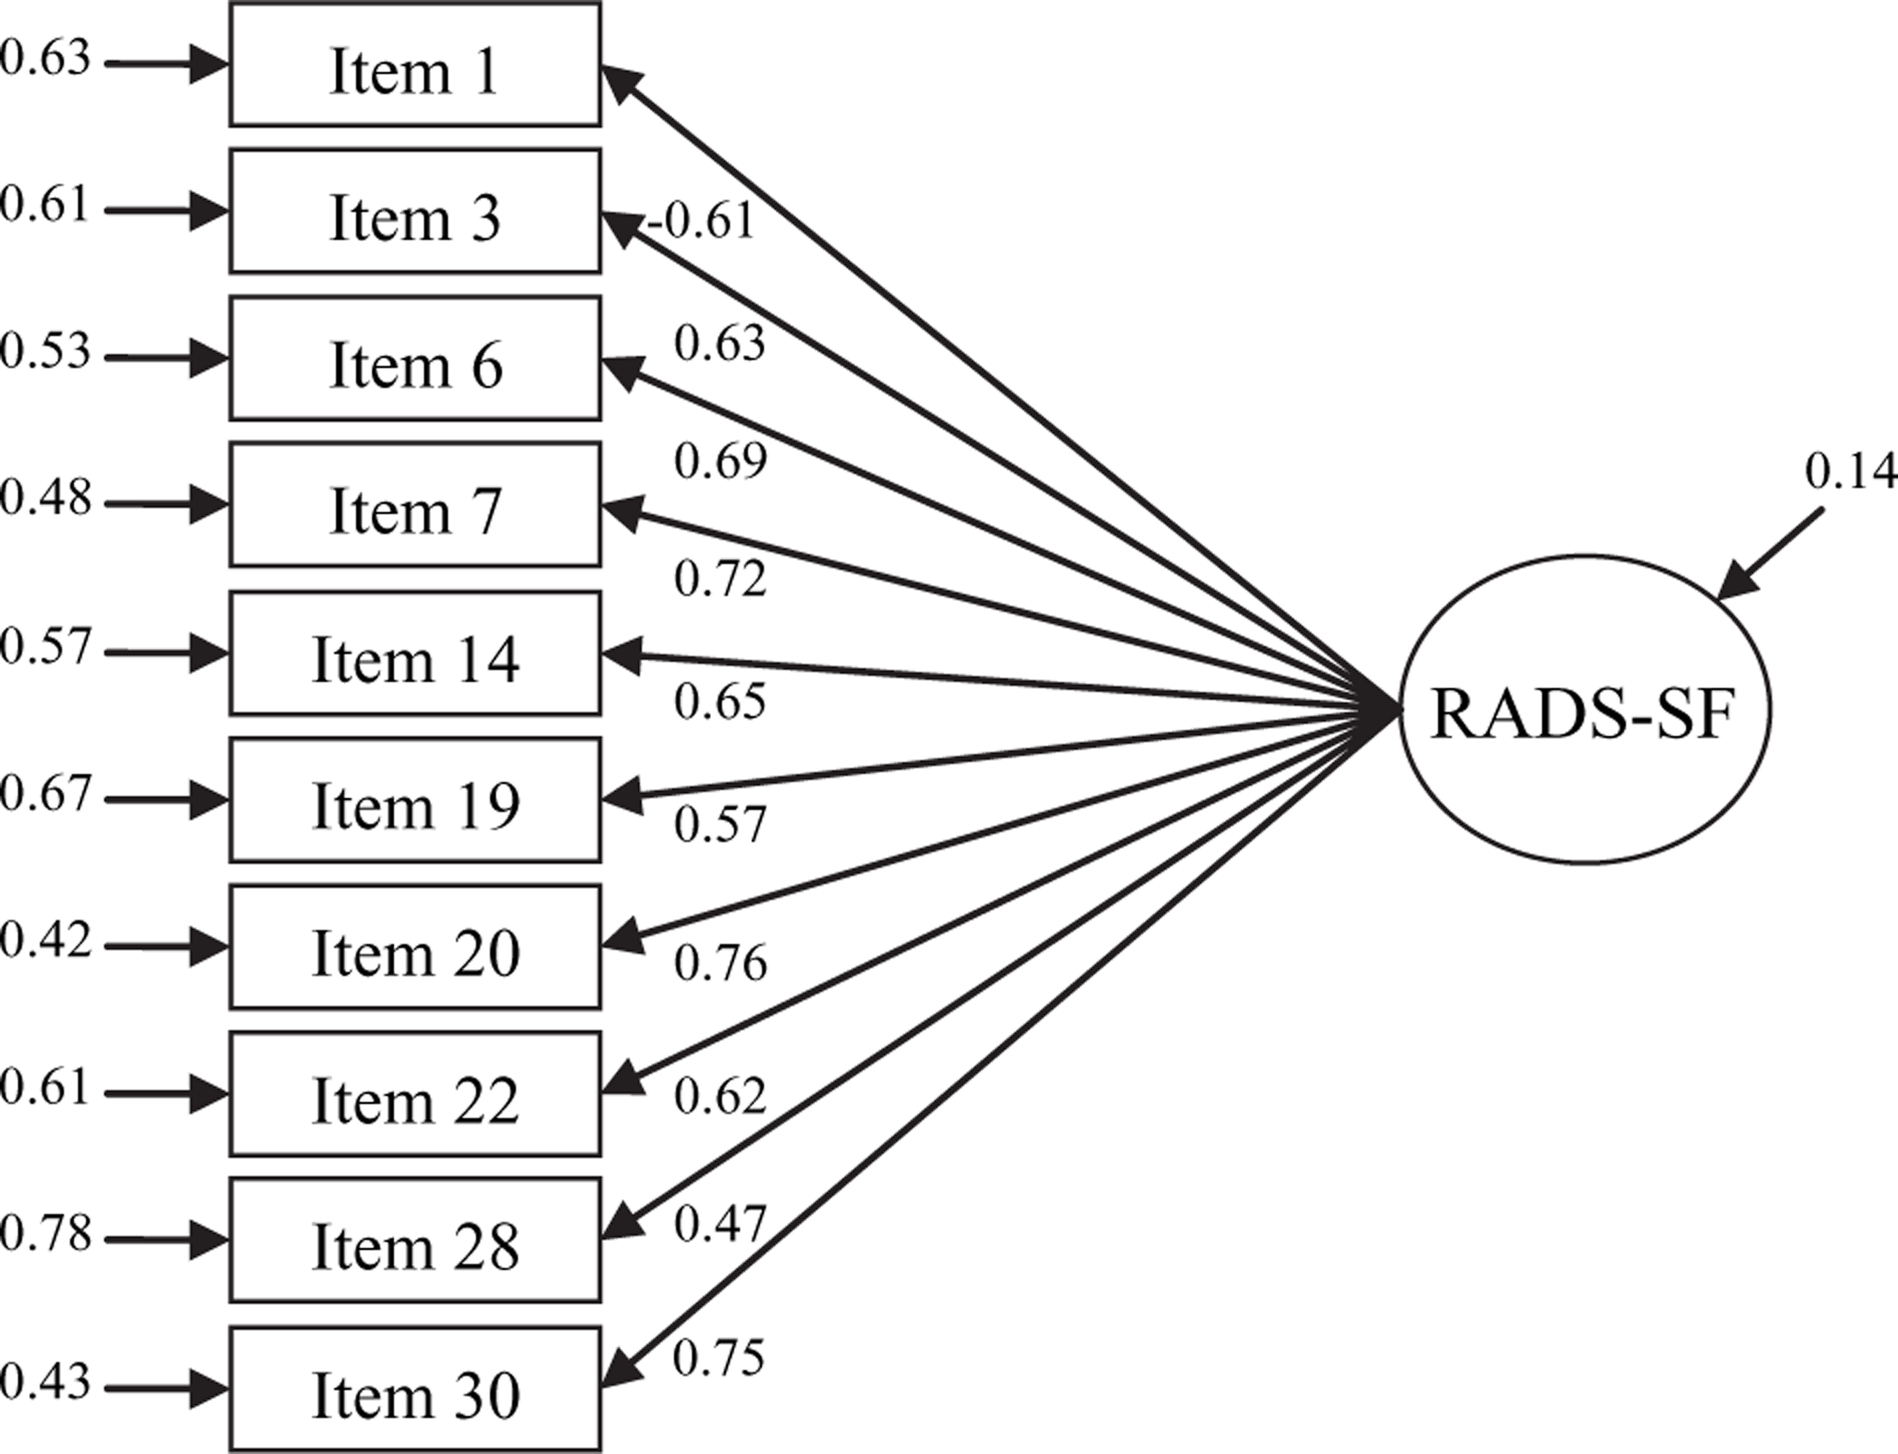
There was good agreement between the classification of adolescents as having depressive symptoms using the critical items, consistency criteria and recommended cut-off of 26 for the RADS-SF and the RADS (κ = 0.75), with 93.1% having the same classification. Using the RADS as the gold standard, the sensitivity of the RADS-SF was 94.8% and specificity, 92.8%. The estimated prevalence of depressive symptoms was higher (p < 0.001) for the RADS-SF (19.2, 95%CI = 18.1–20.4) than for the RADS (13.8, 95%CI = 12.8–14.9). Using a cut-off of 28 for the RADS-SF there was higher overall agreement (95.2%) with the RADS, and in particular closer agreement in the percentage classified with significant levels of depressive symptoms (12.4, 95%CI = 11.5–13.3) compared with using the lower cut-off. Correspondingly there was a drop in sensitivity to 76.9%, and increase in specificity to 98.1%. The relationship between the classifications of depressive symptoms by the RADS-SF and the RADS were not found to differ across gender, age or ethnic groups.
Discussion
We have shown that the RADS-SF performs well compared with the RADS and is an acceptable alternative to it. This is an important finding given the need for brief, accurate measures to estimate levels of depressive symptomatology in adolescent populations. If depression is to be measured accurately as part of wider surveys of health and well-being, as we have attempted to do in New Zealand, then keeping the number of questions to a minimum is important. The RADS-SF has psychometric properties comparable to the RADS and the results for the New Zealand sample were similar to those obtained for a US school sample [Reynolds WM: personal communication, 2006]. We have also reported novel findings of confirmatory factor analyses for the RADS-SF. These findings indicated that the RADS-SF structural model had good fit to the data, and that this model is also invariant across gender and five age and ethnic groups. The results indicate, therefore, that the RADS-SF had acceptable internal reliability, criterion validity and construct validity in New Zealand as well as in the US samples.
Although the recommended cut-off of 26 for RADS-SF leads to good sensitivity and specificity, it leads to greater percentage of students identified with significant levels of depressive symptoms than on the RADS. If the RADS-SF is to be used as a screening instrument then using a cut-off with greater sensitivity may be warranted, although the greater number of students identified as needing further assessment could be problematic. Using the alternative cut-off (i.e. 28) that most closely approximates the RADS classification in the present data leads to a big drop in sensitivity but may be more appropriate when looking at time trends. This difference highlights the major weakness of the present study and of others on the RADS or RADS-SF, namely the lack of a gold standard of depressive diagnosis with which to compare these results.
A further limitation of the RADS-SF is its lack of ability to properly cover all four subdimensions of depression identified and measured by RADS. The content of the RADS-SF items do cover all the subdimensions identified: Dysphoric Mood (items 3, 6, 7), Anhedonia/Negative Affect (item 1), Negative Self-Evaluation (items 14, 19, 20, 30), and Somatic Complaints (items 22, 28). For two of the dimensions, however, fewer than three items were selected. This limits the construct validity test of the subdimensions because researchers have recommended at least three observed indicators for each latent variable [14], [15]. Nevertheless, given that (i) all these five subdimensions measure the same underlying depression factor; (ii) researchers have typically used a single RADS score; and (iii) RADS-SF and RADS are strongly correlated, the use of RADS-SF items to measure a single depression factor seems adequate.
Future studies should further validate the RADS-SF by comparing its correlation with other instruments measuring depression in young people, by evaluating its test–retest reliability and its validity in clinical samples. The measurement invariance of the RADS-SF could also be assessed further by also testing for metric, scalar and latent mean invariance across gender, ethnic and age groups [16].
Conclusion
The evidence provided by the present study suggests that the RADS-SF has acceptable reliability and validity and that it has psychometric properties comparable to the RADS in a New Zealand population. This supports the use of the RADS-SF as a brief, reliable and valid instrument.
Footnotes
Acknowledgements
This research was supported by grant 00/208 from the Health Research Council of New Zealand. We thank Portables Plus and the Starship Foundation for their support with laptop computers. We also thank the participating students and schools, project workers, project advisory groups, and other members of the Adolescent Health Research Group. We wish to especially thank Dr W. M. Reynolds for his original work developing the Reynolds Adolescent Depression Scale and help with the preparation of this paper.