
Abstract
This paper addresses the identification of the optimal draw control strategy for a sublevel caving (SLC) operation at Malmberget mine in Sweden. Two mathematical models, a probability model and an economic model, were created using five datasets: bucket weights, bucket grades, extraction ratio, mine economics parameters and production constraints. The probability model was used to generate a set of simulated bucket weights and corresponding bucket grades which acts as a ‘virtual mine’ environment. The economic model assesses the economic impact of loading at the draw point. Two approaches to draw control were tested using the ‘virtual mine’ created by the probability model. Based on the results of the simulation tests, an optimal draw control strategy is suggested for a field test at the mine. The new draw control strategy optimises further the loading operation at Malmberget mine. The paper shows a roadmap for optimising draw control strategy for SLC operations.
Keywords
Introduction
For sublevel caving (SLC) operations, loading at the draw point is a complex process because of the confined blasting conditions, chaotic material flow and continual mixing of ore and waste (Power 2004; Hustrulid and Kvapil 2008; Brunton 2009; Brunton et al. 2010; Wimmer 2014; Nordqvist and Wimmer 2016; Ghosh 2017; Petropoulos 2017). SLC is characterised by blasting of the ore body and caving of the hanging wall which provides an opportunity for selective mining and a low incubation period for positive cash flow (Bull and Page 2000). A draw control strategy defines the amount of material to be loaded from a draw point and specifies the time to stop loading from a draw point. Past literature on draw control models shows a general lack of a holistic approach to the issue of loading at the draw point (Shekhar et al. 2018). A qualitative assessment of the eight draw control strategies highlighting their advantages and limitations is given in and Shekhar et al. (2018).
A draw control strategy for SLC operations is optimised to achieve pre-determined mine objectives. The mine objectives are quantified into measurable Key Performance Indicators (KPIs). A common KPI used for optimising draw control is Net Present Value (NPV) (Jamieson 2012; Campbell and Power 2016). A draw control strategy which maximises NPV was chosen by the Telfer mine and the Ernest Henry SLC operations (Jamieson 2012; Campbell and Power 2016). Using NPV is popular for several different mining methods, as it is able to quantify all cost and revenue components over a period of time. Recent literature highlights the need for incorporating operational delays (e.g. grade uncertainty and hang-up delay) while optimising draw control and estimating NPV (Dirkx et al. 2019). However, caving operations have an inherent variability in the amount and quality of material that is mined yearly because of the chaotic and non-uniform material flow, alongside other production and rock mechanics issues (e.g. seismicity) (Power 2004; Hustrulid and Kvapil 2008; Brunton 2009; Brunton et al. 2010; Nordqvist and Wimmer 2014; Wimmer 2014; Nordqvist and Wimmer 2016; Ghosh 2017; Petropoulos 2017; Danielsson et al. 2018). Hence, daily control of the loading operation at the draw point is required to determine when loading of a given ring should be stopped. Caving operations which do not measure ore grade at the draw point are unable to register this variation and must, therefore, use a uniform and static control of loading at the draw point (Jamieson 2012; Campbell and Power 2016; Shekhar, Gustafson, Schunnesson, et al. 2016). The final extraction ratio targets are lower near the hanging wall, and the target increases as the draw point location moves from hanging wall to footwall (Campbell and Power 2016). Caving operations which can measure the ore grade at the draw point can optimise the draw control for individual draw points. Two examples of caving operations which measure ore grade at the draw point are the Kiirunavaara and the Malmberget mines, which exploit the density difference between ore and waste to continuously monitor material grade at the draw point (Davison 1996; Shekhar et al. 2017). This is done by measuring the weight of the material loaded in the Load Haul Dump (LHD) machine buckets. In this paper, the term ‘bucket weight’ refer to the weight of the material loaded in the bucket and ‘bucket grade’ refer to the estimated grade of the material loaded in the bucket (Davison 1996; Shekhar et al. 2017).
This paper aims to develop an optimal draw control strategy for the Malmberget mine using two previously developed mathematical models, a probability model (Shekhar, Martinsson, et al. 2019) and an economic model (Shekhar, Gustafson, et al. 2019). First, the current approach to draw control, at the Malmberget mine, is studied with respect to its sensitivity to mine economics and its effect on mine life and mine profitability. Secondly, a new approach to draw control, based on the economic model (Shekhar, Gustafson, et al. 2019), is developed and tested for the mine.
Model application
The primary function of the two mathematical models used in this paper is as follows.
Probability model
The probability model creates a ‘virtual mine’ environment which captures the variation and uncertainty associated with loading at the draw point (Shekhar, Martinsson, et al. 2019). The virtual mine environment provides a simulated dataset (bucket weights and corresponding bucket grades) to test draw different control strategies. For this study, the model parameters were calibrated for the Malmberget mine using historical production data.
Economic model
The economic model provides a real-time economic assessment of the draw point performance (Shekhar, Gustafson, et al. 2019). The model assesses the economic impact of loading at the draw point and was upgraded to include an additional economic parameter called target profit. Target profit is defined as the minimum amount of profit an organisation plans or budgets to achieve in the coming financial year. The operational profit of a single ring is defined as:
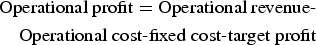
Shekhar, Gustafson, et al. (2019) described the formulae for the calculation of the parameters in Equation (1). The model has been designed to present the economic consequences when loading different amount of ore from the draw point. If enough material with inappropriate grade is loaded from the draw point it will generate an operational loss.
Following are the steps used for assessing the draw control strategy:
The relevant mining constraints are defined for the simulation. The KPIs being measured for assessing draw control are defined. The virtual mine environment created by the probability model is mined based on the draw control strategy. The simulated data achieved from the virtual mine environment in step 2 is assessed using the economic model. The results from the economic assessment are used to measure the KPIs. The measured KPIs are stored for comparison with other draw control strategies.
Mining constraints and simulation setup
Target production tonne for the different orebodies.

The total planned production target from all the production rings of the 12 orebodies for 2018–2019 is 10.91 Mt. The rest of the production for the mine relies on development drifts and residual loading from older production drifts, as described in Shekhar et al. (2017).
For each of the 12 orebodies, 1000 rings were simulated, resulting in a total of 12000 rings simulated for 0–400% extraction ratios. Analytical research of historical production data showed that approximately 10–15% of the draw points at Malmberget mine are active at 200% extraction ratio and approx. Five per cent of draw points are active at 400% extraction ratio. Similar observations have been made at Kiirunavaara mine (Shekhar, Gustafson, Boeg-Jensen, et al. 2016). Static draw control strategy used in Ernest henry mine also have maximum extraction ratio reaching 250% (Campbell and Power 2016). Hence, the maximum extraction ratio of up to 400% was simulated to capture the extreme scenarios. This ‘virtual mine’ environment simulates all scenarios, from poor to well performing draw points, and is free of the biases in the historical bucket weight dataset (Shekhar, Martinsson, et al. 2019). The simulated dataset was used to run simulation tests for the different draw control strategies.
Key performance indicators
Two KPIs were used to assess the optimal draw control strategy: number of rings mined and annual operational profit. An optimal draw control strategy balances these two KPIs, as it maximises operational profit whilst minimising the number of rings mined. A decrease in the number of rings mined helps to reduce the sinking rate of the mine and prolongs the mine's life. Both KPIs are pre-determined mine objectives for a sustainable operation (LKAB 2018). The period used for the simulation was one year, as the yearly production targets are known, along with estimated iron ore prices and historical mining costs. The yearly production targets reflect the long-term planning of the mine. Figure 1 shows a schematic flow chart of simulation setup presented in this paper.
Schematic flow chart of simulation setup.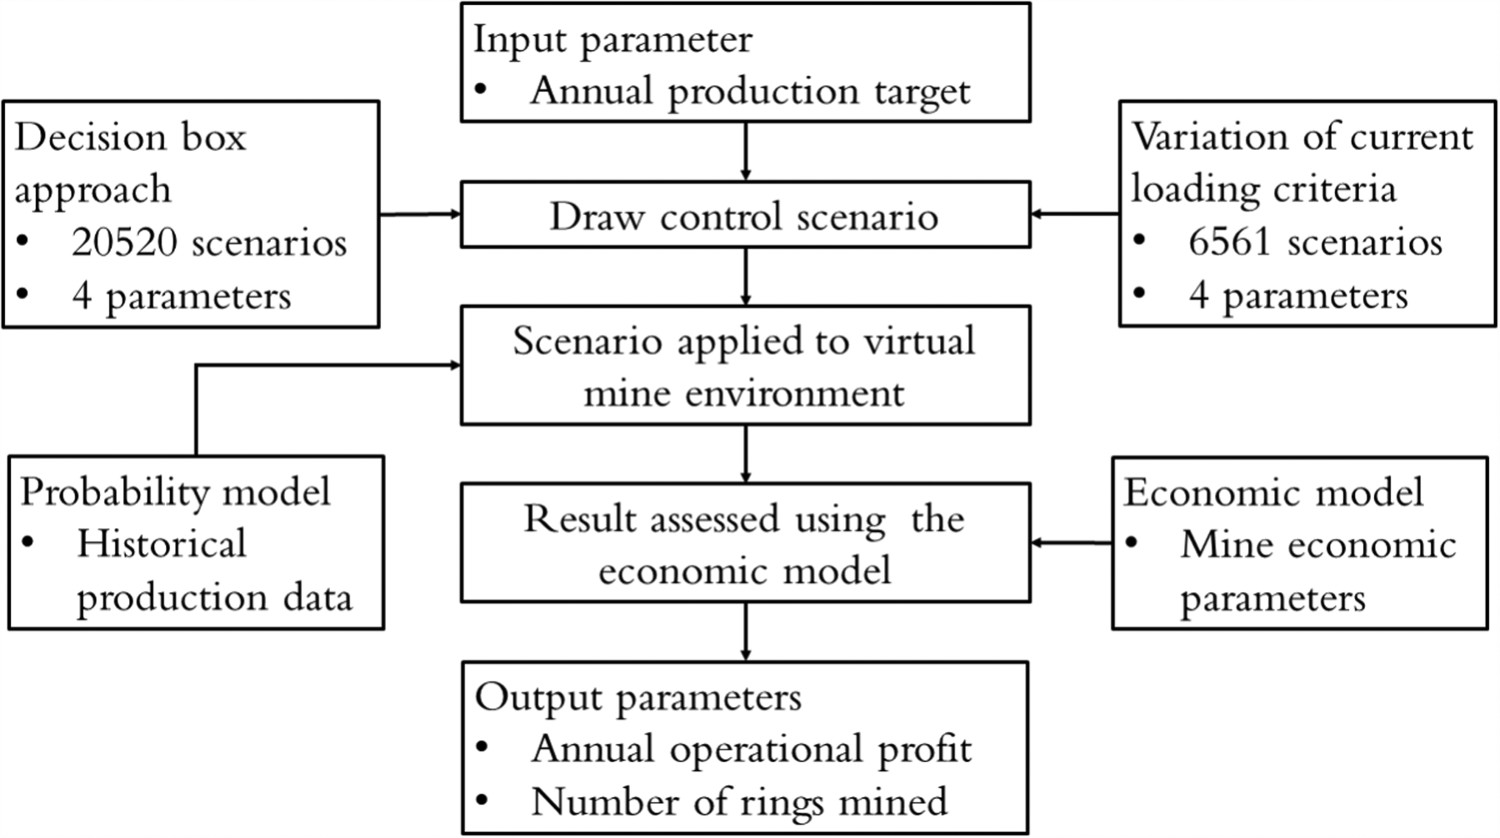
Economic sensitivity of current loading criteria
The Malmberget mine uses a continuous draw point monitoring system called Wireless Loader Information System (WOLIS) to provide a grade for every bucket loaded at the draw point (Shekhar et al. 2018). This is achieved by exploiting the difference in the density of ore and waste (Davison 1996; Shekhar et al. 2017). The Malmberget mine presently has three loading criteria as described in Shekhar, Martinsson, et al. (2019). The operators should continue loading until:
Minimum extraction ratio: The extraction ratio (ratio of the total tonne of material loaded from the draw point to the estimated tonne of the ring) > 80%; Shut-off grade: The average iron (Fe) content for the last 25%-units of the material loaded (extraction ratio wise) goes below 35%; and FE-trend: The trend of the Fe% for the last 40%-units of the material loaded (extraction ratio) is negative.
The operators should continue loading until all three criteria are met and, in general, loading is stopped when the loading criteria are met. However, it must be understood that closing of a draw point is a subjective decision and at the end depends on the assessment of the loading personnel.
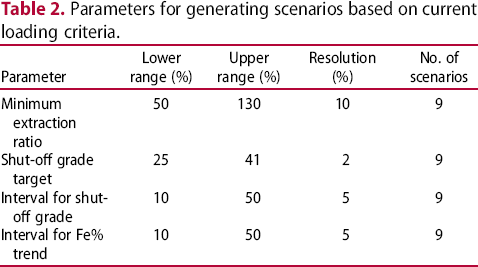
The loading criteria described above have four parameter values that decide the nature of draw control for the mine: minimum extraction ratio, shut-off grade target, interval for shut-off grade calculation and interval for Fe% trend calculation. These parameters affect when loading of a draw point is stopped. The optimal values for all four parameters need to be identified to optimise the draw control. Hence, it is necessary to understand the effect of these four parameters on the mine.
Parameters for generating scenarios based on current loading criteria.
The purpose of testing the variations in the current loading criteria were:
To understand the nature of the loading criteria and their effect on the mine performance, To benchmark the current loading criteria and explore the opportunity to recalibrate them.
Variation of current loading criteria
Figure 2 shows the results for the 6561 scenarios generated by varying the four parameters of the loading criteria for the current iron ore product (pellet) revenue. The x-axis shows the number of rings mined, and the y-axis shows the estimated annual operational profit for the different scenarios. Moving from left to right in the figure, more rings are mined with a lower final extraction ratio, gradually decreasing the total dilution. In this figure, the blue marks show the simulated scenarios, and the black marks show the current loading criteria at the mine, see above.
Scatter plot for current iron ore product revenue (Images are available in colour online).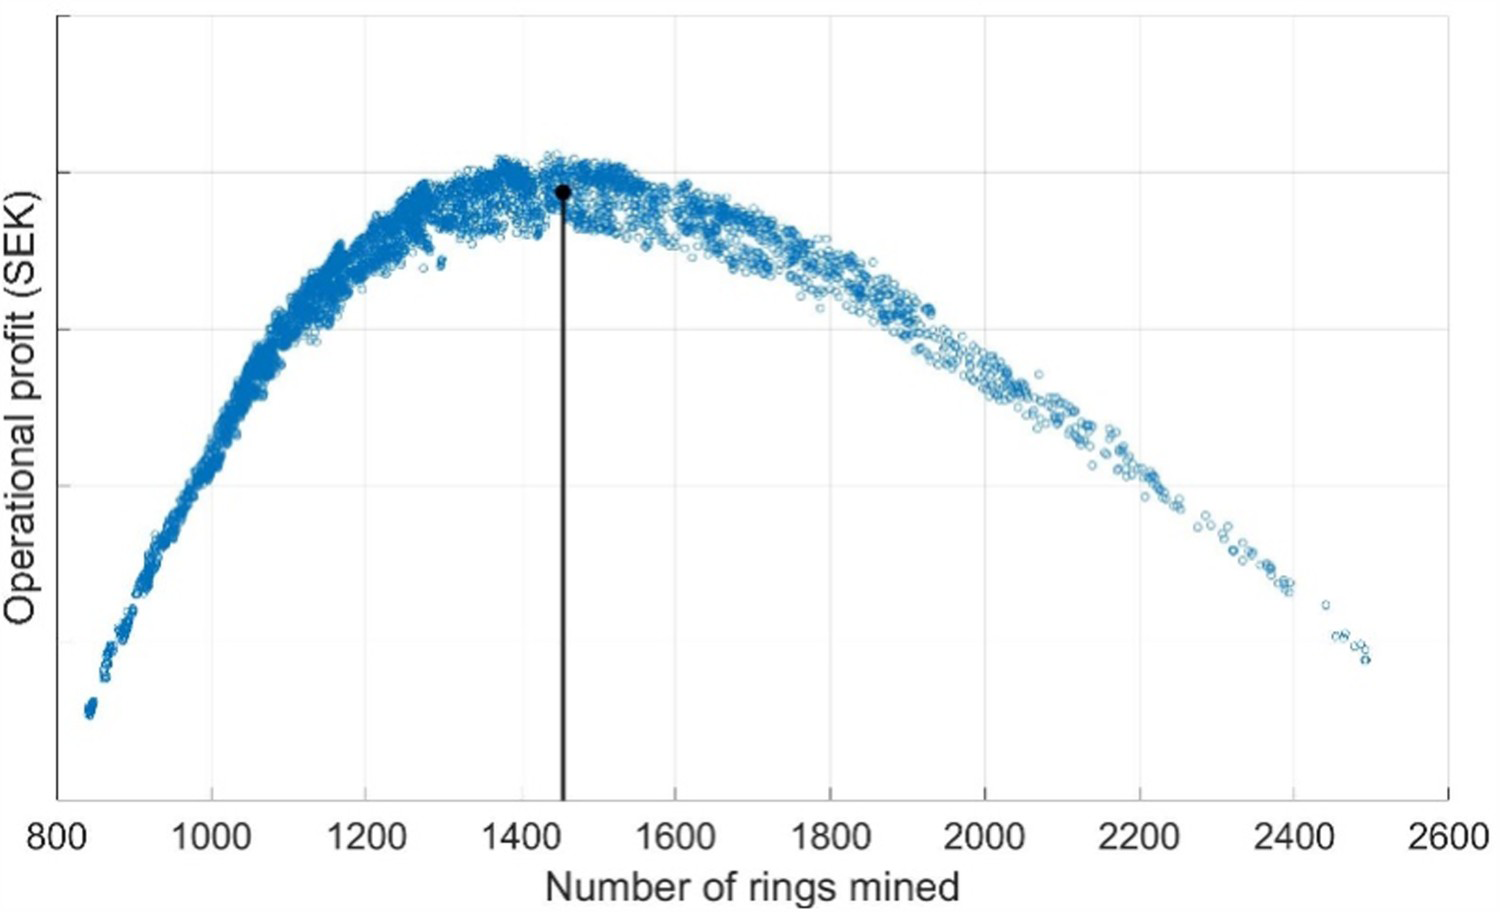
A set of loading criteria that maximise operational profit, can be identified from the 6561 scenarios. As the curve plateaus between 1300 and 1500 rings, it would be possible to reduce the number of rings down to 1300 without affecting the operational profit of the mine. Therefore it is also possible to find a loading criteria that reduce the sinking rate of the mine without affecting the operational profit.
The two main issues with today's criteria-based approach are the cost-revenue sensitivity and the complicated Graphical User Interface (GUI). The criteria-based system is relatively insensitive to the cost and revenue aspects of the mine operation. The shut-off grade uses the concept of marginal cost (LKAB 2002). Hence, loading is stopped at the draw point when ore can be mined more cheaply by blasting a new production ring instead of continuing to load the existing draw point (LKAB 2002). The evaluation does not take into account the revenue from iron ore products; instead, it compares two cost components. This evaluation is also insensitive to fixed cost components for the mine. Sensitivity analysis presented in the annual report showed that the mine has a high risk of exposure to the iron ore price (LKAB 2018). Hence, the effect of variation in revenue due to changing iron ore prices was analysed by varying the iron ore product (iron ore pellets) revenue (see Figures 3 and 4).
Scatter plot for increased iron ore product revenue (Images are available in colour online). Scatter plot for reduced iron ore product revenue (Images are available in colour online).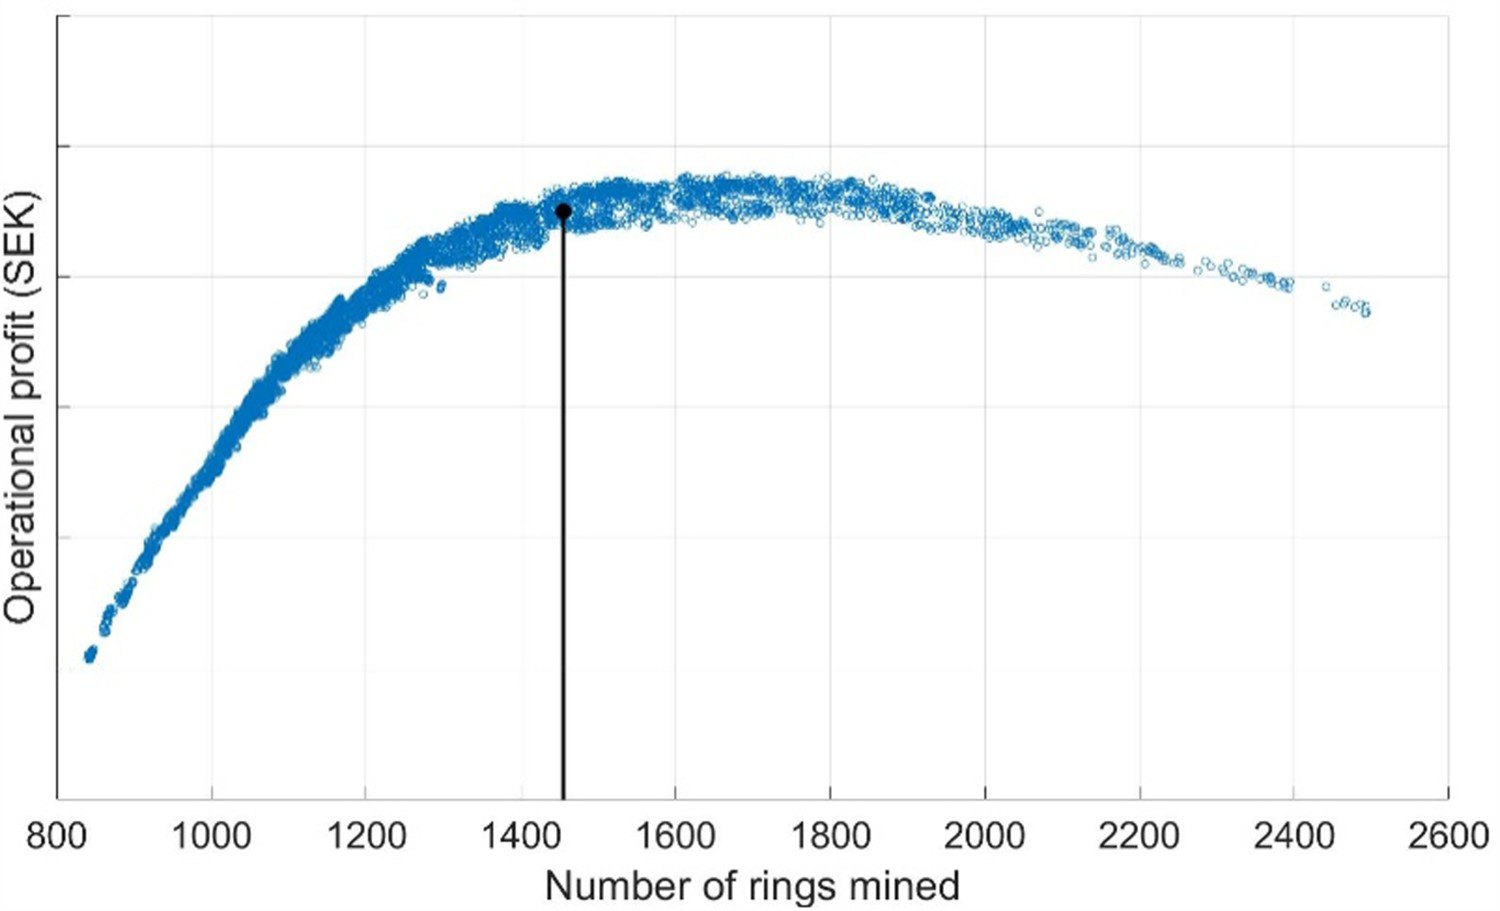
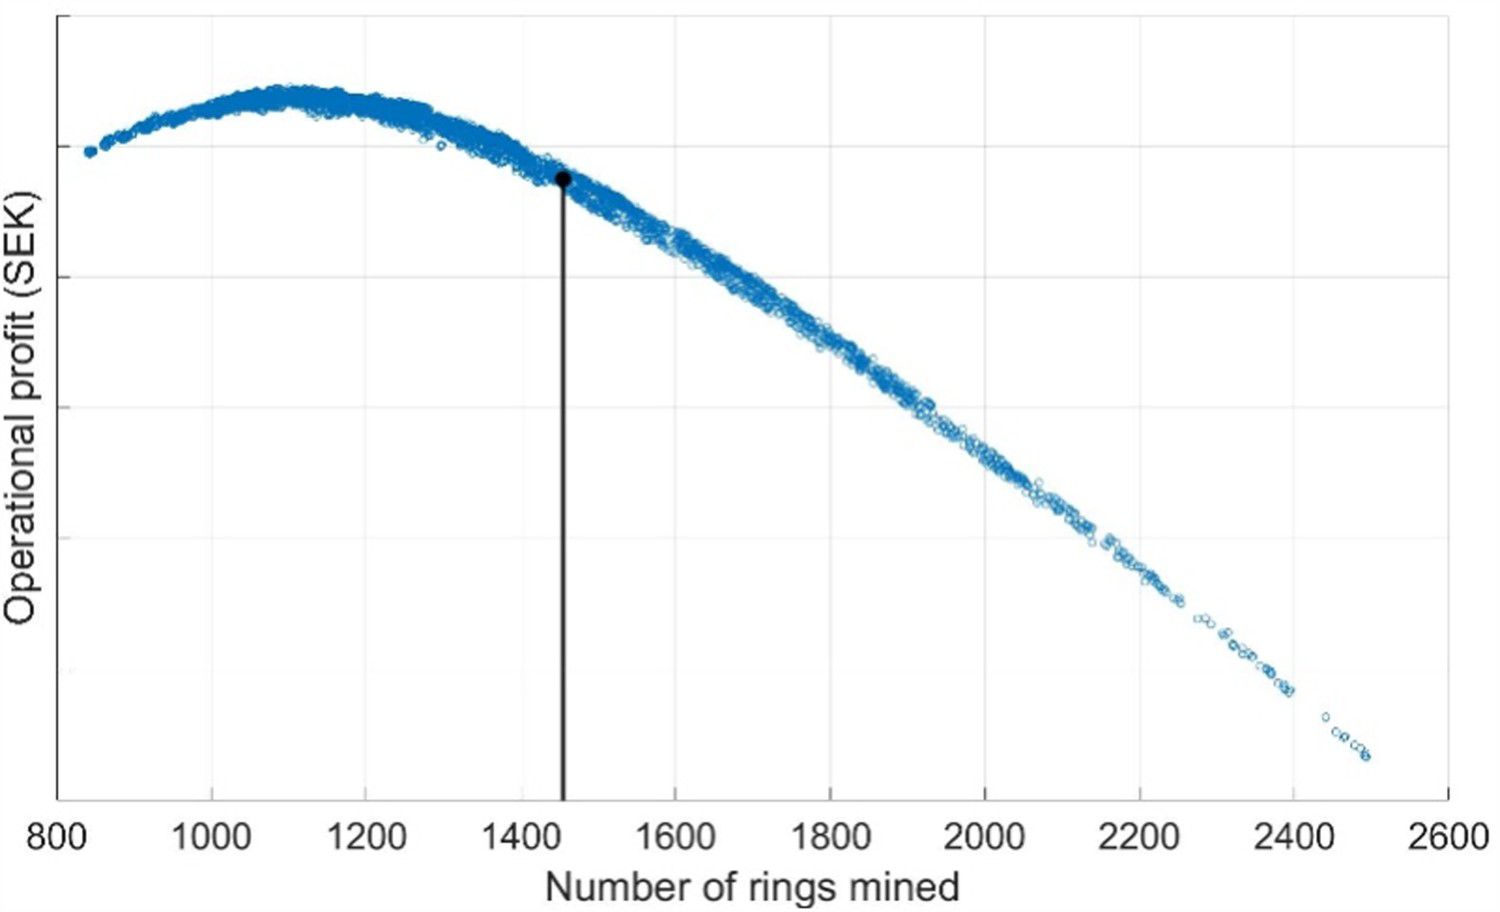
Figure 3 shows the operational profit scatter plot for the 6561 scenarios for an increased iron ore product revenue of 20%.
Simulation scenarios with an increased number of rings mined have less total dilution and higher Fe content, whilst development cost per ring remains constant. Hence, an increased iron ore product revenue (by 20%) leads to a flattening of the curve at the end.
An increase in the number of rings after the inflection point does not lead to a significant decrease in operational profit. However, a decrease in the number of rings will reduce the sinking rate of the mine, an objective of draw control. The black mark shows the current loading criteria, which are almost optimal for the high revenue scenario, minimising the number of rings mined.
Figure 4 shows the operational profit scatter plot for the 6561 scenarios for a decreased iron ore product revenue of 20% from the current revenue. In the figure, the scatter plot shifts towards the left and has a longer tail than in Figure 3. A constant development cost with decreasing revenue per ring leads to a leftward movement of the inflection point towards fewer rings mined. The black mark representing the current loading criteria is suboptimal, and draw points need to be loaded longer (reducing the number of rings mined) to attain the peak operational profit. For a reduced iron ore product revenue, the current criteria are not optimal and will lead to decreased operational profit.
Need for a new approach to draw control
The current loading criteria is suboptimal and unsuitable for draw control for the following two reasons:
Insensitivity to mine economics: A relative comparison of all three scenarios from Figures 1–3 shows the effect of revenue on the operational profitability and highlights the importance of metal prices when optimising draw control in a SLC mine operation. The current loading criteria require the mine to excavate the same number of rings for the three compared iron ore product revenues. The current approach is only sensitive to the operational cost components and assumes other cost and revenue components to be uniform. The analysis clearly shows that the criteria-based approach for draw control is insensitive to metal price variation, and this will impact the overall economy of the mine. Complicated GUI: The current criteria-based approach is controlled through WOLIS which plots a moving average curve of bucket weight or bucket grade (Shekhar et al. 2018). The curves can be seen inside the LHD machine and in the mine information system. High fluctuations in the curve make it difficult for the operator and the mine to judge the performance of a draw point. The information on the average grade (e.g. last 25% extraction ratio) and trend (e.g. last 40% extraction ratio) for the recently loaded material does not include information on the overall performance of a draw point. Hence, the criteria-based approach provides a complicated platform open to subjective interpretations (Gustafson et al. 2020). This also leads to non-compliance with loading criteria and draw points not being closed according to the established criteria. In short, there is a need for an improved GUI for loading at draw points for the Malmberget mine.
Hence, a new approach for draw control is needed which is sensitive to mine economic parameters such as metal prices, cost of operation, fixed costs and target profit. The approach should also provide a simpler and easier to understand GUI to achieve higher compliance during production.
Decision box approach to draw control
A new approach to draw control based on the economic model was proposed for the regulation of loading at the draw point (Shekhar, Gustafson, et al. 2019). Figure 5 shows the economic model applied to a historical dataset. The x-axis shows the extraction ratio, and the y-axis shows the operational profit for a production ring. The example, taken from Malmberget's production data, has been chosen to illustrate the behaviour of the decision box approach if it were used at the mine. As noted previously, the mine currently uses the WOLIS system, which displays the moving average of the bucket grade.
An example of a production ring from the Malmberget mine (Images are available in colour online).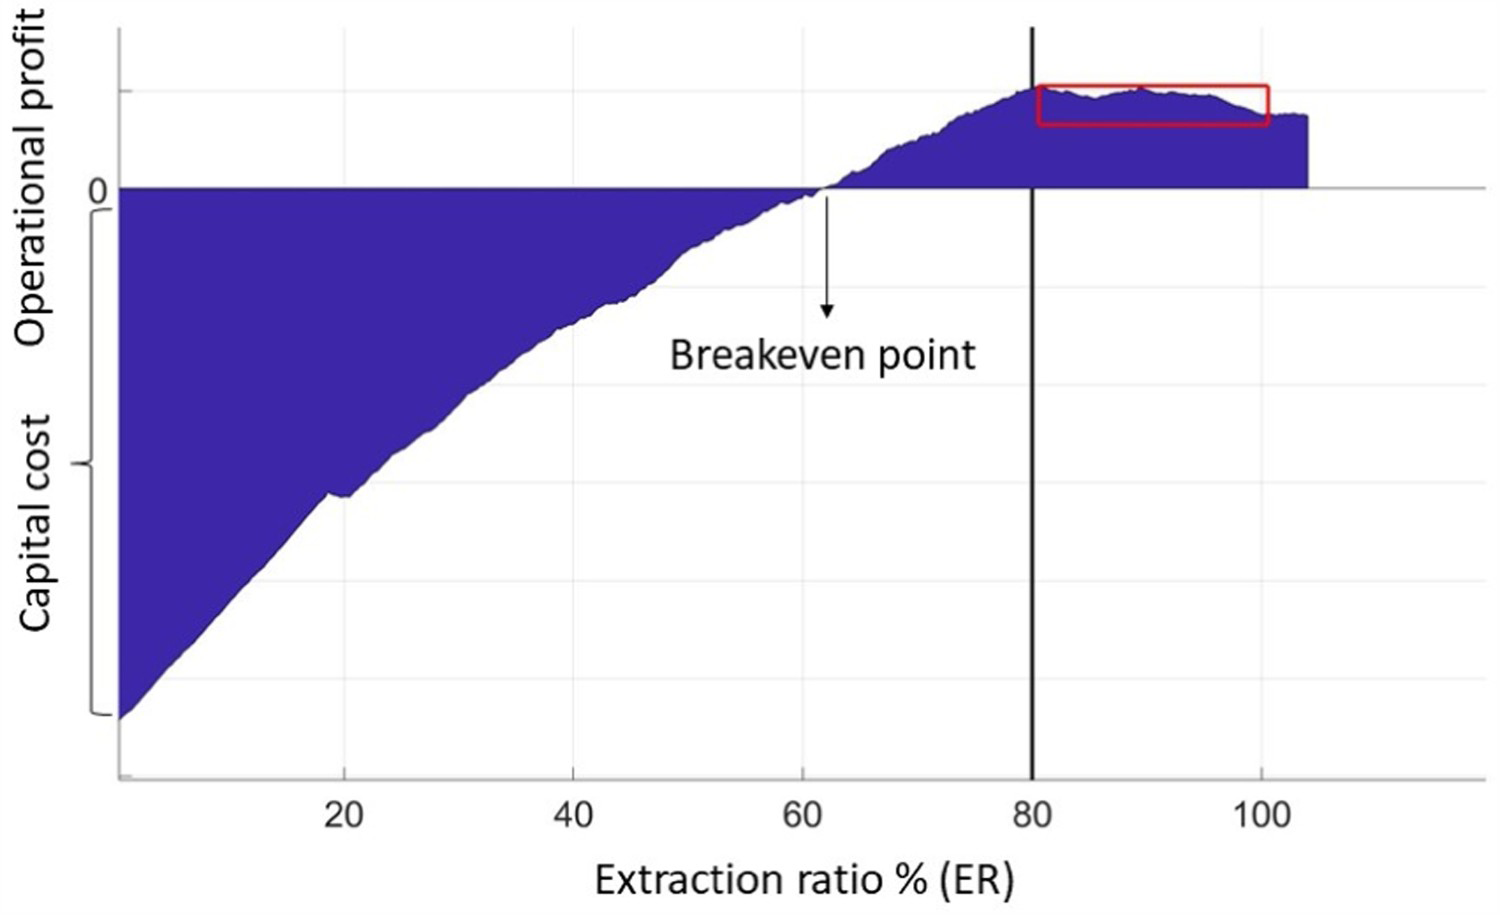
The economic investment in development, drilling, charging and blasting is added together to calculate the capital cost of the production ring, shown to the left in the figure. As buckets are loaded from the draw point, the ring starts making an incremental profit and passes the breakeven point at around 60% extraction ratio, when the cumulative revenue balances the invested capital cost. The vertical black line shows the first criterion, the minimum extraction ratio, until which point, loading should always be continued. When loading continues after the first criterion, the decision box becomes active (shown as a red box in Figure 5).
Decision box
The decision to continue loading or stop and blast the following ring is very complicated in SLC because of the pulsating nature of ore and waste inflow at the draw point. The waste inflow can be followed by a large ore inflow in a very unpredictable way. Sometimes the loading of waste may be required to attain more ore volume in the ring. To facilitate a more efficient and flexible ring excavation, a decision box is superimposed on the operational profit curve (Figure 5). The top left corner of the box is fixed at the point of maximum profit.
The decision box provides a window of calculated risk that helps the mine to explore if more ore can be loaded from the draw point. The height of the box helps to control dilution from the draw point and is as the economic risk that can be taken to reach additional volumes of ore. The length of the box helps maintain the overall economic viability of the mine. If many draw points are operated with a flat or decreasing operational profit curve, this will eventually reduce the total profit and cause losses in the long term.
The decision box approach recommends loading to be continued as long as the operational profit curve is inside the decision box, and loading should be stopped when the curve goes outside the box. The decision box replaces the second and third criteria for the system currently used in the mine.
In the example shown in Figure 5, the profit curve starts to plateau and fluctuate after 80% extraction ratio. The profit curve goes outside the decision box at 100% extraction ratio, and loading is stopped at approximately 105% extraction ratio. As stated above, the example was chosen to show the behaviour of the decision box approach if it were used at the Malmberget mine, but the ring was not loaded using the decision box approach.
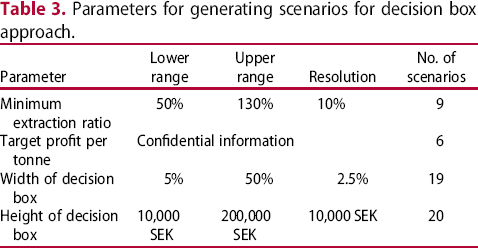
Parameters for generating scenarios for decision box approach.
Analysis of the decision box approach
Finding the optimal scenario for maximising the operational profit and minimising the number of rings mined requires selecting scenarios that are at, or close to, the peak of the plot in Figures 2–4. However, if the aim is to maximise mine life whilst achieving a defined target profit, then a scenario before the peak should be selected. This involves a critical balance between dilution and ore recovery for caving operations, as an increase in recovery also increases dilution.
Figure 6 shows the results for the 20,520 scenarios generated by varying the four parameters for the proposed decision box method. As in the previous analysis, the x-axis shows the number of rings mined, whilst the y-axis shows the estimated annual operational profit. The black marks represent the different scenarios and the blue marker shows the recommended strategy for the selected optimal parameter values.
Scatter plot for the decision box approach. Blue marks the recommended strategy (Images are available in colour online).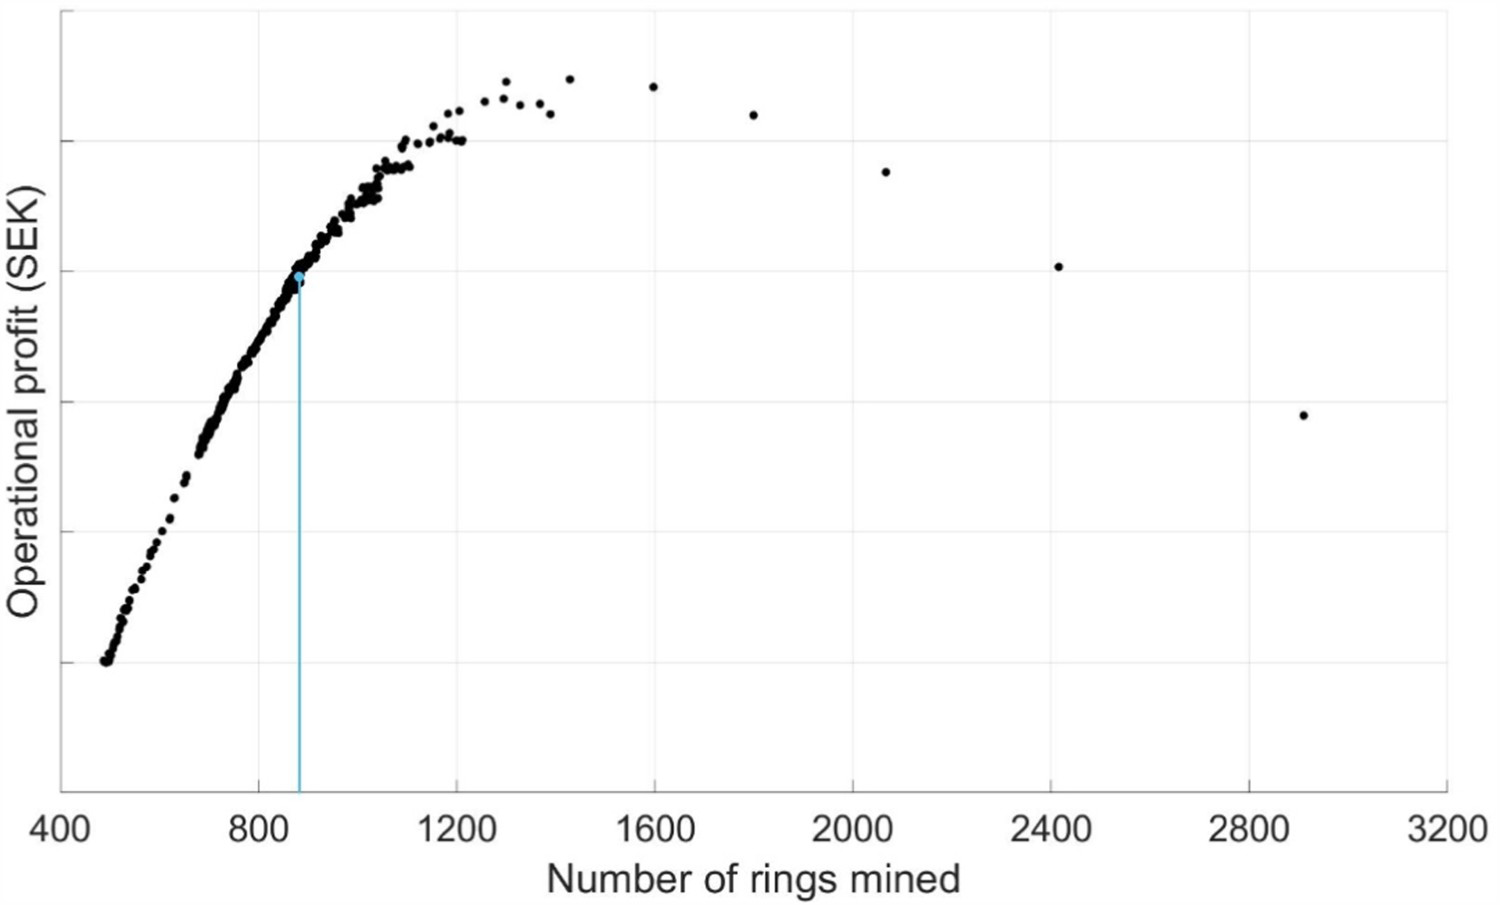
The trends for the scatter plot are similar to those in Figure 2, with a peak and then a flatter descending trend at the end. The smaller the decision box gets, the more rings are mined, as the profit curve easily goes outside a smaller decision box. The number of rings mined is positively correlated with the target profit per tonne. However, the operational profit has a more complex relationship with the target profit per tonne. The assigned minimum extraction ratio does not affect the number of rings mined and the operational profit for lower values of the target profit per tonne, but for higher values of target profit per tonne, the minimum extraction ratio becomes the dominant factor, as shown by the last six scatter plot marks after the peak in Figure 6. These points are directly correlated with the minimum extraction ratio. The optimal size of the decision box is decided by balancing the operational profit against the number of rings mined. The box size that achieves the operational profit target with a minimum number of rings mined should be selected.
Identifying optimal parameter values
For the decision box approach, the parameter values for the model must be defined. In this case, heuristics are used to select the parameter values since many scenarios can achieve a similar annual operational profit, partly because the simulation assumes an ideal mine operation and does not take into account draw points which have to be closed because of safety issues or other loading issues (hang-ups, ring freeze, poor fragmentation, brow failure). The parameter values selected are:
Minimum extraction ratio
Minimum extraction ratio from 50 to 130% was tested and analysed. If a low minimum extraction ratio is used, individual draw points may be closed earlier, leading to an increasing number of mined rings and an increasing sinking rate. The minimum extraction ratio becomes a dominant parameter for high values of target profit per tonne. Hence, a minimum extraction ratio criterion is important to encourage continuous caving and to reduce the sinking rate. Marker trials have shown that certain draw points can initially have high dilution due to shallow draw (Nordqvist and Wimmer 2016). A minimum extraction ratio criterion can address this material flow issue whilst keeping a check on dilution. A minimum extraction ratio of 60% is recommended as a conservative estimate even though it is lower than the current minimum ratio of 80%.
Width of the decision box
In order to understand the effect of the width of the box, scenarios with lower values of target profit per tonne were analysed. At higher values of target profit per tonne, the minimum extraction ratio becomes the dominant parameter and is therefore not useful to select the width of the box. Figure 7 shows the scatter plot for the width of the decision box versus the number of rings mined.
Effect of the width of the decision box.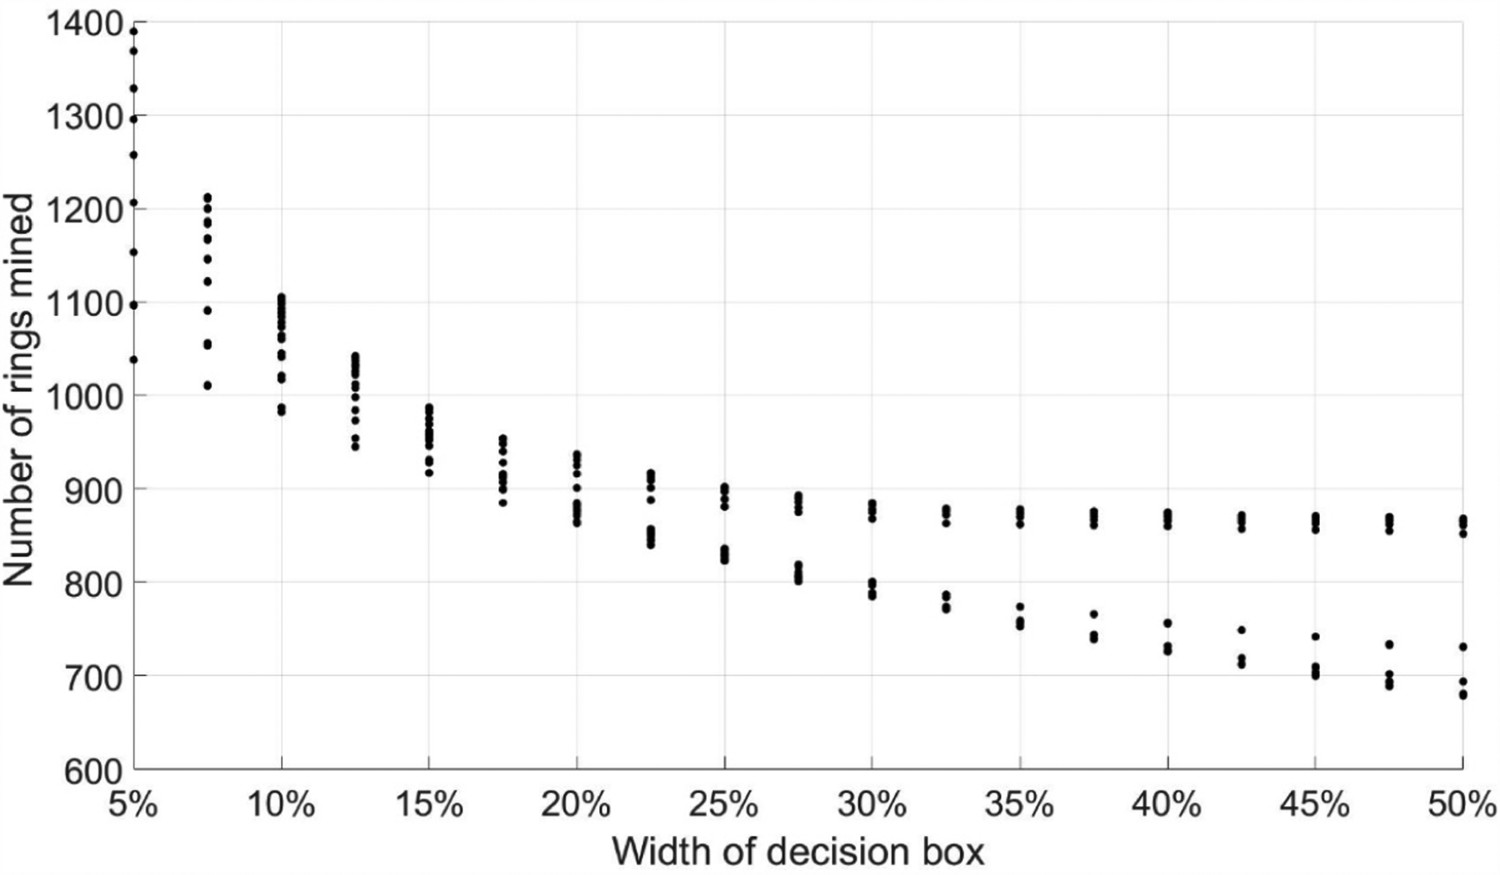
As the width of the box increases, the number of rings mined decreases. The gradient of the scatter decreases after 20% for all scenarios. Therefore, a conservative estimate of the width of the decision box is 20%.
Height of the decision box
The height of the box was varied from 10,000 to 200,000 SEK. In Figure 7, the scenarios after 20% width of the decision box are clearly divided into two groups; those in the upper group are unaffected by the width of the decision box, but those in the lower one have a negative trend. The upper group consists only of smaller values for the height of the box (10,000–30,000) whilst larger values are all located in the lower group. This means that for smaller values for the height of the box, the height of the box dominates over the width of the box, but for larger values for the height of the box, the width of the box dominates. During loading, it is ideal to have a width as the dominant parameter, as it promotes a decrease in the number of rings mined and an increase in ore recovery. If the height of the box is a dominant parameter, smaller periodic waste inflow will trigger the closing of draw points as the height of the box will necessarily be smaller. However, draw points should be closed if the waste flow is sustained; this can be achieved by having a higher value of the height of the box. As the height was found in the simulations to be dominant up to 30 000 SEK, a height of 50 000 SEK was selected as a conservative estimate for the decision box.
Target profit per tonne
The target profit per tonne is a dominant parameter that affects the other parameters, as well as the output. As the target profit per tonne increases, the operational profit first increases and then decreases because, for lower values of target profit per tonne, the decision box drives the loading at the draw point, whilst for higher values, the minimum extraction ratio becomes the dominant parameter. High demand on the target profit per tonne may, therefore, lead to early closing of draw points and over-mining, which, in turn, causes ore loss and reduction in operational profit. In this case, lower values of target profit per tonne, which still can meet the required annual operational profit are selected.
The blue marked point in Figure 6 is the scenario corresponding to the above parameters and has been recommended for testing at the Malmberget mine. The scenario is not near the peak of the operating profit versus the number of rings mined curve and lies to the left of the peak. This is a strategic mine planning decision taken with the aim of reducing the sinking rate of the mine, whilst keeping the same annual operational profit. The simulation result for the current loading criteria estimates higher operational profit than the mine achieves in reality. With the current GUI, the compliance with loading criteria is low; the mine aims to change this by using the new GUI based on the decision box approach. The simulation shows results based on ideal mine operating conditions and discounts stoppages in the loading process. Based on the simulation results, the mine can achieve higher operational profit using the current loading criteria, but will increase the sinking rate for the mine, and this is not a desirable result.
Conclusion
Two earlier developed mathematical models (probability model and economic model) were used together to evaluate the present draw control strategies at the Malmberget mine, and a new strategy was tested using a decision box approach. Based on the results, the following conclusions can be drawn:
The decision box approach is better for controlling the loading at the draw point, as it is sensitive to mine economics. The proposed approach has been recommended for the mine to test, and the recommended initial parameter values for the box have been selected using heuristics. The current approach for profit maximisation or NPV maximisation may lead to a reduction in the mine life. Mine planners are faced with the difficult task of balancing mine life with profitability, and an increase in mine life for a constant mineral reserve may lead to a reduction in profitability. Planners may improve the sustainability of the mine by increasing ore recovery, but encounter increased dilution. However, not taking this approach causes ore loss and poor sustainability. The developed model provides a roadmap to estimate the profitability and sinking rate for different draw control strategies. The final decision on parameter values for draw control remains a strategic and management decision.
Footnotes
Acknowledgements
The authors acknowledge LKAB for its financial and infrastructural support. The authors are also grateful for valuable input and support from the staff and management of the Malmberget mine. Agio System och Kompetens AB, Boliden Mineral AB, ABB AB and RTC are acknowledged for their valuable input to the project. Finally, Vinnova, the Swedish Energy Agency and Formas are acknowledged for financing this project through the SIP-STRIM programme.
Disclosure statement
No potential conflict of interest was reported by the author(s).