
Abstract
This paper presents an economic model for optimizing loading at the draw point in sublevel caving (SLC) operations. The input data consist of estimated bucket grades based on bucket weights from Load Haul Dump machines. This information, together with average operational mining costs, was used to create an economic model providing a real-time economic assessment of the draw point performance for SLC rings. The results demonstrate the importance of continuous draw point monitoring to optimize SLC operations. The proposed model provides an economic assessment of operating draw points and will help mine personnel to decide when to stop loading from a blasted ring. It can also help mine management understand the complexity of material flow in SLC operations. Finally, it provides operational flexibility for the mine to optimize loading at the draw point by increasing ore recovery while maintaining operational control of draw point performance.
Introduction
Sublevel caving (SLC) is a mass mining method in which the ore is drilled and blasted while the waste rock caves and fills the space created by the extraction of ore (Cokayne 1982). The ore body is divided into vertical intervals called sublevel intervals. The ore within each sublevel interval is drilled in a fan-shaped design at a constant horizontal distance along the production drift, called burden. The ore is blasted, slice by slice from the hanging wall side to the footwall side in a retreating manner (Cokayne 1982). Each drilled and blasted slice is called a ring. As the ring is blasted, it fragments and loses its integrity; part of it flows into the vacant space below in the production drift (Janelid and Kvapil 1966). This restricted opening in the production drift where the material is loaded by Load Haul Dump (LHD) machines is called a draw point (Figure 1). As more material is drawn from the muck pile, the void created at the draw point is filled by more material flowing from above the drift (Kvapil 1965). This flow of material creates a void around the blasted ring. The hanging wall, previously supported by the ore, is now exposed to this void. The phenomenon of the induced disintegration of rock from loss of support is called the caving of rock (Laubscher 1994). The hanging wall starts to cave into the void and eventually fills it.
Typical SLC layout.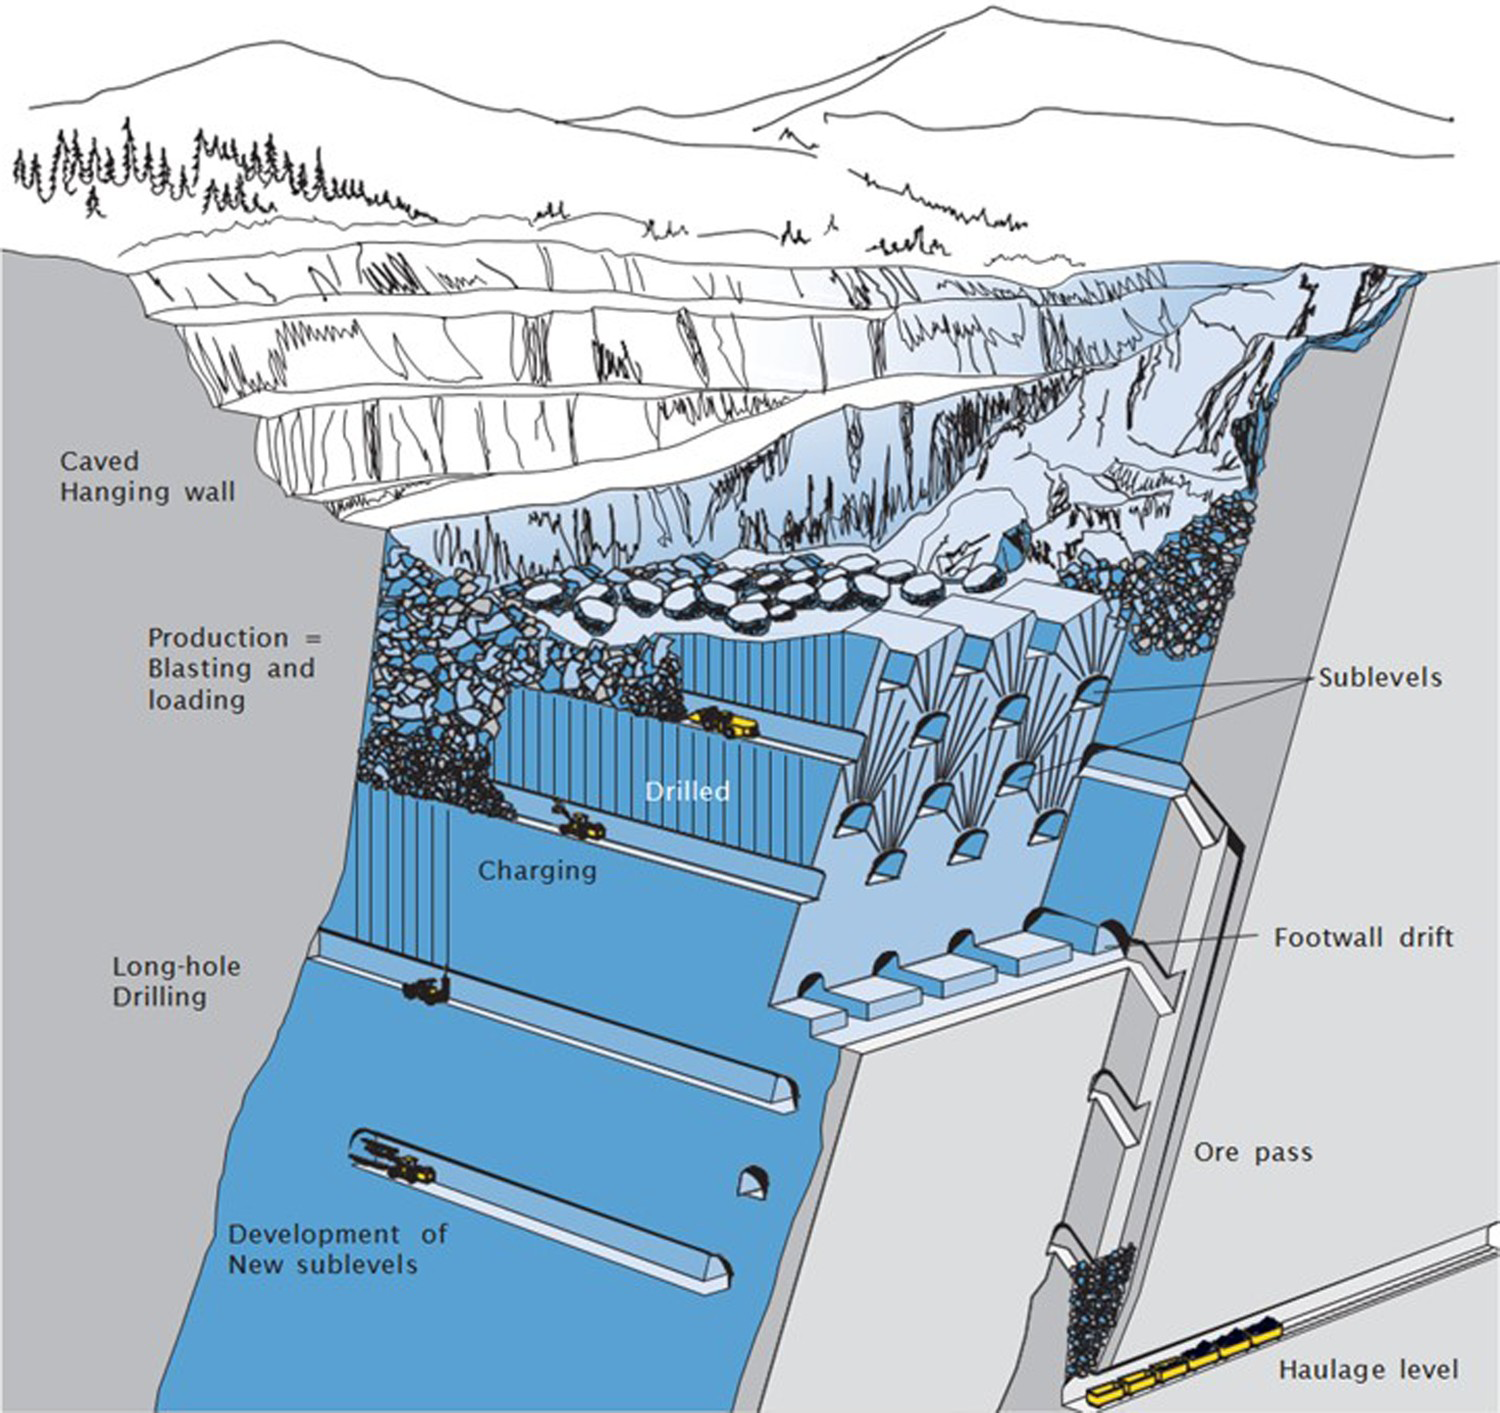
As a result of the mixing of ore and waste, the amount of material actually extracted from a draw point is often more than the volume of the ore initially blasted in the ring. The loading of the material from the muck pile ends when dilution becomes too high, and more extraction of material from the draw point becomes uneconomical (Nilsson 1982). In sublevel caving (SLC) operations, loading ore at the draw point is complex for two main reasons:
Ore and caved material are continually mixing; Material flows through a restricted opening.
These two phenomena are inherent in caving operations, and over the years much research has sought to explain the mechanism of material flow. Initial gravity flow principles based on physical models and experiments (Kvapil 1965; Janelid and Kvapil 1966; Kvapil 1982) described material movement for an isolated draw from a single draw point as an ellipsoid of motion. However, results from more recent research using marker trials highlight the difficulties of understanding and simulating granular flow (Power 2004; Brunton 2009; Wimmer et al. 2015, Nordqvist and Wimmer 2016). They note that the chaotic nature of material flow and its associated unpredictability make material flow simulations unrealistic. The results suggest that the uniform systematic flow pattern observed in early physical models was an exception and, in general, material flow in SLC is chaotic and non-uniform (Power 2004; Brunton 2009; Wimmer et al. 2015; Nordqvist and Wimmer 2016).
In caving operations, draw control regulates the loading process by providing information on when to terminate loading from a draw point. In SLC mines, the decision to stop loading from a blasted ring and proceed to the next one is crucial. On one hand, ore left in the ring cannot be conclusively recovered once the draw point is abandoned. On the other hand, overloading material from a blasted ring means increased dilution and mining costs. Bull and Page (2000) say an effective draw control strategy maximizes ore recovery whilst minimizing dilution and delays dilution entry in the draw point by deploying corrective methods. However, the dual (and contradictory) objectives of a draw control strategy, i.e. reducing dilution whilst improving ore recovery, are difficult to understand and complicated to apply. An ideal draw control strategy must achieve mine production and grade targets and also address the issues of chaotic and non-uniform material flow.
Draw point monitoring systems
A draw point monitoring system is required to detect variations in ore grade and relay the information to mine personnel who can take the necessary action to optimize loading. The monitoring systems can provide ore grade measurements either continuously (Quinteiro et al. 2001) or periodically (e.g. every 100 tonnes or based on work shifts) (Cokayne 1982; McMurray 1982) and can be divided into three types:
Visual estimation technique
This technique is based on the visual differentiation of ore and waste (Cokayne 1982). The percentage of ore and waste present in the muck pile is visually estimated based on the colour, shape, or texture of the material (Booth et al. 2004).
Sampling and assay system
This technique is used when no visual differences can be spotted between ore and waste (Cokayne 1982). Several samples are taken at the draw point and then prepared and analysed underground (Cokayne 1982). Loading from the muck pile should be stopped during the sampling period to get a representative sample. Cokayne (1982) concludes that the method is more accurate than visual estimation. It is, however, very expensive, and more time consuming than visual estimation.
Density-based monitoring system
This draw point monitoring method is used when there is a significant difference in the density of ore and waste (Davison 1996). The weight of the material loaded in the bucket is measured and is used to estimate the ore percentage in the bucket using empirical formulas (Shekhar et al. 2017). The system is calibrated for various bucket volumes and loaded materials (Davison 1996). This monitoring system provides a continuous measurement of ore grade at the draw point.
Currently a majority of caving operations, which mine gold or base metals use mill grade as their main input for their draw control strategy. These mines cannot monitor draw point performance in the mine due to e.g. lack of infrastructure, nature of deposit or unavailability of relevant technology. Hence they are unable to adequately register the variation in ore grade at the draw point. Mines with a draw point monitoring system can observe variations in ore grade at the draw point (Cokayne 1982; Gustafsson 1998; Quinteiro et al. 2001; Booth et al. 2004) but it is difficult to assess the overall performance of a draw point by just observing the raw data from the monitoring system.
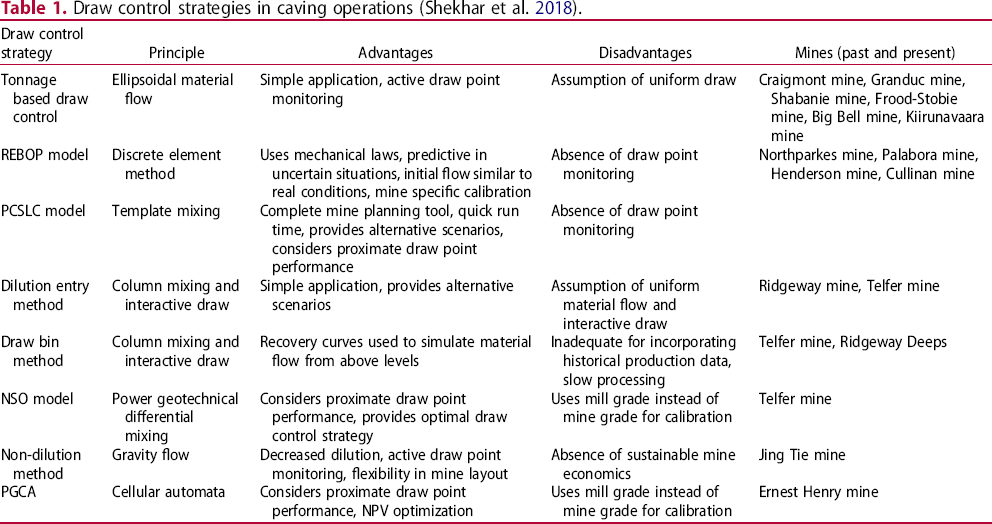
Qualitative review of past draw control strategies
Draw control strategies in caving operations (Shekhar et al. 2018).
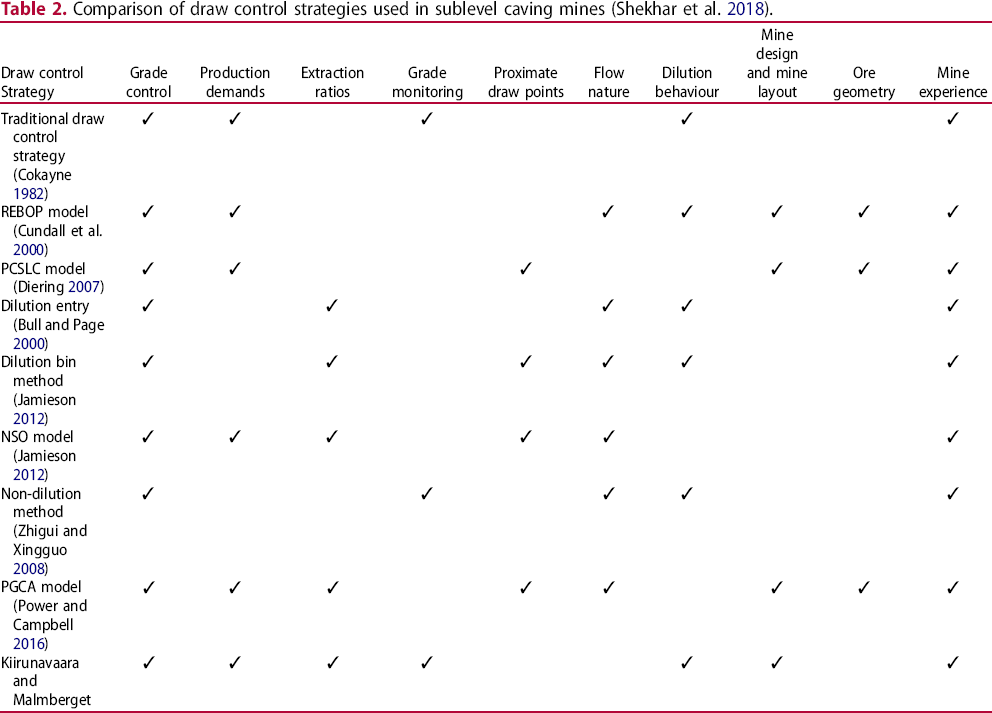
Comparison of draw control strategies used in sublevel caving mines (Shekhar et al. 2018).
Qualitative assessment of draw control strategies used in SLC mines (Shekhar et al. 2018).
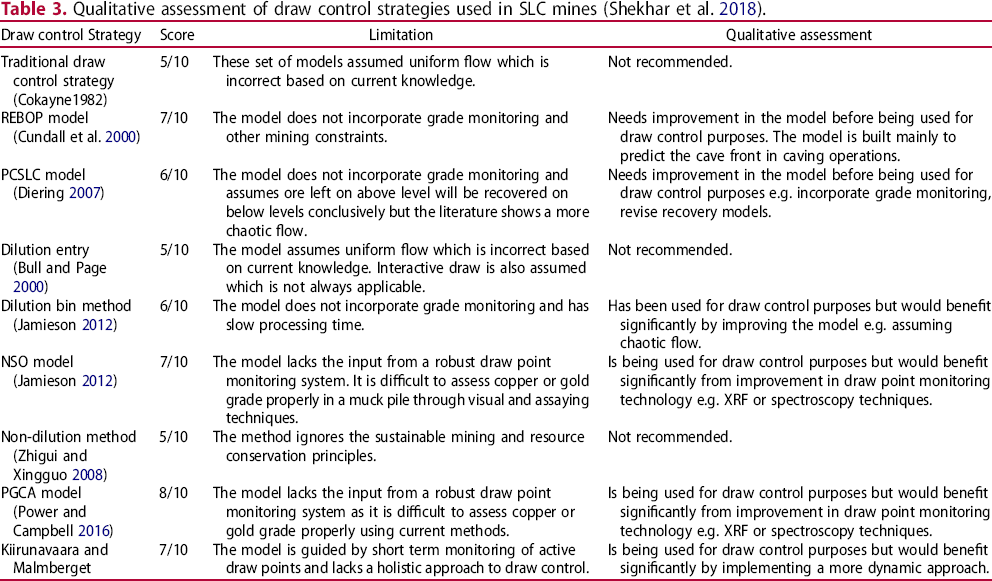
Traditional draw control strategy, Dilution entry method and Non-Dilution methods are not recommended for draw control based on the assessment (Shekhar et al. 2018). Other draw control strategies would benefit significantly from model improvement or improvement in draw point monitoring technologies (Shekhar et al. 2018). Two key aspects need to be improved in the present draw control strategies:
Ability to capture chaotic and non-uniform behaviour: Marker trials highlight the chaotic and non-uniform nature of material flow in SLC (Power 2004; Brunton 2009; Wimmer et al. 2015; Nordqvist and Wimmer 2016). For an operating SLC mine, material flow is further affected by such factors as ore geology and geometry, rock mass properties, loading issues (hang-ups, brow failure, waste intrusions, poor fragmentation or ring freezing), mine design (including ring design), hole deviation, blasting performance, backbreak and operators influence (Laubscher 1994; Bull and Page 2000; Laubscher 2000; Hustrulid and Kvapil 2008). Ore flow simulation models using Void Diffusion approach, cellular automata or numerical models (Particle flow codes) are unable to simulate random behaviour. However, these models are useful for predicting cave fronts and optimizing mine design. Hence, better stochastic models are required to address the variation and uncertainty associated with loading at the draw point in SLC. Effective draw point monitoring systems: The chaotic and non-uniform nature of material flow in SLC leads to variation in ore grade at the draw point. Hence, a constant monitoring of material grade at the draw point is required to control dilution while also recovering more ore. A key issue is the systematic variation in draw point performance parameters, such as average ore grade and final extraction ratio (Shekhar et al. 2016b). Average ore grade refers to the overall average quality of the material drawn from a blasted ring, and final extraction ratio is the ratio of actual tonnage extracted from a blasted ring to the planned tonnage. One of the major difficulties of SLC loading is that the performance of a single draw can vary significantly, ranging from extremely good (high average ore grade and high final extraction ratio) to very poor (low average ore grade and low final extraction ratio) (Shekhar et al. 2016b). However, these variations cannot be observed in mines which uses only average mill grades for calibrating ore flow simulation models. Marker trials results have shown that different rings behave differently (shallow draw, standard draw and shallow draw developing into standard draw (Nordqvist and Wimmer 2016)). Calibrating models using them requires the knowledge of the draw pattern which is currently available for only test rings and not for all operating rings.
This paper proposes a new economic model for assessing the overall draw point performance of a blasted ring using data from a continuous draw point monitoring system. The model provides a real-time economic assessment of the performance of a draw point. The paper then demonstrates the advantages of the model by applying it to an on-going caving operation.
Methodology
To create the economic model, three types of production data was collected at the test mines:
The average costs for different mine unit operations at the test site mines were used to create the economic model. Note that these costs are regularly updated by the mines. The operations included are development, drilling, charging, blasting, loading, transport, crushing, hoisting, sorting, beneficiation, pelletization, waste handling, shipping and other overhead costs. In addition, a series of meetings and interviews were held to determine the challenges of draw control and loading at the draw point. Meetings were also conducted with the budget and accounting departments of the mines to clarify the cost structuring.
Case study mines
The suggested model was developed for the Luossavaara-Kiirunavaara AB's (LKAB) two SLC mines in northern Sweden using their existing draw control technologies and procedures.
The Malmberget mine is the second largest underground iron ore operation in the world. It consists of about 20 orebodies (Figure 2), of which 13 are currently being mined with varying degrees of tonnage (Shekhar et al. 2017). The mining area stretches 5 km in the E-W direction and 2.5 km in the N-S direction (Lund 2013). The ore is composed of magnetite (95%) and haematite (5%), and the average grade for the different ore bodies varies from 49% to 63% Fe (Lund 2013). The width of the ore bodies varies from 20 to 100 m, and the tonnage varies from 5 Mtonnes to 250 Mtonnes (Shekhar et al. 2017). The mine is divided into two parts: the western and eastern fields. The ore bodies in the eastern fields are composed of massive magnetite ores with a current known depth of 1600 m and provide 80% of the total production (Lund 2013). The western fields consist of small magnetite-haematite deposits with a current known depth of 950 m (Lund 2013).
3D view of the Malmberget deposit.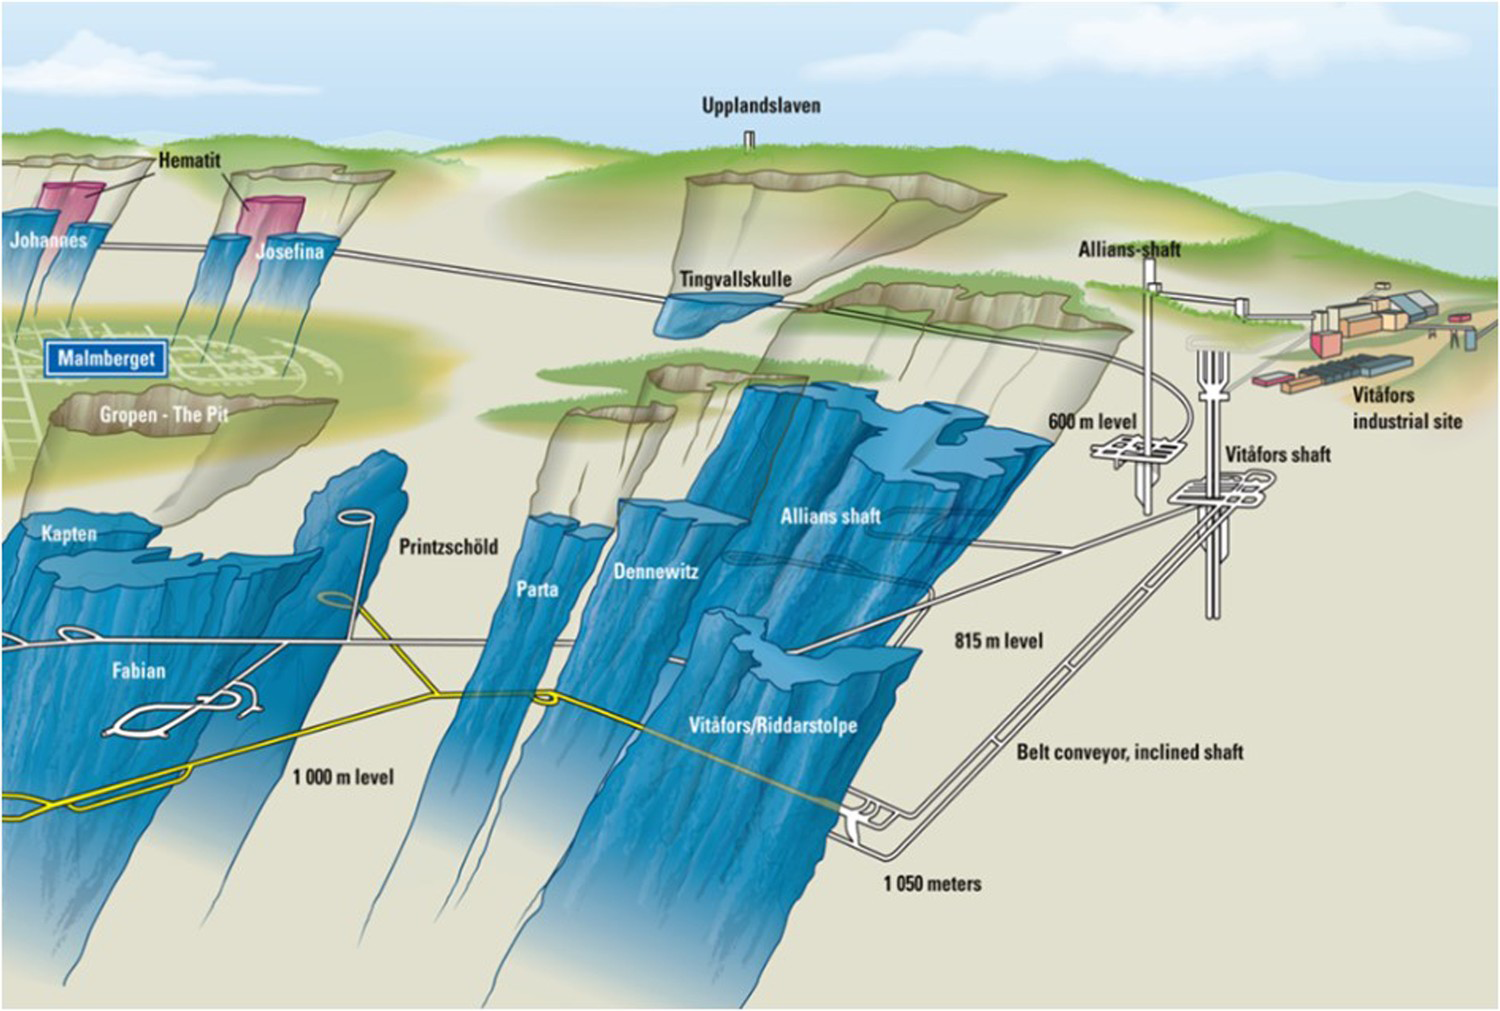
The Kiirunavaara mine is the largest underground iron ore operation in the world. The Kiirunavaara ore body consists of magnetite ore with magmatic intrusions. The ore body is about 4 km long, with an average width of around 80 m. The strike is in the N 10° E direction, with a dip of about 60° SE towards Kiruna city (Nordqvist and Wimmer 2016). The average iron content for the ore body is 64% (Nordqvist and Wimmer 2016), but the grade varies, and the iron content can reach up to 69% (Shekhar et al. 2017).
The two mines use Load Haul Dump (LHD) machines to load material from the draw points. These LHD machines employ a Loadrite system to measure the bucket weight of the loaded material (Davison 1996). A pressure transducer measures the hydraulic pressure in the lift cylinders of the LHD's arms connecting the bucket to the machine. It then converts the hydraulic pressure into a weight (Davison 1996).
The Wireless Loader Information System (WOLIS) (Adlerborn and Selberg 2008) estimates the amount of ore and waste present in a loaded bucket, by using the density difference between ore (4.6–4.8 tonnes/m3) and waste (2.7–2.8 tonnes/m3)(Klemo 2005). More specifically, it uses the bucket weight from Loadrite, together with an assumed theoretical volume of the bucket, to calculate the grade of the material in each bucket. The iron percentage for a pure magnetite ore is 72.36% and for pure haematite ore is 69.90%. But the assumed iron ore percentage in WOLIS for a bucket completely filled with ore is 71% (Shekhar et al. 2017). The formula used in WOLIS for iron percentage is described in Equation (1).
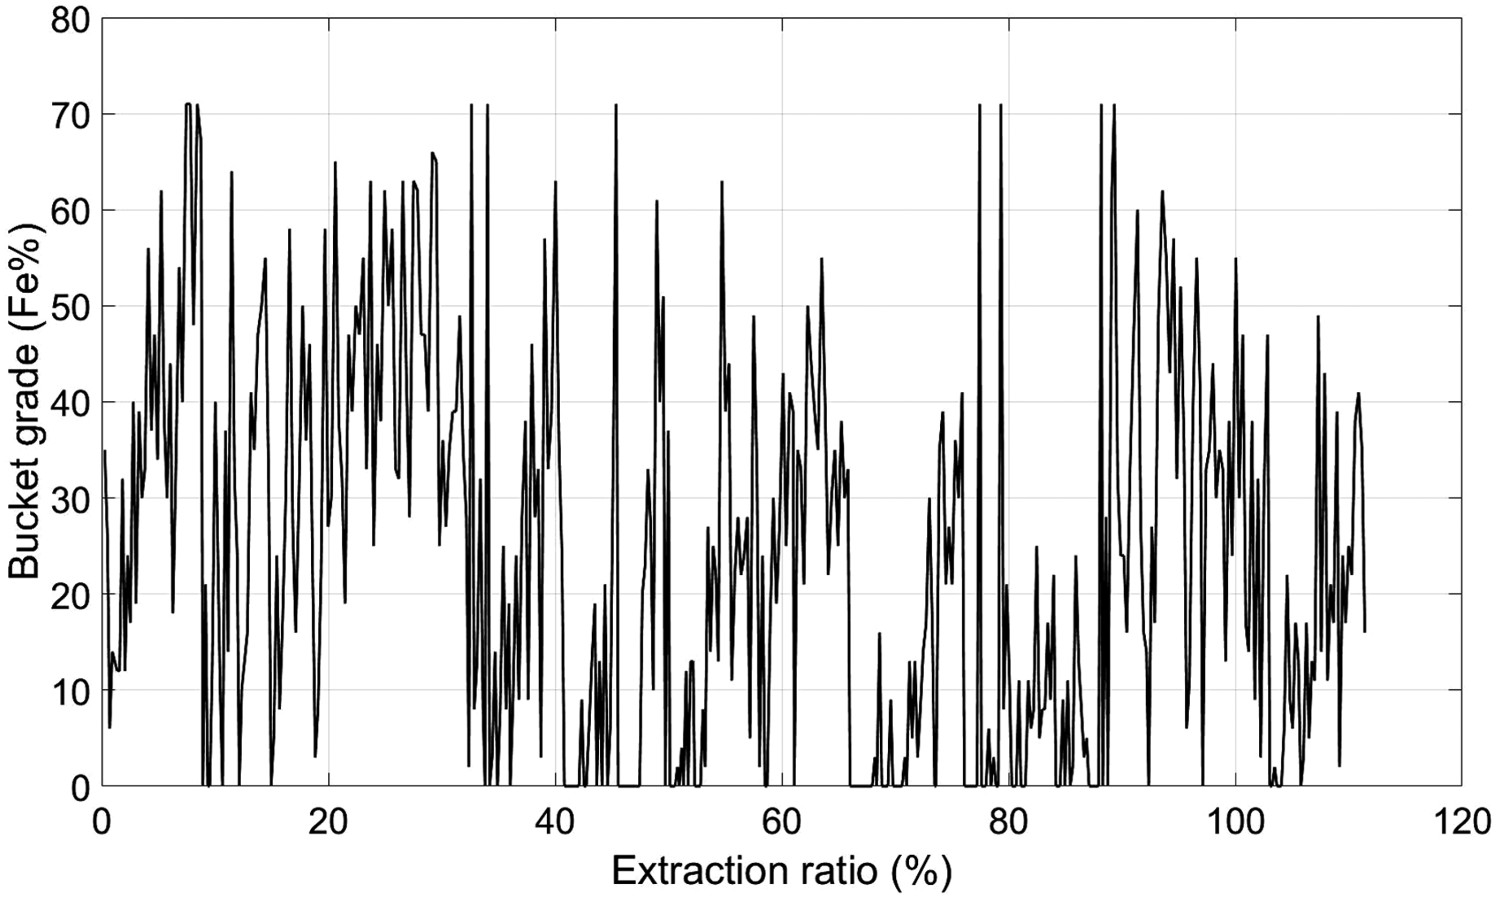
Plot of the bucket grade versus extraction ratio for a ring at the Malmberget mine.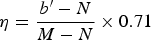
Currently, the mines use a moving average of last 15 buckets loaded to stabilize the variation in the curve and obtain a better understanding of the draw point performance. The ore grade and tonnage are displayed for the operators on the computer screen inside the cabin of the LHD machine (see Figure 4). The system is fully integrated into the mines’ planning systems, which are updated for every loaded bucket.
WOLIS display screen (modified from Adlerborn and Selberg 2008).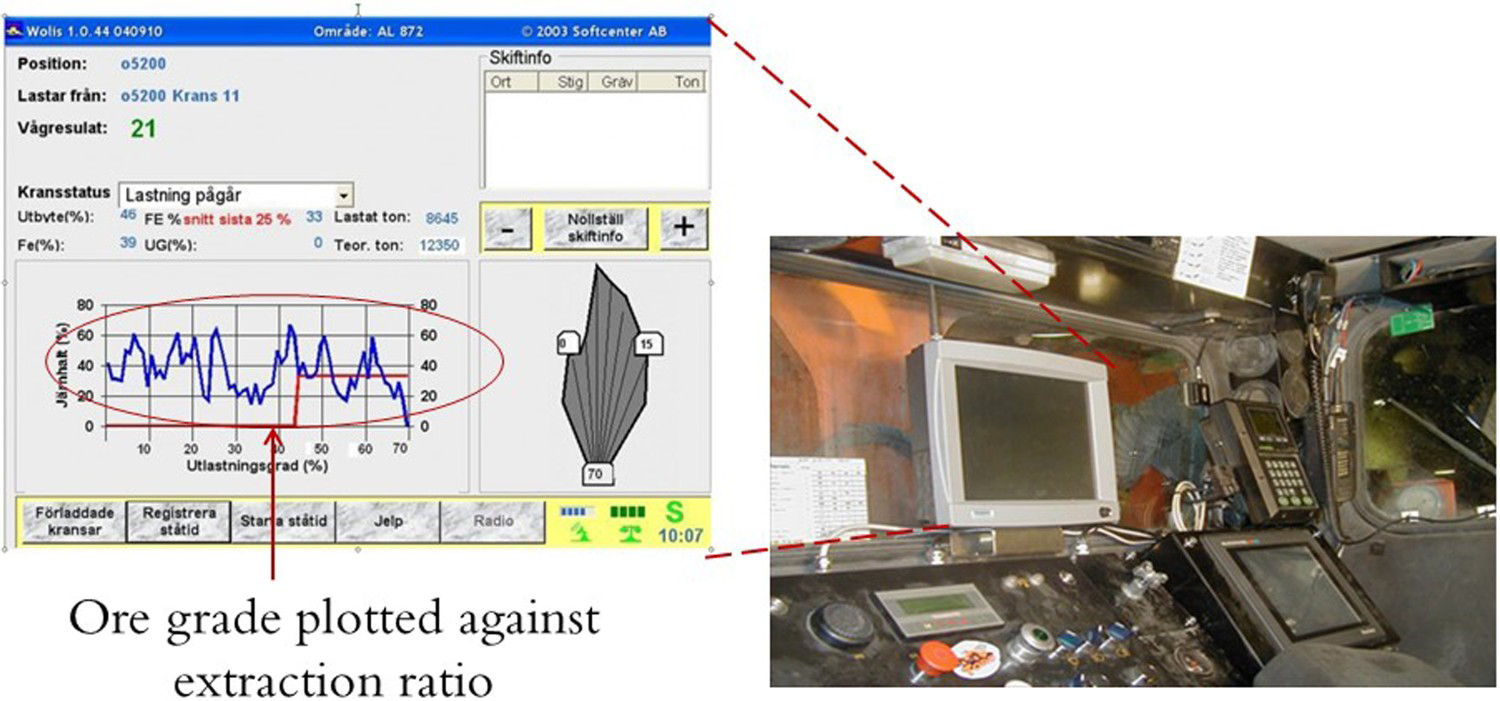
The variation in ore grade makes it difficult to provide a useful overall assessment of the draw point performance to the operator or to offer guidance in the decision to stop loading. Hence, a new model is required which provides a conclusive assessment about draw point performance and displays the information in real time to be used for making decision of when to stop loading.
Model development
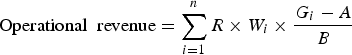
A new economic model was proposed to provide a real-time economic assessment of the performance of a draw point. The model assists the mine with draw control and provide guidance in making the decision of when to stop loading. The model was developed based on the principles of mine economics by accounting for relevant cost and revenue components from all mining activities. The operational profit of a single ring can be defined according to Equation (2).
R = Revenue from selling pellets (SEK/tonnes) Wi = Bucket weight (tonnes) Gi = Estimated bucket grade (Fe%)
 = Conversion factor (A and B are constant values specific to processing plants) used by the Malmberget and Kiirunavaara mines to estimate pellet output for a given ore grade (LKAB 2002).
The operational cost is the combination of all costs for development activities; it is divided into the cost for drilling, charging and blasting rings, and the unit cost for loading, transporting, processing and shipping. The operational cost can be calculated using Equation (4).
C1 = Cost of development, drilling, charging and blasting (SEK/tonnes) C2 = Cost of loading, transport, crushing and hoisting (SEK/tonnes) C3 = Cost of sorting, benefication, pelletization, waste handling, shipping and overhead costs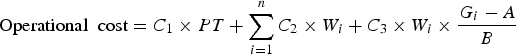
(SEK/tonnes)
PT = Planned tonnage of the ring (tonnes) Wi = Bucket weight (tonnes) Gi = Estimated bucket grade (Fe%)
 = Conversion factor (A and B are constant values specific to processing plants) used by the Malmberget and Kiirunavaara mines to estimate pellet output for a given ore grade (LKAB 2002). The capital cost will vary for different rings, as the mine design and planned tonnage for different rings vary. The cost of loading, transporting, processing and shipping the material loaded in each bucket is estimated based on bucket grade and bucket weight.
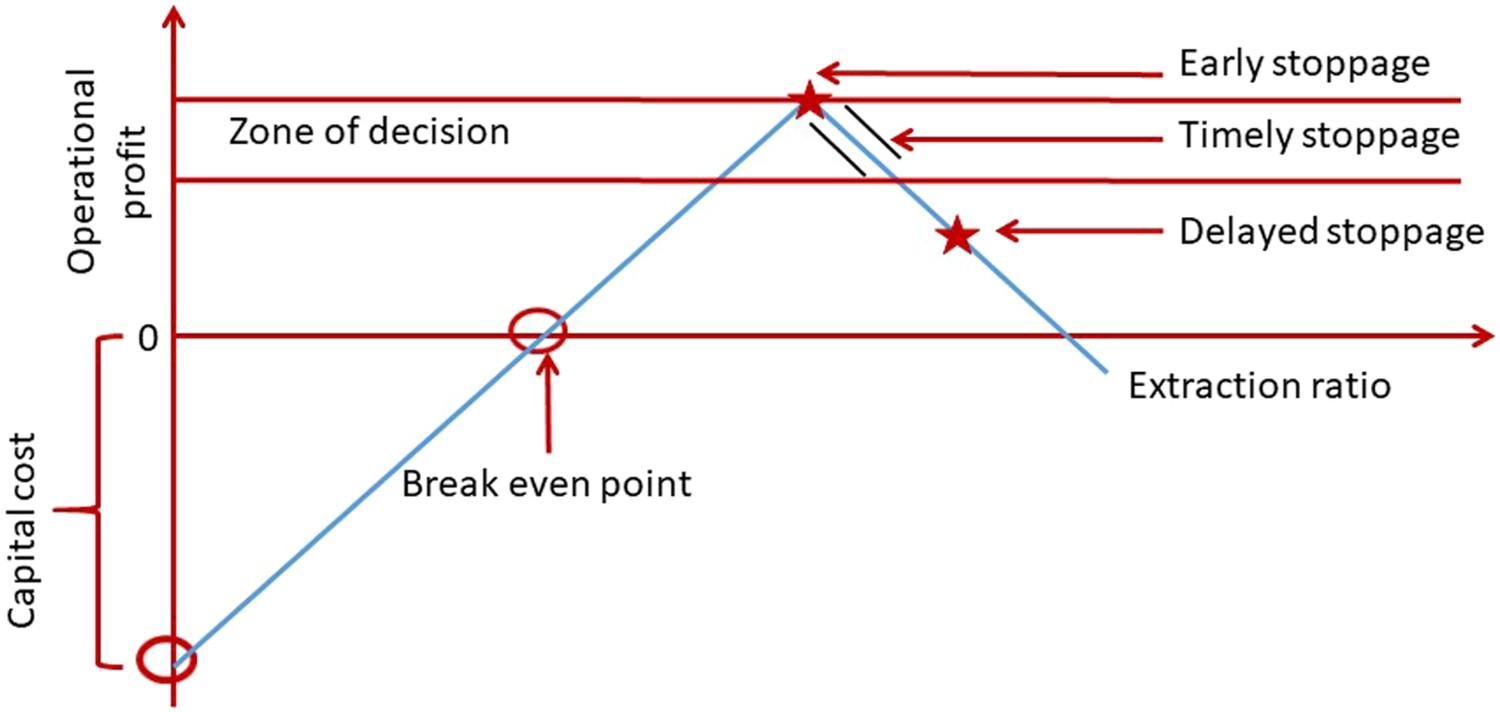
The developed economic model is schematically described in Figure 5. When loading is initiated at a ring, the mine has already made a significant economic investment in developing, drilling, charging and blasting that ring. As more buckets are loaded, the cumulative revenue from a ring increases. After a certain number of buckets, the breakeven point is reached, and the cumulative revenue balances the invested capital cost, as shown in Figure 5. This breakeven point can be reached earlier for rings with better ore quality or with better material flow. For rings with lower ore quality or poorer material flow, however, the breakeven point will be reached later or not at all.
Schematic description of the economic model. This image is available in colour online at https://doi.org/10.1080/25726668.2019.1586371.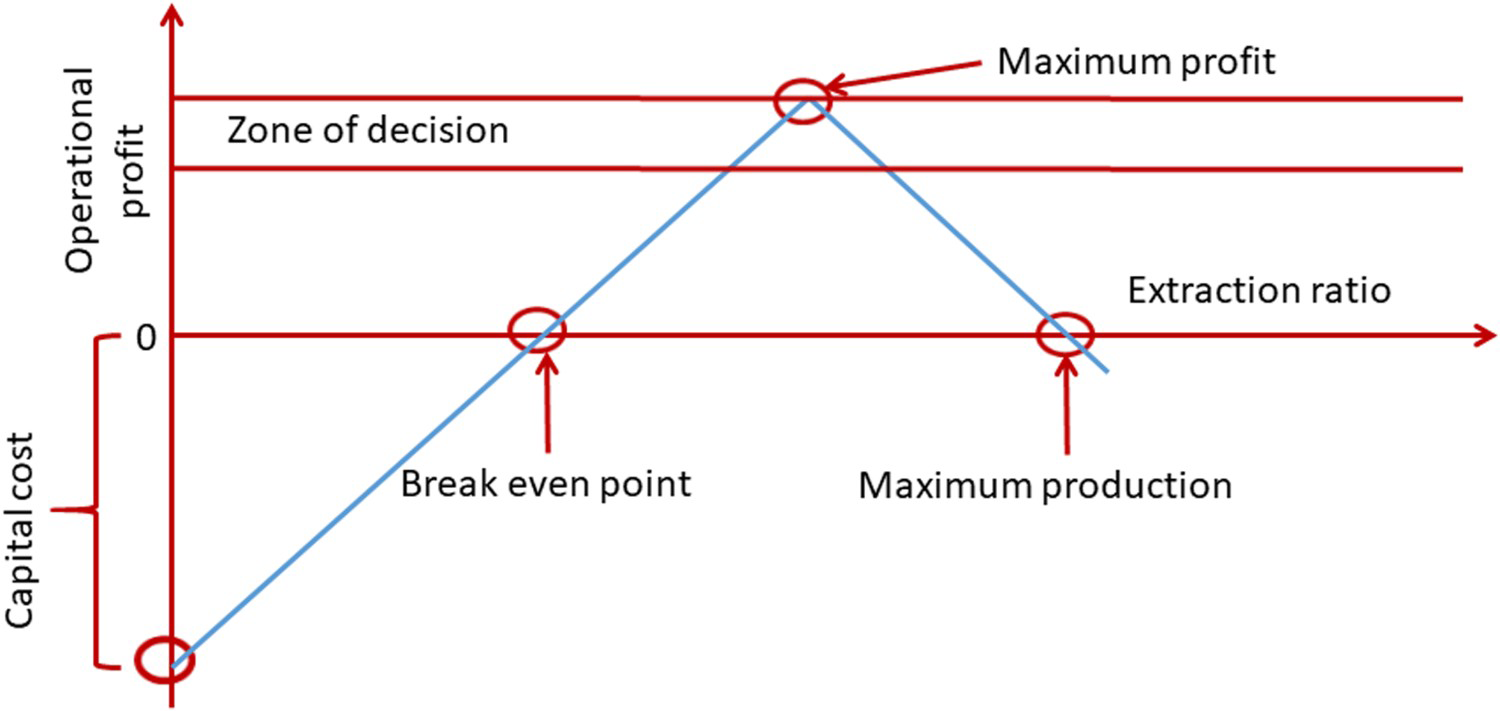
Theoretically, loading from an SLC draw point at the LKAB mines starts with buckets fully filled with iron ore. This continues until caved rock from above is introduced at the draw point. The amount of caved rock will gradually increase and iron ore will decrease until the bucket only contains caved rock. At a certain mix of ore and waste rock, the operational revenue equals the operational costs; in theory, at this point, loading should be stopped, as indicated by the maximum profit point in Figure 5.
In an operating mine, however, the real conditions are very different from the theorized ones, as shown in Figure 3. For example, caved rock can be introduced at very low excavation ratios, and high grade ore can be present at very high excavation ratios.
Any point above the breakeven line represents revenue from the ring, but it is impossible to find the maximum revenue point in an on-line application when the future iron ore grades are unknown. In a situation as in Figure 3, where there are several interchanges of high and low-grade ore, several local revenue optima may be created instead of a single one as in Figure 5.
To assist in the decision on when to stop loading from a draw point, a Zone of Decision (ZOD) is introduced into the model (see Figure 5). Zone of Decision is defined as the interval between two parallel lines in which the top line is fixed to the point of maximum profit, and the bottom line is kept fixed at a constant distance from the top line. The constant distance between the top and bottom line equals the amount of economic risk the mine is willing to take per ring for the opportunity to increase ore recovery and profit from the ring. For example, if the operator knows ore is left in the ring above, recovering it may require loading to a higher excavation ratio in the ring below; this can be done but at a constrained risk level. The profit curve is a cumulative curve which is updated after every bucket is loaded. The model then searches the point with maximum value and the top of ZOD is fixed to it. The point of maximum profit changes during the course of loading as an increased inflow of ore will result in a new maxima in the profit curve.
The two main advantages of the ZOD are:
Model application
To assess the economic model's ability to detect chaotic and non-uniform flow and to observe the nature of the operational profit curve, the model was applied to past production data from the Malmberget and Kiirunavaara mines.
During the analysis several different kinds of loading phenomena were observed. An example is presented in Figure 6 that shows a plot of operational profit vs extraction ratio. At about 25% extraction ratio, the curve crosses the breakeven line; this means the ring is now making operational profits.
An example of a production ring from the Malmberget mine. This image is available in colour online at https://doi.org/10.1080/25726668.2019.1586371.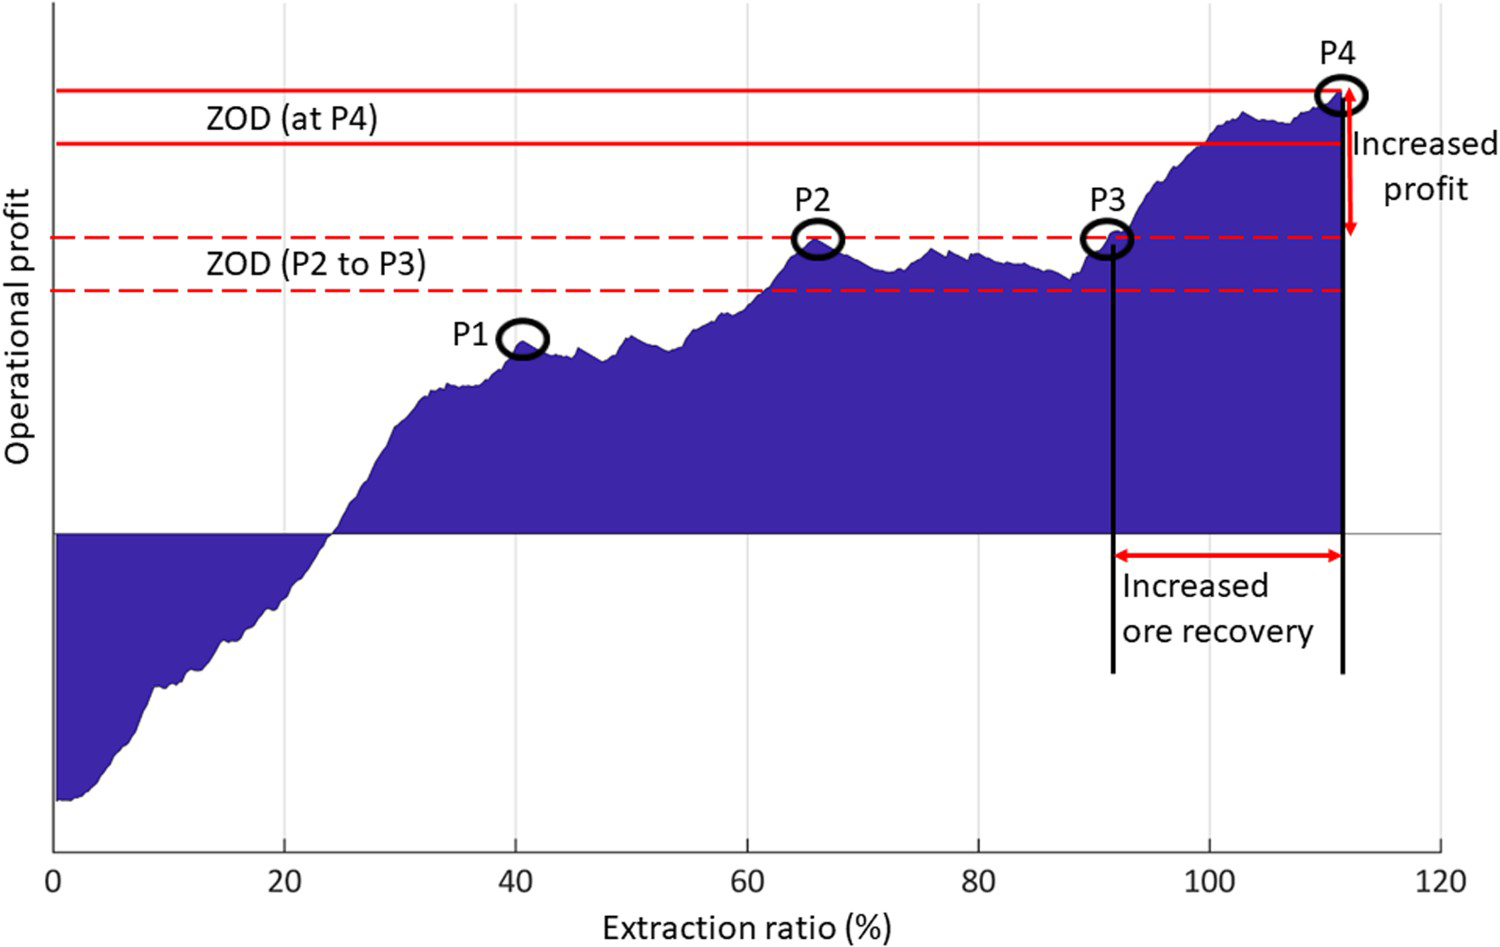
Points P1, P2, P3 and P4 are local maximums of the profit curve. Loading immediately after P1, P2 and P3 will be registered as loss and will reduce the total ring profit. If loading continues, however, the bucket value will again go up, and the total profit will pass three of the earlier maximums, P1, P2 and P3. In all three cases, the interval with non-profit loading after the local maximum is within the ZOD interval and can, therefore, be justified.
In the analysed ring, loading was stopped at P4. The reason for stopping at this point is not known to the authors, but from a strictly economic point of view, loading should have continued. The stop may have been related to other technical considerations that often also impact the loading control. The gradient of operational profit curves keeps on changing due to variation in the ore grade and tonnage of the buckets. This variation is possible to observe only when a draw point monitoring system (either continuous or periodic) is present in the mine. Mines that do not have a draw point monitoring system are primarily dependent on mill grades, which are average values for a large amount of material and are not sensitive to ore grade variations at individual draw points.
Draw control for the production ring described in the above example used the WOLIS system, which displays only the ore grade of the material being loaded. The developed model is able to calculate and show the economic impact of loading at the draw point which provides a much better understanding of draw point behaviour then the ore grade curve.
Model validation
Historical bucket weight and grade dataset for production rings were analysed to explore the feasibility of the proposed model. A total of 722 production rings were analysed from the Malmberget mine for the year 2017 (January–May). Depending on the position on the profit curve at which loading was stopped the rings have been divided into three categories:
Stoppage of loading for a production ring. This image is available in colour online at https://doi.org/10.1080/25726668.2019.1586371.
The production data was analysed based on the three categories to determine the feasibility of pilot tests at the mine. Figure 8 shows the result of the economic model analysis. About 50% of the rings had early stoppage, these rings showed a scope of loading more material if the mine can be equipped with the proposed model. The results also show that almost 30% of the rings had timely stoppage which was achieved by using the present draw point monitoring system. Delayed stoppage was also witnessed for 20% of the rings which means these rings were loaded beyond the acceptable economic risk limit. The results show an advantage of using the proposed economic model for identifying rings which were stopped early leading to ore loss. The model also helps in controlling dilution by identifying rings which had delayed stoppage.
Categories for the production rings. This image is available in colour online at https://doi.org/10.1080/25726668.2019.1586371.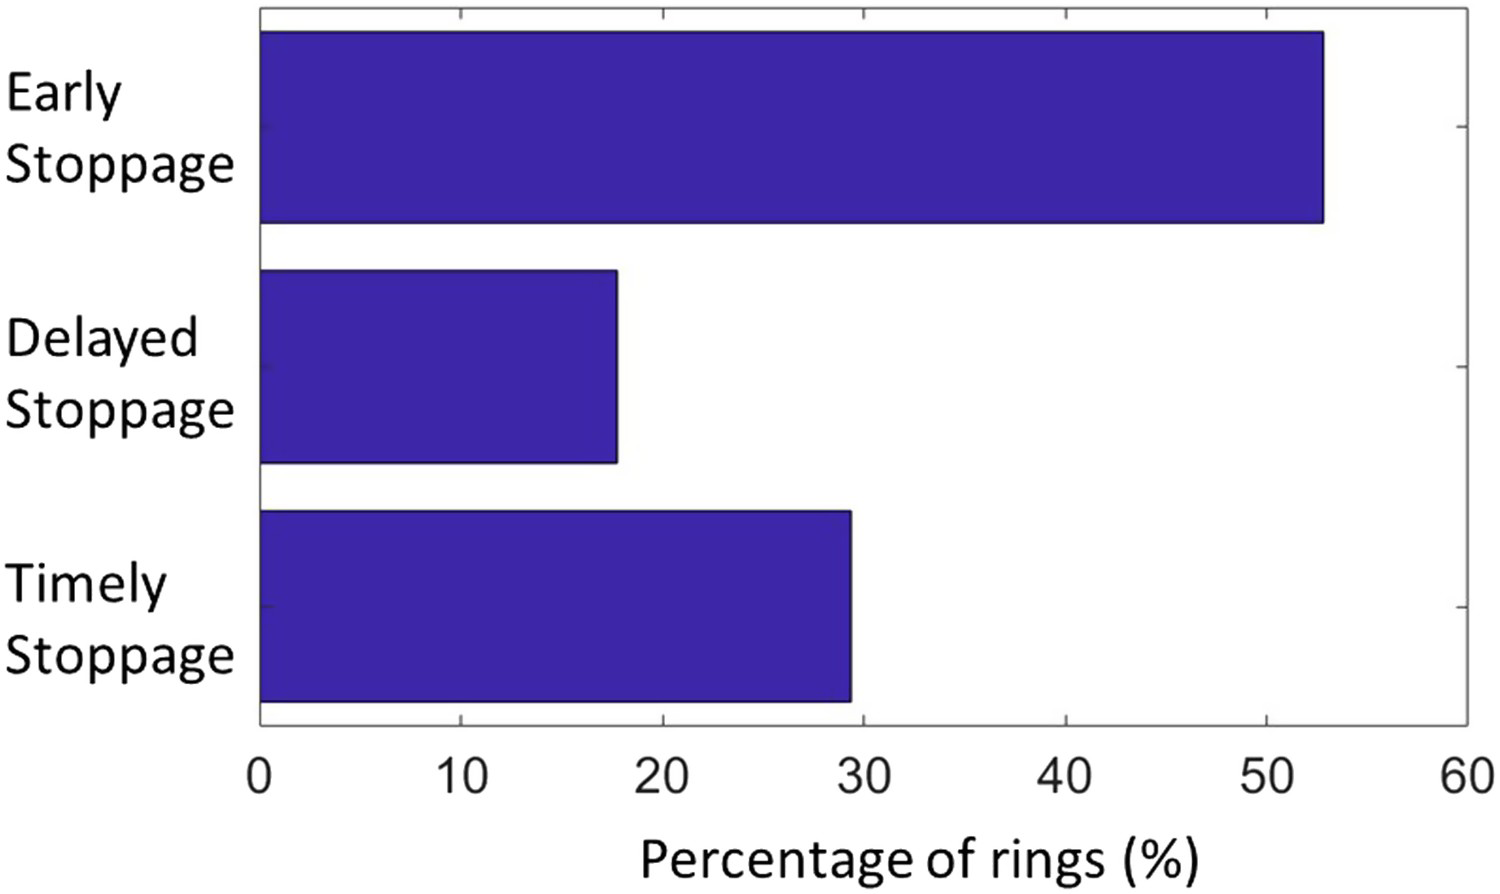
The results show that the proposed model has potential for optimizing loading at the draw point. However, to further validate the model, field test are required in the mine to calibrate the model to mine conditions. This work will be carried out at the Kiirunavaara and Malmberget mine in the future.
Concluding remarks
In SLC, the performance of individual rings can differ significantly from the overall trend of draw point performance. To facilitate operational control, an economic model was constructed using material grade and mine economic parameters. The model can be used in real time to provide information on draw point performance to the mine; it simplifies and visualizes the overall draw point performance of a production ring. The model can be integrated into the production control system to optimize draw control and improve ore recovery. More specifically, it helps mine personnel decide when to stop loading from a draw point, and it can be used by the mine to take calculated economic risks to maximize ore recovery and profit from a draw point. A study is currently being performed to access the feasibility of implementing the newly developed economic model at the Malmberget and Kiirunavaara mines. The model can also be applied in other caving operations with draw point monitoring systems.
The paper highlights the importance of draw point monitoring in sublevel caving operations. An efficient draw control strategy requires a draw point monitoring system which can provide a reasonably accurate estimate of the grade of the material loaded. Current caving operations for deposits such as copper, gold etc. lack draw point monitoring systems and depend primarily on mill grades. The paper shows the importance of having a draw point monitoring system and the advantages of developing new draw point monitoring technologies (e.g. XRF, spectroscopy) to monitor material grade for copper, gold or other metals mined using caving methods.
Footnotes
Acknowledgement
The authors are also grateful for valuable input and support from the staff and management of the Malmberget and Kiirunavaara mines. Agio System och Kompetens AB, Boliden Mineral AB, ABB AB and RTC are acknowledged for their valuable input to the project.
Disclosure statement
No potential conflict of interest was reported by the authors.