
Abstract
Sighter Induced Roll Magnetic Separation tests were conducted on a ferromanganese ore sample to determine the potential to significantly upgrade the Mn content and Mn:Fe ratio. The sample had a Mn:Fe ratio of 1.3 and was comprised of hematite, cryptomelane, pyrolusite, quartz, goethite and braunite. Tests at 4.7, 2.3 and 1 mm top sizes revealed better separation of Fe from Mn at the 2.3 and 1 mm top sizes. This reflected the better liberation and separation characteristics of Fe oxides at 2.3 mm and both Fe and Mn oxides at 1 mm. A test on the −2.3 + 0.6 mm size fraction improved the Mn:Fe ratio to 4.6, the Mn content to 41.5 wt% with 69.4% mass recovery and 84.2% Mn recovery. Particle magnetic susceptibility was influenced by particle microporosity, and its effect on apparent density, resulting in some Mn oxides reporting to the magnetic concentrate and Fe oxides to the tails.
Keywords
Introduction
Ferruginous manganese ore deposits, typically with 15–35 wt% Mn, or with low Mn:Fe ratios (e.g. Mn/Fe of ∼0.5–2), are problematic for manganese alloy makers and thus manganese ore miners (Kivinen et al. 2010). Olsen et al. (2007) state that the production of standard ferromanganese alloy with 78% Mn requires raw materials with a Mn:Fe ratio of at least 7.5. Therefore, such high-Fe manganese ores must be either blended and/ or beneficiated to be economic. Examples of such deposits can be found in the Pilbara and to a lesser extent Peak Hill regions of Western Australia (Horseshoe, De la Hunty 1963; Ripon Hills, Denholm 1977; Woodie Woodie, Rothery 2006), in the Karnataka and Bonai-Keonjhar regions of southern and eastern India (Mohapatra et al. 1996; Nayak and Vijayan 2006) and in Ukraine (Gryshan and Kulish 2015), etc. These deposits often have a largely hydrothermal/ hypogene or metamorphic genesis but may also be locally upgraded due to supergene/ lateritic processes (Jones et al. 2013).
Iron may be present in manganese deposits in the form of Fe-bearing manganese minerals such as bixbyite, jacobsite, braunite and hausmannite (e.g. in the Otsojondu and Wessels deposits in southern Africa – Buehn et al. 1992; Gutzmer and Beukes 1996). However, it may also be commonly found in the Fe oxide and oxyhydroxide minerals hematite and goethite, as well as in Fe silicates (e.g. garnet and amphibole) and Fe carbonate (e.g. siderite) minerals, depending on the local geology and the mode(s) of ore genesis.
Pilbara manganese and ferromanganese deposits can contain high Fe concentrations, largely in the form of hematite, but with lesser amounts of goethite, braunite and bixbyite also potentially present depending upon the deposit (Denholm 1977; Blake et al. 2011; Jones et al. 2013). Non-Fe-bearing or very low Fe-bearing gangue minerals are largely present as quartz and aluminosilicate (kaolinite) (Williams and Baker 1960; Denholm 1977). Aluminium may also be present in Mn minerals, such as lithiophorite, and cryptomelane may contain both Al and Fe in concentrations >1 wt% (Frenzel 1980; Post 1999).
Numerous processing modes have been utilised to attempt to beneficiate ferromanganese ores including one or more of: desliming, gravity separation, dry magnetic separation, high intensity electrostatic separation, ore sorting based upon relative conductivity or other properties, WHIMS, flotation, pre-reduction or reduction roasting coupled with magnetic separation and acid leaching coupled with magnetic separation (Muskett et al. 1960; Denholm 1977; Rao et al. 1998; Kivinen et al. 2010; Singh et al. 2011, 2020; Gryshan and Kulish, 2015; Singh and Biswas, 2017; Tripathy et al. 2015; Lui et al. 2019; Bhoja et al. 2021).
Dry Induced Roll Magnetic Separation (IRMS) is one potential method for upgrading the Mn content and Mn:Fe ratio of ferromanganese ore fines, as the more strongly paramagnetic Fe-bearing minerals, such as hematite, have a higher magnetic susceptibility than more weakly paramagnetic (or non-magnetic) Mn oxide minerals present. The IRMS process has previously been utilised in India to upgrade the Cr:Fe ratio of chromite ore, to upgrade mineral sand ore (e.g. ilmenite and rutile) and to upgrade ferromanganese ore, as well as hematitic iron ore fines (Naik 2002; Singh et al. 2011, 2013; Tripathy et al. 2012, 2014).
Using an Iso-Dynamic Separator, Singh et al. (2013) determined that the mass magnetic susceptibility of manganese (from ferromanganese ore – 40% Mn and 16% Fe – N.B. mineralogy not specified) was lower than that of ilmenite and an order of magnitude lower than that of magnetite (ferromagnetic) for −150 µm sized samples. Ilmenite has been shown to have a slightly lower magnetic susceptibility than hematite, with some overlap in the range (Rosenblum and Brownfield, 2000). Also using Frantz Iso-Dynamic Magnetic Separators, Rosenblum and Brownfield (2000) showed the following order of relevant magnetic susceptibilities: hematite ≥ braunite ≥ cryptomelane ≥ goethite ≈ pyrolusite. The magnetic susceptibility of minerals is influenced by mineral composition, however, so variations in cryptomelane composition (e.g. in contents of Fe, Al, Ba, etc.), which are common in natural samples, even those from the same ore deposit, and the presence of Mn-bearing hematite, could affect this susceptibility ‘order’ (Post, 1999; Rosenblum and Brownfield, 2000).
The study utilised dry magnetic separation to attempt to upgrade the Mn content, increase the Mn:Fe ratio and reduce the silica content of a ferromanganese fine ore sample. A Reading dry induced roll magnetic separator (IRMS) was utilised for this purpose. This device is designed for the highly selective dry magnetic separation of samples of granular materials during laboratory use or test work. Particles are separated according to the magnetic susceptibility and the provision of a continuous variable roll speed and magnetic flux intensity allows the successive separation of a sample into two magnetic fractions and a ‘non-magnetic’ tails fraction. The particle size range that can be tested is as fine as 53 µm to as coarse as 16 mm.
Methodology
Scope and materials
This study characterised the mineralogy and texture of a ferromanganese fine ore sample to inform beneficiation pathways. The beneficiation scoping study utilised dry magnetic separation to upgrade the Mn:Fe ratio while maintaining the best balance between maximising Mn grade and Mn recovery.
An approximately 2 kg sample from the Greensnake manganese ore deposit in the Pilbara, Western Australia (denoted as Ore C) was utilised for the dry magnetic separation test work and ore characterisation. Two ferromanganese lump ore samples were also utilised for additional ore characterisation purposes only, one sample (denoted as Ore B) was from the same deposit, whereas the other (denoted as Ore A) was from a nearby geologically similar deposit (Lox deposit).
Ore characterisation
All three samples were initially examined in hand specimen to identify typical particle mineralogical-textural types. All lump ore particles were washed and oven dried at 50 °C to remove adhering particulate ultrafines. Selected lump ore particles were sectioned with a diamond saw and one half was mounted in epoxy resin and ground and polished to a 1 µm diamond paste finish. These particles were then examined with a Zeiss Axioplan optical microscope under plane polarised and cross polarised reflected light.
Sub-samples from the Fine Ore C sample were riffle split and then crushed and pulverised in a ring mill to ∼−425 µm. These samples were subjected to X-Ray Fluorescence (XRF), Inductively-Coupled Mass Spectrometry (ICP-MS) (for Li) at Bureau Veritas Perth Laboratories and quantitative X-Ray Diffraction (XRD) analysis using the Rietveld method at CSIRO's Australian Resource Research Centre (ARRC) laboratories. Selected fines particles were also washed and oven dried at 50 °C to remove adhering particulate ultrafines. These fines particles were mounted in epoxy resin and ground and polished to a 1 µm diamond paste finish. These particles were then examined with a Zeiss Axioplan optical microscope under reflected light.
Spot (∼1 µm) electron probe microanalysis (EPMA) was undertaken with a JEOL Superprobe microanalyser, Model JXA-8200L, at the Centre for Microscopy and Microanalysis at the University of Queensland. Two hundred and twenty-forty-one point analyses in total were conducted on 22 broadly representative lump ore particles from Lump Ore A and B.
Gas displacement density and envelope density testing was conducted on selected Lump Ore A and Lump Ore B particles using the AccuPyc™ II 1340 Gas Displacement Pycnometry System and the GeoPyc 1360 Envelope Density Analyser respectively. Envelope density measurements include both open and closed particle porosity whereas gas displacement (apparent) density measurements include only closed particle porosity.
QEMSCAN™ analysis was undertaken at CSIRO Mineral Resources’ Waterford laboratories. Analysis was conducted using a pixel spacing of 12.2 µm on representative 30 mm diameter epoxy resin mounts of the magnetic concentrate and non-magnetic tails fractions from the IRMS process which utilised a particle size range of −2.3 + 0.6 mm (test #2).
Dry magnetic separation test work
Dry screening of the head sample showed that the +4.7 mm size fraction comprised 55.6 wt% and the −4.7 mm size fraction comprised 44.4 wt% of the sample mass. IRMS sighter tests were carried out at three different top sizes, 4.7, 2.3 and 1 mm, to compare the influence of particle size on the beneficiation outcomes. The Ore C head sample was thus riffle split to produce three sub-samples for magnetic separation. These sub-samples were dry screened at 4.7, 2.3 and 1 mm respectively.
The plus size material (i.e. +4.7 mm, +2.3 and +1 mm) was then hand crushed to 100% passing 4.7, 2.3 and 1 mm respectively. The −4.7 mm and −2.3 mm samples were then dry screened at 0.6 mm and the +1 mm sample was wet screened at 0.075 mm to remove the ultrafines.
The sighter tests were run at a higher coil current of 6.5 amps, which corresponds to ∼6000, ∼14,000 and ∼16, 000 gauss for the 4.7, 2.3 and 1 mm top sizes respectively, by varying the air gap between the rotor and the pole.
Each magnetic separation test produces three fractions, a primary magnetic fraction, a secondary magnetic or ‘middling’ faction and a non- to weakly-magnetic tail. XRF analysis for Mn, Fe and SiO2 was conducted on the feed samples, all three test fractions for each test and on the two −0.6 mm fractions and the −0.075 mm ultrafines fraction.
Sub-samples of the magnetic concentrates and the non- to weakly-magnetic tail of the −2.3 + 0.6 mm sample were set in epoxy resin and ground and polished to a 1 µm diamond paste finish. These particles were then examined with a Zeiss Axioplan optical microscope under reflected light. These polished blocks were then subjected to QEMSCAN™ analysis.
Results
Ore characterisation
XRF and quantitative XRD
Major and trace element chemistry of the ferromanganese ore sample C.
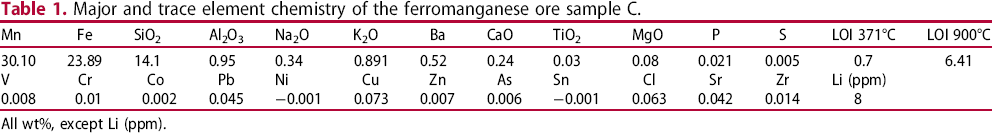
All wt%, except Li (ppm).
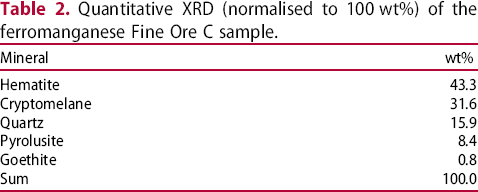
Quantitative XRD (normalised to 100 wt%) of the ferromanganese Fine Ore C sample.
Qualitative hand specimen and optical microscopic examination
A representative photograph of ore particles in hand specimen is shown in Figure 1(a) and optical photomicrographs of particle textures observed during microscopy are shown in Figure 1(b–g).
Representative photograph (a) and optical photomicrographs (b–g) of Fine Ore C particle textures (reflected plane polarised light). Key to Figure labels for b–g: H – hematite, Mph – microplay hematite, BH – botryoidal hematite, Nh – Sub-micron hematite, G – goethite, B – braunite, C – cryptomelane, P – pyrolusite, Po – porosity, Py – pyrite and Q – quartz.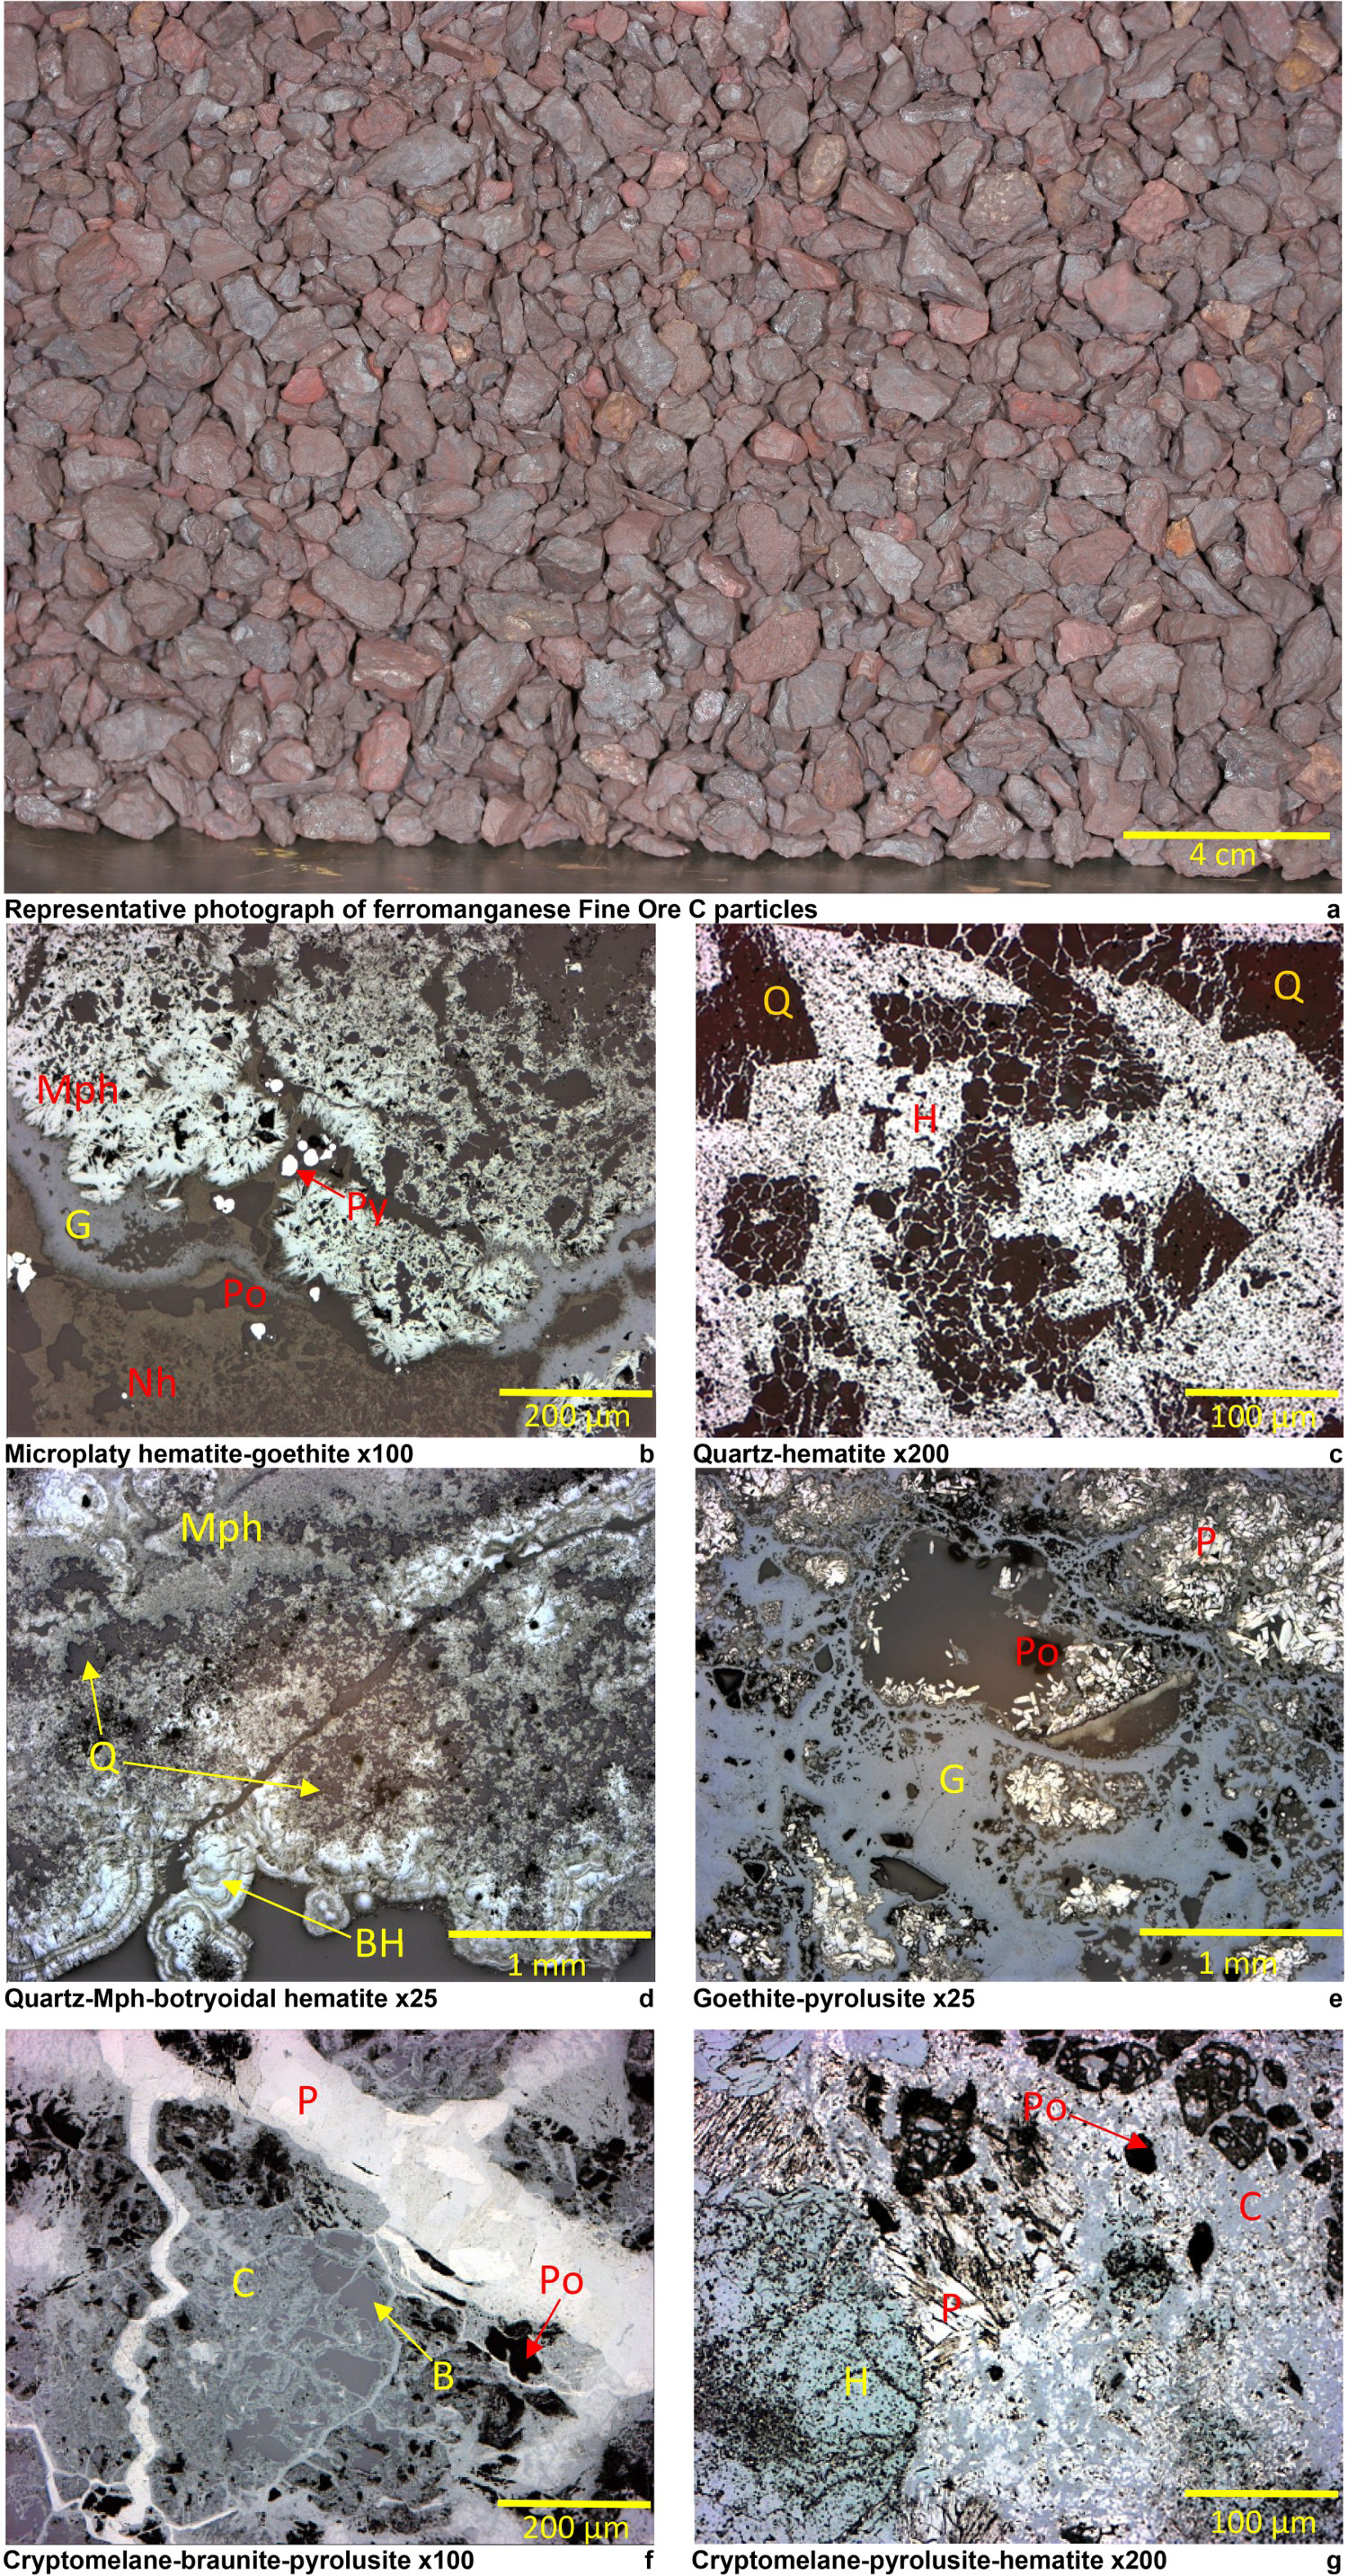
Two broad particle textural types were identified during hand specimen examination and optical microscopy. The first involved the association of hematite and quartz ± goethite ± pyrolusite, with hematite variably present as fine microplaty hematite, nanocrystalline hematite and dense to botryoidal, relatively more coarsely microcrystalline hematite (Figure 1(b–d)). The second involved the association: cryptomelane-pyrolusite ± braunite ± hematite ± goethite ± quartz ± ferruginous clay (kaolinite?) (Figure 1(e–g)).
Hematite grain size varied markedly as did the proportions of quartz and hematite within discrete particles (Figure 1(b–e)). Goethite was more often associated with hematite (Figure 1(b)) than with Mn oxides (Figure 1(e)). Where present, braunite was largely replaced by cryptomelane and pyrolusite and remained as fine relict inclusions within the other Mn oxides (Figure 1(f)). Pyrolusite was sometimes present as later vein or vug infill, often quite coarsely microcrystalline (Figure 1(f)).
Electron probe microanalysis (EPMA) – insights into Mn and Fe deportment
Mean contents of selected major elements for EPMA analyses on representative particles from Lump Ore A and Lump Ore B.
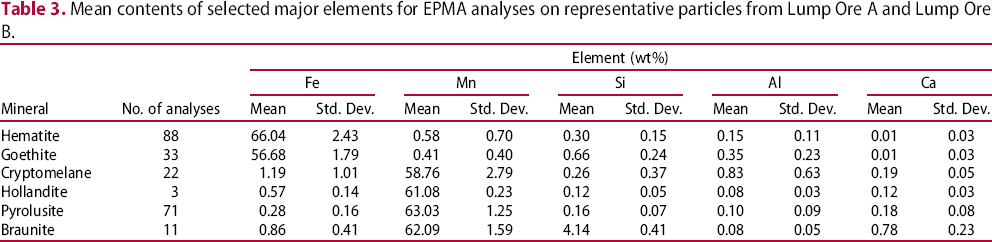
However, it was also common for hematite and goethite analysis points to show minor Mn contents and for Mn oxide analysis points to show minor Fe contents (Table 3). These values could reflect substitution of Mn for Fe in the hematite or goethite structure, or again, these analysis points could reflect, to some extent, very fine inclusions of Mn oxides within Fe oxides for example (cf. Bühn et al. 1995; Alvarez et al. 2006).
Cryptomelane analysis points exhibited quite variable minor element compositions, particularly the (K + Ba + Na) total, which is typical for natural samples (e.g. Post, 1999), but also for the Fe and Al contents (Table 3). There was some correlation between high Fe and high Al contents. The presence of Fe and Al, amongst other elements, in cryptomelane analyses has been reported previously in the published literature (Frenzel, 1980; Post, 1999).
Braunite analysis points returned a mean Fe content of 0.86% Fe (Table 3). Fe-bearing braunite is well documented in the literature from South African manganese ore deposits (De Villiers and Herbstein, 1967; Gutzmer and Beukes, 1996). Based upon optical microscopic observations, elevated mean Fe, Si and Ca values in pyrolusite are interpreted to reflect, in part, the presence of fine inclusions of relict braunite (Table 3).
Pycnometry
Listed densities for relevant minerals (g/cm3).
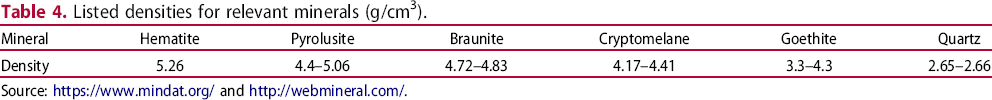
Source: https://www.mindat.org/ and http://webmineral.com/.
Clearly some of the minerals shown in Table 4 have notable natural variations in their listed densities (e.g. pyrolusite and goethite), some of which might reflect differences in composition, crystallinity and microporosity. For example, previous research has shown that ochreous goethite (‘limonite’) has much higher microporosity, lower mean Fe and higher mean O contents than the relatively harder, more dense ‘brown’ goethite (Manuel and Clout, 2017).
To obtain some data on the ferromanganese ore particle densities from the current samples the envelope and gas displacement (apparent) densities of eight sectioned particles from Lump Ore B and two sectioned particles from Lump Ore A were calculated from solid (graphite) and gas (helium) phase pycnometry tests respectively. The particles were selected to be broadly representative of particle mineralogical-textural types observed during examination of the two lump ores in hand specimen, in order to inform interpretations of the impact of a particle's density on its IRMS performance. The particles were sectioned and one half was examined under the optical microscope, after mounting in epoxy resin and polishing, in order to confirm hand specimen observations.
The apparent density reflects the density of the constituent mineralogy, so particles with notable goethite or quartz contents (e.g. Lump Ore A-2 and Lump Ore B-7 respectively) exhibit lower apparent density, due to the relatively lower density of these minerals (Tables 4 and 5). The difference between the apparent and envelope density reflects the extent of particle porosity (macro and microporosity) and to some extent the ‘smoothness’ of the external particle surface and/ or the shape of the particle, which can affect the ability of the graphite medium to pack tightly around the particle when force is applied to the sample during envelope density testing. This will in turn affect the packing volume, which is used to calculate the envelope density (Micromeritics GeoPyc 1360 Envelope Density Analyser manual).
Apparent density and envelope density measurements for selected lump ore particles.
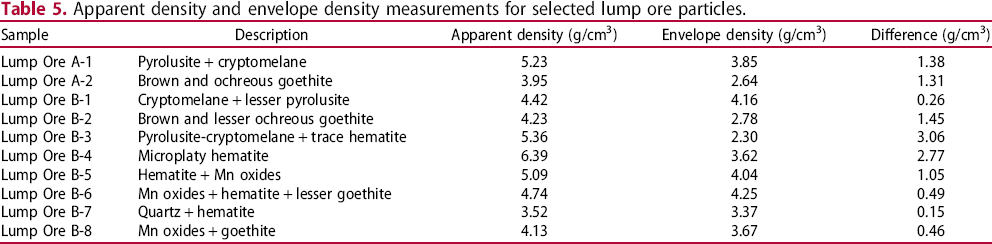
Based upon these analyses it was considered possible that particles composed of high density mineral phases, such as hematite and pyrolusite, but with low levels of porosity could behave differently during IRMS to particles comprised of the same (or very similar phases) with relatively high microporosity, given that they have a similar particle size.
Beneficiation
IRMS test work
Test 1 – 4.7 mm top size
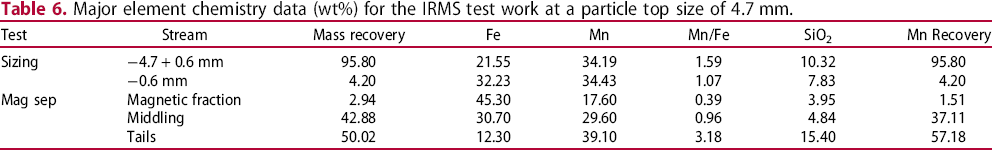
Dry screening of the −4.7 mm Fine Ore C sample at 0.6 mm slightly improved the Mn:Fe ratio and lowered the SiO2 content of the +0.6 mm size fraction by ∼3.8 wt% compared to the head sample (Tables 1 and 6). The Fe content in the −0.6 mm particle size range was relatively increased compared to the +0.6 mm size fraction. However, only 4.2% of the mass reported to the −0.6 mm size fraction during screening.
Major element chemistry data (wt%) for the IRMS test work at a particle top size of 4.7 mm.
Test 2 – 2.3 mm top size
Major element chemistry data (wt%) for the IRMS test work at a particle top size of 2.3 mm.
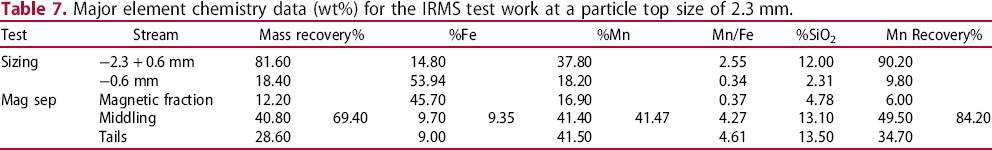
Only 12% of the total −2.3 mm size fraction mass reported to the primary magnetic fraction during this IRMS test, with the greatest mass reporting to the middling fraction. Good separation of Fe and Mn was evident in all three fractions (Table 7). The middling fraction had a very high silica content, however, similar to that of the tails. The Mn/SiO2 ratio was consistent across the three fractions (∼3.1–3.5), whereas the Fe/SiO2 ratio was much higher in the magnetic concentrate (9.6, compared to ∼0.7 for the middling and tails). This suggests that silica-rich particles in the middling and tails might often have subordinate Fe oxide mineralisation, whereas Fe oxide particles in the magnetic concentrate most probably had only subordinate quartz.
Combining the middling and tails fractions as an Mn concentrate gave an upgrade to 41.5 wt% Mn with a Mn:Fe ratio of 4.4, but with high silica, at a mass recovery of 69.4 wt% and Mn recovery of 84.2 wt% (Table 7).
Test 3 – 1 mm top size
Major element chemistry data (wt%) for the IRMS test work at a particle top size of 1 mm.
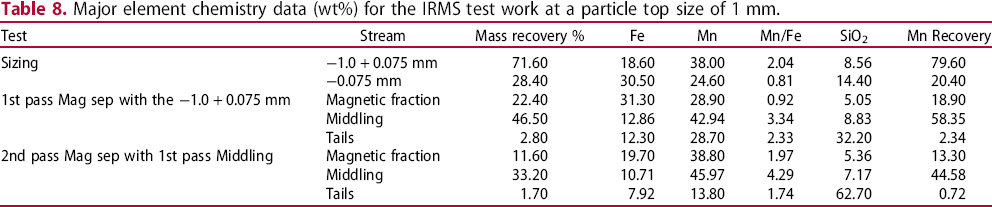
A very high proportion of the −1 + 0.075 mm size fraction mass (∼65 wt%) reported to the middling fraction for this IRMS test. Therefore, the middling fraction from the first IRMS pass was used as the feed for a second pass magnetic separation to test the merits of a multi-pass strategy (Table 8). Most of the mass reported to the ‘middling’ fraction and magnetic fractions for both the 1st pass and 2nd pass IRMS tests, (Table 8). The low mass returns to the tails fractions indicates the improved ability of the particles to be attracted to both the 1st pass and 2nd pass magnetic poles at this particle size and magnetic field strength.
The Mn content of the 1st pass magnetic concentrate remained high, similar to the Fe content (Table 8), suggesting that good separation of Fe and Mn was not achieved at the first rotor in the IRMS process. As separation of Fe and Mn oxides would likely be much improved at this size fraction compared to tests #1 and #2, this was most probably largely due to the increased magnetic field utilised for test #3. The presence of paramagnetic braunite inclusions in Mn oxide particles (Figure 1(f)), as well as entrainment of particles are other possible factors leading to increased Mn deportment to the magnetic concentrate. The Fe content of the 1st pass magnetic concentrate was notably higher than that of the middling fraction and the tails, which were similar to one another. Thus, separation of Fe and Mn was much improved in the middling fraction, and to a lesser extent in the tails, than in the 1st pass magnetic concentrate (Table 8).
The middling fraction from the 2nd pass magnetic separation graded 46 wt% Mn with slightly lower SiO2 and an improved Mn:Fe ratio compared to the 1st pass middling fraction (Table 8). As for the 1st pass, the 2nd pass magnetic concentrate had a high Mn content and an increased Mn/Fe ratio.
Silica vs Mn:Fe ratio across test #1 to test #3
As might be expected, silica content correlated negatively with Fe (R2 = −0.66, −0.55) and positively with Mn content (R2 = 0.6, 0.25), and therefore positively with Mn:Fe ratio in the magnetic and middling fractions (R2 = 0.6, 0.51). This suggests that silica is either entrained into the flow of particles to the primary and secondary magnetic fractions and/or is more likely to be associated with Mn (than Fe) particles that are paramagnetic at the magnetic field strength used for the three tests. Silica content correlated negatively with Mn (R2 = −0.99) but not notably with Fe in the tails’ fractions, therefore negatively with Mn:Fe ratio (R2 = −0.71). This suggests that silica reporting to the tails is relatively more likely to be liberated or largely liberated with subordinate Fe mineralisation, than associated with Mn.
IRMS test #2 – products characterisation
As the IRMS test on a −2.3 + 0.6 mm sized sample produced the best combination of Mn:Fe ratio, Mn grade, Mn recovery and mass recovery, its products were subjected to further characterisation to examine their mineralogical and textural features.
Optical microscopy
Qualitative optical microscopic examination of the −2.3 + 0.6 mm magnetic fraction and tails fraction showed that some ‘liberated’ Mn oxide particles reported to the magnetic fraction (Figure 2(a,c)) and that some ‘liberated’ hematite and/ or goethite particles reported to the tails fraction (Figure 2(d,e)) during IRMS test work. This analysis also showed that even though separation of Mn and Fe oxides, and separation of quartz and Mn oxides and/ or Fe oxides, was good overall at this particle size range (Figure 2(a,c,d)), there were several examples of particles showing Fe oxide-quartz (Figure 2(a)), Mn oxide-quartz (Figure 2(b)) and Mn oxide-Fe oxide intergrowths (Figure 2(f)).
Representative optical photomicrographs of particles from the magnetic and tails fractions from IRMS test #2. Key to Figure labels: H – hematite, HH – hydrohematite, Mph – microplay hematite, Nh – sub-micron hematite, Mn – manganese oxide, G – goethite, B – braunite, C – cryptomelane, P – pyrolusite, Po – porosity and Q – quartz.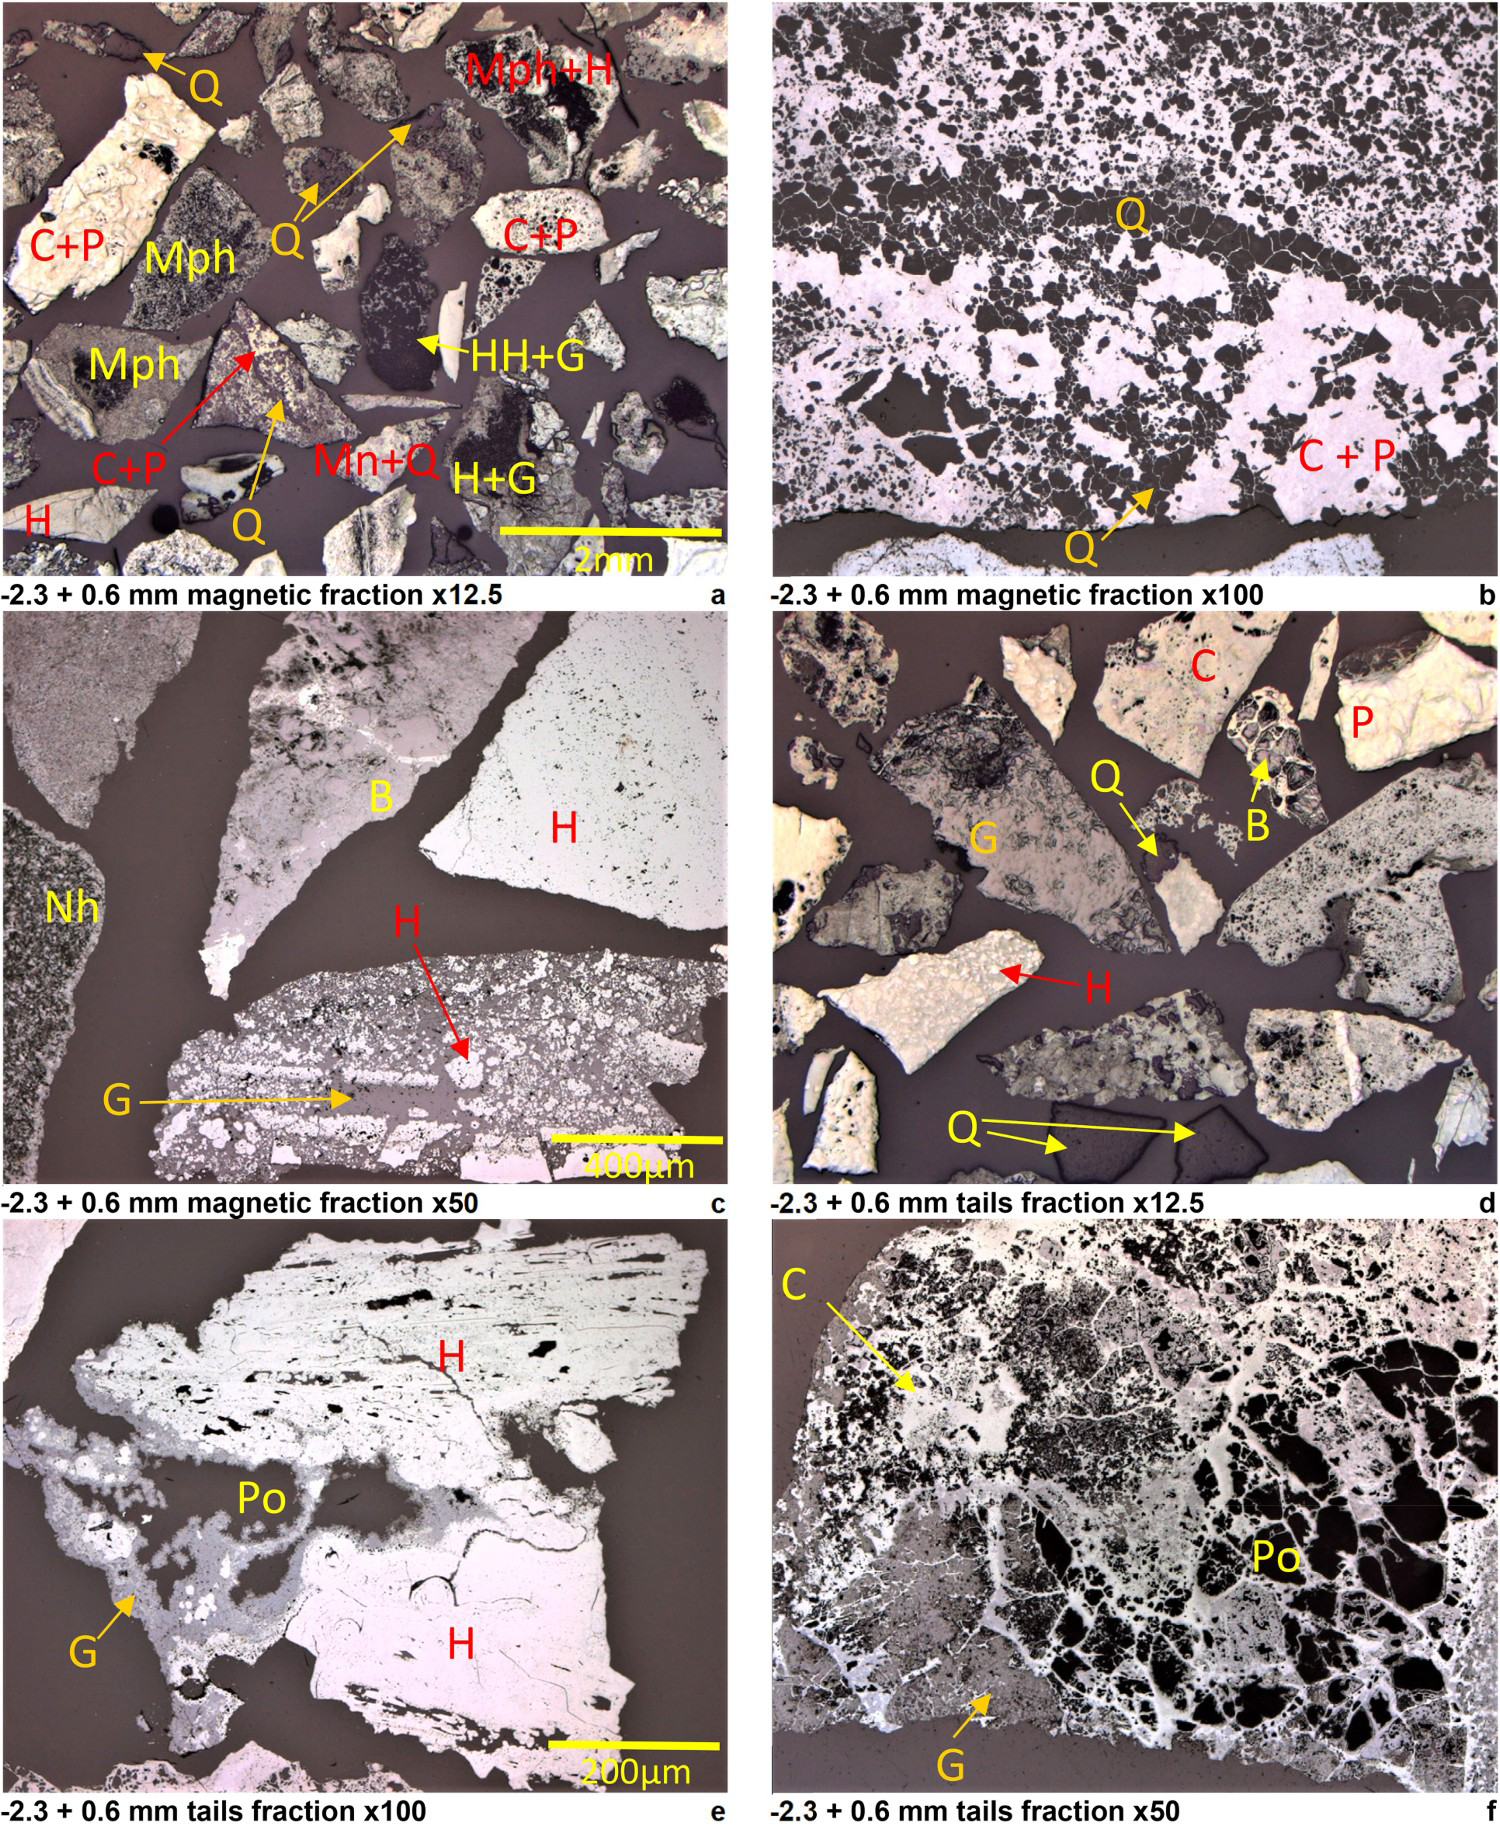
QEMSCAN™
The magnetic fraction and tails for IRMS test #2 were subjected to QEMSCAN™ analysis to provide quantitative analysis on modal mineralogy, calculated assay, locking, liberation, grain size and mineral association. For liberation and grain size data, the mineralogy was grouped into ‘Mn oxides’, ‘Fe oxides’ and ‘Quartz’ to simplify presentation and interpretation.
Calculated assay
Comparison of calculated QEMSCAN ™ assay data for Mn, Fe and Si for the magnetic fraction and tails fraction from IRMS test #2, with XRF analysis values.
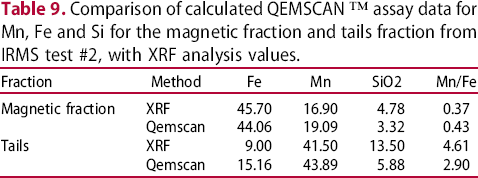
The Mn, Fe and SiO2 values for the XRF and QEMSCAN™ data for the magnetic fraction were broadly similar but the XRF and QEMSCAN™ data for SiO2 and Fe for the tails fraction were notably different, especially for SiO2 (Table 9). This may reflect the tendency for QEMSCAN™ to allocate pixels with high Fe and low Si spectral counts to an Fe oxide phase such as hematite, rather than consider them as fine associations of hematite and quartz.
Modal mineralogy
Calculated modal mineralogy for the magnetic fraction and the tails fraction for the IRMS test #2 (−2.3 + 0.6 mm).
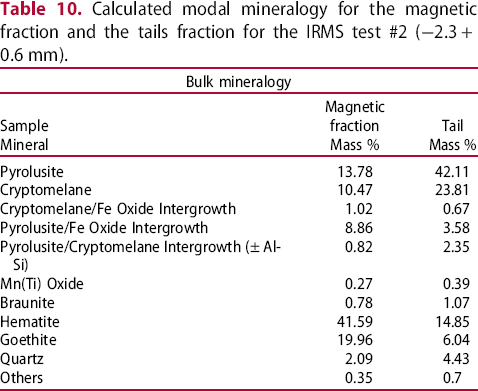
QEMSCAN™ data shows that both the magnetic fraction and the tails fraction have a higher pyrolusite:cryptomelane ratio and a relatively lower hematite:goethite ratio than for the XRD data on the head sample. The proportion of quartz determined by the QEMSCAN™ method was much lower than for the XRD method. As noted previously, these differences are interpreted to be artefacts of the compositional definition used for the various minerals during QEMSCAN™ data processing, e.g. the definition of K content of cryptomelane.
Mn deportment
Calculated Mn deportment (% of total Mn in fraction) of each QEMSCAN™ phase in the magnetic fraction and tails fraction from the IRMS test #2.
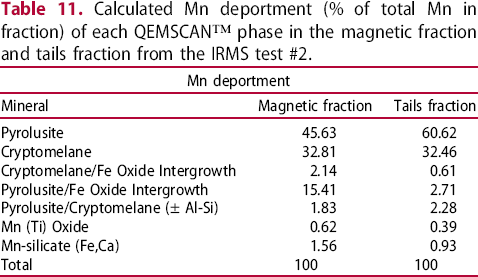
Some explanatory comments are required to address the nature of these ‘Intergrowth’ categories. They necessarily reflect the mineralogy and particle texture of the samples analysed, which exhibited varying combinations of fine associations of different Mn oxides, Fe oxides and quartz. In essence these areas, as characterised by QEMSCAN™, represent analysis points (pixels) with mixed spectral counts that might reflect very fine associations of two or more minerals (N.B. the pixel spacing for the analysis was 12.2 µm) and/ or boundary phases. As already noted, some EPMA points on particles from Lump Ore A and B also exhibited complex mixed spectra (e.g. cryptomelane with anomalous, i.e. > 1 wt%, Fe, Al and Si).
The deportment of Mn to each QEMSCAN™ ‘Intergrowth’ category was determined by assigning a typical composition, so Mn deportment (and Fe deportment) in these categories should be considered to be an order of magnitude estimate, as the actual composition of these areas would be expected to be quite variable. The varying Mn:Fe ratio of these mixed phases will most probably reflect different types of mineral associations and/ or levels of elemental substitution. This in turn will mean these particles could have subtly to significantly different magnetic susceptibilities (Rosenblum and Brownfield, 2000; Leißner et al. 2016).
Mineral association
Mineral association data for the ‘Mn oxides’ grouping, for the ‘Fe oxides’ grouping and for ‘Quartz’ is presented graphically in Figure 3. This data shows that Mn oxides were most commonly present as liberated (or nearly liberated) grains in both the magnetic fraction and the tails and that Mn oxides were relatively more commonly associated with Fe oxides in the magnetic fraction than in the tails (Figure 3(a)). Fe oxides were most commonly associated with pyrolusite, especially in the magnetic fraction, but also present as liberated grains or associated with quartz, the latter especially in the tails (Figure 3(b)). Quartz was most commonly associated with iron oxides, especially in the magnetic fraction (Figure 3(c)).
Mineral association data for the magnetic fraction and for the tails fraction for (a) ‘Mn oxides’ (b) ‘Fe oxides’ and (c) ‘Quartz’ for IRMS test #2.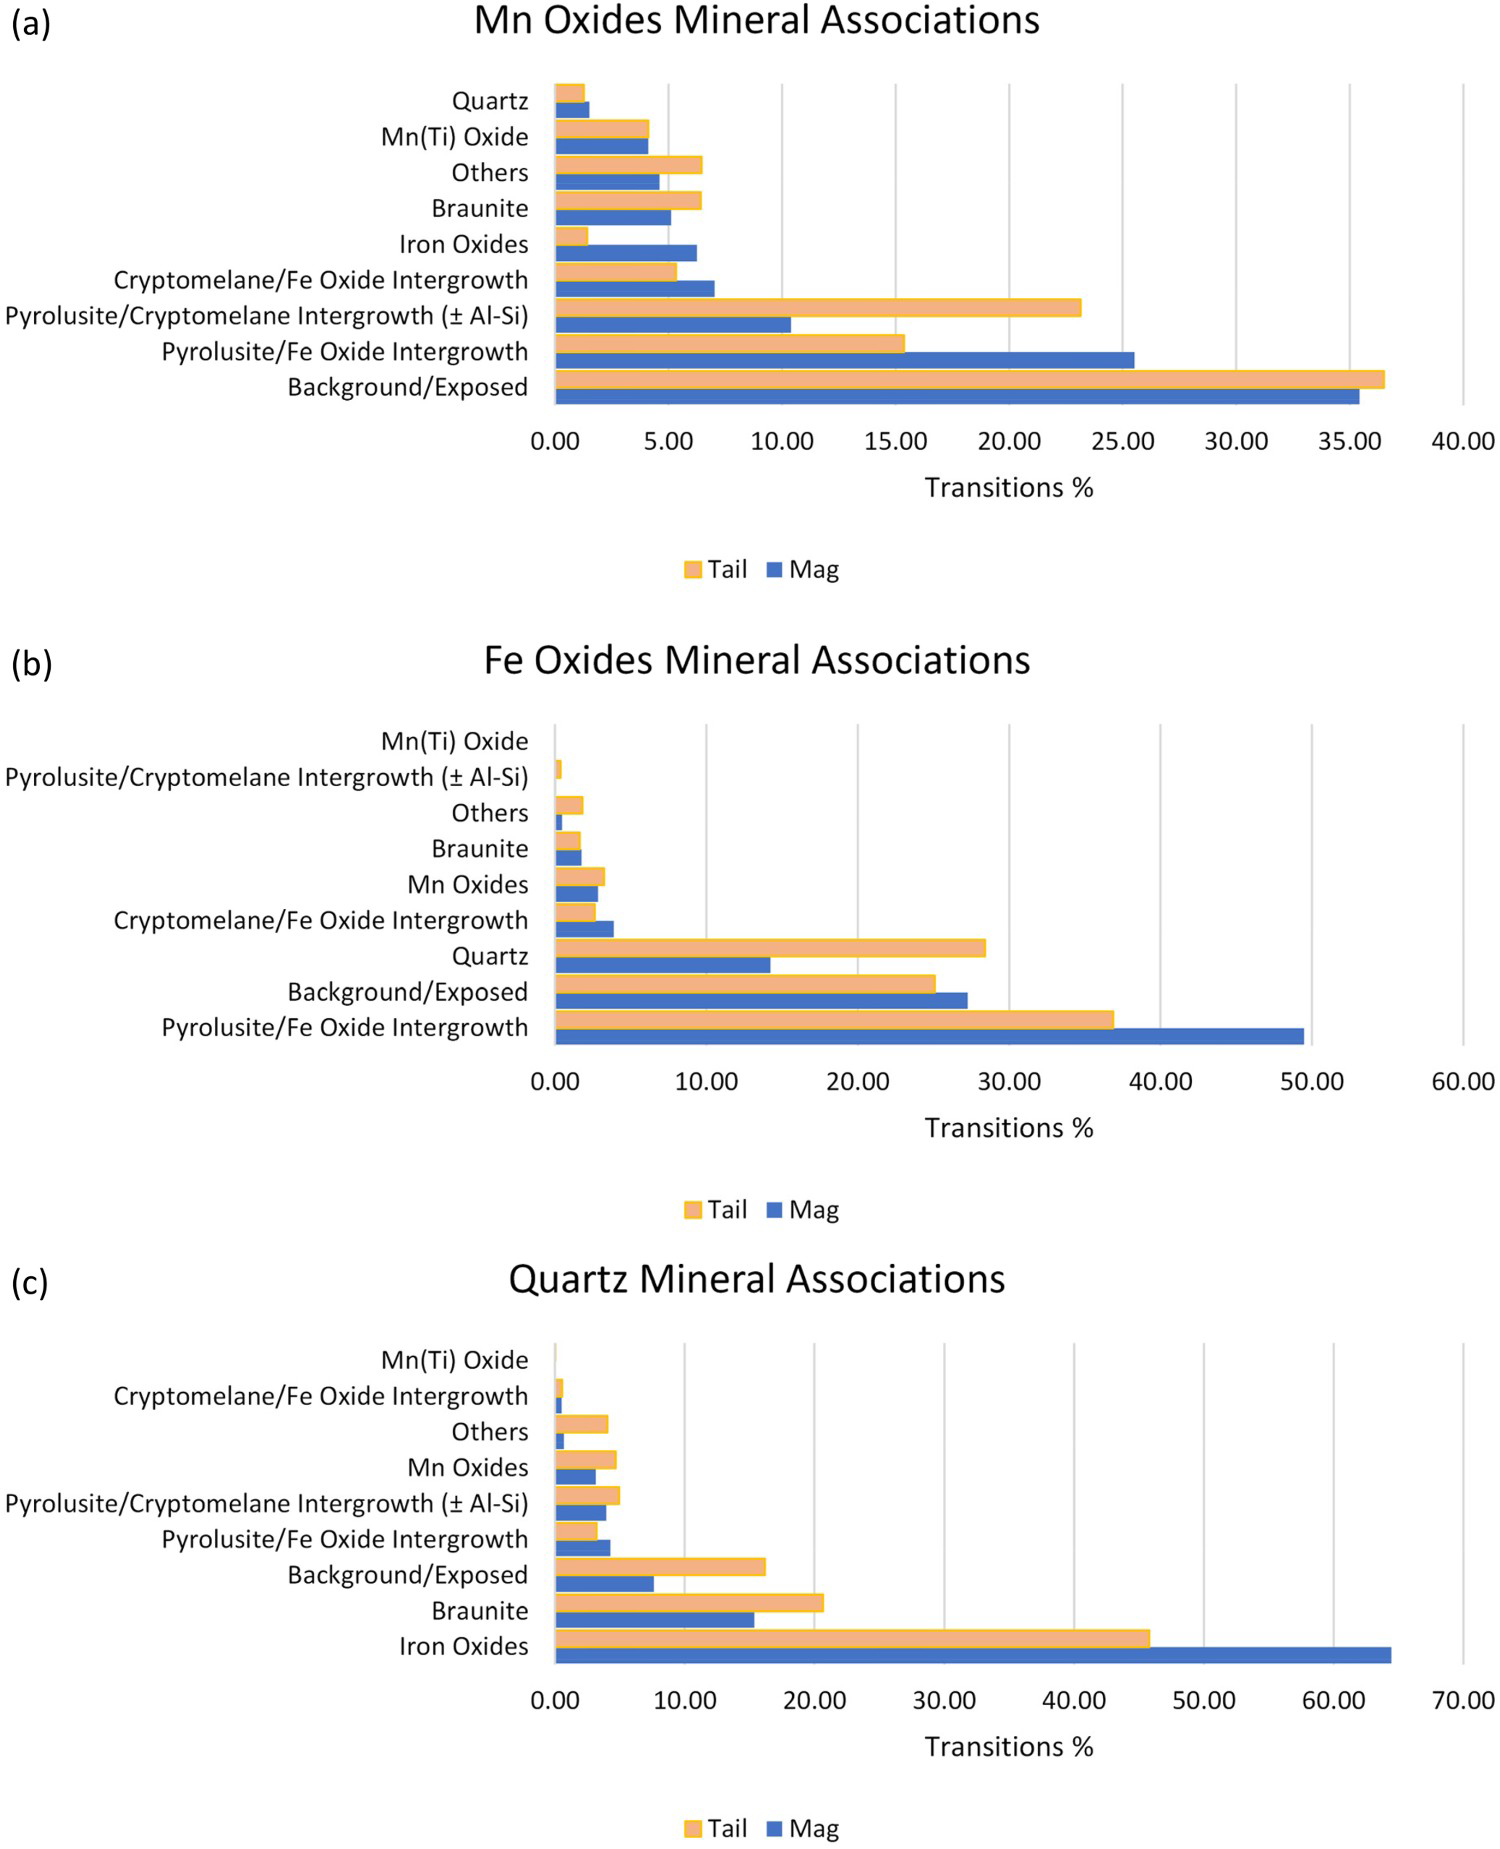
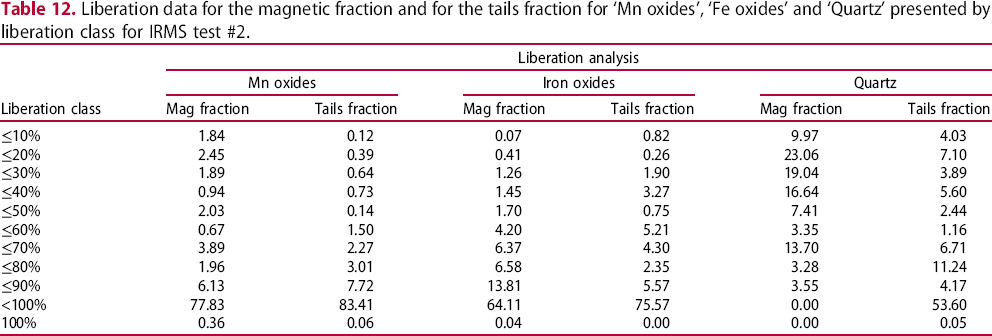
Liberation analysis
Liberation data for the magnetic fraction and for the tails fraction for ‘Mn oxides’, ‘Fe oxides’ and ‘Quartz’ presented by liberation class for IRMS test #2.
Grain size distribution
The grain size distribution for the three mineral groupings discussed above, as well as for all particles irrespective of mineralogy, are displayed in Figure 4(a) (magnetic fraction) and in Figure 4(b) for the tails fraction. Note that QEMSCAN™ analysis calculates the grain size of the particles from the 2-dimensional cross-section and does use a stereological correction. The particle size distribution (‘All Particles’) in the tails fraction was clearly skewed towards coarser (+1 mm) particles, compared to that of the magnetic fraction (∼70 wt% compared to ∼38 wt% + 1 mm). The data also shows a significant proportion of −0.6 mm particles, ∼15 wt% for the magnetic fraction and ∼5 wt% for the tails (Figure 4). These finer particles might reflect some measure of particle disintegration during sample preparation and/ or magnetic separation test work and/ or might possibly reflect small scale sectioning of thinner sections within larger particles during grinding for polished block preparation.
Grain size distribution for broad mineral groupings for the (a) magnetic fraction and (b) tails fraction for IRMS test #2.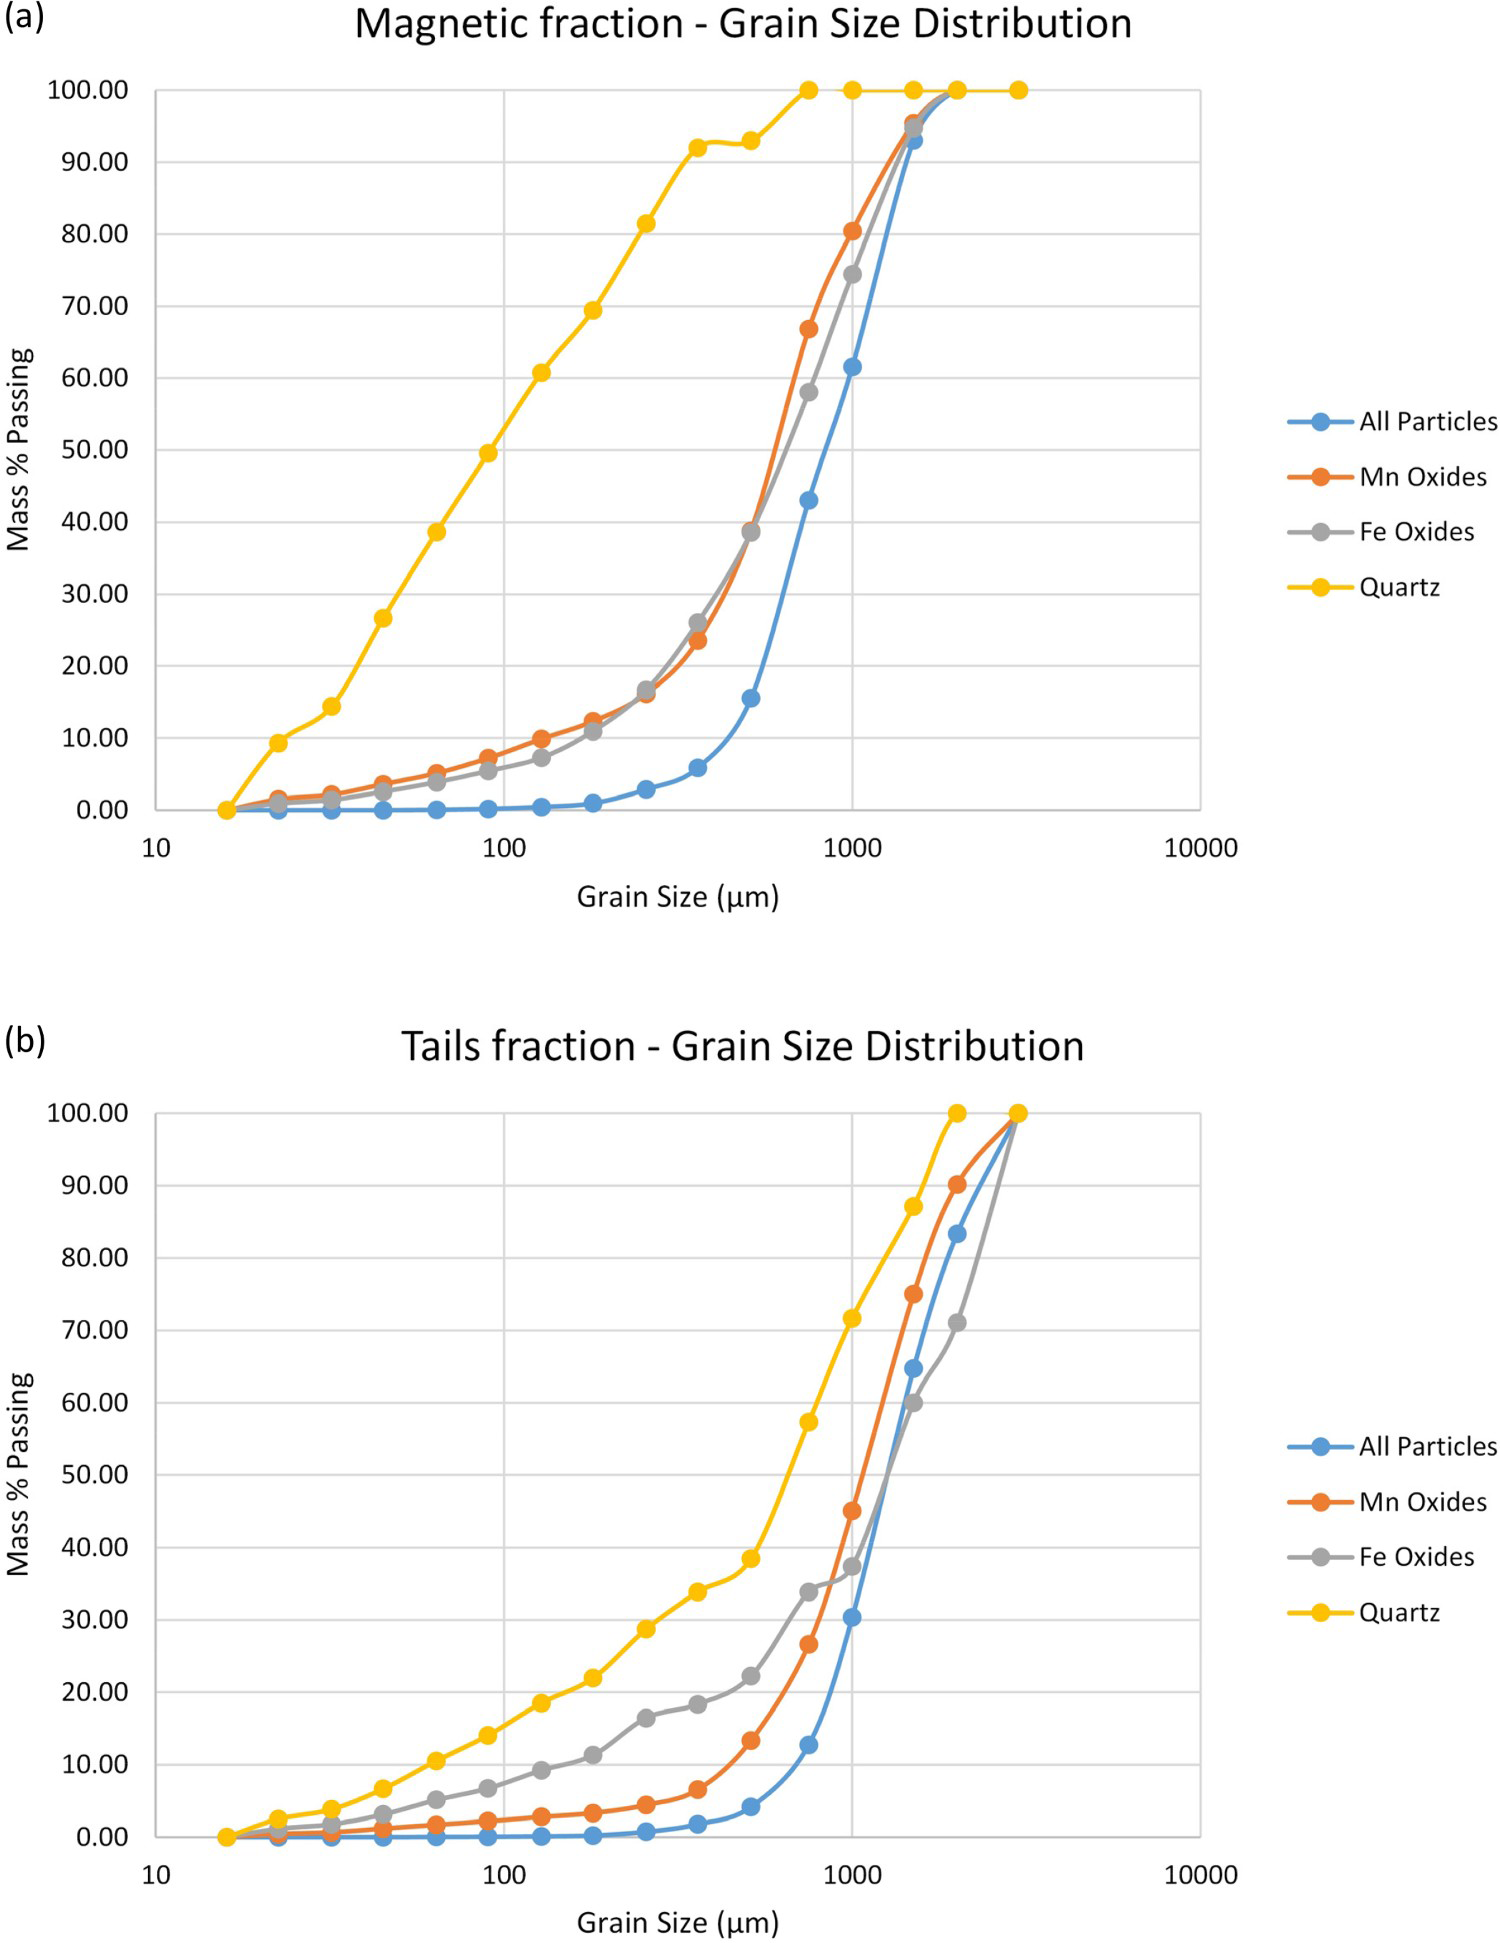
Both ‘Mn oxide’ and ‘Fe oxide’ grains were relatively skewed towards coarser sizes in the tails fraction compared to the magnetic concentrate fraction (Figure 4), which implies that these particles were too large to be attracted to the magnetic fraction under the parameters (e.g. particle size, magnetic field, roll speed, etc.) in which the tests were conducted. There was a higher relative proportion of ultrafine (−0.256 mm) ‘Mn oxide’ grains in the magnetic fraction compared to the tails fraction, but the relative proportion of ultrafine ‘Fe oxide’ grains was similar in both fractions. The size distribution of quartz grains was strongly skewed towards finer sizes in the magnetic fraction compared to the tails fraction, e.g. the relative proportion of ultrafine quartz grains in the magnetic fraction was ∼83% compared to ∼29% in the tails fraction. This is most probably accounted for by the prevalence of fine associations of quartz and hematite and the increased tendency for particles with these associations to report to the magnetic fraction during IRMS, probably due in part to entrainment (see Figure 3(c)). The tails fraction however, had a much higher relative proportion of coarse (+1 mm) quartz grains (28%), compared to the magnetic concentrate (zero).
The size distribution of ‘Mn oxide’ and ‘Fe oxide’ grains was very similar for the magnetic concentrate (Figure 4(a)). In the tails fraction, however, there were relatively more ‘Fe oxide’ grains than ‘Mn oxide’ grains sized +1 mm, but relatively more ‘Mn oxide’ grains sized −1 + 0.5 mm (Figure 4(b)). This suggests that some of the larger Fe oxide particles were relatively more likely not to be captured by the magnetic field utilised for the test. Quartz grains clearly tended to be finer than ‘Mn oxide’ and ‘Fe oxide’ grains, especially for the magnetic fraction (Figure 4(a)).
Discussion
Separation of Mn oxides and Fe oxides at a top size of 4.7 mm (test #1) was not satisfactory since the magnetic flux intensity of 6000 gauss (obtained at a higher gap – between the rotor and the pole – to treat the larger particles) was not sufficient to separate paramagnetic Fe-bearing mineral particles. Increasing this gap means that less strongly paramagnetic particles are less likely to be removed to the magnetic fraction (Tripathy et al. 2014). With decreasing particle size and increasing magnetic field, more mass reported to the magnetic fraction and also to the middling fraction, but less to the tails fraction, with the wt% ratio of the magnetic:middling fractions increasing from 0.07 to 0.30 from test #1 to test #2.
The IRMS results (Mn grade, recovery, mass recovery and Mn:Fe ratio) showed that this process had potential merit at a −2.3 + 0.6 mm particle top size (IRMS test #2). However, qualitative optical microscopy and QEMSCAN™ analysis showed the presence of Mn oxide particles in the magnetic fraction, as well as quartz-rich particles with subordinate Mn oxides or Fe oxides (Figure 5(a)). Several hematite-rich (± quartz ± goethite) particles, both coarser and finer particles, were present in the tails fraction of IRMS test #2, as well as some weakly hematite-mineralised quartz grains (Figure 5(b)). Fe oxides were also present in the tails associated with Mn oxides in texturally complex particles. Clearly the proportion of Mn oxides in the magnetic fraction (> 24 wt% measured by QEMSCAN™) and the proportion of Fe oxides in the tails fraction (> 21 wt% measured by QEMSCAN™) cannot be explained by intergrowths of Mn oxides and Fe oxides alone (e.g. Tables 10 and 12).
False colour image of selected larger particles (sorted by area) from the QEMSCAN™ particle map for (a) the magnetic fraction and (b) the tails fraction for IRMS test #2.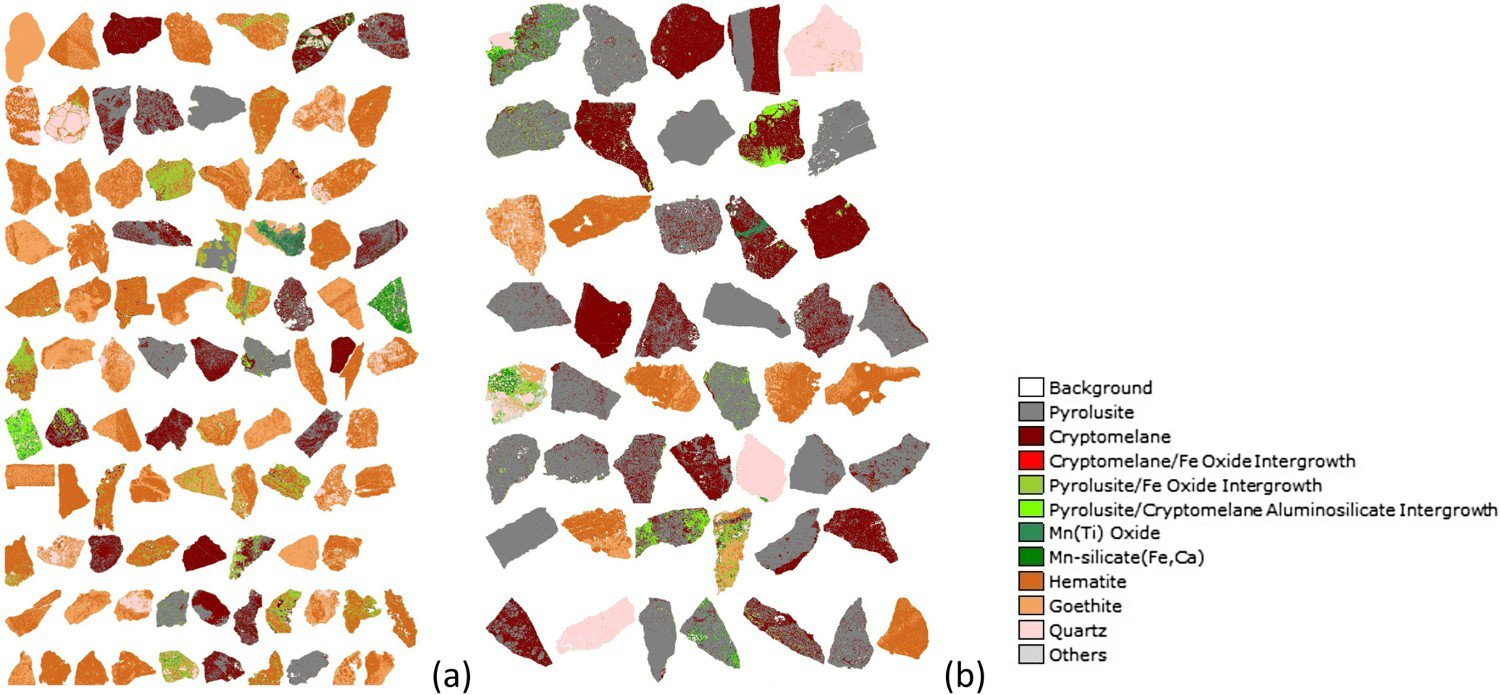
The results obtained during IRMS test work are a factor of the differences in the magnetic susceptibility of the constituent minerals/ particles, the moisture content, the magnetic field intensity (a function of the gap between the rotor and the pole) and the applied current, the splitter position, the feed rate, the particle size distribution (e.g. presence or absence of ultrafines), the density distribution and the roll diameter and speed (Naik, 2002; Singh et al. 2013; Tripathy et al. 2014).
Some previous studies have found that the QEMSCAN™ technique may not satisfactorily identify and quantify fine microporosity in sized iron ore fine samples, when compared to that determined by image analysis of optical photomicrographs (Donskoi et al. 2013). Therefore, it is difficult to definitively evaluate the influence of mineral and particle porosity on magnetic separation performance using the SEM-based technique alone. However, qualitative optical microscopy on lump and fines ore head samples, as well as on IRMS products, showed that particles had highly variable levels of macro- and micro-porosity. Of all minerals, quartz exhibited by far the lowest average internal microporosity. Based upon indicative apparent and envelope density testing of some lump ore particles (Table 5) it is therefore considered likely that particle microporosity would also have influenced the response to IRMS of individual particles. For example, Mn oxide-rich particles with relatively high microporosity and lower apparent density would be relatively more susceptible to being entrained into the flow of particles to the magnetic rotors, even in tests using relatively lower magnetic field strengths, due to lower centrifugal forces. This is because of the potential affect that microporosity could have on the balance between the influence of the magnetic field intensity utilised (‘magnetic force’) and the centrifugal and centripetal forces imparted by the rotor (cf. Tripathy et al. 2014). Particle shape factor may also have played a role here, as modelled by Singh et al. (2013). To contrast this, Fe oxide-rich particles with relatively lower microporosity will be subjected to relatively higher centrifugal forces and may not be captured by the ‘magnetic force’ in tests using higher rotor speeds and feed rates.
The fact that much more mass consistently reported to the secondary magnetic or middling fraction, than to the primary magnetic fraction, even for test #3 using the finest particle size range, however, indicates that the test parameters require further optimisation for the first magnetic coil to better attract Fe oxide-rich particles. Parameters such as the roll speed, the feed rate and the pole gap/ magnetic field intensity need to be optimised to potentially improve the separation of Mn oxides and Fe oxides during the IRMS process. These would aim to further improve the Mn:Fe ratio by minimising the number of hematite-bearing particles reporting to the tails fraction and Mn oxide rich particles reporting to the magnetic fraction. For example, any relatively larger Fe-oxides particles currently reporting to the tails fraction might be captured by the magnetic field if the feed rate of the sample was reduced or by using a multi-pass approach.
The improved ability of the IRMS process to attract particles to the magnetic concentrate at finer particle sizes was markedly evident for the −1 + 0.075 mm size fraction, where <3% of the total size fraction mass reported to the tails at the first pass. However, the separation of Mn and Fe was not satisfactory in the 1st pass, and to a lesser extent, the 2nd pass magnetic concentrate. The higher magnetic field used for this IRMS test likely means that manganese minerals are increasingly susceptible to reporting to the magnetic concentrate (Singh et al. 2020). Even though paramagnetic braunite is only likely present in trace quantities, the propensity for cryptomelane particles with relict braunite inclusions (Figure 1(f)) to report to the magnetic fraction (Figure 2(c)) needs also to be considered, especially if the braunite contains structural Fe (Table 3) (cf. Grieco et al. 2014). The relatively high proportion of Mn-oxides reporting to the magnetic concentrate compared to the tail, also suggests that some may have been entrained. In this case, the amount of Mn reporting to the magnetic concentrate could be reduced by reducing the feed rate of the sample and/or by using a multi-pass approach. As noted, there was a further improvement in the Mn grade and Mn:Fe ratio using a two-pass approach, from ∼43% Mn in the first-pass middling fraction to ∼46% Mn in the second-pass middling fraction and in the Mn:Fe ratio from 3.3 to 4.3 (Table 8).
Although the silica content of the magnetic fraction, and particularly the secondary magnetic (middling) fraction, remained high across all 3 IRMS sighter tests, these results strongly suggest the potential application of the IRMS technique for the separation of iron and silica from manganese minerals. The preferential disintegration characteristics of iron-bearing minerals indicates the potential application of high-pressure grinding rolls (HPGR) to selectively crush and segregate the Fe bearing minerals into ultrafines and then reject them by screening or desliming ahead of magnetic separation (cf. Tripathy et al. 2017). Thus, the HPGR could be used as pre-concentrator and further magnetic separation could further improve the Mn grade and Mn/Fe content.
Trialling different liberation sizes using HPGR and magnetic separation at varied magnetic flux intensities, while optimising the number of passes to achieve better separation is warranted. The Rare Earth Roll Magnetic Separator (RERMS) could also be tested with coarser particle sizes (1–8 mm) at higher magnetic intensities and the results compared with IRMS (cf. Tripathy et al. 2017; Singh et al. 2020; Bhoja et al. 2021). The advantage of RERMS over IRMS would be that there is no limitation of the air gap, as the magnetic flux intensity is open gradient, whereas its limitation is its relatively lesser ability to separate Fe and Mn phases with only slightly different magnetic susceptibilities (Singh et al. 2020). The application of an air pulsated jig (gravity separation) could also be tested at coarser particle sizes (1–8 mm) to evaluate the possibility of quartz separation.
The test results reveal that size reduction to achieve liberation, and dry screening to segregate feed into different sized fractions is a primary requirement for effective separation in IRMS. In the test work, laboratory test sieves are used. However, dry screening at finer size separations on an industrial scale has long been a challenge for the mining industry. Flip-Flow screens, which use novel aperture polyurethane panels, have been used successfully in dry classification of coal, minerals, fly ash, compost and wood chips (Mathewson et al. 2006). Fine particle screening requires high speed, low amplitude technology using specially designed polyurethane panels to eliminate screen blinding issues. Dry screening using this technology supplied by Derrick Corporation is used in phosphate processing plants to dry screen at 1.7 and 0.5 mm (Case study216: Dry Screening-4/15, Derrick Corporation 2015) and also for screening magnetite ore at 1.7 mm in Mauritania (Mining Review Africa 2022). A similar screening technology will be needed for dry screening of crushed manganese ore to screen out the finer fraction and feed the coarser particles to plant scale IRMS.
Conclusions
The ferromanganese fine ore sample was predominantly comprised of hematite, cryptomelane, pyrolusite, quartz, goethite and braunite present in two main mineral associations: (1) hematite and quartz ± goethite ± pyrolusite and (2) cryptomelane-pyrolusite ± braunite ± hematite ± goethite ± quartz ± ferruginous clay.
The results of sighter test work using pilot-scale IRMS indicated the possibility of selective separation of hematite and goethite from Mn oxides to upgrade the Mn/Fe ratio. The enrichment of the Fe content in the ultrafines during crushing and dry screening prior to magnetic separation indicated the preferential disintegration characteristics of Fe bearing minerals. Three IRMS tests at top sizes of 4.7, 2.3 and 1 mm respectively revealed that better separation of Fe from Mn was possible at the 2.3 and 1 mm top sizes. This revealed the better liberation and separation characteristics of the Mn oxides and Fe oxides in the sample at the finer sizes.
The sighter test results on the −2.3 + 0.6 mm size fraction produced an enrichment of the Mn content to 41.5 wt% at 69.4% mass recovery and 84.2% Mn recovery. The sighter test on the −1 + 0.075 mm size fraction showed an enrichment of the Mn content in the ‘middling’ fraction to 42.9 wt% at a 46.5% mass recovery and a 58.4% Mn recovery. Using the −1 mm middling fraction for a second IRMS pass upgraded the Mn content to 46.0 wt% at a 33.2% mass recovery and a 45.0% Mn recovery.
Dry beneficiation using the IRMS technique was moderately successful in increasing the Mn grade, and Mn:Fe ratio, but did not appreciably decrease the silica content. The various characterisation techniques employed revealed the ore comprised a complex association (intergrowth in many instances) of Mn and Fe oxides with silica, which means that upgrades to the Mn:Fe ratio, and to a greater extent, reduction in the silica content, will be constrained using the IRMS technique without accompanying particle size reduction. The effects of mineral and particle microporosity on particle specific gravity and magnetic susceptibility may also have resulted in a significant partition of liberated or near-liberated Mn oxides reporting to the magnetic concentrate and some Fe oxides reporting to the non-magnetic tails.
These results could be improved by changing conditions such as the feed rate, roll speed and particle size range to increase the separation of Fe and SiO2 and optimise the balance between magnetic and centrifugal forces at the IRMS rotors. The study reveals the potential application of the dry beneficiation technique using IRMS for manganese ores. Commercially available, innovative, fine dry screening technologies could be used for size classification of crushed ore to feed the industrial scale IRMS.
Footnotes
Acknowledgments
The authors wish to thank Lionel Fonteneau for XRD analysis, Tirsha Raynlyn for pycnometry and Bureau Veritas for XRF analysis. David Roberts, formerly of Consolidated Minerals, provided the samples and James Manuel reviewed an earlier draft of the manuscript. The authors are also grateful to CSIRO Mineral Resources for funding the work. This publication is dedicated to our colleague Venkat Nunna who passed away in 2022 and his contribution to the development of beneficiation studies at CSIRO Mineral Resources.
Disclosure statement
No potential conflict of interest was reported by the author(s).