
Abstract
The photogrammetric approach was proposed in this study to evaluate torsional behaviour of glulam timber beams during the torsion test. The main objectives were to investigate the applicability of the photogrammetric approach and to monitor more details of angles of twist of glulam timber beams. Experiments were conducted and the twists on long and short sides of the cross section were measured using the photogrammetric approach and inclinometer sensors, which were used to validate the accuracy. The test results showed that the optical system allowed monitoring the rotations of the samples at different locations which would not be possible to obtain using the traditional techniques. The results also showed that there is a non-linearity from the measurement of the shear displacements along the long side of the cross-section. However, the average rotation shows clear agreements with the inclinometer readings.
Keywords
Introduction
The shear modulus, G, is a fundamental mechanical property of wood that is used in the design of timber and engineered wood products. The timber material has relatively low shear stiffness. The shear modulus is critical when designing for lateral-torsional stability of joists (EN 1995-1-1, 2004). It is also significant in designing serviceability of wood-joist floors (Foschi 1982), and is an important input for setting up analytical and finite element models (Chui 2002).
According to European Committee for Standardization ‘CEN’ (EN 408:2003 2003) and American Standard of Testing Materials ‘ASTM’ (ASTM-D198-94 1994), bending tests are the most common approach to evaluate the shear modulus of timber and glulam materials. However, this method has been found difficult to evaluate the shear stiffness of structural-size specimens. The bending test creates a combination flexural and shear stresses leading to difficulties in obtaining the true value of shear stiffness (Vafai and Pincus 1973; Riyanto and Gupta 1998).
The torsion test is recommended by the most recently updated British Standard, BS EN 408:2012, as a standard test method to characterize properties of structural-size timber-composite materials. One objective of the torsion test is the determination of shear modulus of the material. This test is the only method that imposes a state of pure shear stress on a specimen, and it has been proven to have more advantages for measuring the shear modulus value of timber and glulam beams. Recently, the torsion test has been adopted more frequently by researchers to evaluate the shear modulus of structural-size timber and glulam beams (Gupta et al. 2002; Gupta and Siller 2005; Hindman et al. 2005; Khokhar et al. 2010; Zhang et al. 2011; Mohamed et al. 2015; Mohamed, A., et al. 2021; Mohamed, A., et al. 2021; Gharavi et al. 2017; Gharavi et al. 2018; Gharavi, N. and H. Zhang, 2018), as well as laminated structural glass beams (Uheida, K., et al. 2021; Zhang et al. 2021).
In the torsion test, the exact measurement of the relative angle of twist over a gauge length is essential to determine the shear strain and hence enable the calculation of shear modulus. The rotations measured by the torsion tester machine may include small slippage between the board and the clamps of the torsion testing machine. Therefore, angle measurement devices are used to measure the rotations of the torsion specimens. Traditionally, the inclinometer is one of the most used instruments for measuring the rotation of the glulam samples during the torsion test. However, the size of the device and the nature of the surface contact measuring have prevented inclinometers to be used in measuring more details of the shear deformation of glulam beams. To overcome this difficulty the photogrammetric approach was proposed in this research to measure the surface rotations of the samples.
This paper presents the experimental study performed to investigate the feasibility of the developed non-contact stereo system on the torsion test. Experimental test series were conducted on five timber glulam beams subjected to torsional loading. The main purpose of this study was to validate the developed optical system and then to employ it for proper use of the torsion test. Another objective of this study was to investigate the difference between the rotations of the long and short sides of the cross-section of the torsion specimens. The optical method is found to be a promising technique to evaluate the torsional behaviour of the glulam beam samples.
Experimental validation of the approach
Materials and methods
Materials and torsion testing machine and equipment
The material used in this study were Glulam timber beams with nominal cross-sectional dimensions of 95 × 45 mm. The timber glulam beams are graded to GL24 class strength. Each beam was cut into 2.0 m length to produce test specimens for the torsion test method. Figure 1 shows an image of these glulam beams.
Image of the glulam beam samples.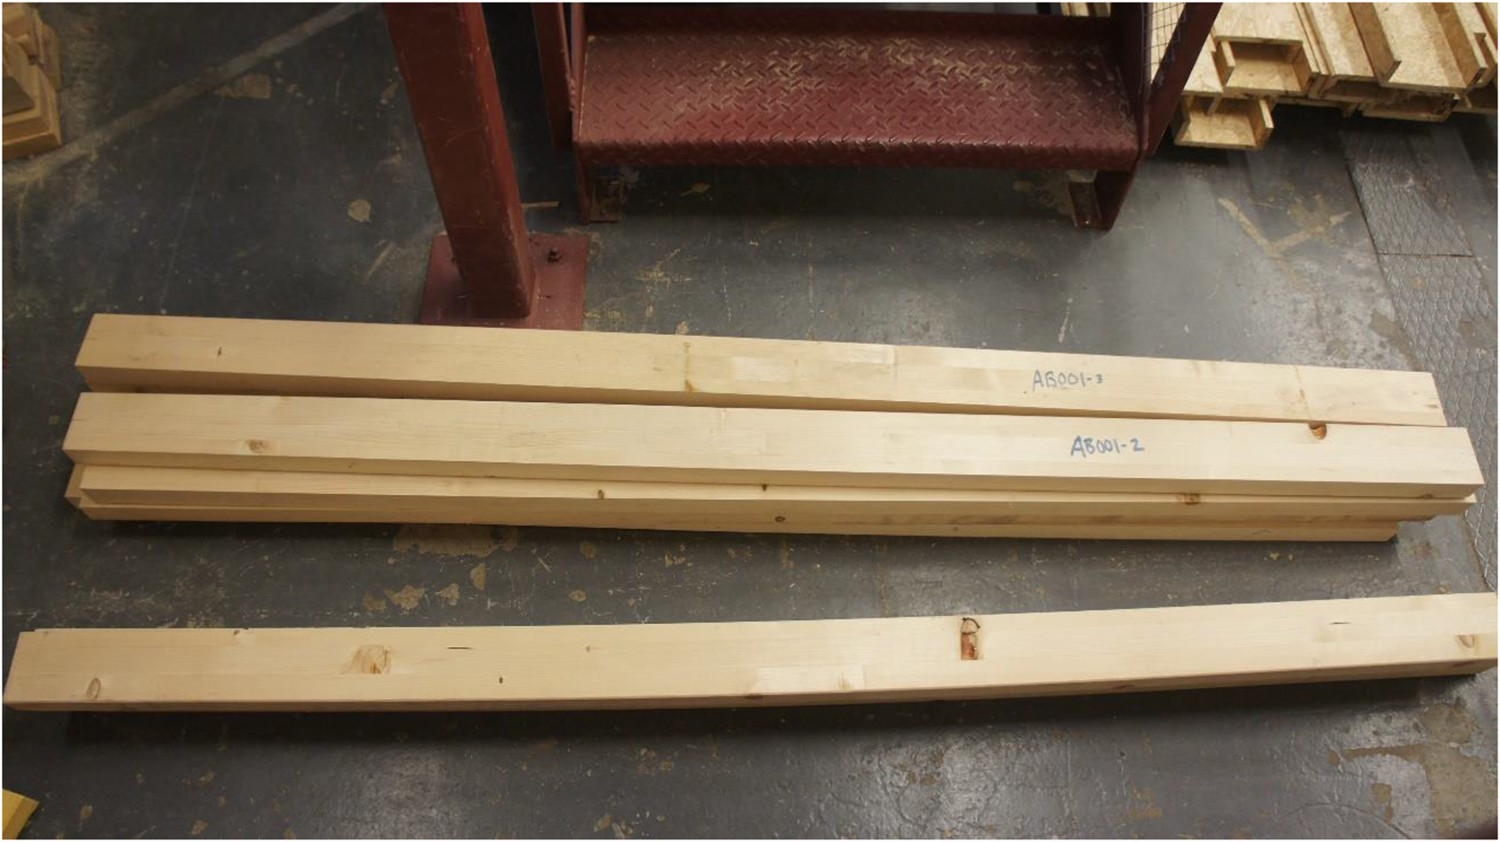
Before testing and to investigate more details of the rotation of their cross-sections, the glulam beams were prepared for stereo camera measurements by painting 5 elliptical target points on the surface of the testing samples and these targets were marked 15 mm centre to centre to give traceable marks on the sample surfaces. Figure 2 shows an image of a sample after being prepared with photogrammetric targets. The rectangular cross-section beams were stored in a conditioning room with a constant temperature of about 20 degrees and relative humidity of about 65% to ensure uniform and constant moisture content (MC) of about 12%.
Torsion specimens after applying targets to their surfaces.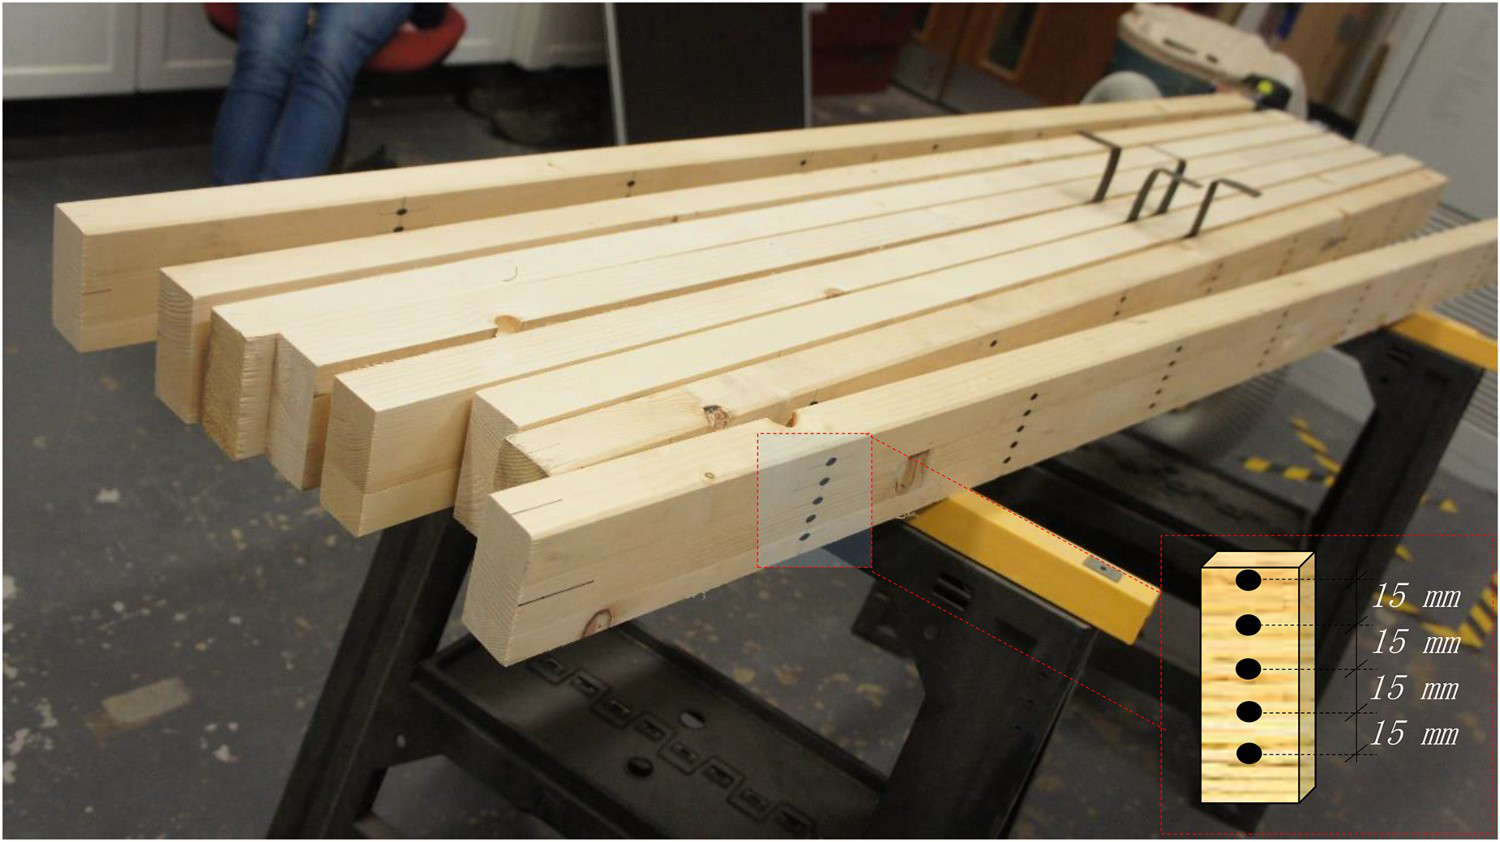
A Tinius-Olsen (Tinius Olsen, Pennsylvania U.S.A.) torsion testing machine capable of applying up to 1 kilo newton-metre (kN-m) torque was used to test the specimens (Figure 3). shows a photograph of the testing machine. The torsional driving machine is a bench-based unit designed to perform torsion tests on specimens to find their modulus of rigidity. As shown in Figure 3 the torsional driving machine consists of two units, a driving unit with a rotating loading chuck at one end of the machine and a movable unit with a stationary weighing chuck at the other end. The driving unit is used to apply torque which can be measured using a torque sensor mounted on the movable unit. The rotation of the loading chuck during testing can be read from the angular deflection scale taped on this chuck. The movable unit is adjustable and can change its position to accommodate specimens of varying lengths. The torsional driving machine is a computer-controlled torsion testing machine, and it is supplied with Test Navigator software which can be used to measure torque and rotation with a measurement accuracy of ±0.5% of the applied torque and ±0.05° of the rotation.
Torsion testing machine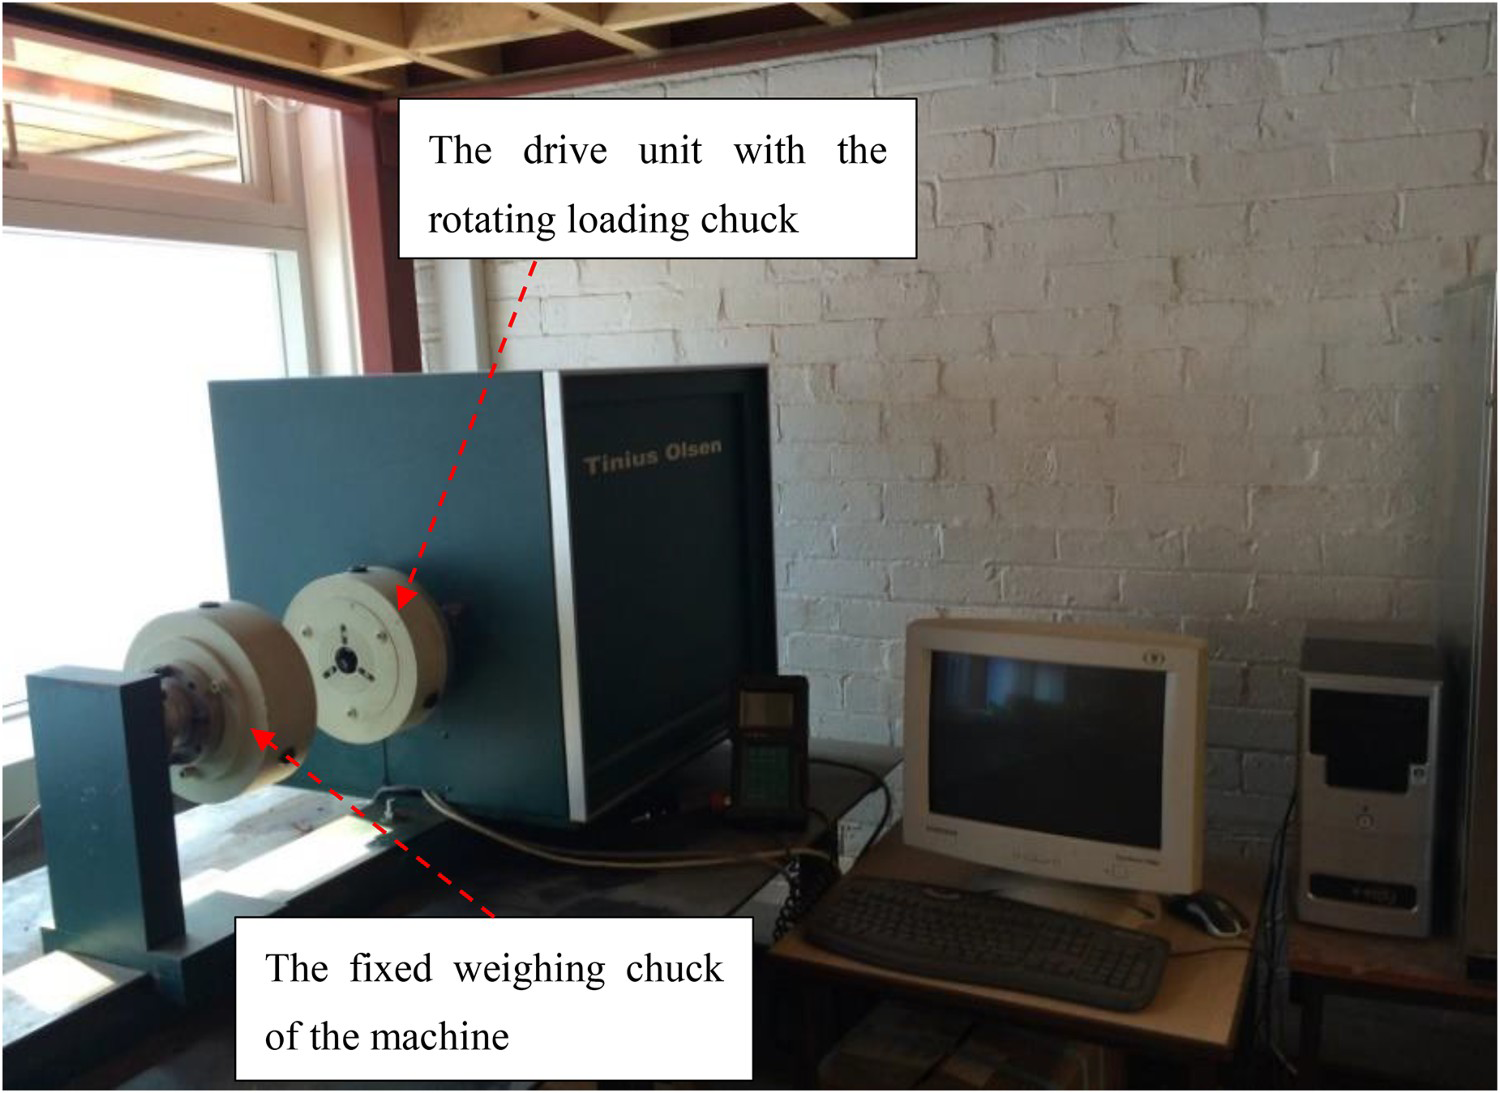
The chucks of the torsion testing machine were limited to testing small rectangular cross section specimens. To overcome this limitation and to allow testing structural size glulam beams, a pair of customized testing clamps were designed and fabricated in this study. The steel clamps have been specially fabricated to allow easy installation of rectangular specimens with different lengths and to hold specimen ends with a large contact area to avoid excessive embedding. They are also used to grip the specimen without any risk of slippage or damage to the section of the specimen during the torsion test. These clamps also allow the specimen to move longitudinally when twisting by the applied torque. Figure 4 shows images of both clamps at the fixed and rotating end of the tested specimen.
Clamps of the torsion tester at the fixed end (left) and at the rotating end (right).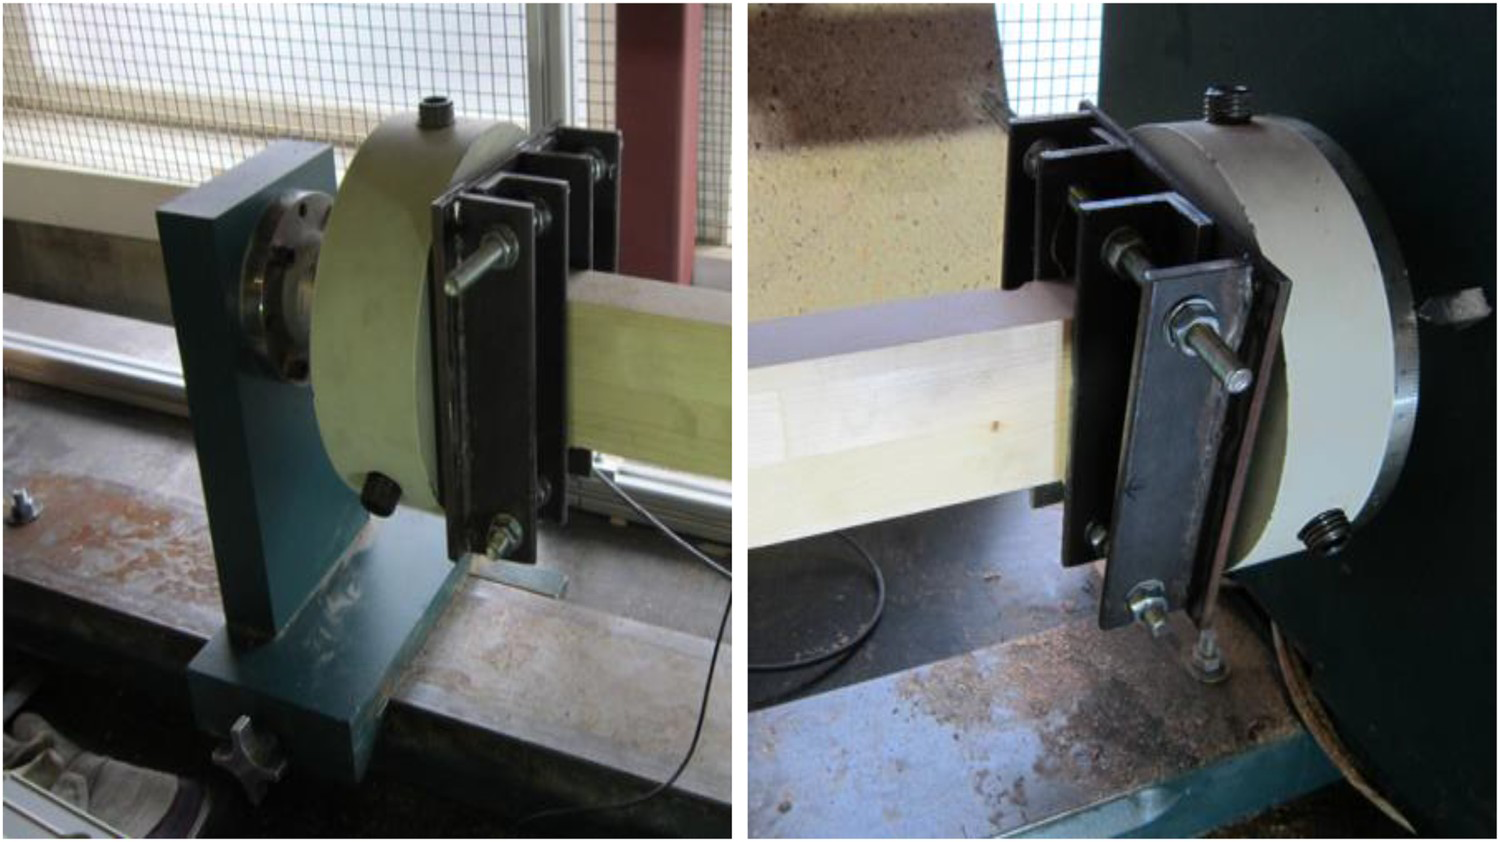
Angular measurement sensors
When using the torsion test, the angular deformation of the specimen should be measured in the central part to avoid the effects of load concentrations at the end. Measurement of torsion angles using the testing machine is not feasible. Therefore, two different angular measurement instruments, inclinometers and a stereo camera system were used in this study. The inclinometer is a contact device that can only measure the angle of twist at the location where the device is installed. Inclinometers (Model IS-2-30, Level Developments, UK), as shown in Figure 5, were used to measure the angles of twist at the attached points. The IS-2-30 is a dual axis sensor capable of measuring angles with a measurement range of ±30° in two directions with an accuracy of ±0.05°. The inclinometer can measure the relative twist angle in both X and Y directions and can be used to acquire the angular position using the RS232 serial port. Because of its small size and light weight, this sensor is suitable to work in a variety of applications.
Dual-axis inclinometer.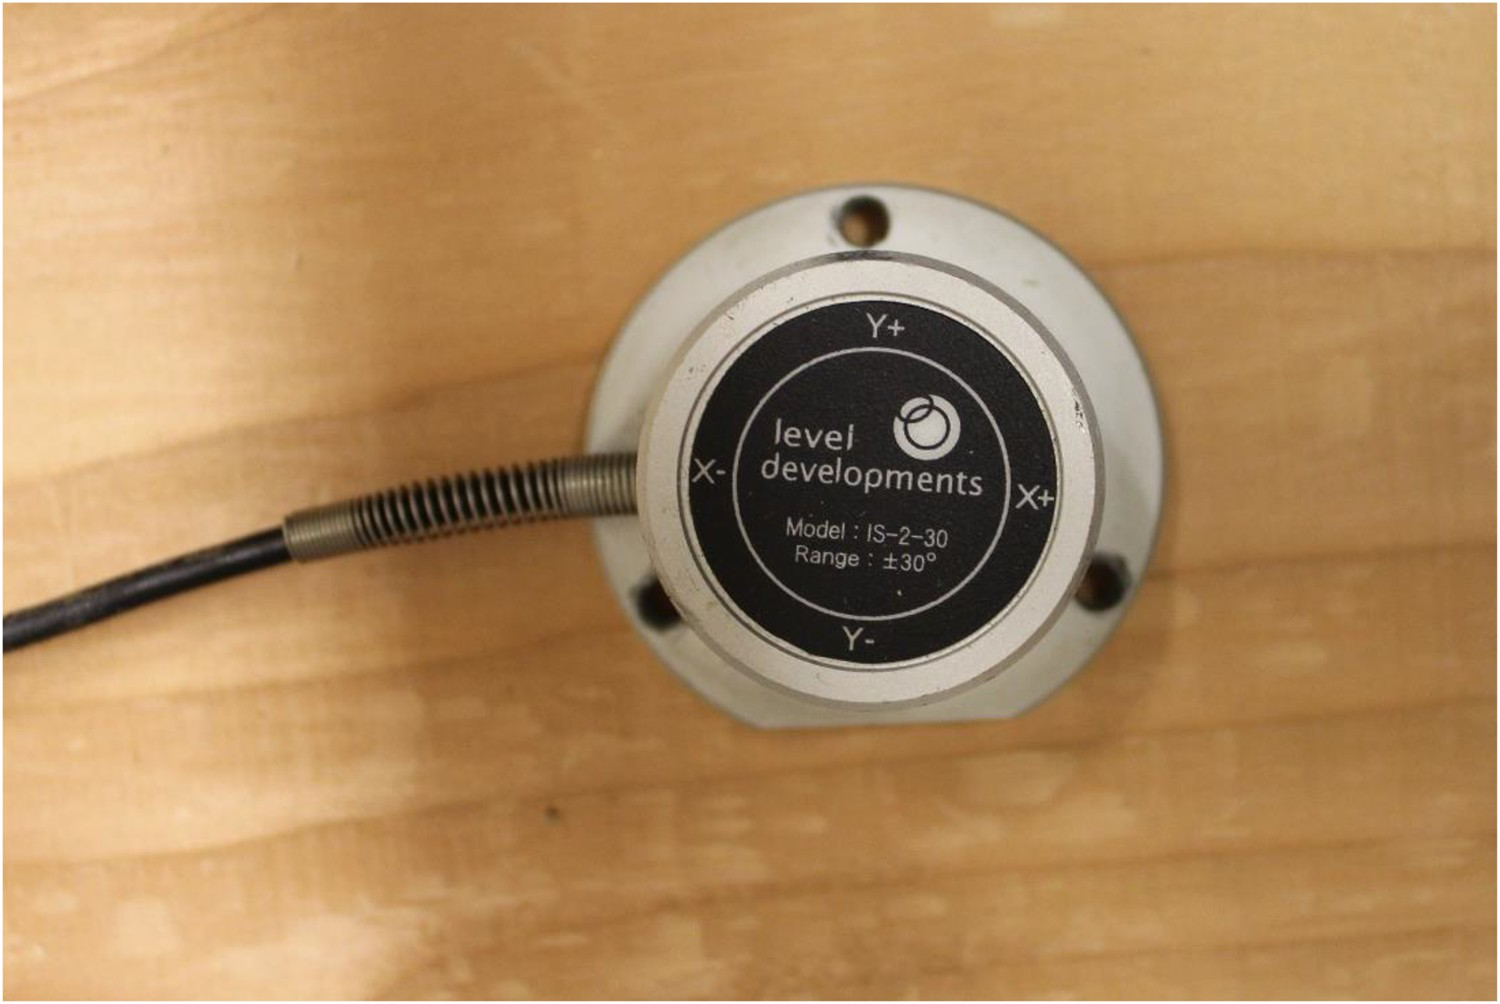
Because it was difficult to install the clamps vertically since the high torsion force causes a slippage between the test clamp and tester machine, wooden wedges as shown in Figure 6. were fabricated to attach inclinometers horizontally onto the specimen. The clamps are made of wood with the angle between the top surface of the sample and horizontal planes of about 30°. These configurations allow inclinometers to be in a horizontal plane initially before performing the tests.
Dual-axis inclinometer attached to a wooden mount.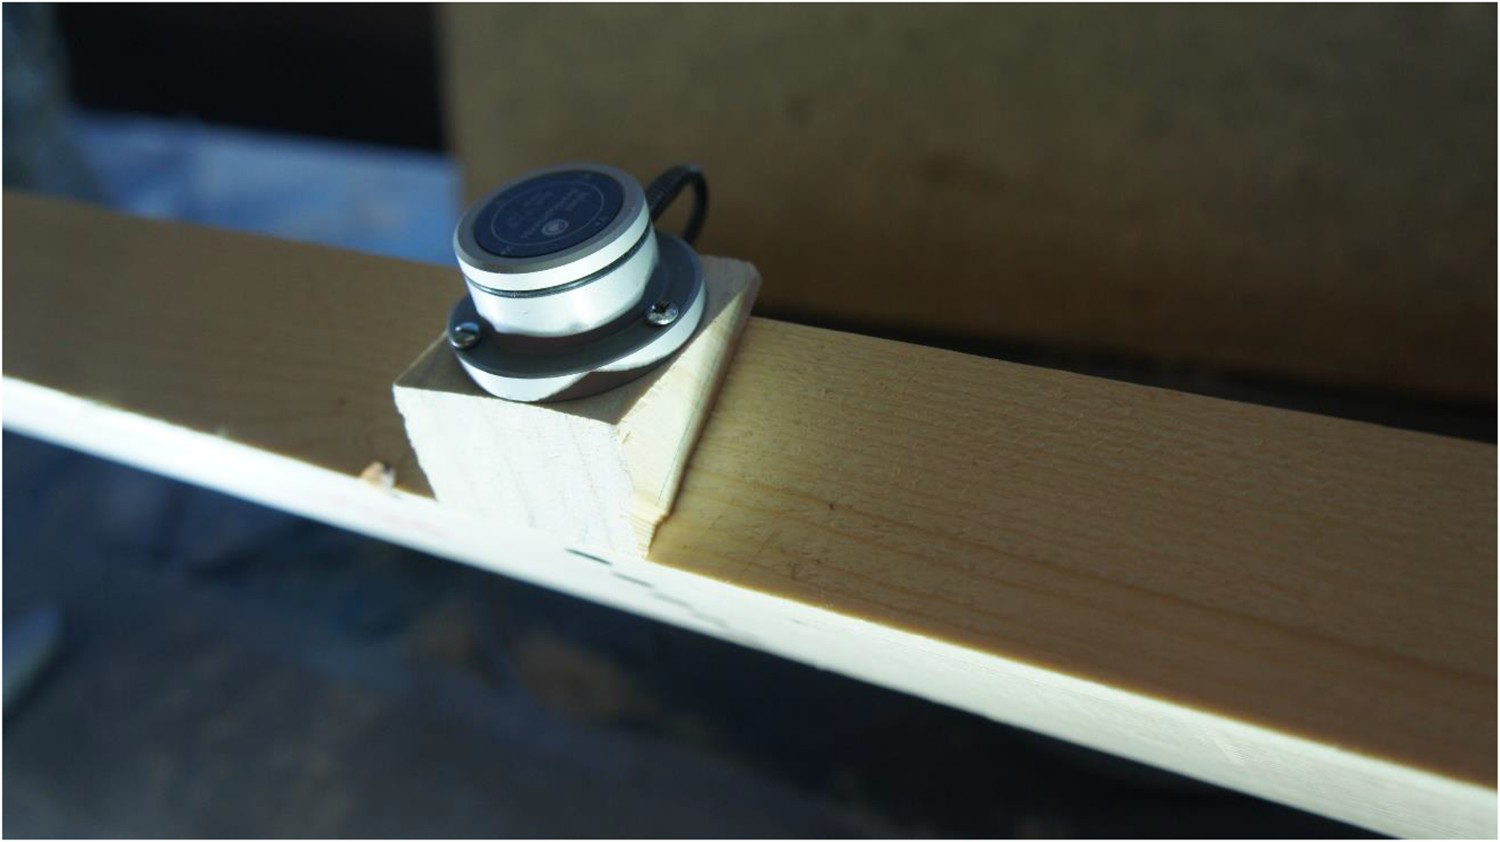
To collect data during testing from inclinometers and to record and synchronize their outputs with the camera system, a data log interface was developed by the author of this study, and it was implemented based on Visual Basic programming language. This package allows inclinometers to capture readings simultaneously and all data received from these sensors are then transferred directly to a desktop computer, depending on the time interval specified by the user of the software. Figure 7 shows an image shot of the graphical user interface of this package.
Data log system for inclinometers.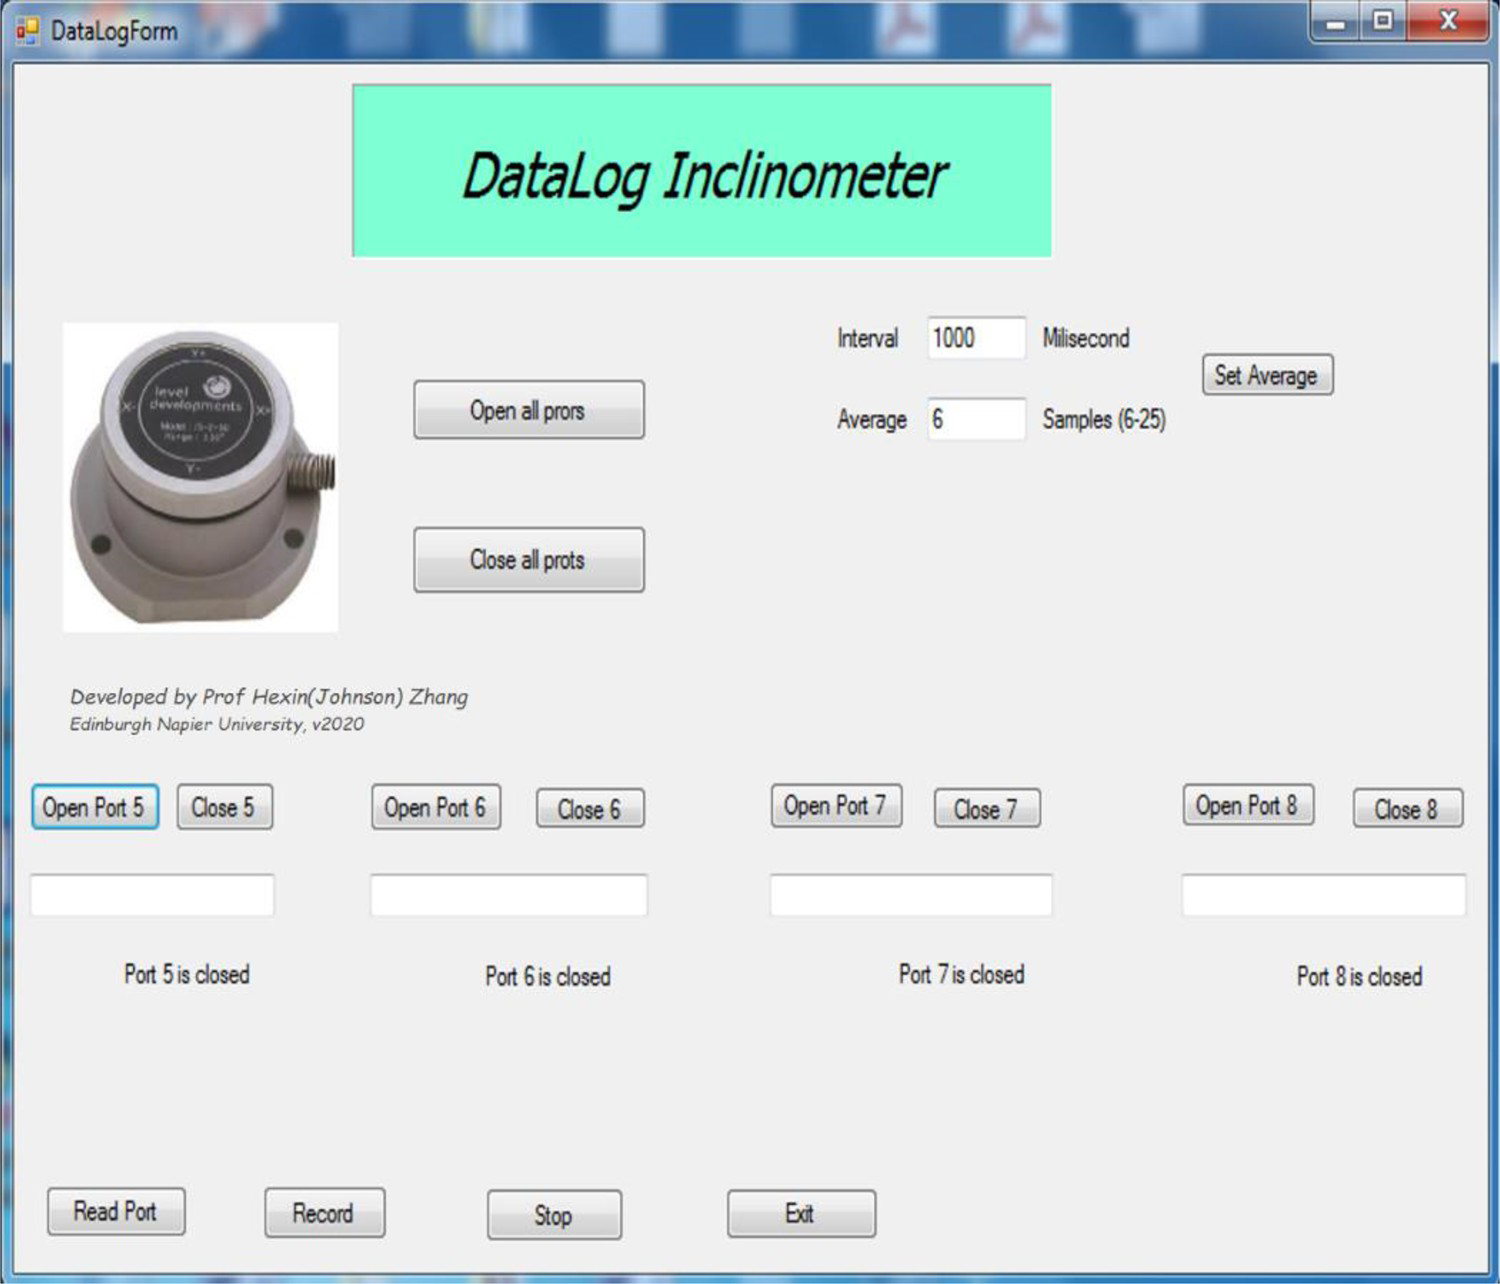
In addition to the inclinometer sensors, a non-contact stereo camera system was also used to measure the angle of twist of targets painted on the samples. Figure 8 shows an image of stereo camera system. The stereo camera system in this study consists of two Basler Pilot piA2400-17gm cameras that can acquire images at a resolution of 5 million pixels. The two cameras were equipped with 25 mm Computar (M2518-MPW 2/3″ F1.8) Megapixel lenses and were mounted on tripods and placed in front of the torsion samples. The Basler cameras were connected through Ethernet cables to a desktop computer where the image processing software, HALCON, is installed.
The stereo camera system.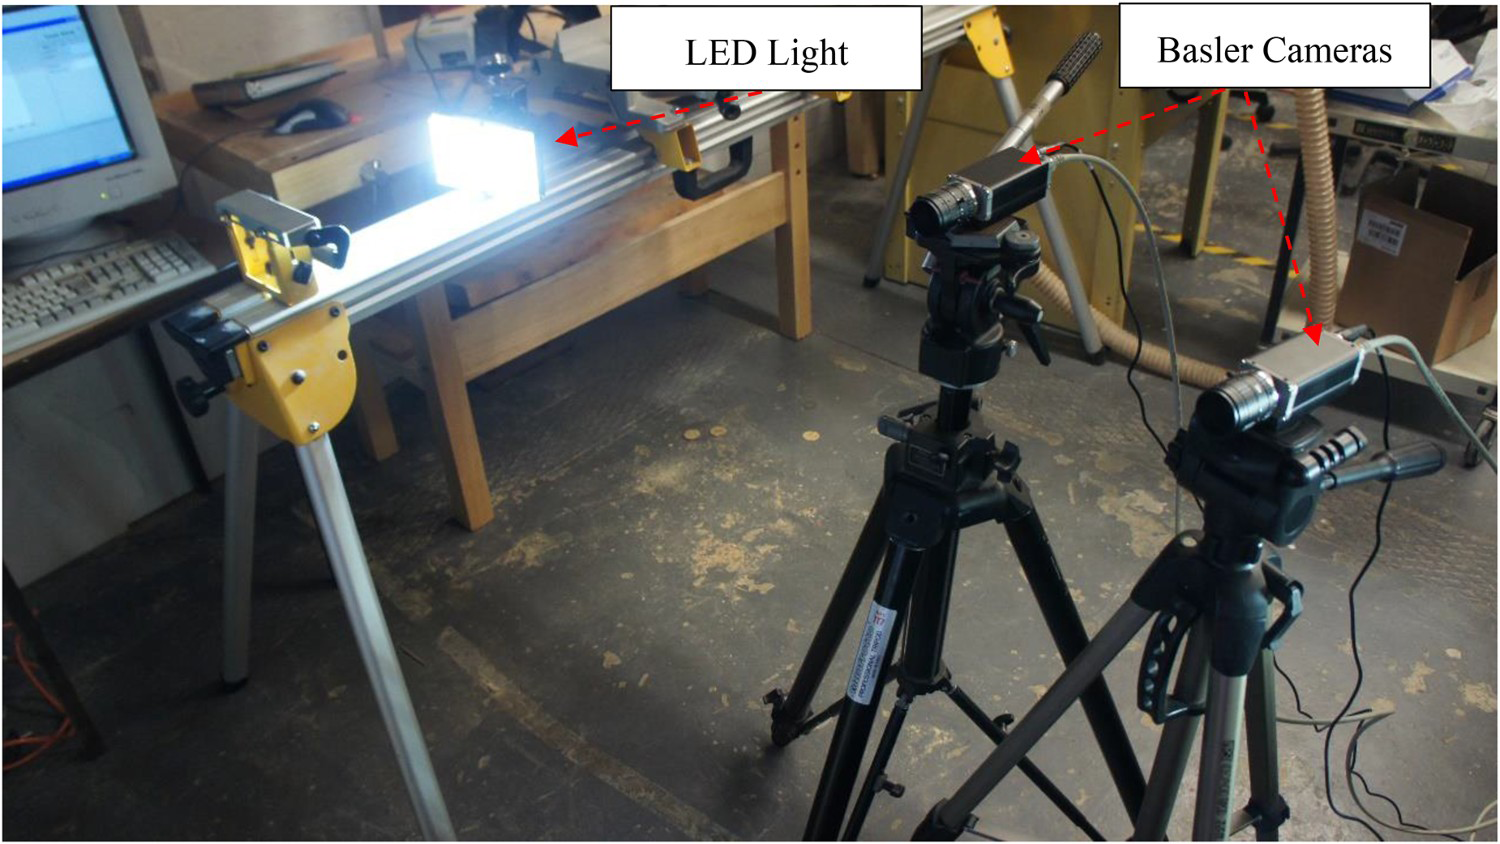
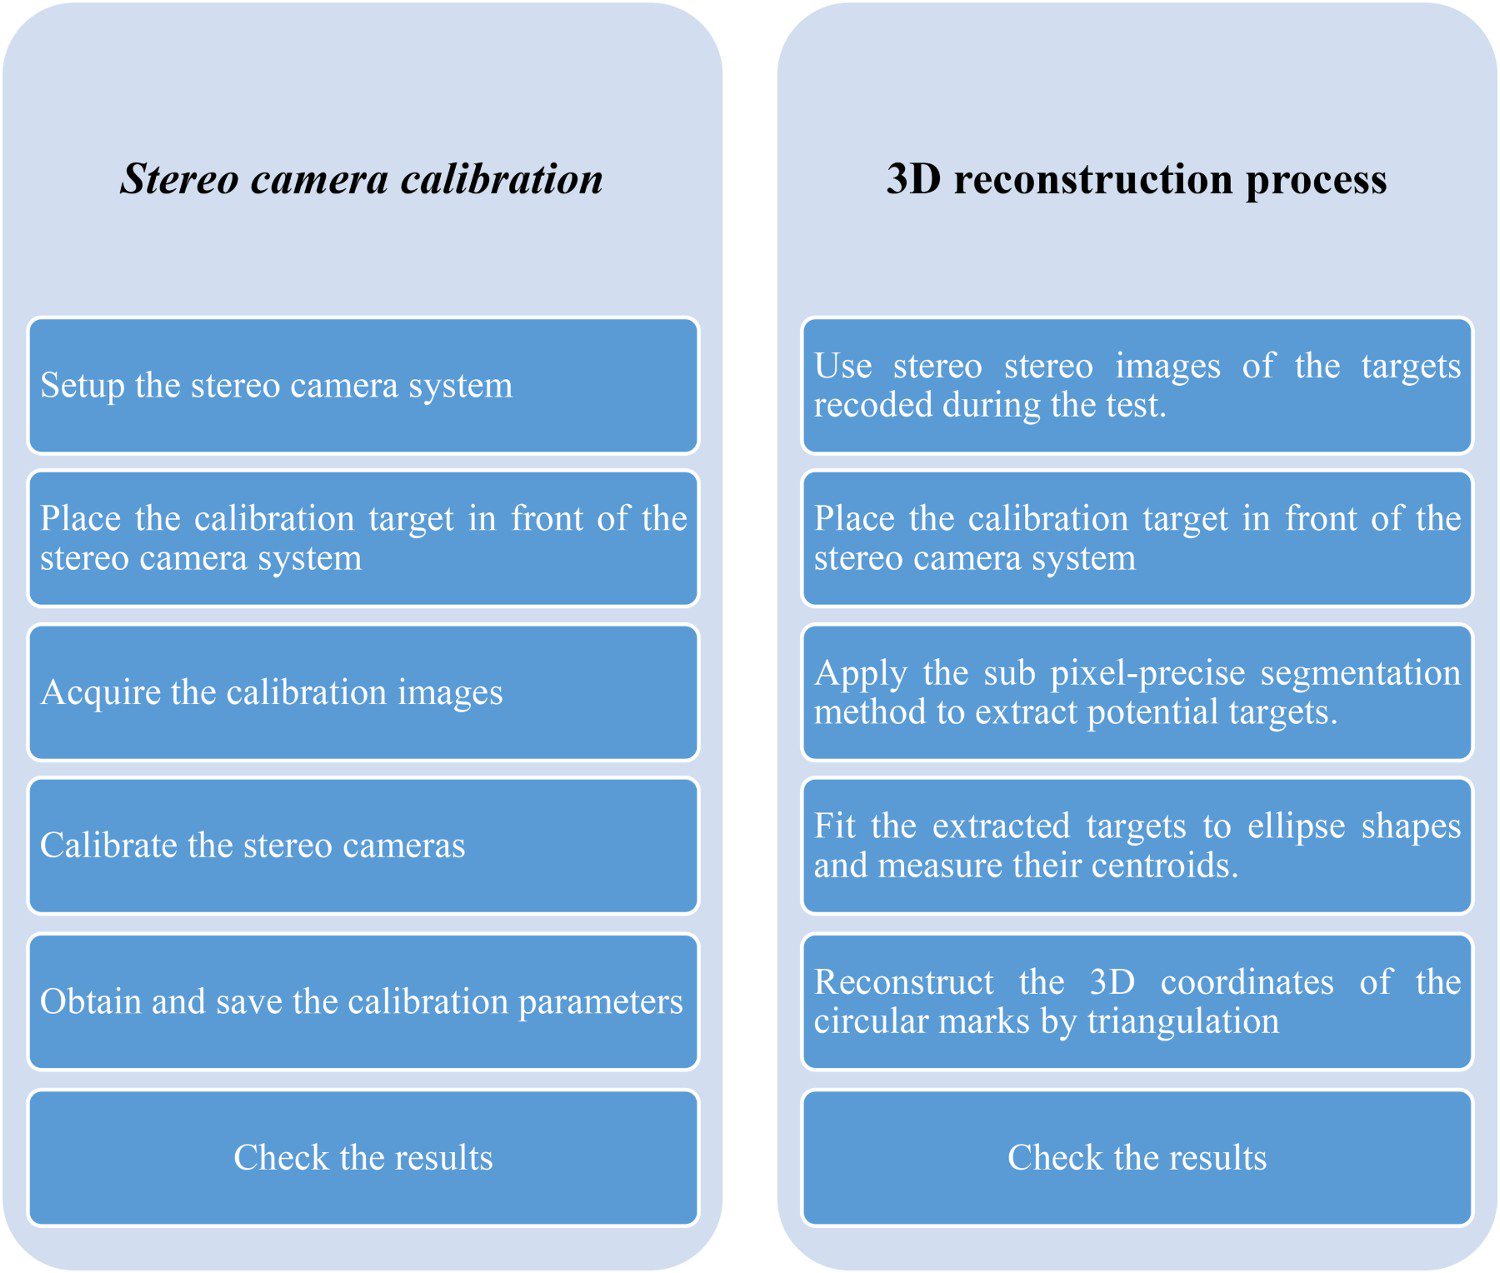
The image processing of the proposed photogrammetric approach is intensive computational work. It requires an automated software package to process the massive, acquired image data in each test. A tailor-made toolbox was developed for tracking the rotations and displacements of photogrammetric targets painted on the surface of the torsion samples. In this study a software package was developed based on Visual Basic and the image processing software, HALCON. Figure 9 shows a screen shot of the software during the process of calibrating the stereo camera system. The initial data acquisition and recording subroutines were programed in Visual Basic with the use of libraries from HALCON Application Programming Interface (API). An algorithm was implemented with subroutines to record the data in real time. Figure 10 shows a diagram of the steps required to calibrate the stereo camera system and then to construct the 3D coordinates of the photogrammetric targets.
The implemented photogrammetric software for torsional tests. Flowchart of stereo camera calibration and 3D reconstruction process.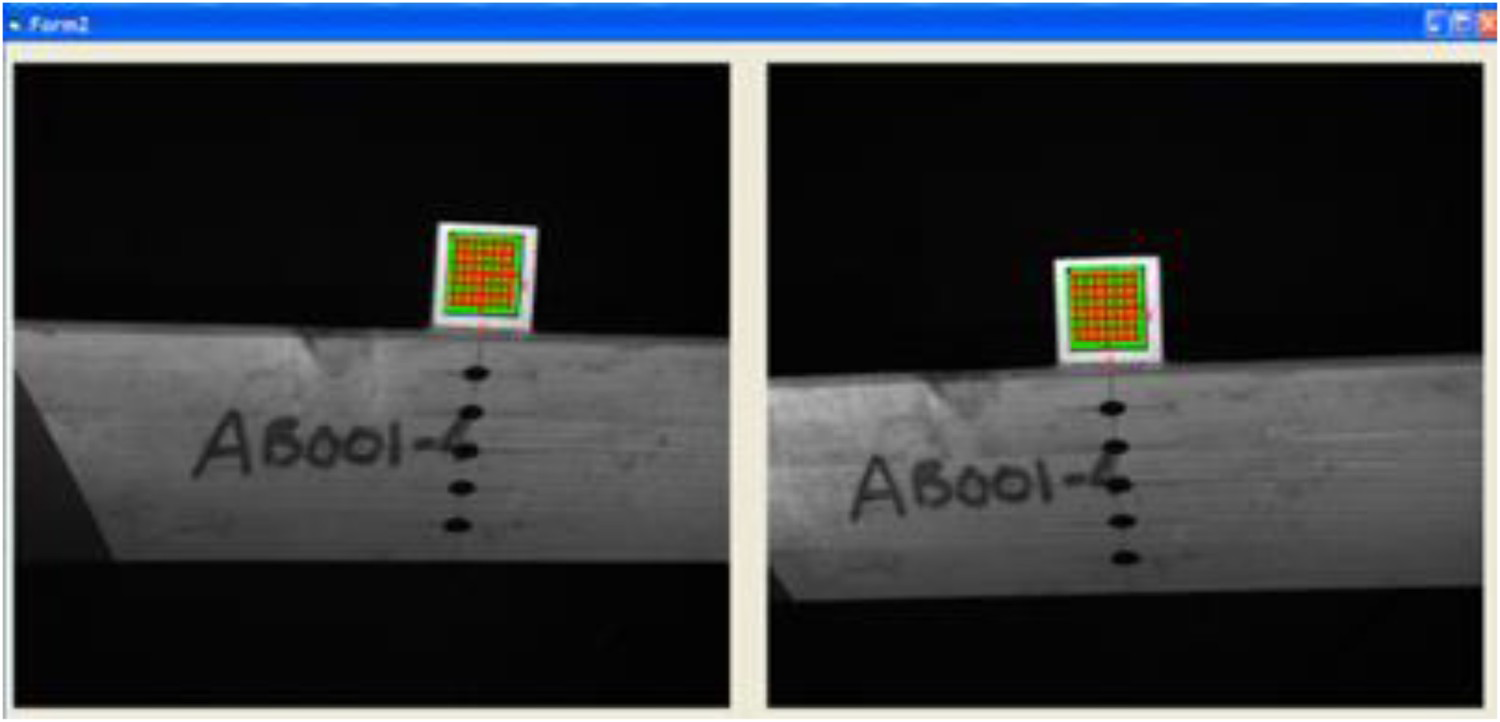
Experimental setup and procedure
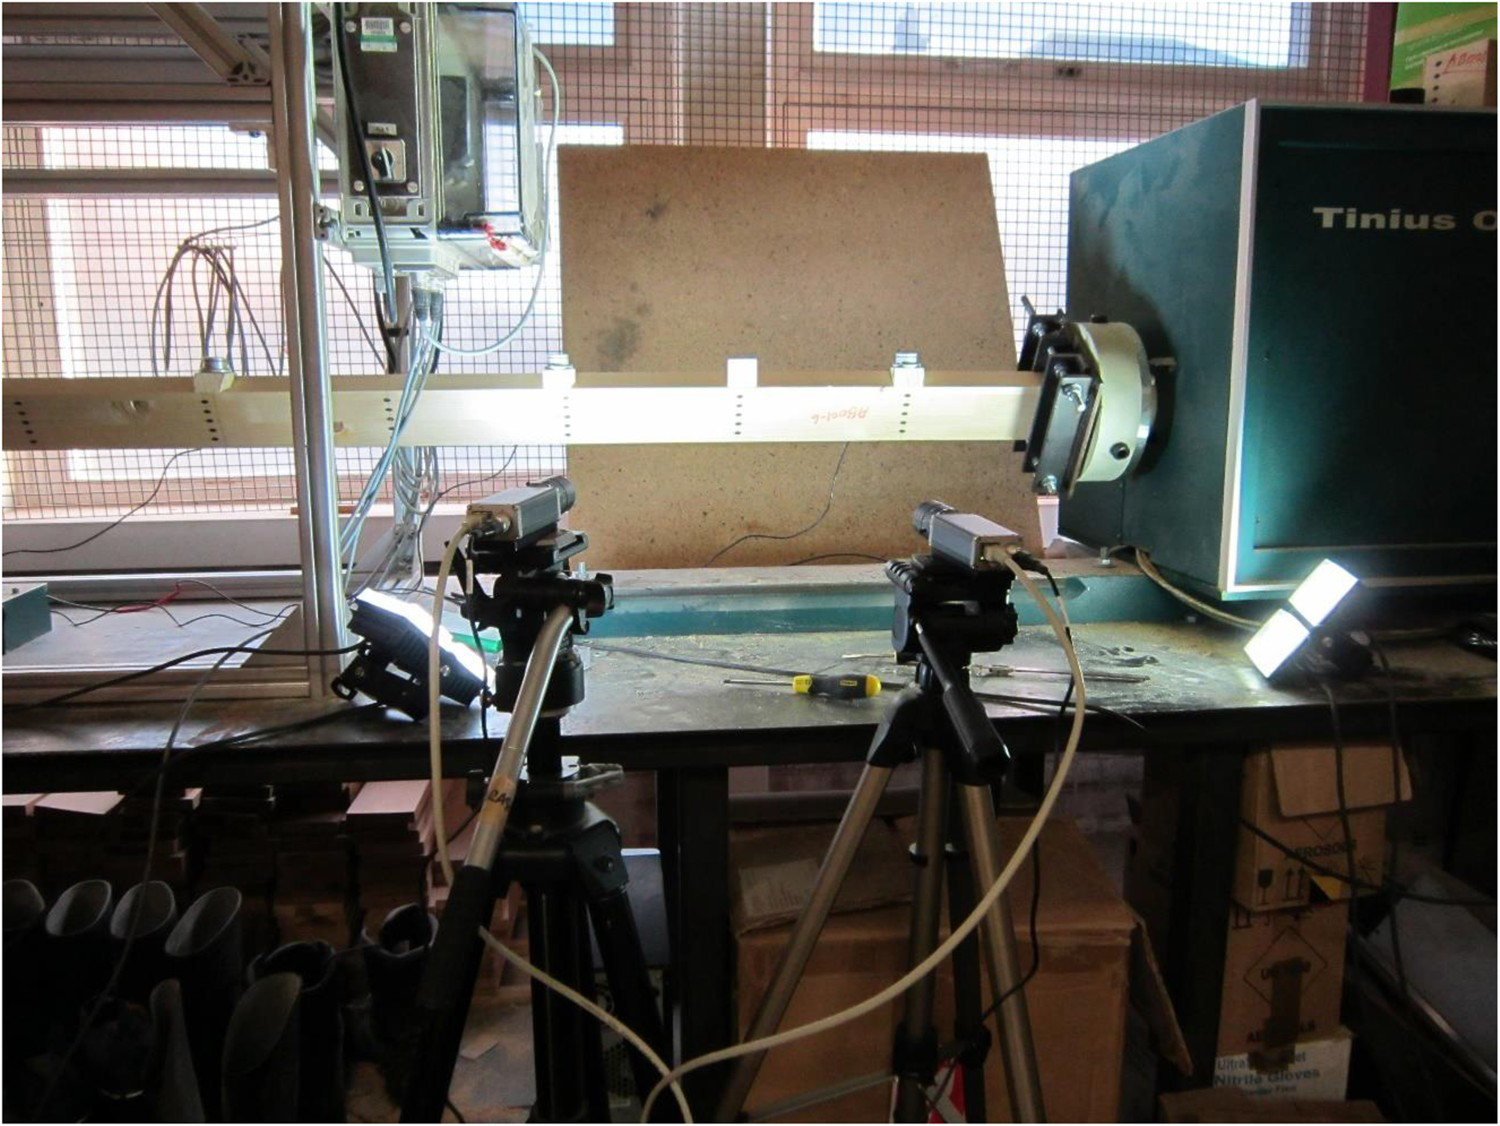
Figure 11 illustrates the schematic diagram for the test setup and an image of this setup is shown in Figure 12. The rotating chuck of the torsional testing machine was connected to the drive unit. The fixed weighing chuck of the machine was mounted on the base beam to allow motion along the axis of the specimen. The steel clamps were secured in the testing machine by mounting them between the rotating and non-rotating chucks of the machine. The clamps were positioned symmetrically about the central point of the cross-section of the specimen, allowing the specimen to rotate about its neutral axis. To mount the torsion sample between the steel testing clamps, the left-hand weighing chuck was moved along the bed of the machine and the jaws of the chucks were opened to permit insertion of the specimen. The specimen was inserted into the machine by attaching its right end to a clamp mounted on the weighing chuck and its left end with a clamp attached to the loading chuck.
Schematic torsional experimental setup with instrumentation. Image of the test setup of the specimen on the torsion machine with instrumentation.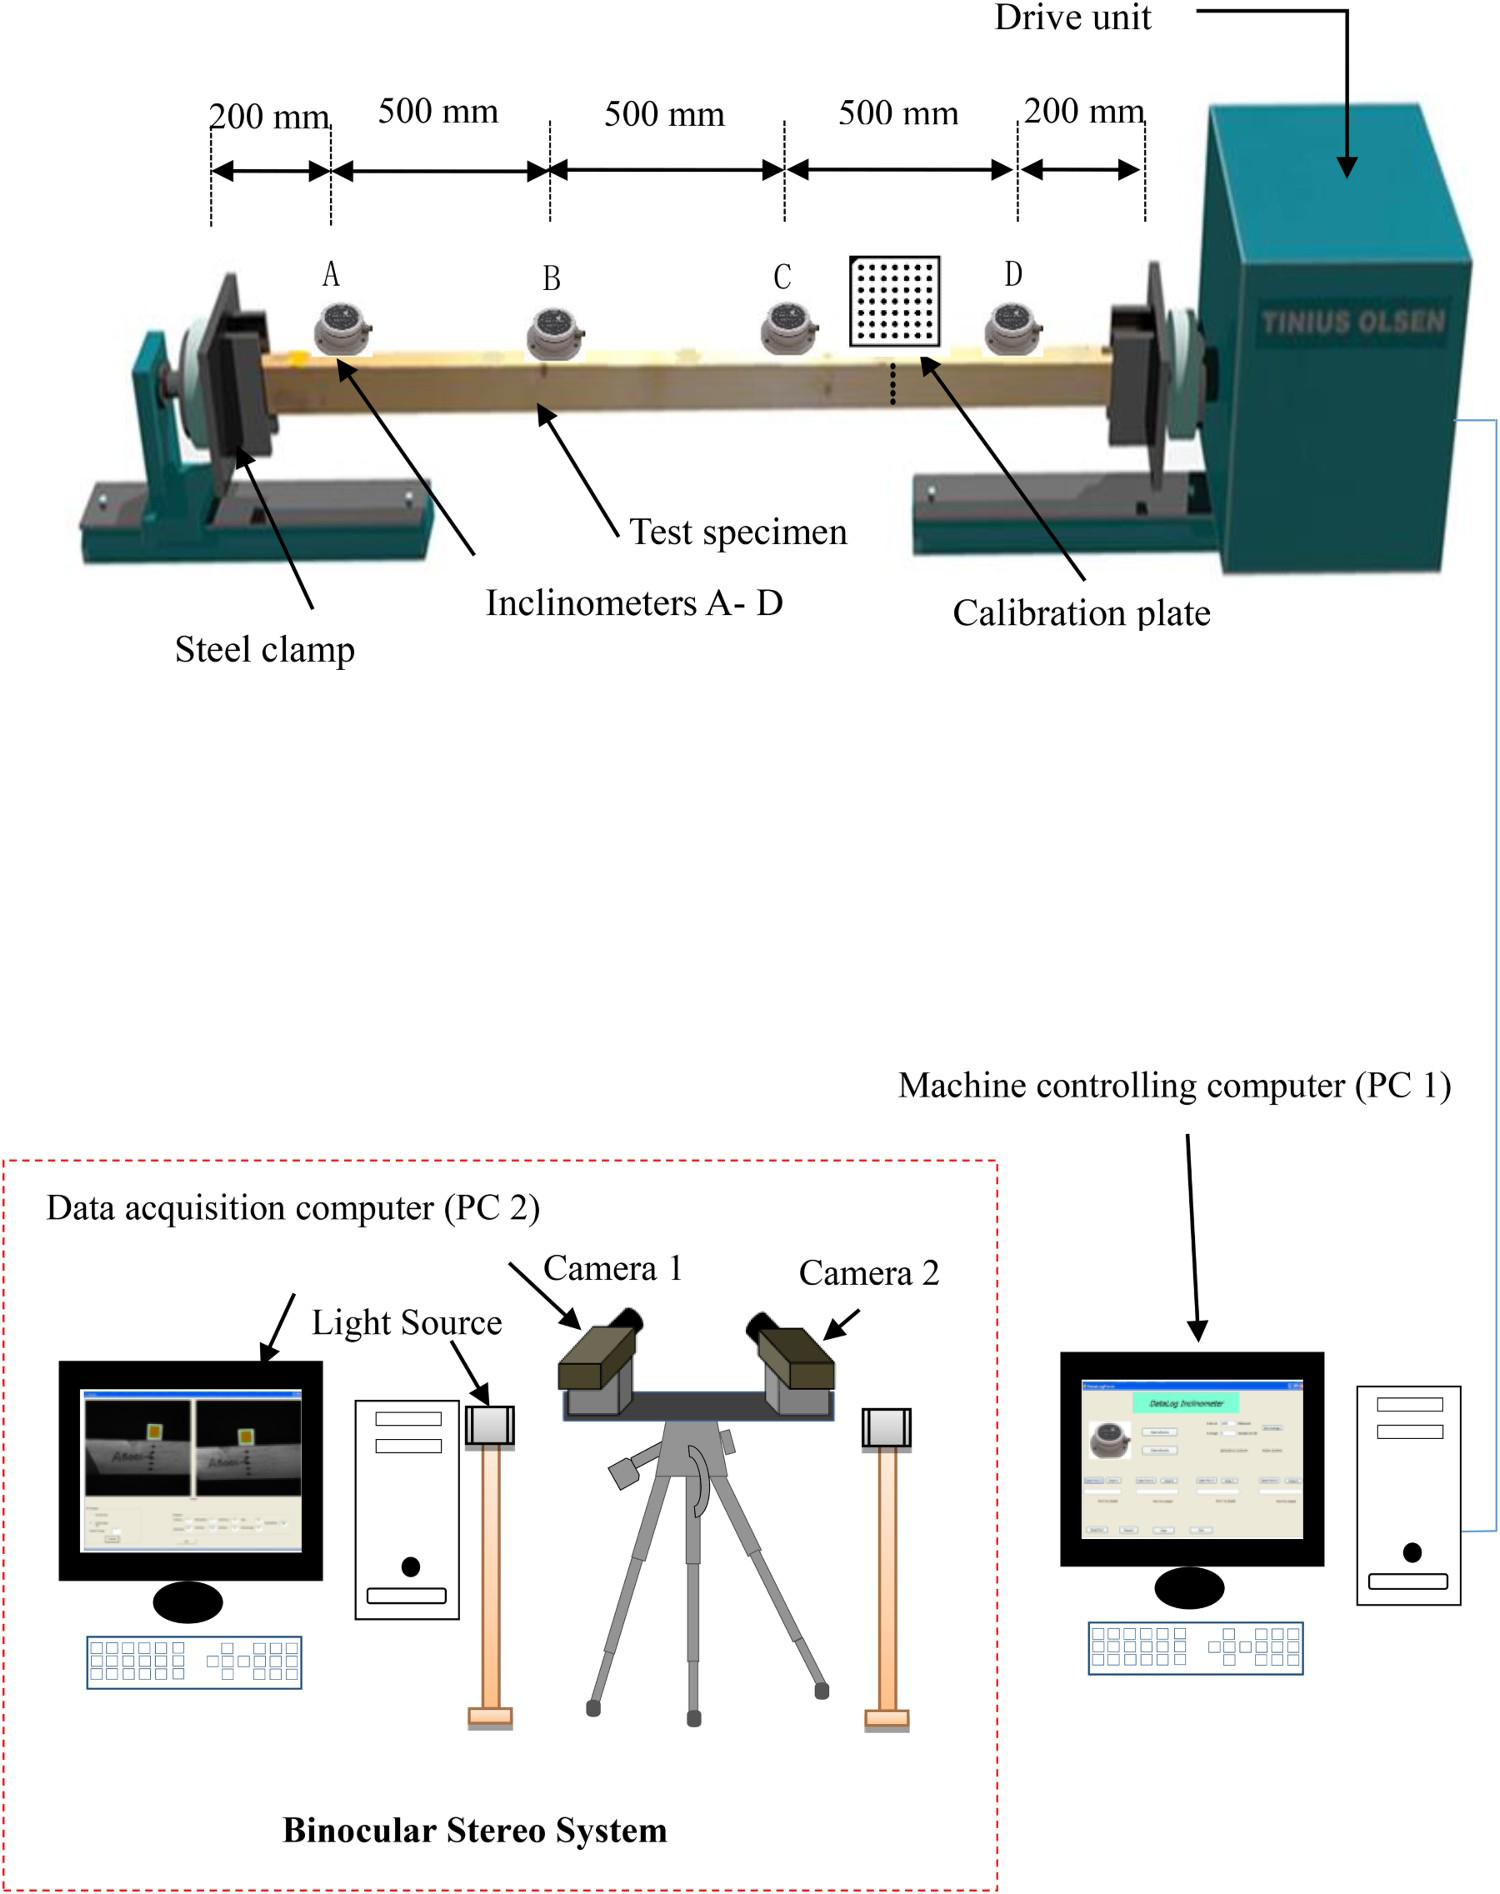
To measure the actual rotation of the glulam beam during testing, inclinometers were employed to allow recording angles of twist at the attached points. As shown in Figure 12, four inclinometers were attached to the upper surface of each sample. This was achieved by means of screws placed on the three mounting holes of each sensor. The two end inclinometers were mounted at 200 mm from the clamps to avoid possible end effects arising from the attaching clamps. This distance met the requirement recommended by the standard which suggests the distance to be about twice the depth of the torsion specimen. All inclinometers were placed at 500 mm apart from each other and were connected via cables to a data acquisition system (DAS). All data received from the inclinometers were transformed through the DAS directly to a desktop computer, PC1 where the data log interface developed to record their readings was installed.
In addition to inclinometers, a stereo camera system was employed to measure the rotations of the long side of the cross section. The two-camera system was used to monitor the rightmost section which is connected to the rotating end. The stereo cameras were placed around 1.5 m away from this section. In the middle of the selected section, as shown in Figure 13, a calibration plate was glued to the top surface of the specimen. The calibration plate with a predefined geometric shape can not only calibrate the stereo camera system but can also be used to measure the sample rotation at the attached location on the surface. To measure the rotation of the long side of the cross-section of the sample in more detail, target points were employed and placed under the calibration plate. To avoid over-exposure and reduction of quality, the lenses of the cameras were set to small apertures with an increased field of depth so that more details in a wider area could be captured. Two LED illuminators were used to negate the influence of the natural and indoor lighting and to provide a homogenous illumination of the torsion sample.
The selected section of the beam to be monitored with details of the calibration plate and target points.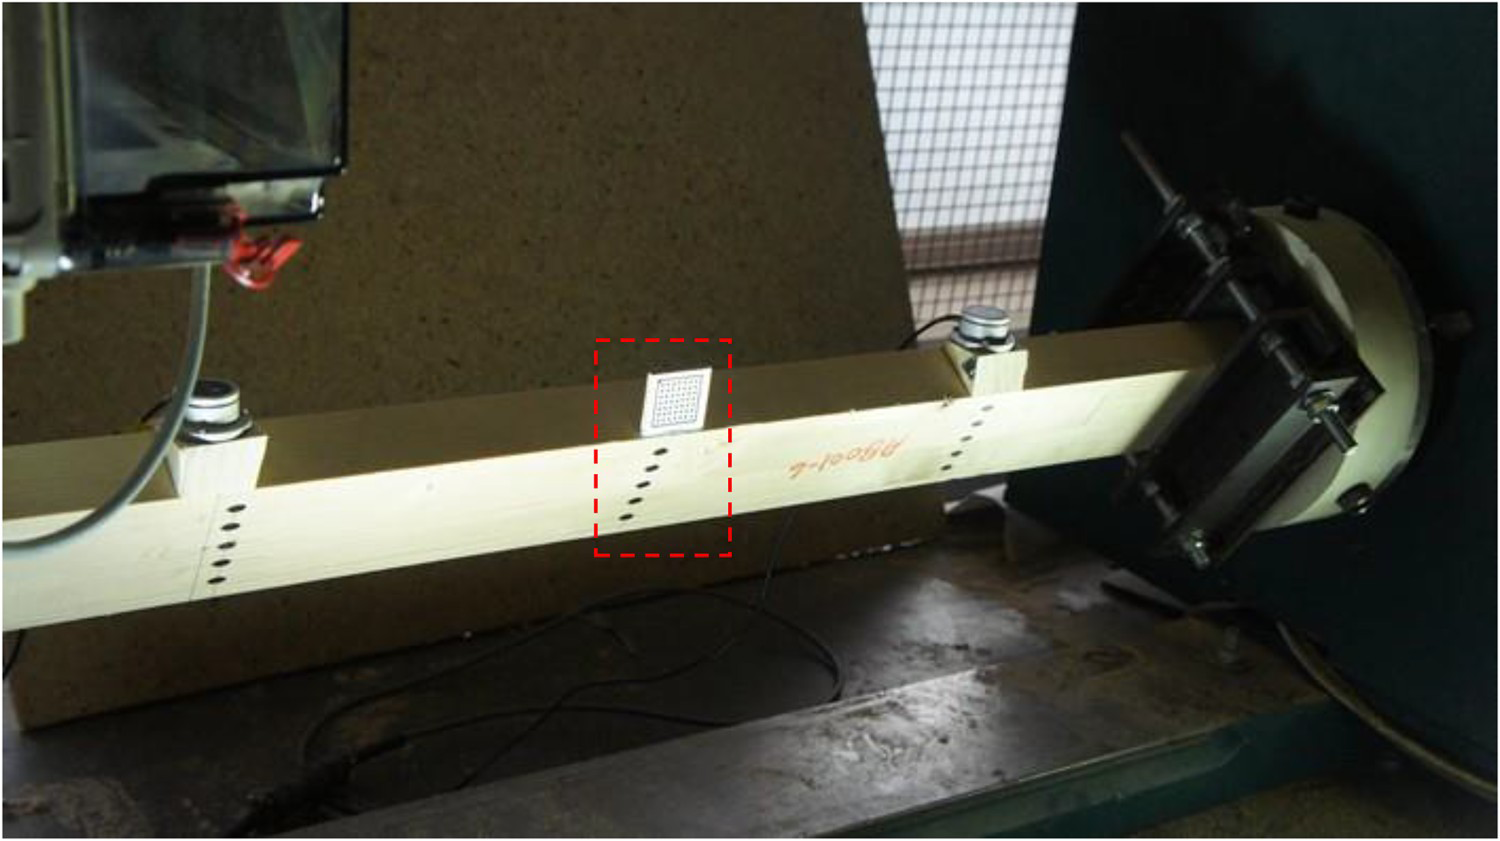
Before being used in this investigation, the two-camera system was calibrated using a calibration plate and based on the stereo camera calibration of HALCON. The plate was used as a reference object during the calibration. Images of the plate from each camera were taken simultaneously. The calibration parameters of the stereo camera system were computed, and the calibration files were saved to the desktop computer, PC2.
After calibrating the optical system, the torsion tests were carried out according to (EN 408:2012 2012) procedure of the standard torsion tests. The same configurations of the photogrammetric systems which were used during the calibration process were also used during the torsion tests. Five glulam timber beams were used in this study and the torsion tests were conducted on these beams in the elastic range using the Tinius Olsen torsion machine. Each sample was tested similarly by applying a torque using a constant rate of twist of about 8 degrees per minute prior to yielding. The torsion torque was applied to the specimen within the elastic range by a motor which was attached to the rotating chuck. The chuck on the opposite end of the specimen remained fixed and transferred the torque to the load cell to be recorded by the machine controlling computer. Once the test has started, the Tinius-Olsen software monitors the test in real time and records the applied torque and time according to the settings of the machine control being used for the test. The implemented software packages developed for inclinometers and stereo camera system were also employed to record their data during the period of the test. After the test was complete, the results were saved, the machine was stopped, and the loading chuck was then returned to its initial test position to allow the test specimen to be cleared or removed from the machine.
Test results and discussion
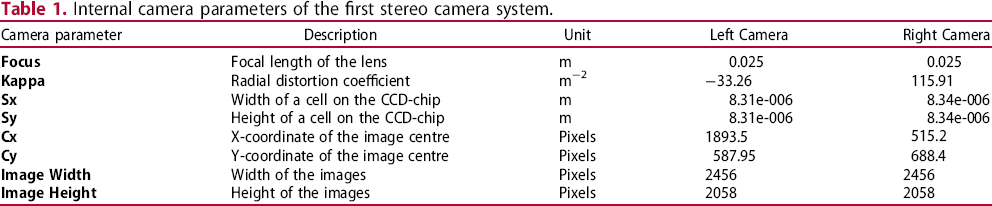
Calibration results of the stereo camera system
Internal camera parameters of the first stereo camera system.
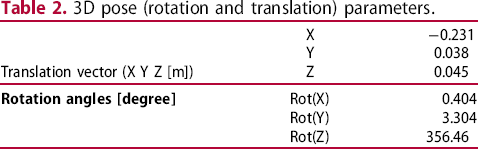
3D pose (rotation and translation) parameters.
Target tracking and 3D reconstruction results
The photogrammetric method is based on the comparison between two images of the target points acquired before and after the deformation of the torsion specimens. An algorithm was developed using the interface of the image processing software, HALCON. The algorithm reads the calibration files and displays the stereo images of the timber sample recorded before and after deformation. The photogrammetric targets were detected and fitted to ellipse shapes and their image coordinates in both the left and right images were determined using the sub pixel-precise segmentation method provided by the software. The 3D coordinates of the targets expressed in the camera coordinates of the left camera were determined using a triangulation technique. Using this 3D data, the displacements and rotations of the photogrammetric targets can be calculated at different time intervals.
Comparison of the inclinometers and photogrammetric measurements
The accuracy of the photogrammetric method is greatly influenced by cameras, lighting, algorithms of the calibration and algorithms of the 3D reconstruction. To validate the accuracy of the stereo system, the rotation of the calibration plate is captured by two cameras and compared with the average readings from the two inclinometers next to the plate. The comparison of the results from the inclinometers and the photogrammetric approach is shown in Figure 14. It can be seen that there is a good agreement between these two methods.
Comparison between the measurements of inclinometers and the photogrammetric system for sample 1 (top) and sample 2 (bottom).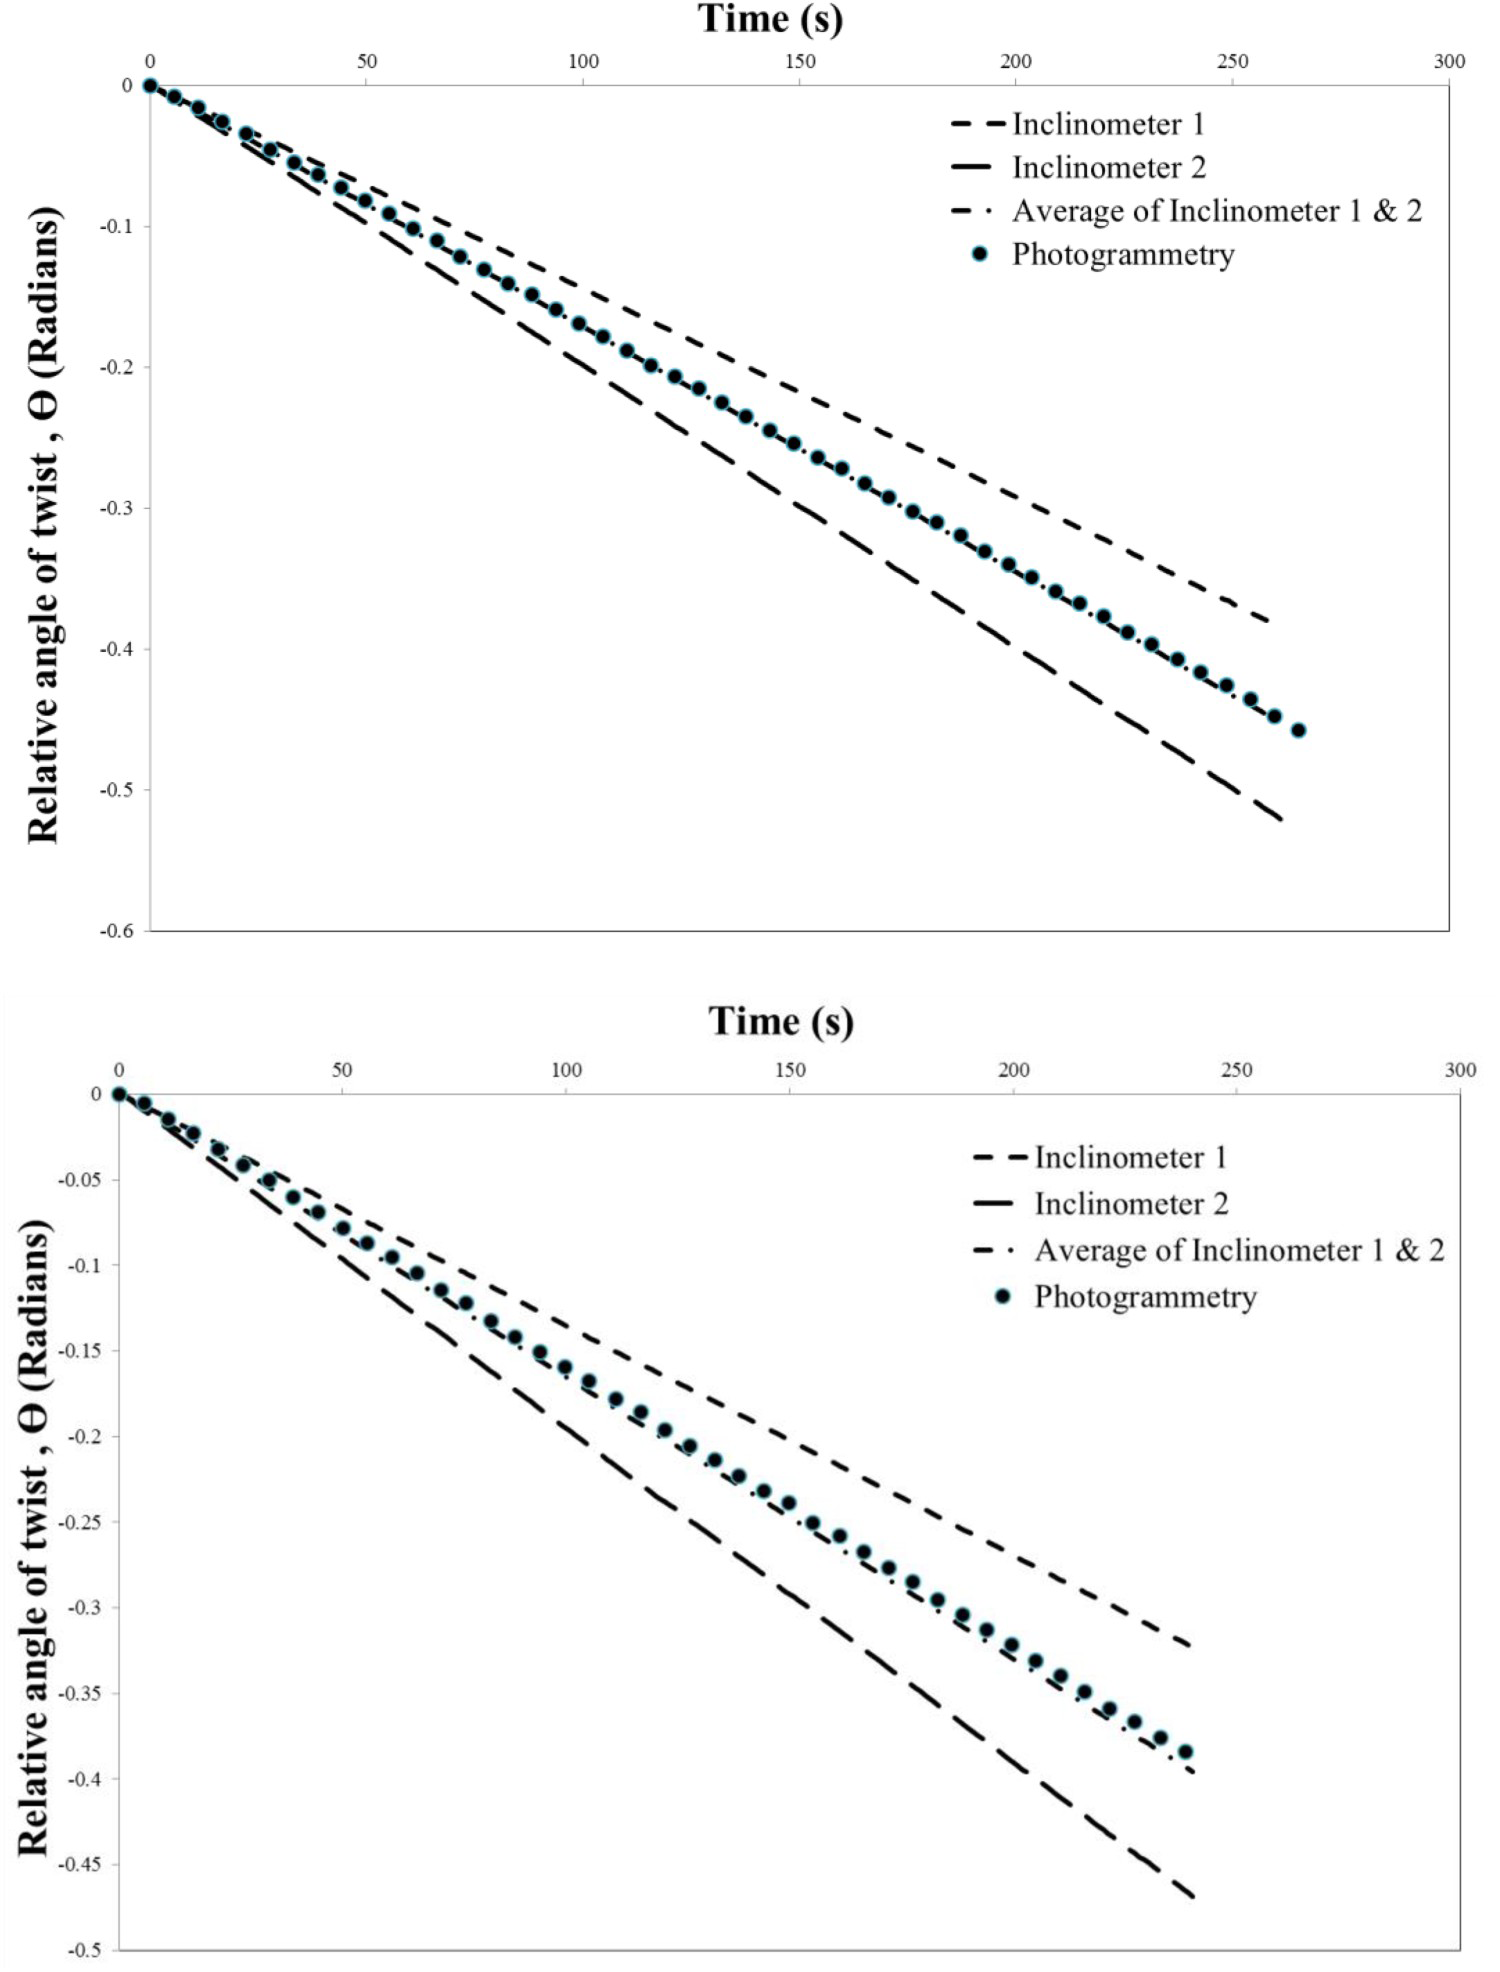
Shear deformation along the long side of the cross-section
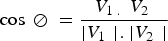
The ability of monitoring and measuring any target points inside of the field of view (FOV) has become the most attractive feature for researchers to apply the photogrammetric method in their experimental research, especially when it is not feasible to use conventional sensors. In this research, the photogrammetric method is also employed to calculate the displacements of the photogrammetric targets along the long side of the cross-section for the region of interest, which is exactly below the calibration plate. This was achieved by first calibrating the stereo camera system and finding the internal as well as the external parameters of this system. Using these calibration parameters of the stereo camera system and triangulation, the 3D coordinates of the target points were determined based on the triangulation procedure. The 3D coordinates of the central target calculated from the initial images taken before applying torque to the specimens were used to define a point (P1) which was used to be an origin of the coordinate system. The 3D coordinates of each target at the initial images and the deformed images were used to define two points, P2 and P3. The 3D coordinates of the three points were used to define vector 1 (V1) and vector 2 (V2). Using the two vectors, the rotations of the photogrammetric targets for each time interval were calculated according to the following equation.
The photogrammetric system was also employed to investigate the displacements of the longer side of the cross section of the torsion specimens. The displacements of the targets exactly below the calibration plate occurring when subjected to a torsional loading were calculated. This was achieved by using the 3D coordinates of the photogrammetric targets and calculating the displacements in the X and Y directions via Equation (1). The central target was employed to be the origin of the coordinate system.
Figure 15(a) shows an example of the displacement of the longest edge of the cross-section measured in the X and Y directions. These displacements correspond to approximately 50 s of torsional deformation. The applied torque caused the longer side of the cross section of the beams to deform in the axial direction. This indicated that the plane cross section no longer remains plane after twisting. This deformation might affect the torsional stiffness and hence the shear modulus of the glulam specimens. Although under the Saint-Venant's torsion theory there should not be a cross-sectional distortion within the x–y plane, it can be seen that significant deformations in the x–y plane have been observed, even under a relatively low torque at the 50th second. Therefore, it has non-negligible effects on the shear strain and shear stress for timber materials in torsion.
(a) Displacements of the longer side of the cross-section (b) original and deformed cross-section.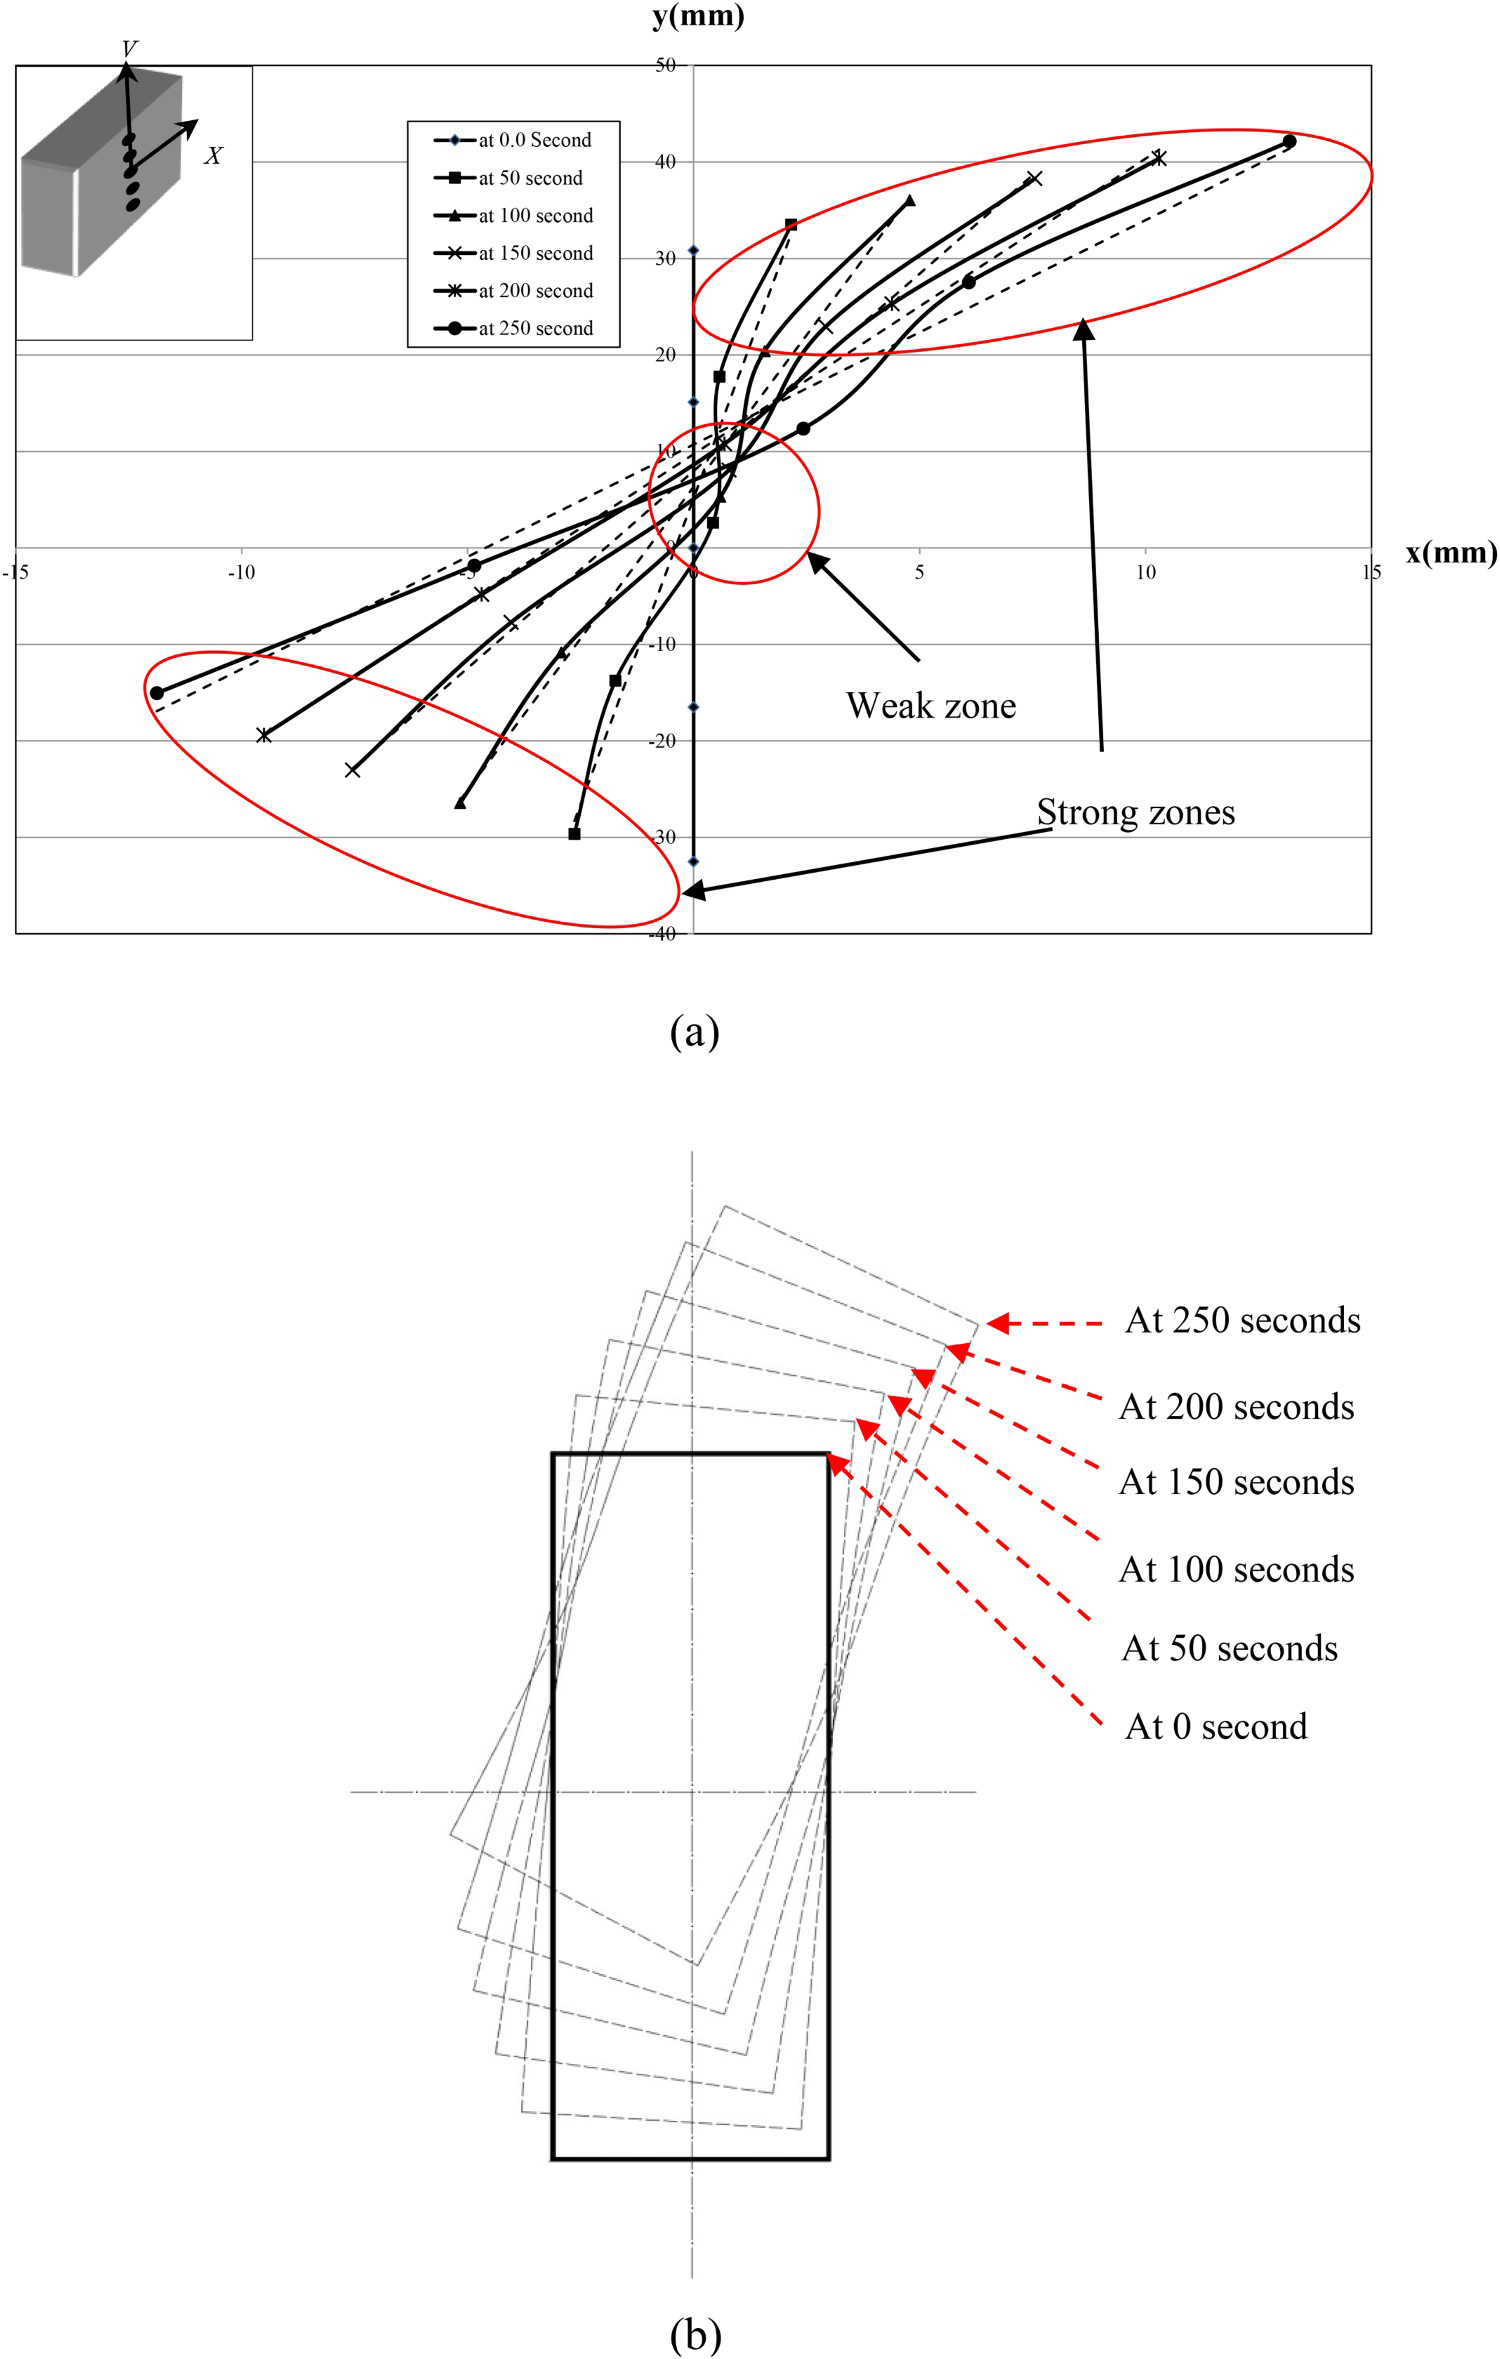
It can be seen from Figure 15(a). that the applied torque causes the longer side of the sections, which were plane prior to twisting, to deform in the axial direction, meaning that the plane cross sections no longer remain plane after twisting. The deformations of the cross section will affect the torsional stiffness of the glulam specimens. From the displacement shown in Figure 15(a), two different zones can be easily recognized with different gradients of increase in displacement, i.e. a weak zone (of accuracy) with a larger discrepancy than the strong zone. The dashed lines represent the best fit regression through each line of photogrammetric targets at each torque interval, whereas the solid lines represent the actual displacement and position of the photogrammetric targets. From this, the areas of strongest and weakest agreement with this approximation through the torsional movement can be observed.
In a torsion test, the inclinometers are normally mounted on the short side of the cross-section. Considering the non-linear displacements observed along the long side of the cross-section, it is important to understand the difference between the rotation of the long and short side of the cross-section. The average rotation of the long side was calculated as indicated by the dash line in Figure 15(a). From the average displacements, the rotations of the long side were calculated. A scaled sketch of the original and deformed shape of cross-section is shown in Figure 15(b). Figure 16 shows the comparison of the average rotations of the long (from the photogrammetric method) and short sides (from the inclinometers). The maximum difference between the two methods was approximately 5%. Although a small difference can be observed between the two measurements, it is clear that there is a noticeable agreement between them, indicating that the inclinometers’ rotational measurements of the short side are acceptable in structural member level.
Comparison of rotations of the short and long sides.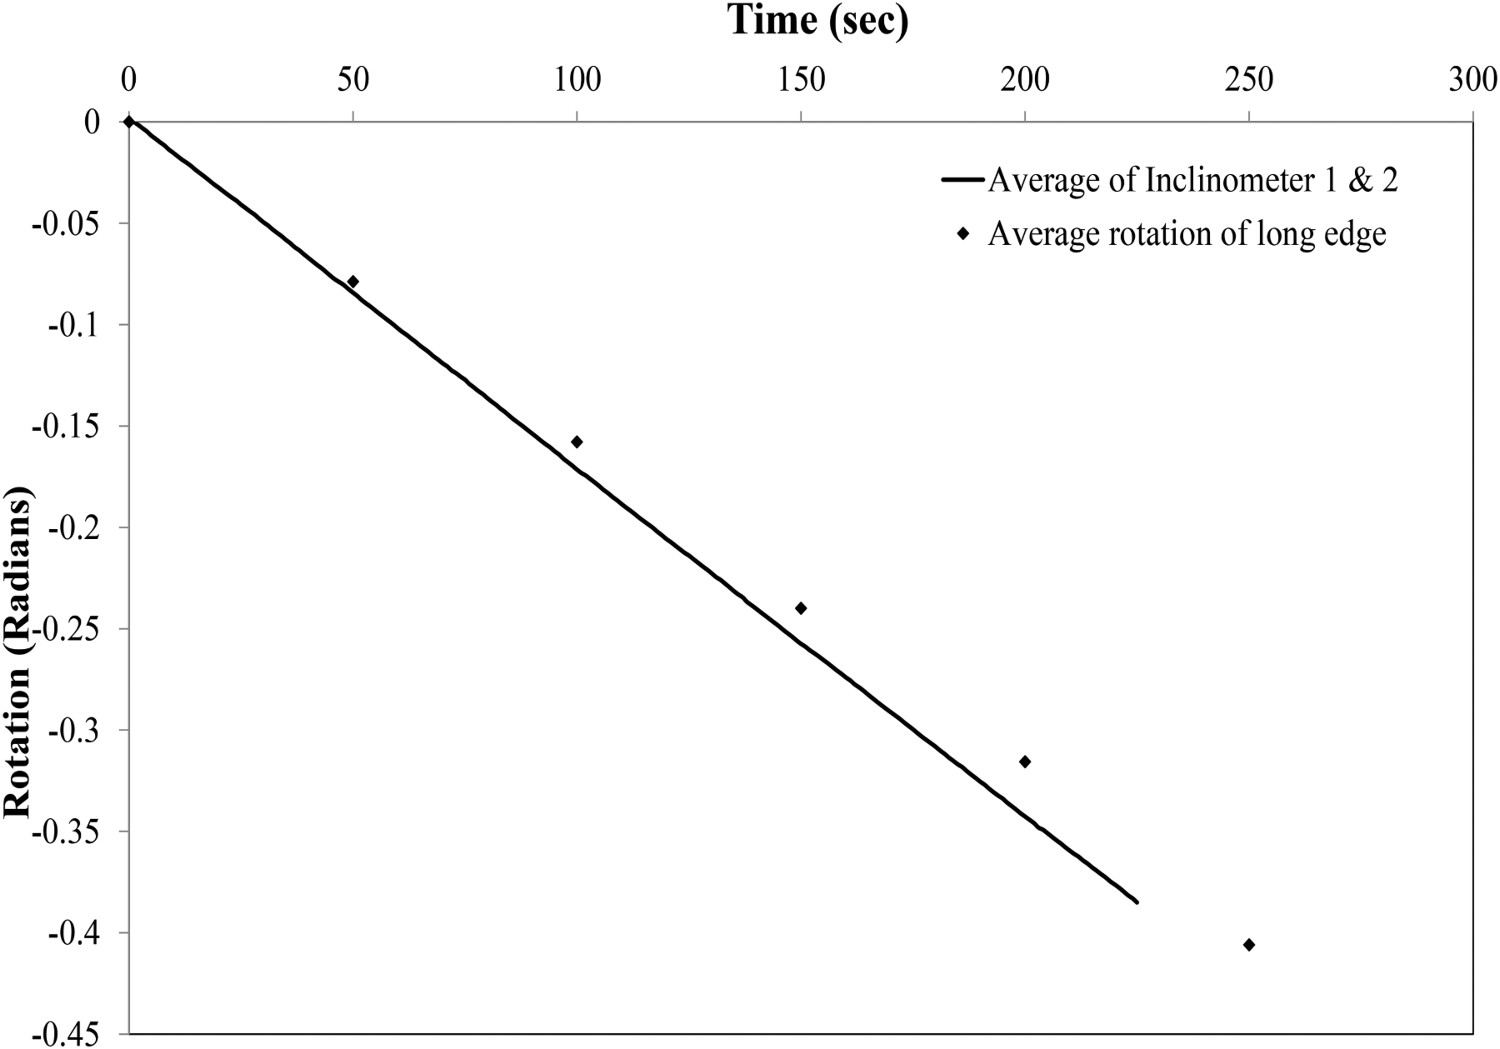
Conclusion
An experimental study was conducted on glulam timber beams the applicability of the photogrammetric approach on the torsion test. The main findings can be summarized as follows:
The non-contact photogrammetric approach has proved to be an efficient and accurate way of monitoring more details of angles of twist of glulam timber beams subjected to torsional loading. This will help to evaluate torsional behaviour of glulam timber beams and to investigate more details of the angular deformation of the torsion specimens. This may assist in understanding the torsional behaviour of the specimens and give a basis for further studies. The accuracy of this method was validated by a comparison study that has been carried out between the photogrammetric method and the method of using conventional inclinometer sensors. Good agreement has been found between these two measuring systems. After confirming the accuracy of the proposed method, a further study on the shear displacement at cross-sectional level was carried out by tracking and measuring the displacement of the photogrammetric targets pre-painted on the sample surface. Significant non-linearity has been found from the measurement of the shear displacements along the long side of the cross-section. However, the average rotation shows clear agreements with the inclinometer readings.
Footnotes
Acknowledgements
The authors would like to express their special gratitude to the supports from the British Council and Ministry of Education, China (UK–China-BRI Countries Education Partnership Initiative), Lawrence Ho Research Fund, Royal Academy of Engineering-Visiting Professor (VP2021\7\12), and Royal Academy of Engineering-Industrial Fellowship (IF\192023).
Disclosure statement
On behalf of all authors, the corresponding author states that there is no conflict of interest.