
Abstract
The torsion test is recommended as a standard approach to determine the shear modulus of structural-size timber and glulam beams. However, there is difficulty in measuring the rotational deformations of timber beams. A stereo camera system and photogrammetric approach are therefore proposed in this study. This study evaluates the applicability of the proposed photogrammetric approach to the torsion testing method on solid timber beams. Tests were performed comparing rotational values of specific points determined by the photogrammetric approach with those measured by traditional devices. Remarkable findings were obtained which may help to develop an outline for future research in the field of evaluating material properties of timber beams. The results also showed that the optical system not only allowed the assessment of performance and reliability of traditional sensors, but also allowed monitoring the deformation of samples at various locations by providing more information which would be unobtainable using traditional techniques.
Keywords
Introduction
The shear modulus, G, is a measure of elastic shear stiffness and is defined by the ratio of shear stress to shear strain. It is a fundamental mechanical property of wood that is used in the design of timber and engineered wood products. Timber has a relatively low shear stiffness, therefore in load-bearing applications the shear modulus is a critical factor when designing for lateral-torsional stability of beams, as per EN 1995-1-1. The shear modulus is also significant in designing serviceability of wood-joist floors (Foschi, 1982; Chui, 2002), and is an important input for setting up analytical and finite element models (Foschi, 1982).
According to European Committee for Standardization CEN (EN 408:2003) and American Standard of Testing Materials ASTM (ASTM-D198-94), bending tests are the most common approach to evaluate the shear modulus of timber and glulam materials. However, this method has proven to be suboptimal for evaluating the shear stiffness of structural-size specimens. The bending test creates a combination of flexural and shear stresses that lead to difficulties in obtaining the true value of shear stiffness (Riyanto and Gupta, 1998).
The torsion test is recommended by the most recent British Standard, BS EN 408:2012, as a standard test method to characterise properties of structural-size timber-composite materials. A primary objective of the torsion test is to determine the shear modulus of the material. Torsion tests are of benefit as they are the only method that imposes a state of pure shear stress on a specimen, and have proven to have more advantages for measuring the shear modulus value of timber and glulam beams (Vafai and Pincus, 1973; Hindman et al., 2005). Recently, the torsion test has been adopted more frequently by researchers (Vafai and Pincus, 1973; Gharavi and Zhang, 2018; Gharavi and Zhang, 2018; Gharavi et al., 2018; Gupta et al., 2002; Gupta and Siller, 2005; Khokar, 2010; Mohamed et al., 2021a, 2021b; Mohamed et al., 2015; Zhang, 2011; Zhang, 2012) to evaluate the shear modulus of structural-size timber and glulam beams, as well as laminated structural glass beams (Uheida et al., 2021).
When performing torsion tests, one must consider how to effectively measure and extract the torque-rotation relationship – unfortunately, it is not feasible to use the torsion machines end rotation data alone to determine the beams mechanical properties such as the shear modulus (Gharavi et al., 2018; Mohamed et al., 2021a, 2021b; Zhang et al., 2012). Measuring the required torsional displacements can be performed with fair accuracy using traditional contact-based devices such as inclinometers or linear variable differential transformers (LVDTs) (Mohamed et al., 2021a, 2021b, 2021c; Mohamed et al., 2015; Zhang, 2012), although these still come with limitations. Inclinometers are limited to one device per data point, the measurement accuracy is limited by the base size of the sensor and can only measure in x and y dimensions. LVDTs are also limited to measure in one or two dimensions. Both devices are contact based so there can be issues with attachment and damage during testing.
Monitoring tools using photogrammetry and image processing have been used in timber to measure mechanical properties, 3D displacements, or deformations at various points of the same specimen, as proposed in various experiments (Gharavi et al., 2017; Gharavi and Zhang, 2018; Gharavi et al., 2018; Mohamed et al., 2021a, 2021b, 2021c; Mohamed et al., 2015; Zhang, 2011; Zhang, 2012; Zhang et al., 2012; Choi et al., 1991; Dahl and Malo 2009a, 2009b; Franke et al., 2007; Franke et al., 2007; Garcia and Orteu, 2001; Maas and Hampel, 2006). In contrast to traditional techniques, the binocular stereo vision approach is a non-contact measurement technique that can be used to extract reliable measurements of physical objects from stereo images. The main advantage of this technique compared to traditional techniques are that it offers the capability to measure the three-dimensional (3D) location of any point located on the object's surface. In addition, binocular stereo techniques can be used to monitor the deformations of objects at various locations without making physical contact. The optical system provides a permanent visual and measurement record for further assessment.
This paper presents the experimental studies performed to investigate the feasibility of the developed photogrammetric system on torsion tests. Torsion tests were conducted on solid timber beams according to the EN 408:2012 standard procedure for structural-size torsion tests. To measure torsional displacements in these experiments, a combination of angular measurement instrumentations, inclinometers, and stereo camera systems were used. The main objective of this study was to validate the developed optical system and then to employ it for proper use of the torsion test. Another objective of this study was to investigate the difference between the rotations of the long and short sides of the cross-section of the torsion specimens. The rotational deformation on both the short and long sides of the cross-section was measured by the photogrammetric method and inclinometers. This may assist in understanding the torsional behaviour of the specimens and give a basis for further studies.
Materials and methods
Two timber beams with nominal cross-sectional dimensions of 216 × 45
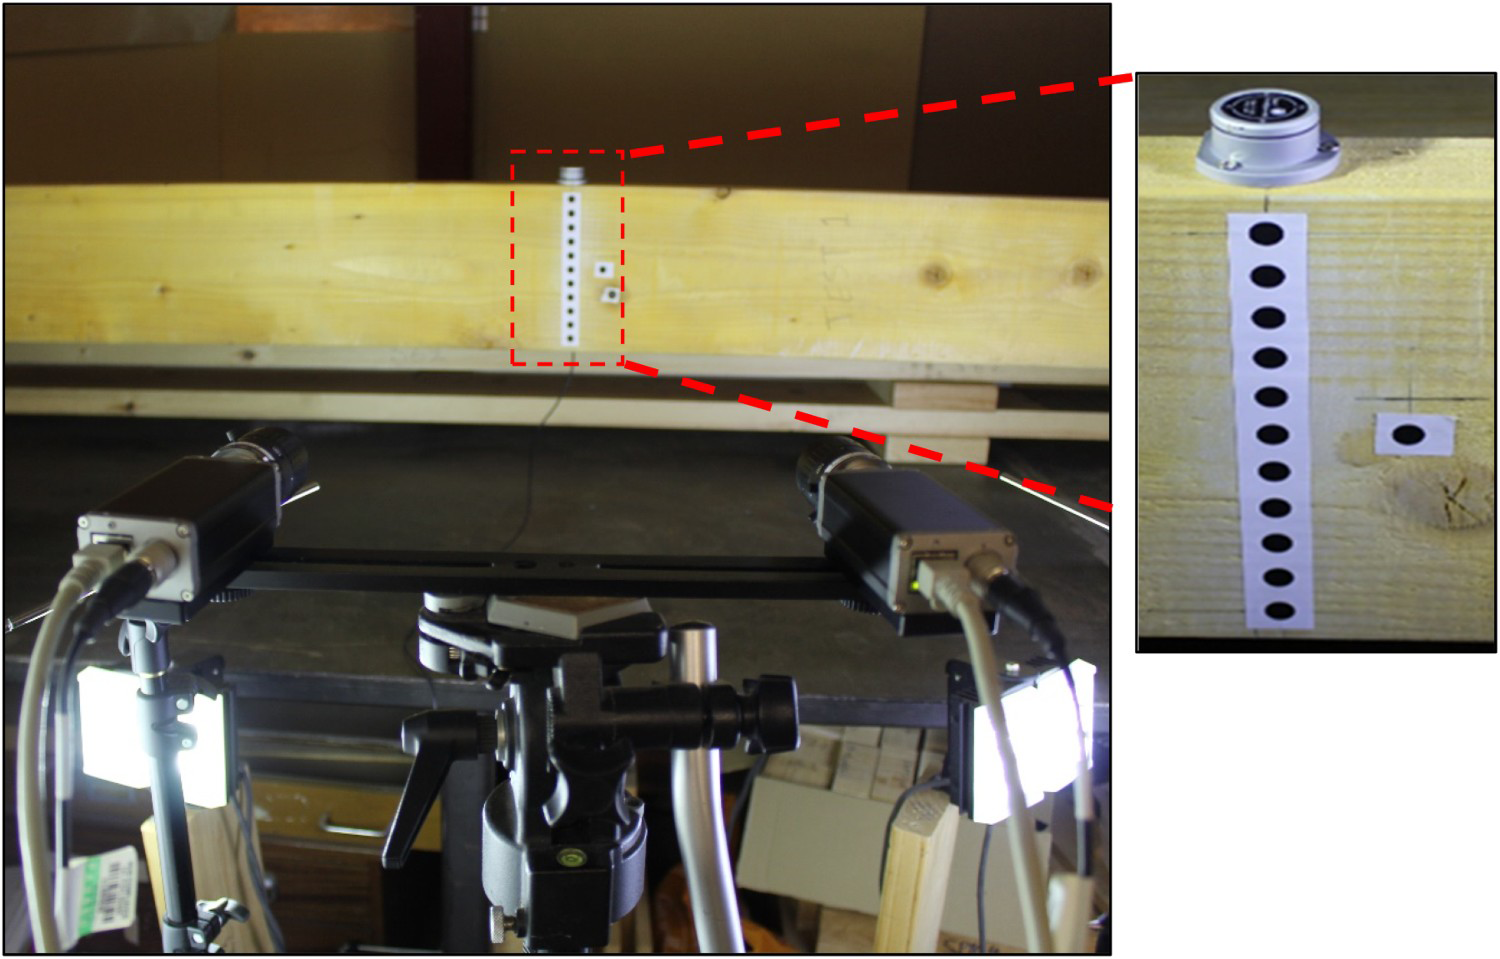
Before testing and employing the stereo camera system for angular measurements, the timber beams were prepared by applying photogrammetric targets to their surfaces in accordance with the inclinometer location. About 11 targets were glued exactly to the middle of the sample and were intended to measure the rotations along the depth of the test specimen. To be easily distinguished during image processing, these targets were printed on a white background and glued to the surface of the beams. Inclinometers (Model IS-2-30, Level Developments, UK) were used to measure the angles of twist of the glulam beams at the attached points. These inclinometers are dual axis sensor capable of measuring angles with a measurement range of ±30° in two directions with an accuracy of ±0.05°. The diameter of the circular base is 43mm.
The torsion testing equipment which was used in the previous torsion test was also used in this study. Figure 1 shows an image of the stereo camera system and the inclinometer used in this study. The photogrammetric system consists of a pair of Basler Pilot piA2400-17gm cameras, Computar (M2518-MPW F1.8) Megapixel lenses, two LED light units, and a tripod with a frame for adjusting the cameras. The Computar lenses used had a constant focal length of 25 Image of the stereo camera system (left) and inclinometer (right).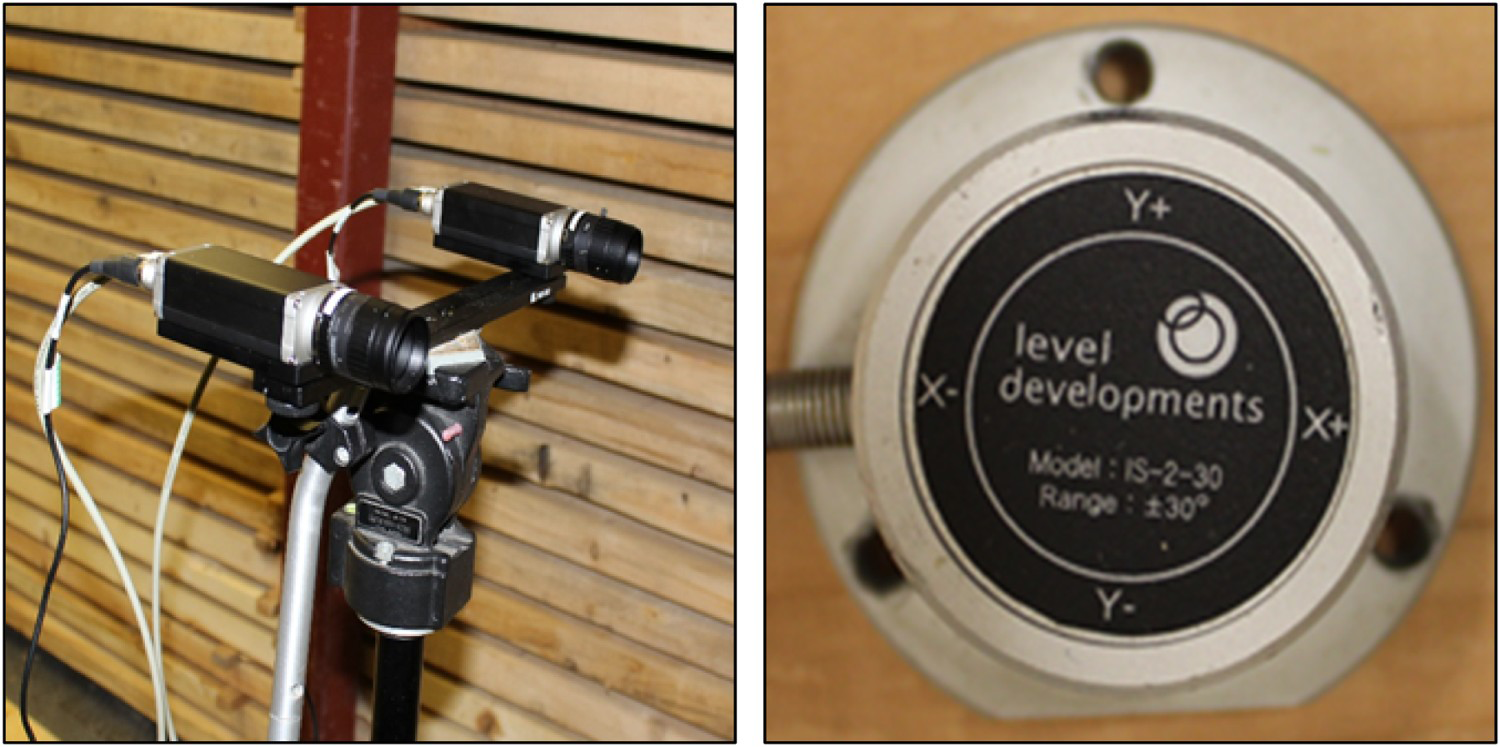
Experimental setup and procedure
Images of the torsional testing equipment with a specimen beam and instrumentation are shown in Figure 2. Image of the stereo camera system with the photogrammetric targets is shown in Figure 3. The timber specimen was placed in the 1 kN-m torsion testing machine, manufactured by Tinius Olsen, in front of the photogrammetric camera system to allow the rotation angles of the long side of the test sample to be investigated. To monitor the rotations of the targets, two Basler cameras were mounted on a frame with a stereo baseline of approximately 30 cm. These cameras were connected via a Gigabit Netgear switch to a desktop computer with the image processing software, HALCON, installed. For comparison purposes, an inclinometer was mounted on the upper edge (45 mm dimension) of the test sample. This sensor was located exactly at the middle of the sample and above the photogrammetric targets.
Image of the torsional testing equipment with a specimen beam and instrumentation. Image of the stereo camera system with the photogrammetric targets.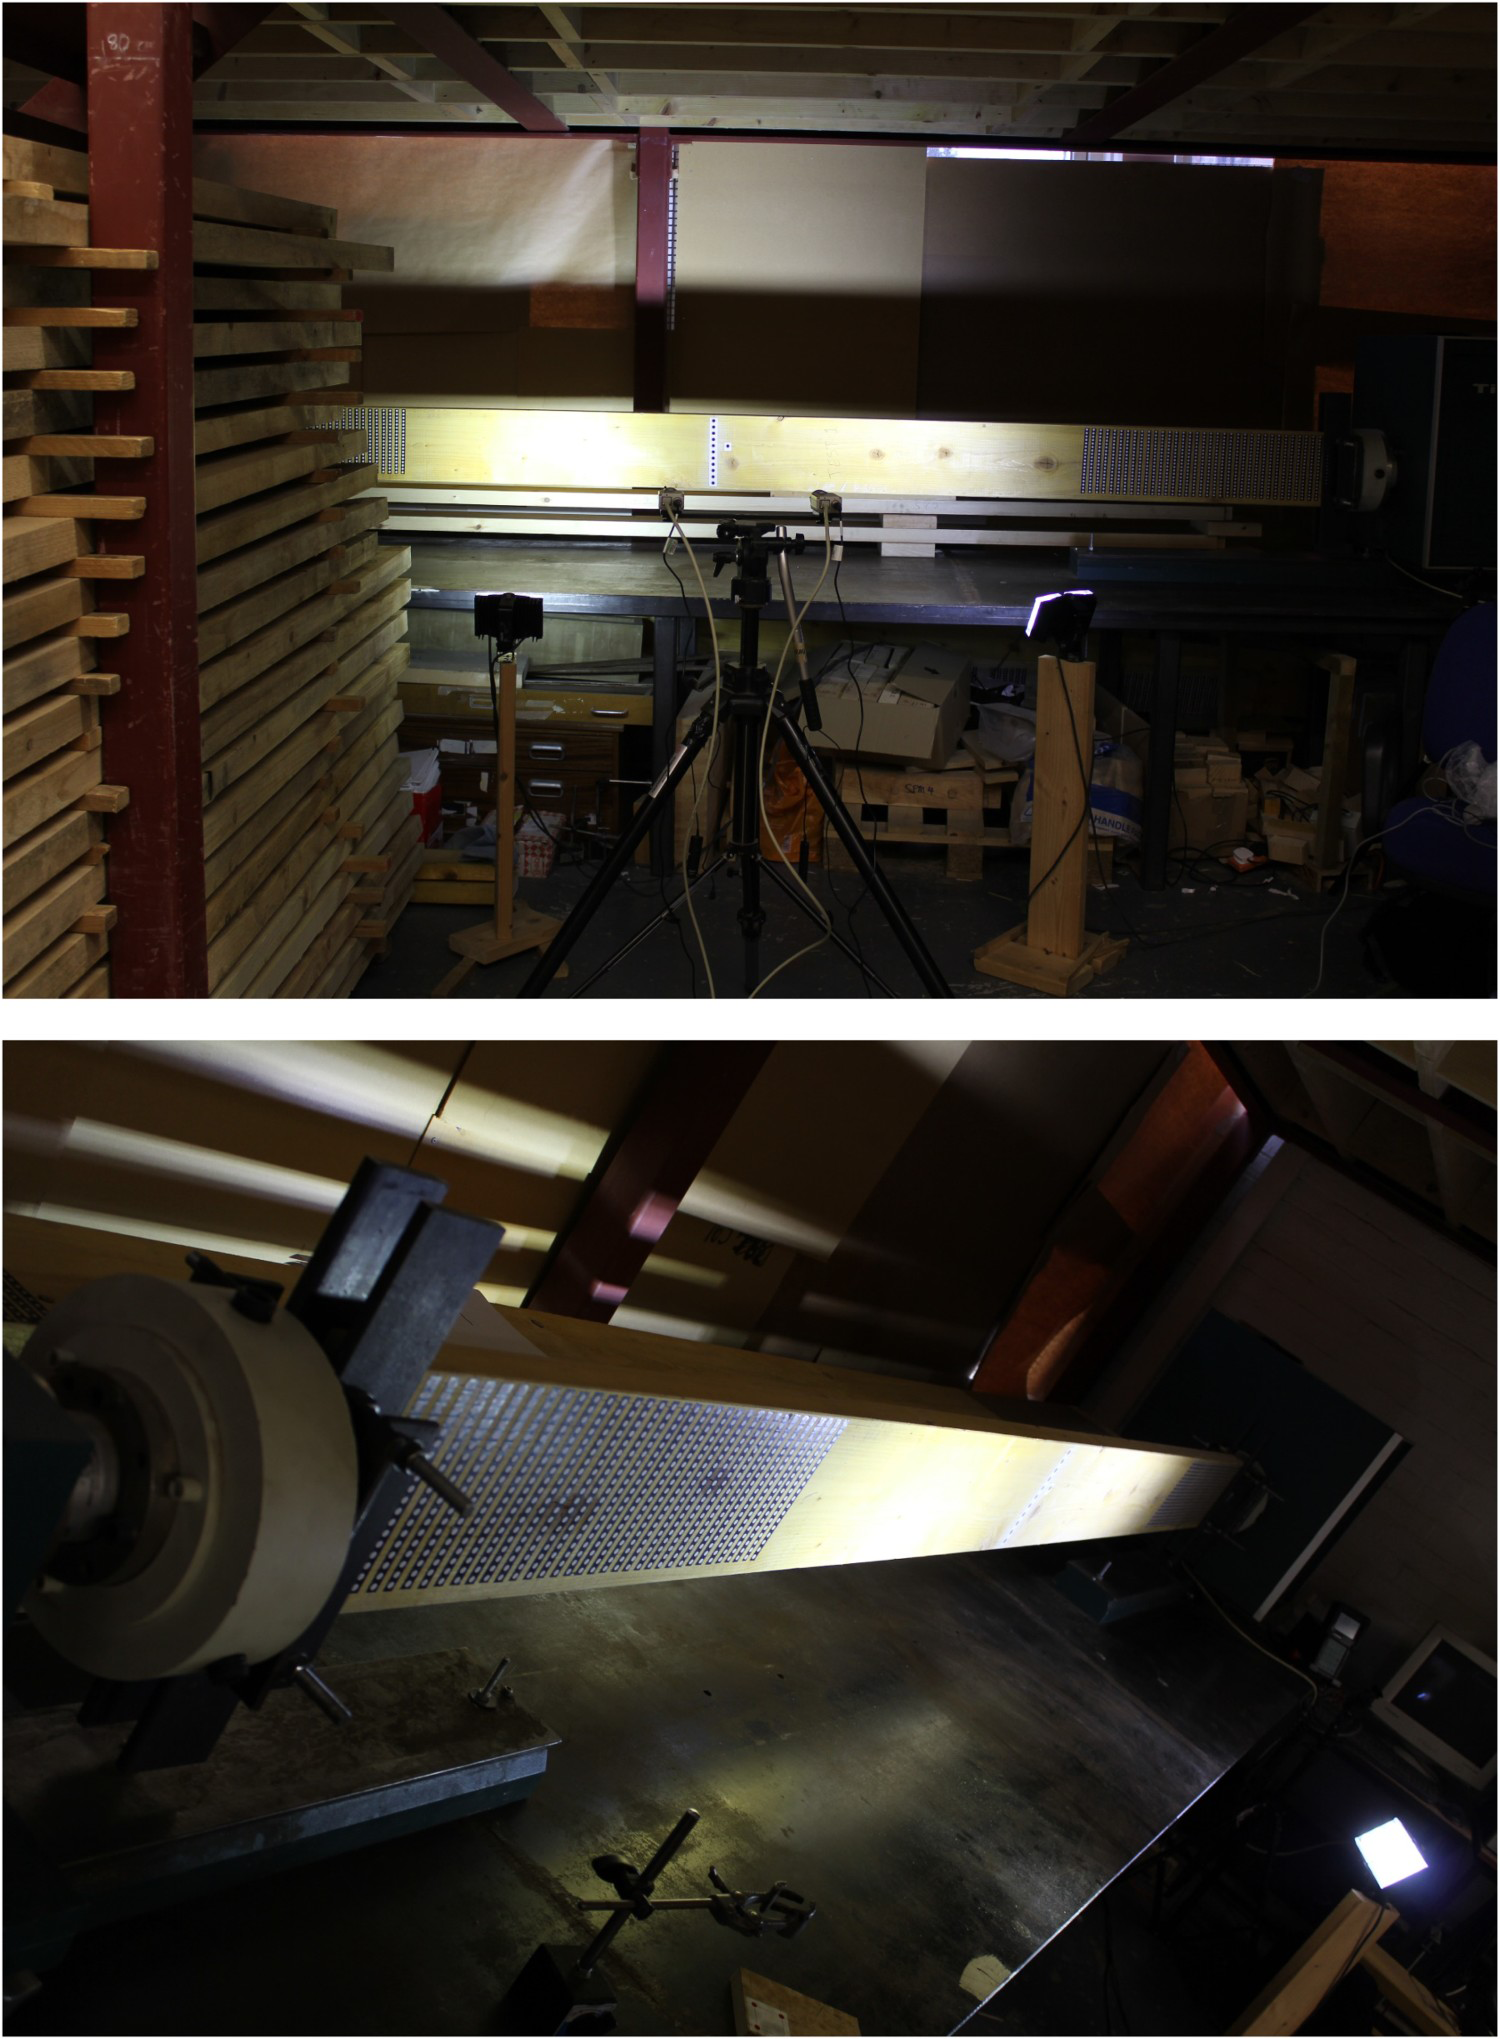
Before testing, the stereo camera system was calibrated using a standard calibration plate supplied by MVTec for use in HALCON, with a dimension of 100 mm × 100 mm. The calibration plate was placed on the plane where the measurements need to be done. As mentioned on the documentation of HALCON (Maas and Hampel, 2006), image pairs of the plate were acquired from the left and right cameras in 20 different positions and orientations (poses). Each pose is captured by left and right cameras simultaneously and relative to the camera system, as this is essential to triangulate points from the image pairs in 3D. The graphical user interface (GUI) implemented in the Microsoft Foundation Classes (MFC) by the authors of this research was employed for stereo camera calibration to extract the calibration parameters of the camera system during the calibration process. This was done by taking images of the plate from each camera of each stereo system simultaneously. A screenshot of the developed GUI during the process of calibrating the stereo camera system is shown in Figure 4. This GUI shows the extracted calibration marks from the two calibration images of the calibration plate acquired by the stereo cameras in the process of calibrating the stereo camera system.
Image of the developed GUI during stereo camera calibration.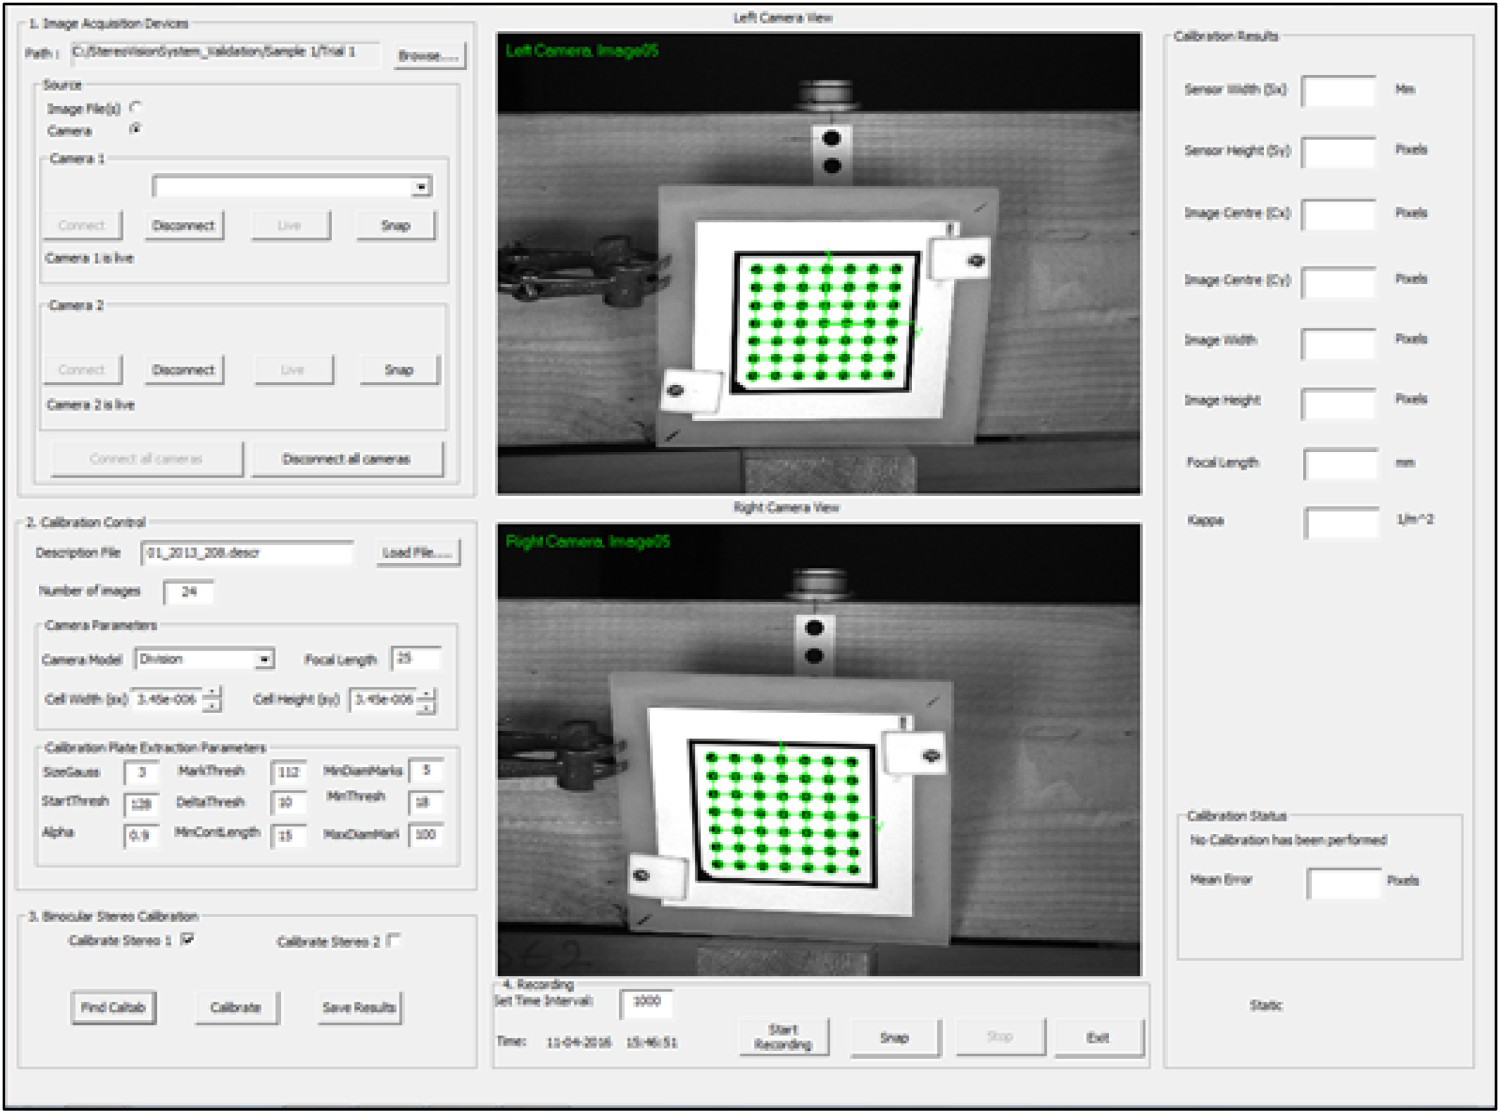
Once the two camera systems were calibrated and their internal and external parameters were saved, the torsion machine was then set to apply torque to the specimen. Using displacement control approach, torque was applied to all test specimens and the rotation angles of twist measured from the torsion tester were only used to control the application of the torque. All test specimens were tested three times at three different speed rates of 2° min−1, 4° min−1, and 6° min−1. For each of these rates of twists, each sample was tested similarly by applying a torque within the elastic range to the specimen until the torsion angle of the tester reached 30°. The same configuration of the stereo camera system used during calibration was also used while conducting the torsion tests. The load, time, and angular deformation measured from the inclinometers were then recorded through the data acquisition system. During the torque application, the implemented software was automated to record stereo images of the surface of the sample at a time interval of 5 s.
Experimental results and discussion
Calibration results of the optical system
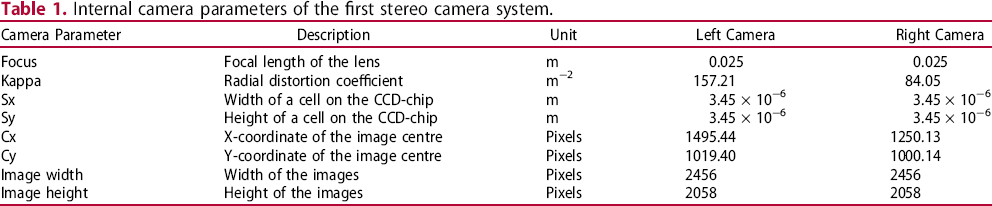
Internal camera parameters of the first stereo camera system.
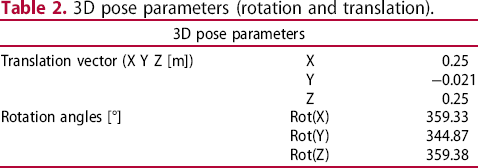
3D pose parameters (rotation and translation).
3D Reconstruction of the photogrammetric targets
The utilised photogrammetric approach is based on the comparison between two images acquired during the test, one before and after deformation. An algorithm was implemented in the HALCON software to process the stereo images and find the rotations of the targets acquired during the period of the test. The entire process was programmed in the software to be automated. A screen shot of the first part of this algorithm is shown in Figure 4. The initial steps in the algorithm involved reading the calibration files and displaying the stereo images of the timber sample recorded during testing. Based on their shape and size, the photogrammetric targets were determined and tracked from the two sequences of stereo images using the sub pixel-precise segmentation method. As can be seen in Figure 5, the detected targets were displayed on the graphic window of the interactive programming environment of HALCON, HDevelop. These targets were fitted to ellipse shapes and their image coordinates in both the left and right images were determined and ordered by a matching process. Using the image coordinates of the conjugate points and the camera parameters, the 3D coordinates (x, y, and z) of the targets expressed in the camera coordinates of the left camera were derived by intersecting the line of sight of the respective conjugate image points using the operator ‘intersect_line_of_sight’ based on the theory of triangulation (Hartley and Zisserman, 2003). These 3D data were then transformed into the object coordinate system, as defined in Figure 5. These coordinates were then used in the calculation of the rotations of the targets during the period of the tests.
The implemented HALCON algorithm for extracting the targets (a) and target extraction in HALCON (b).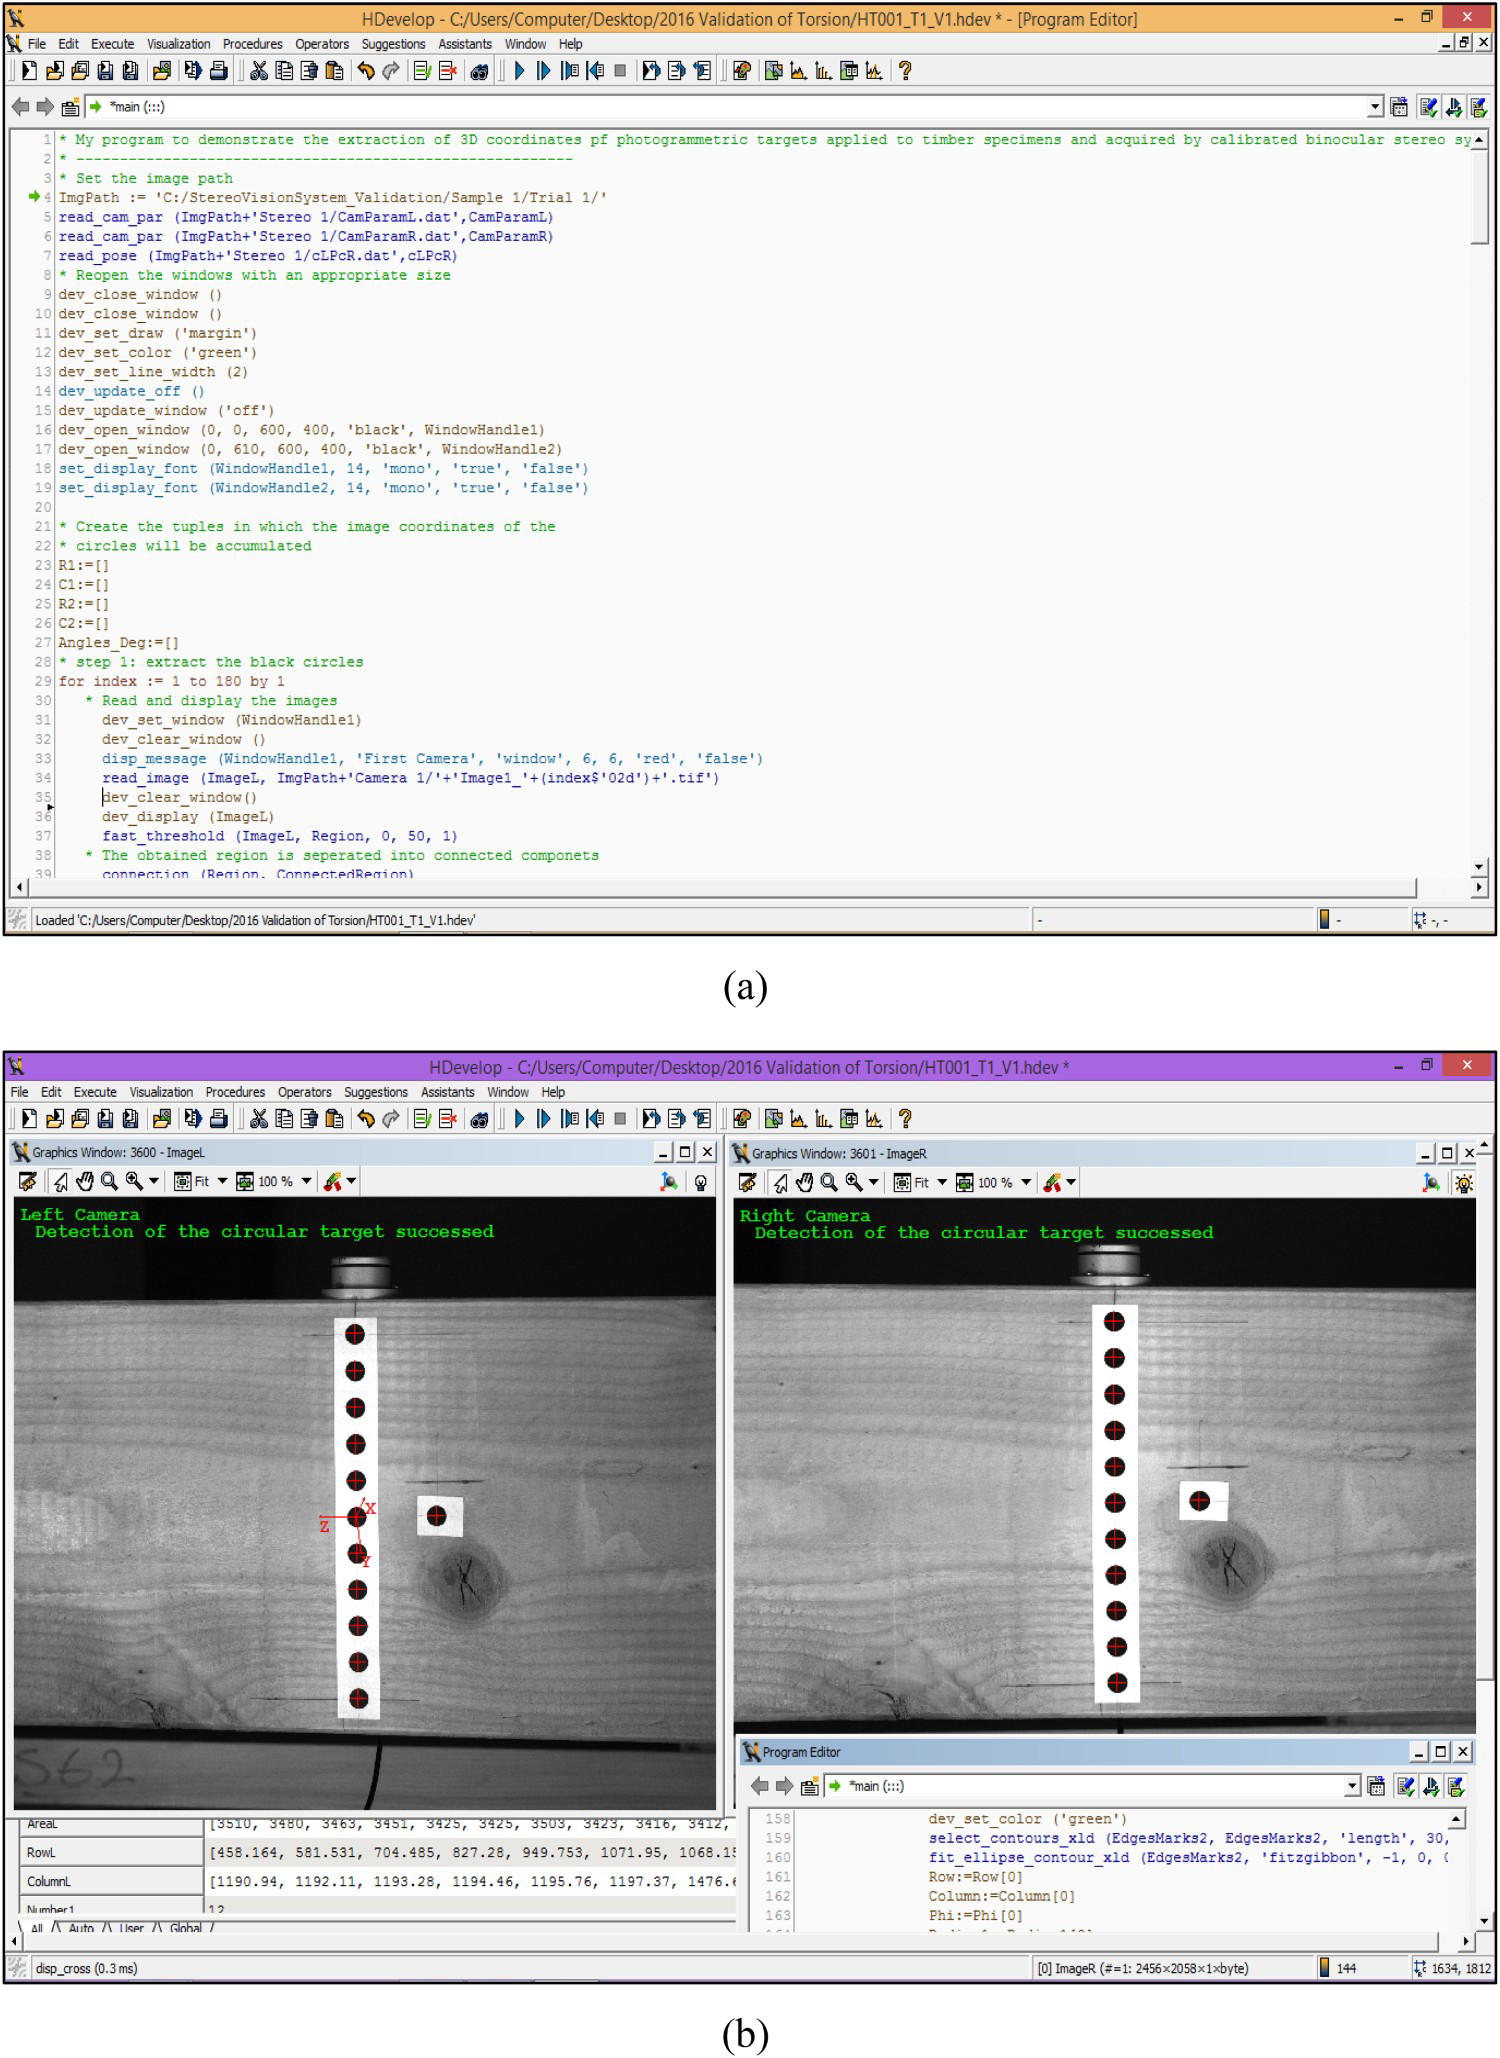
Comparison of rotation angles between the inclinometer and the photogrammetric approach
In this study, the torsion tests were conducted with the purpose to validate the stereo camera system as well as to investigate the influence of the rate of loading on rotation measurements on both short and long sides of the cross-section of test samples. Therefore, the photogrammetric system and the inclinometer were used for these measurements. Each test specimen was tested in torsion three times with three different speed rates of 2° min−1, 4° min−1, and 6° min−1.
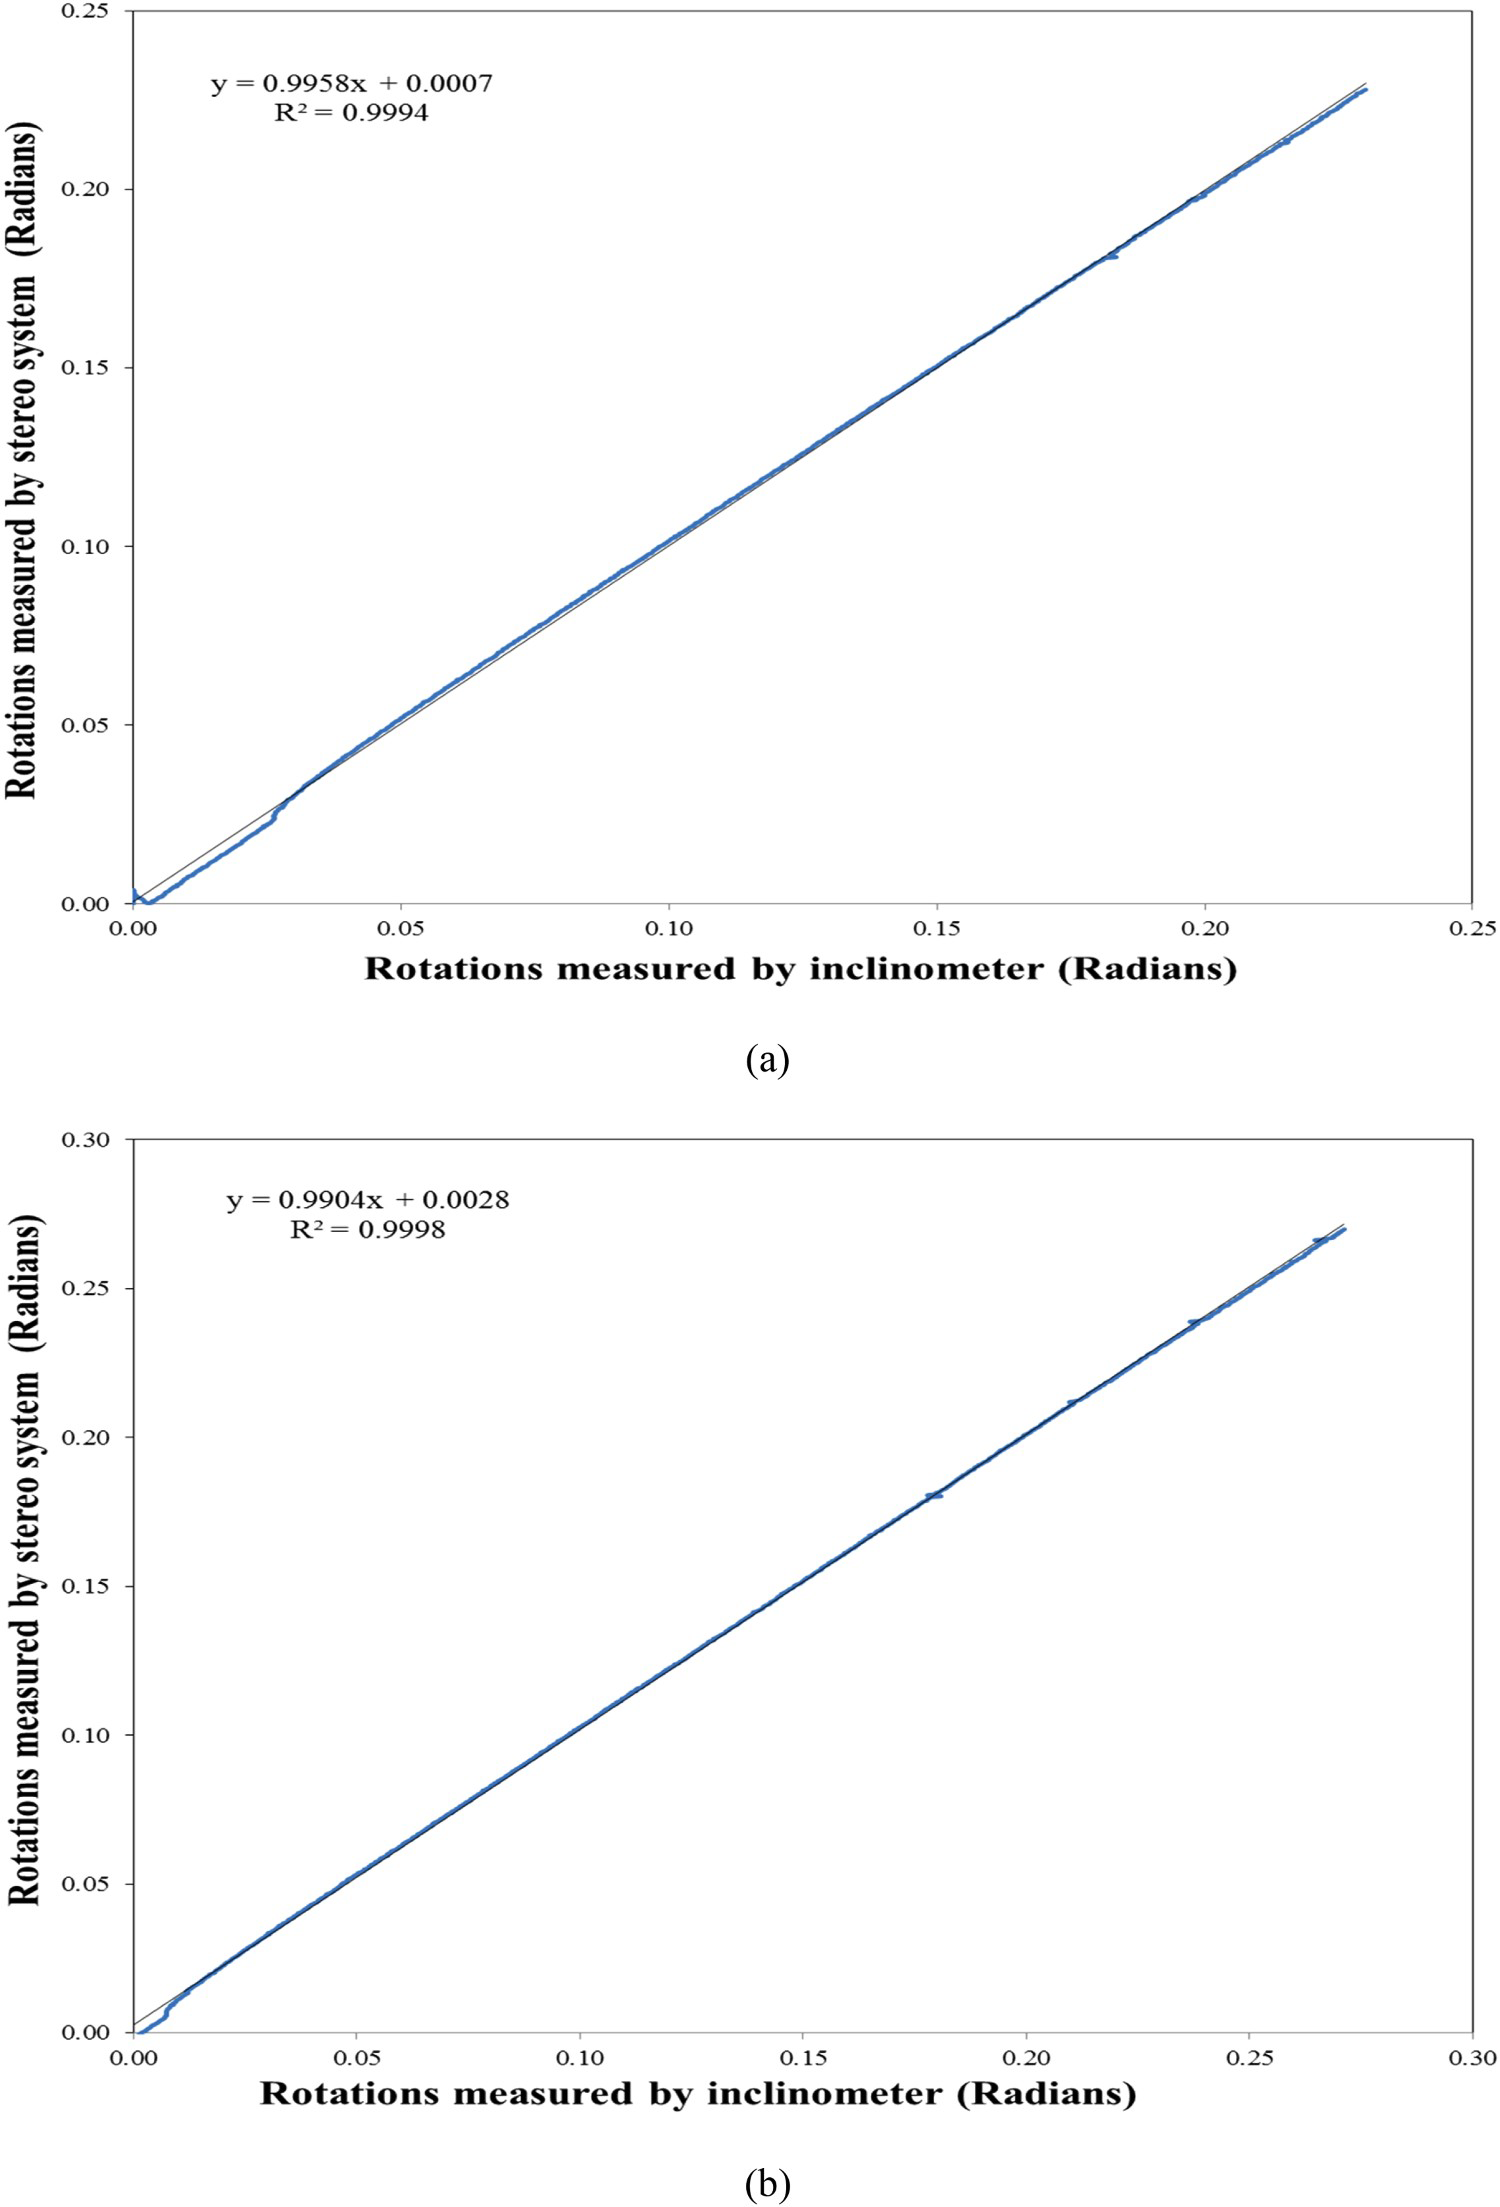
For each of the above-mentioned tests, the average rotations of the photogrammetric targets and the rotations of the inclinometer were plotted in the same figure. Test results for the slow speed rate (2° min−1) are shown in Figure 6. Figure 6(a) and (b) shows comparisons of rotational data between the inclinometer and stereo camera system for sample 1 and sample 2, respectively. Time is represented on the horizontal axis and values of rotation angles are represented on the vertical axis. The slow rate of loading test results in a good agreement between the rotation data measured by both methods and indicate remarkable results. It is evident that the measurements of rotations of the short side with inclinometers are acceptable. This result was confirmed by investigating the correlation between measurements of both the optical and inclinometer sensors. The rotation results of inclinometers and stereo camera systems were plotted against each other. Figure 7(a) and 6(b) shows the comparison of these data for the first and second beams, respectively. Using linear regression analysis, the test results shown in the above-mentioned figures indicate a high degree of correlation with a value of R2 equal to 0.99.
Comparison between the inclinometer and optical measurements for sample 1 (a), and sample 2 (b) under a speed rate of 2° min−1. Relationship between measurements of the inclinometer and the optical system (R2 Values) measured in sample 1 (a) and sample 2 (b).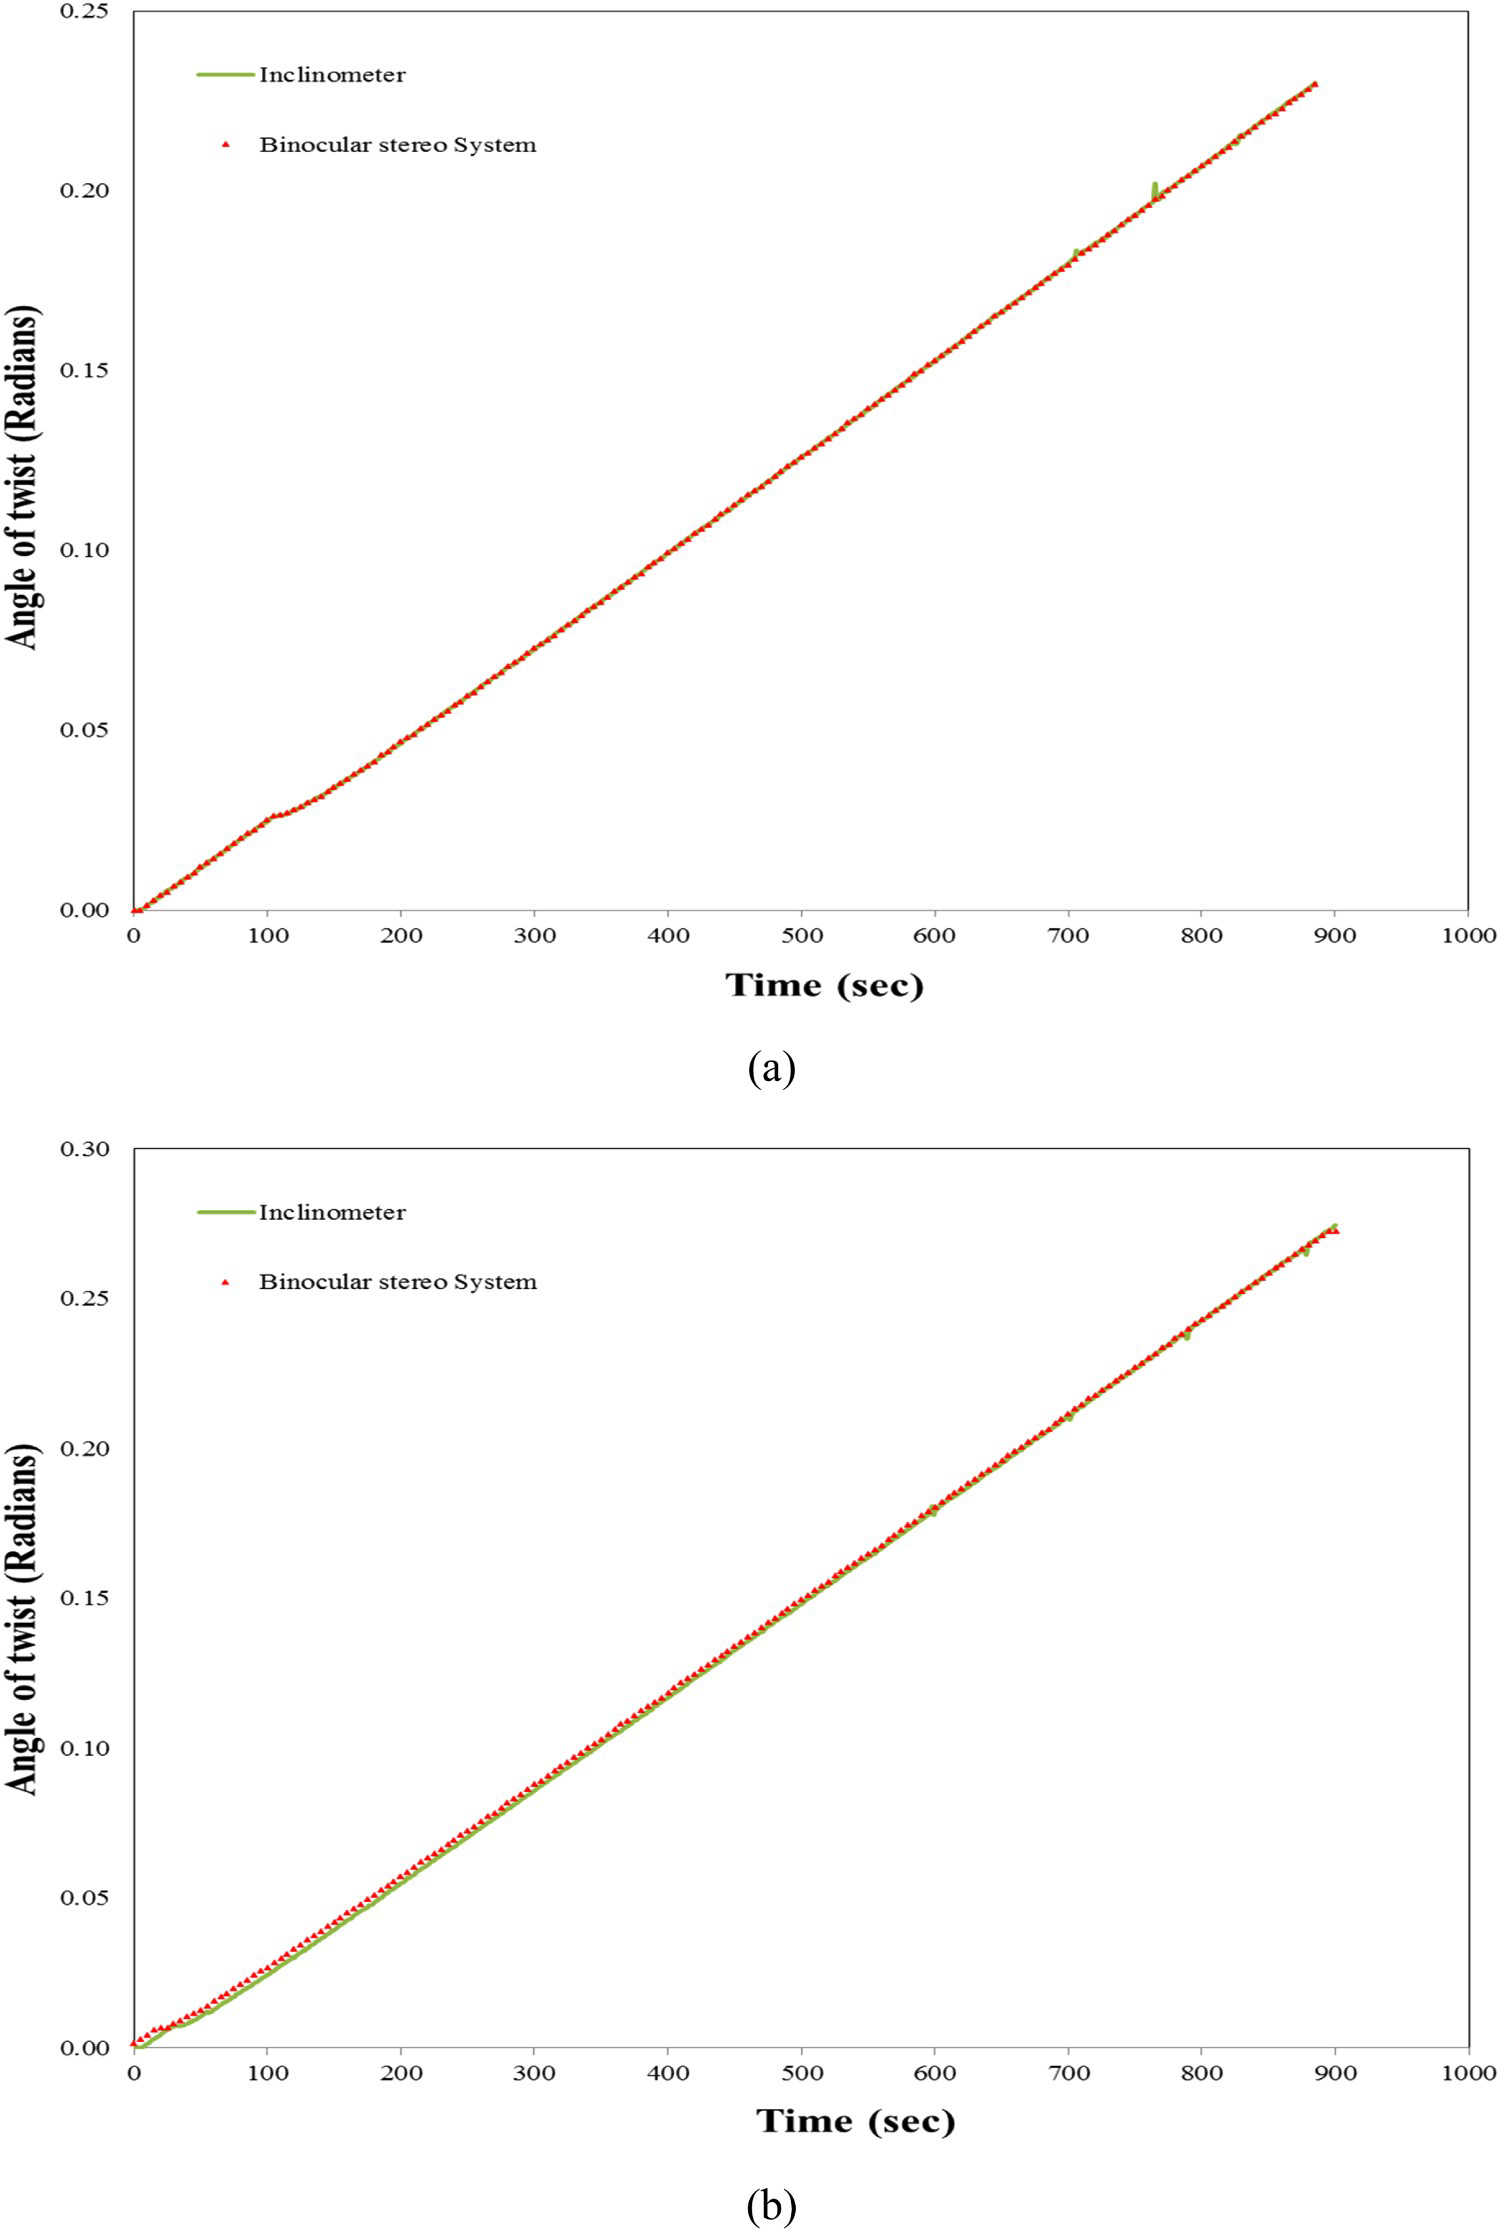
For the torsion test with the speed rate of 4° min−1, the comparison between rotations measured by the inclinometer and those determined by the camera system show similar results of the speed rate of 2° min−1 test. There is no significant difference between rotation angles recorded by the inclinometer and those measured by the photogrammetric system. Figure 8(a) shows an example of these comparisons for the first specimen and indicates a remarkable correspondence. In this figure, the rotations obtained from the two camera system accurately describe the measured rotations using the inclinometer sensor which highlights the efficiency of the proposed approach. The correlation figures between the rotation measurements of both the optical and inclinometer sensors indicate a high degree of correlation between the two-method used for angular measurements.
Comparison between inclinometers and optical measurements for sample 2 under a speed rate of a4° min−1 (a)and 6° min−1 (b).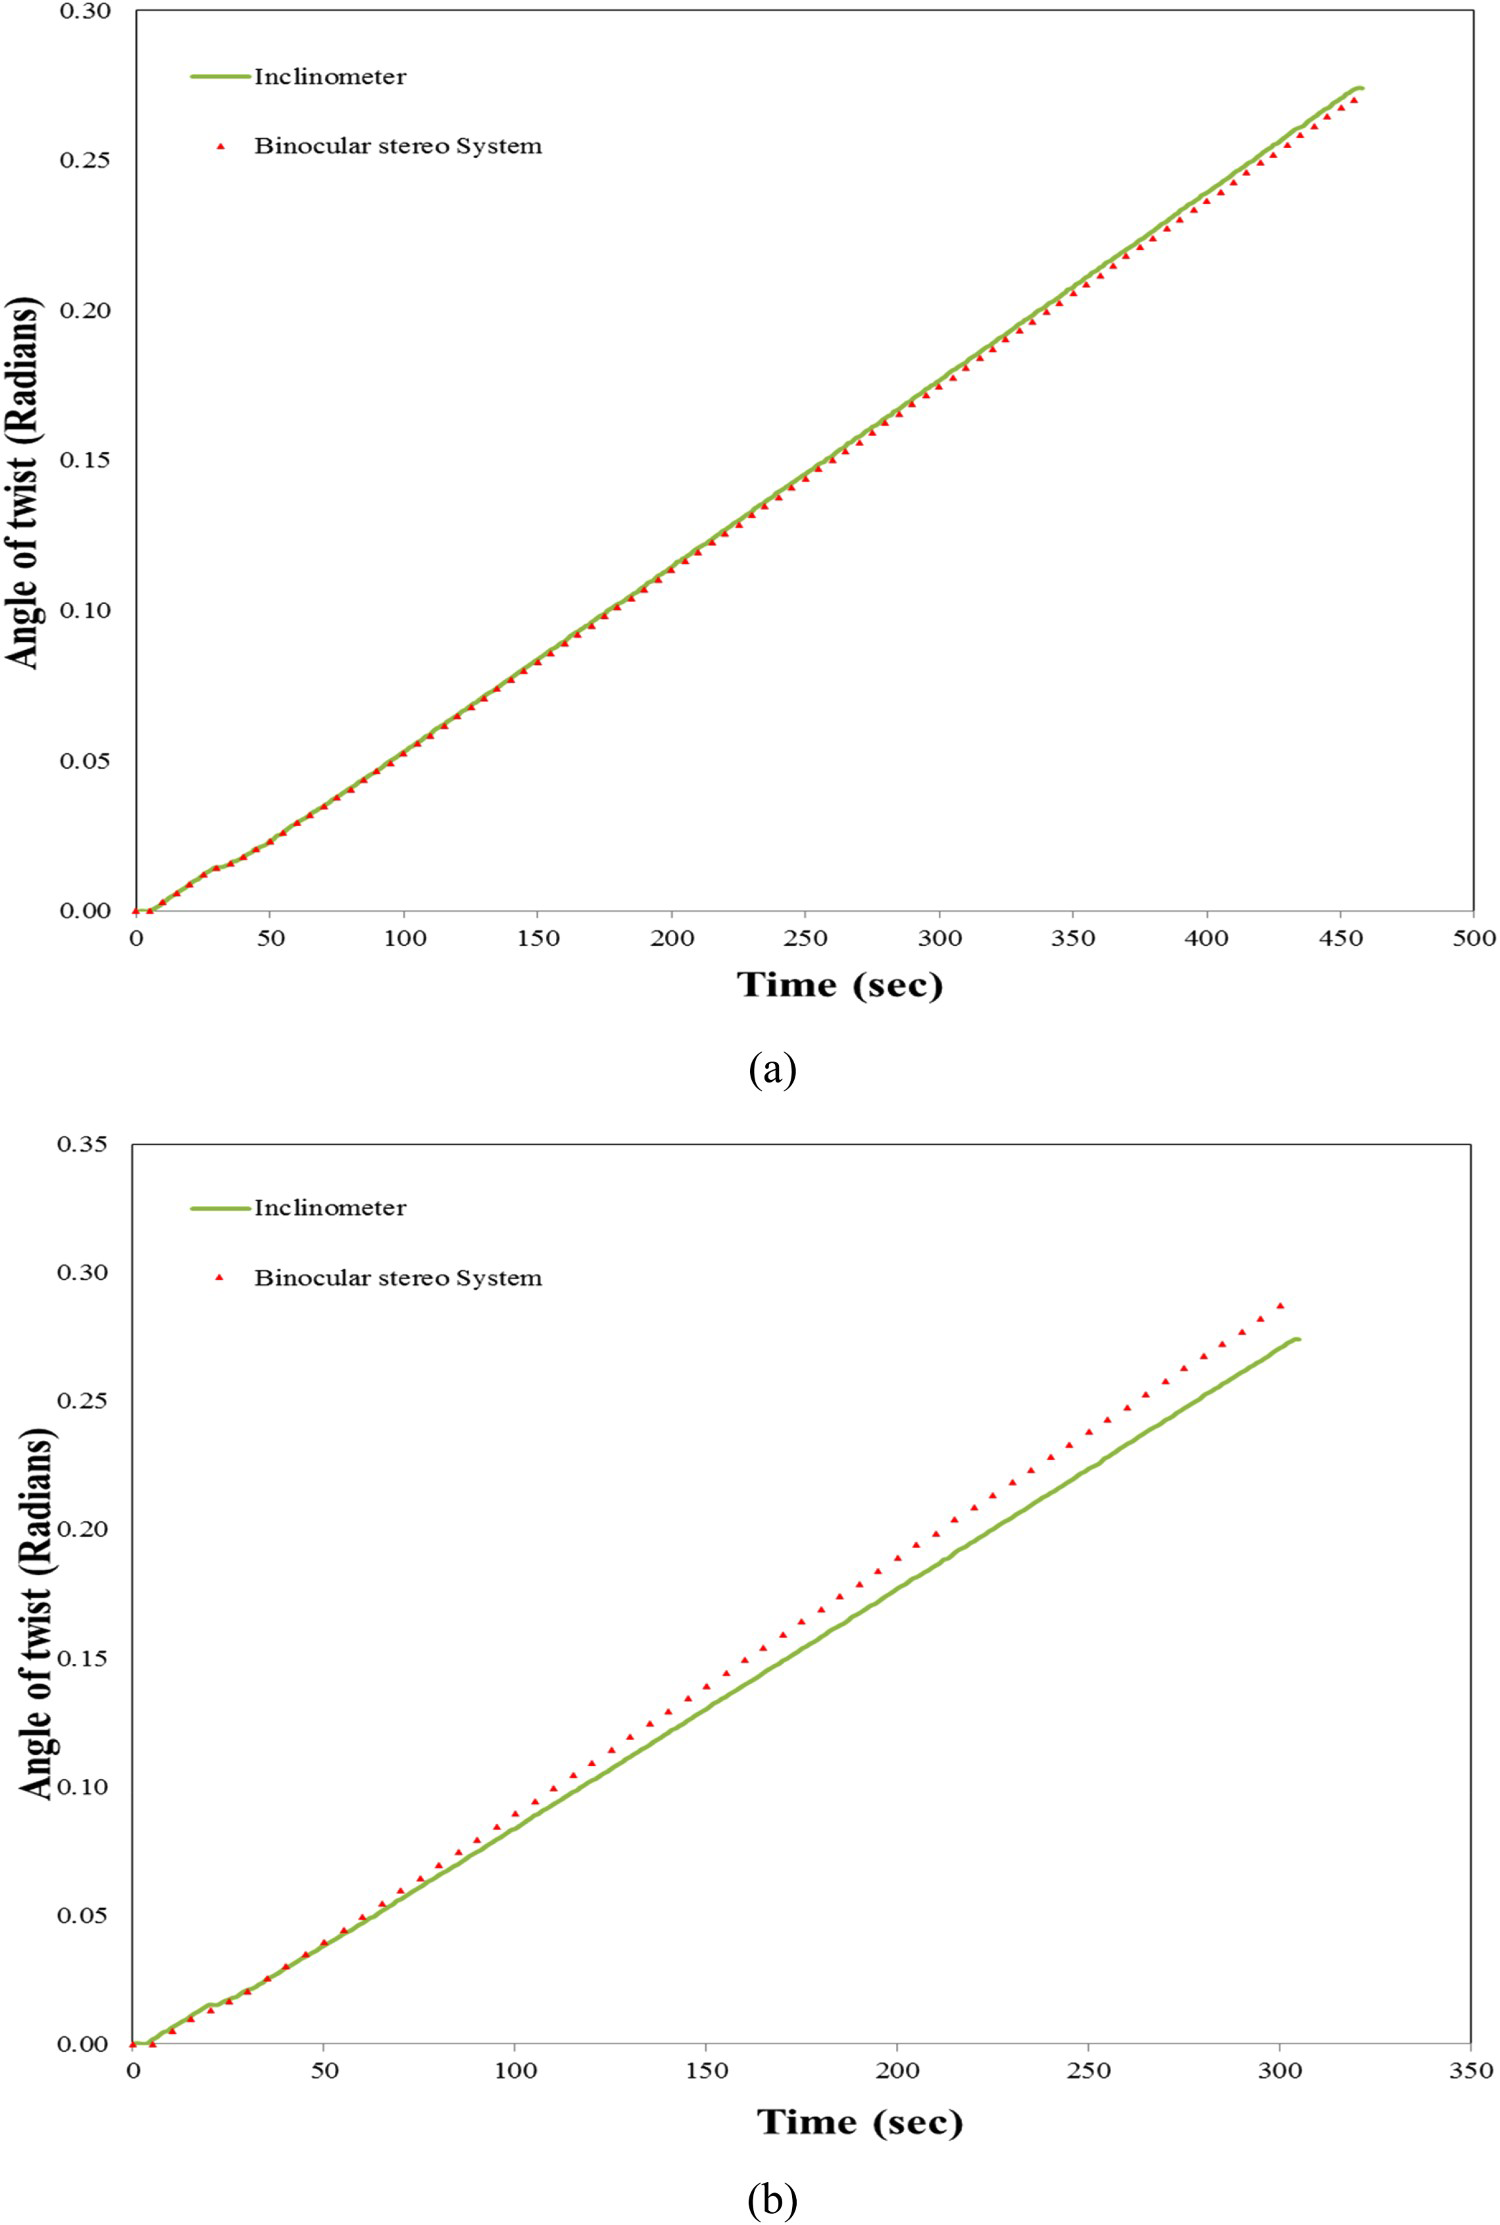
On the other hand, the test results for the highest rate of loading (6° min−1) are of considerable importance. As shown in Figure 8(b), the rotation measurements obtained from the photogrammetric system and the inclinometer reading were plotted on the same figure. Although the rotations measured by both techniques followed a similar trend, there is a significant difference between their measurements. At the beginning of the applied loading and within the first 100 s, the rotation measurements for both the inclinometer and the photogrammetric targets were almost the same, but the magnitudes of those measured by the inclinometer decreased dramatically, especially after the first 100 s of conducting the torsion test. This may be attributed to the fact the inclinometer readings under a higher rate of loading might be influenced by the setup of this device on the wood specimen and the pins used to attach this sensor might move during loading. Further research needs to be conducted to investigate this result. By comparing the results of the three rates of loading tests, the maximum difference between the measurements of the inclinometer sensor and the photogrammetric method was about 7%. This result could be related to the setup of the inclinometer sensor since this device is installed in contact with the surface of the timber specimen and this sensor might move significantly at the highest speed rate of 6° min−1.
Conclusion
This research describes the proposed cost-effective and non-contact photogrammetric approach and investigates its ability to evaluate the torsional material properties of timber and timber-based composite beams. This technique overcomes the limitations of traditional contact devices which only measure the angular deformation on a restricted number of points of the surface of the torsion specimens and can be destroyed during destructive tests. The validation of the proposed approach was accomplished by comparing the measurements of the photogrammetric targets acquired by a stereo camera system with those measured by the traditional sensor, the inclinometer. The following results were found.
Each test specimen was tested in torsion three times with three different speed rates of 2° min−1, 4° min−1, and 6° min−1. The test results for the slow speed rate (2° min−1) provided a good agreement between the rotation data measured by the two methods and indicate remarkable results. The correlation figures between the rotation measurements of both the optical and inclinometer sensors indicate a high degree of correlation between the two-method with a value of R square equal to 0.99.
The test results for the speed rate (4° min−1) showed similar results of the speed rate of 2° min−1 test as there is no significant difference between the rotation angles recorded by the inclinometer and those measured by the photogrammetric system. The correlation figures between the rotations obtained from the two sensors indicate a high degree of correlation as the rotation measurements of the optical sensor describe very well those measured using the inclinometer sensor.
The test results for the highest rate of loading (6° min−1) revealed that although the rotations measured by both techniques followed a similar trend, there is a significant difference between their measurements with a maximum difference between the measurements of the two methods of about 7%. These results are of considerable importance and the difference between the two measurements may be attributed to the fact the inclinometer readings under a higher rate of loading might be influenced by the setup of this device on the wood specimen and the pins used to attach this sensor might move during loading. The experimental results showed that the readings measured by the inclinometer sensor were mostly influenced by the setup of this device when mounted on timber since this sensor is installed in contact with the surface of the timber specimen and it might move significantly at the highest speed rate of 6° min−1. Therefore, further research needs to be conducted to investigate this result.
Footnotes
Acknowledgements
The authors would like to express their special gratitude to the supports from the British Council and Ministry of Education, China (UK–China-BRI Countries Education Partnership Initiative), Lawrence Ho Research Fund, Royal Academy of Engineering-Visiting Professor (VP2021\7\12), Royal Academy of Engineering-Industrial Fellowship (IF\192023), and the Scottish Funding Council.
Disclosure statement
No potential conflict of interest was reported by the author(s).