
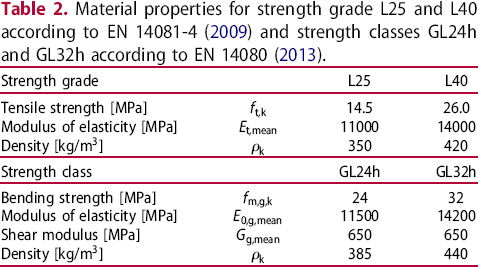
Abstract
This paper presents large-scale bending test, up to 19 m length, on glued laminated timber (GLT) beams with well-known beam setup and a model to predict the tensile strength of finger joint connections (FJ). Machine graded timber boards, with information about the dynamic stiffness and local knottiness were used to fabricate 12 GLT beams. The position of the timber boards were tracked throughout the GLT fabrication. To quantify the quality of the FJ additional FJ were fabricated and tested in tension. Based on the results, a model to predict their strength properties based on the grading information of the involved timber boards was developed using maximum likelihood estimation for censored data.
Keywords
Introduction
Glued laminated timber (GLT) is an engineered wood products composed out of timber boards glued together. GLT is characterized by excellent mechanical properties, such as a high strength-weight ratio. The mechanical properties of GLT result from (i) the properties of the used timber boards, (ii) the geometrical arrangement of the timber boards and the finger joint connections (FJ), and (iii) the quality of the fabrication process; incl. the quality of the FJ.
Timber boards demonstrate a large variability of their mechanical properties, which can be observed between the individual timber boards and within each particular timber board. The variability results from the growing and sawing characteristics. Within the timber board, the variability is mainly characterized by the presence of knots (see e.g. Isaksson 1999; Fink and Kohler 2011). For the GLT fabrication, graded timber boards from one or more strength classes are used. Through the grading process, the variability of the timber board properties is reduced, however, they are still large. The arrangement of the timber boards within a GLT beam is random, thus multiple local weak section might be located above each other, resulting in additional strength reduction.
Beside knots also FJ are local weak sections, as their strength properties are smaller compared to the adjacent knot-free wood, whereas the stiffness properties are similar (see e.g. Heimeshoff and Glos 1980; Ehlbeck et al. 1985). The tensile strength of FJ results from the material properties of the connected timber properties and the quality of their fabrication. The influence of FJ on the load-bearing capacity of GLT has been investigated by several authors: e.g. Colling (1990), Blaß et al. (2009), Falk et al. (1992), Johansson (1990), and Schickhofer (1996). The studies show a large variety of the number of FJ-failures, however, they indicate that FJ are more relevant for higher strength classes (Fink et al. 2015).
The complexity of the mechanical behaviour of GLT beams has recognized several decades ago. Accordingly, numerous of experimental investigations have been performed (e.g. Falk et al. 1992; Falk and Colling 1995; Gehri 1995; Schickhofer 1996) and several models to predict the mechanical properties have been developed (e.g. Foschi and Barrett 1980; Colling 1990; Blaß et al. 2009; Fink et al. 2015; Kandler et al. 2018) Some of the experimental studies have been performed on GLT beams with known beam setup; e.g. Ehlbeck and Colling (1987a, 1987b) recorded the position of the timber boards and knots of the lowest 2 lamellas, Fink et al. (2015) and Kandler et al. (2018) recorded the entire beam setup based on machine grading information. Nevertheless, so far none of these tests have been performed on large-scale tests, which are needed for the validation of GLT models.
In the present study, experimental investigations on GLT beams with well-known beam setup up to a length of 19 m are presented. The tests are a continuation of the experimental investigations presented in Fink et al. (2013, 2015). The GLT beams were fabricated out of machine graded timber boards and the entire grading information was tracked during the beam fabrication. From the graded timber boards additional FJ were fabricated and tested. Based on the test results, a model to predict their strength properties based on the grading information from the adjacent timber boards was developed. For the model a maximum likelihood estimation for censored data has been used.
The investigations presented in this study can serve as a basis to validate new and existing models that estimates the load-bearing behaviour of GLT beams. The layup and the fracture pattern of all tested GLT beams is available at the ETH Research Collection (Stadelmann et al. 2021.).
Material and methods
Specimen
 ) and a knot indicator based on X-ray scanning (denoted
 ) are measured. By using these two indicators the strength and stiffness properties of timber board sections can be estimated according to the material model presented in Fink (2014).
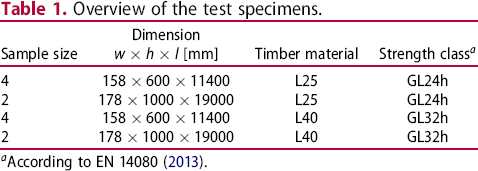
Overview of the test specimens.
 [mm]
[mm]
 According to EN 14080 (2013).
The arrangement of the timber boards within the GLT beams is random in order to reproduce a general manufacturing procedure. However, the position of the boards was tracked and thus GLT beams with well-known beam setup were fabricated; i.e. GLT beams where the exact position of each FJ and each timber board (and thus the indicators
Setup of the GLT beam (GL24h-11m-1). (top)
 ,
,
 of each timber board section) are known. In Figure 1, an example of one GLT beam is illustrated.
 values of each timber board section (grey scale) and FJ (black lines). (bottom) Dynamic modulus of elasticity
 (grey scale) and FJ (black lines).
 ).
).
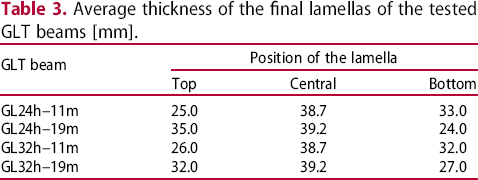
Average thickness of the final lamellas of the tested GLT beams [mm].
The moisture content was not explicitly measured for each specimen. However, it can be said that the timber boards had been stored in a conditioned room (for the standardised fabrication procedure) before the GLT fabrication. Afterwards, they were wrapped in plastic film and transported to the laboratory of the ETH Zurich. Once the GLT beams are unpacked, they are tested within maximally five days. In the construction hall, the surrounding temperature was about 20–25
 C and the relative humidity between 30% and 40% during the testing period.
Test setup & test procedure
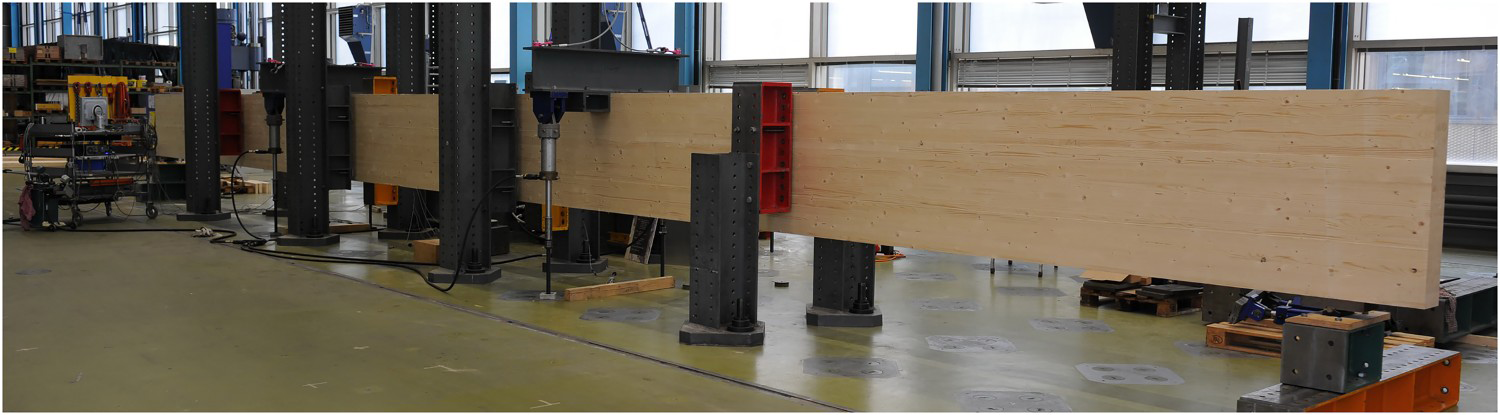
The experimental investigations were performed according to EN 408 (CEN 2003). The GLT beams were loaded with four hydraulic cylinders. At both points of load application, two cylinders were fixed to the floor as well as to a steel profile that lies on top of the GLT beam (see Figure 2). At first the GLT beams were loaded with the self-weight of cylinder and the traverses (approx. 10 kN). While the displacements were already recorded in this process, the weight of the traverses is added to the total force exerted by the cylinders in the evaluation. After the traverses were placed, the GLT beams were loaded with multiple load cycles that generally follow the same pattern for all GLT beams: In the first load cycle, in order to release constraining forces, all GLT beams were loaded up to a load of
Experimental investigation of one 19 m long GLT beam. and unloaded afterwards to a remaining load of
 . The second load cycle intends to provide the data to determine the bending stiffness of the beam. Thus, the load of this cycle should at least be 40% of the ultimate load
 , which was estimated in advance. After the GLT beams were unloaded again to a remaining load of
 , the measuring equipment for the local displacement are removed. Finally, the beams are loaded up to failure.
 ) the loading criterion
 sec was met. For the longer beams (
 ), the time of the last cycle exceeds this limit, as a reduced loading rate was required for the upper load range (
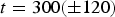
 ). However, the load was applied with a more or less constant load rate in all tests. The time until failure of the final load cycle is summarized in Table 4.
Compilation of the test results.


 Time until failure of the final load cycle.
 global bending stiffness calculated with
 .
.
 global bending stiffness calculated with
 .
.
 Number of damaged lamellas.
 Type of failure in the
 ,
,
 , and
, and
 lowest lamella; knot cluster: KC, clear wood: CW.
 Time until the first crack.
Finger joint connections
In addition to the experimental investigations of the GLT beams also 40 FJ were investigated. The timber boards were randomly selected during a GLT fabrication and cut and finger-jointed directly after. Thus, most of the specimens were composed of two parts of the same timber board while the other specimens consist of two different timber boards. Prior to the FJ fabrication every timber board was marked, thus the grading parameter
 of both timber parts were known.
The FJ connections were tested in tension; using the tensile testing machine at the Neue Holzbau AG. The performed tests had two significant differences to the requirements presented in EN 408 (2003): The free testing length was smaller (the distance between the clamping jaws
 ) and the tensile force was already reached after approximately 5 seconds. The main purpose of the tests was the investigation of FJ and not quality control, thus the shorter testing length seems to be appropriate. However, the significant higher loading rate might influence the test result. For a detailed description of the test setup, it is refereed to Fink et al. (2018).
Test results – GLT beams
Bending strength
The bending strength of the investigated GLT beam is calculated according to EN 408 (2003). The ultimate load
 is defined as the maximum load applied during the test.
 is not necessarily equal to the load from the initial crack, although this is usually the case. For the specimen GL32h-19m-1
 kN occurred after the first crack F=375 kN.
In Table 4, a compilation of the ultimate load and the estimated bending strength of all specimens is given. Figure 3 (left) shows the cumulative distribution functions (cdf) for strength classes GL24h and GL32h, with
 , as recommended in JCSS (2006). The results show a wide agreement with the proposed values but also indicate a slightly smaller variation. One GLT beam of the upper strength class had a significant lower bending strength compared to the other, even its bending stiffness was the highest of all tested beams. The low bending strength results from a timber board with compression wood (see also Section “Fracture pattern”). The low realization of this beam shows the importance of efficient grading methods as well as the potential of improved criteria.

 .
.Bending stiffness
The global bending stiffness
 is estimated from the vertical displacement in the center of GLT beam (measured on the top side), calculated from the second load cycle
1
.
is estimated from the vertical displacement in the center of GLT beam (measured on the top side), calculated from the second load cycle
1
.
 determined from the top side of the beam is slightly higher compared to the one determined from the lower side, however, the maximal difference is 3%. For the 11.4 m long beams also the local bending stiffness
 was estimated based on the mean local displacement of the neutral axis over a length
 mm.
mm.
In Table 4, the local and global bending stiffness (with
 and
and
 ) are summarized. Figure 3 (right) shows the cdf for both strength classes, with
 , as recommended in JCSS (2006). On average the stiffness seems to be appropriate, however, the variation of the bending stiffness is obviously significantly smaller as proposed.
Fracture pattern
In addition to the mechanical properties also the fracture pattern were analysed in order to get a better understanding of the load-bearing behaviour of the GLT beams. This was done visually by identifying the fracture line (Figure 4), counting the number of damaged lamellas (Table 4), and determining the type of failure of the lower three lamellas (Table 4).
Setup of GL32h-11m-1 with the fracture pattern:
 values (greyscale) and FJ (black lines). The fracture pattern on the surface are illustrated with the red line. The dashed red line illustrates the fracture pattern on the opposite beam surface, if different (Stadelmann et al. 2021).
The fracture line was determined mainly from visible cracks on the surface of the GLT beams. It has to be noted that, the visible cracks do not always represent the failure within the cross-section.
The initial crack of all GLT beams corresponds to a typical bending failure, having local tensile failures in the lower lamellas. Between the local tensile failures of the lamellas shear failure were observed, delamination of the lamellas was rarely identified. The tensile failure of the lowest timber boards was categorized into three groups:
Knot cluster (Figure 5(a)): Tensile failure of the lamella within a knot cluster. A knot cluster was defined as a timber board section with
Finger joint (Figure 5(b)): Tensile failure within the area of a FJ. Clear wood (Figure 5(c)): Tensile failure within a timber board section with
Type of failure of the timber boards within the GLT beams. (a) knot cluster, lowest lamella GL32h-11-3 (b) FJ, 3rd lowest lamella GL32h-11m-1, (c) clear wood, 2nd lowest lamella GL24h-11m-2.
 .
. .
.
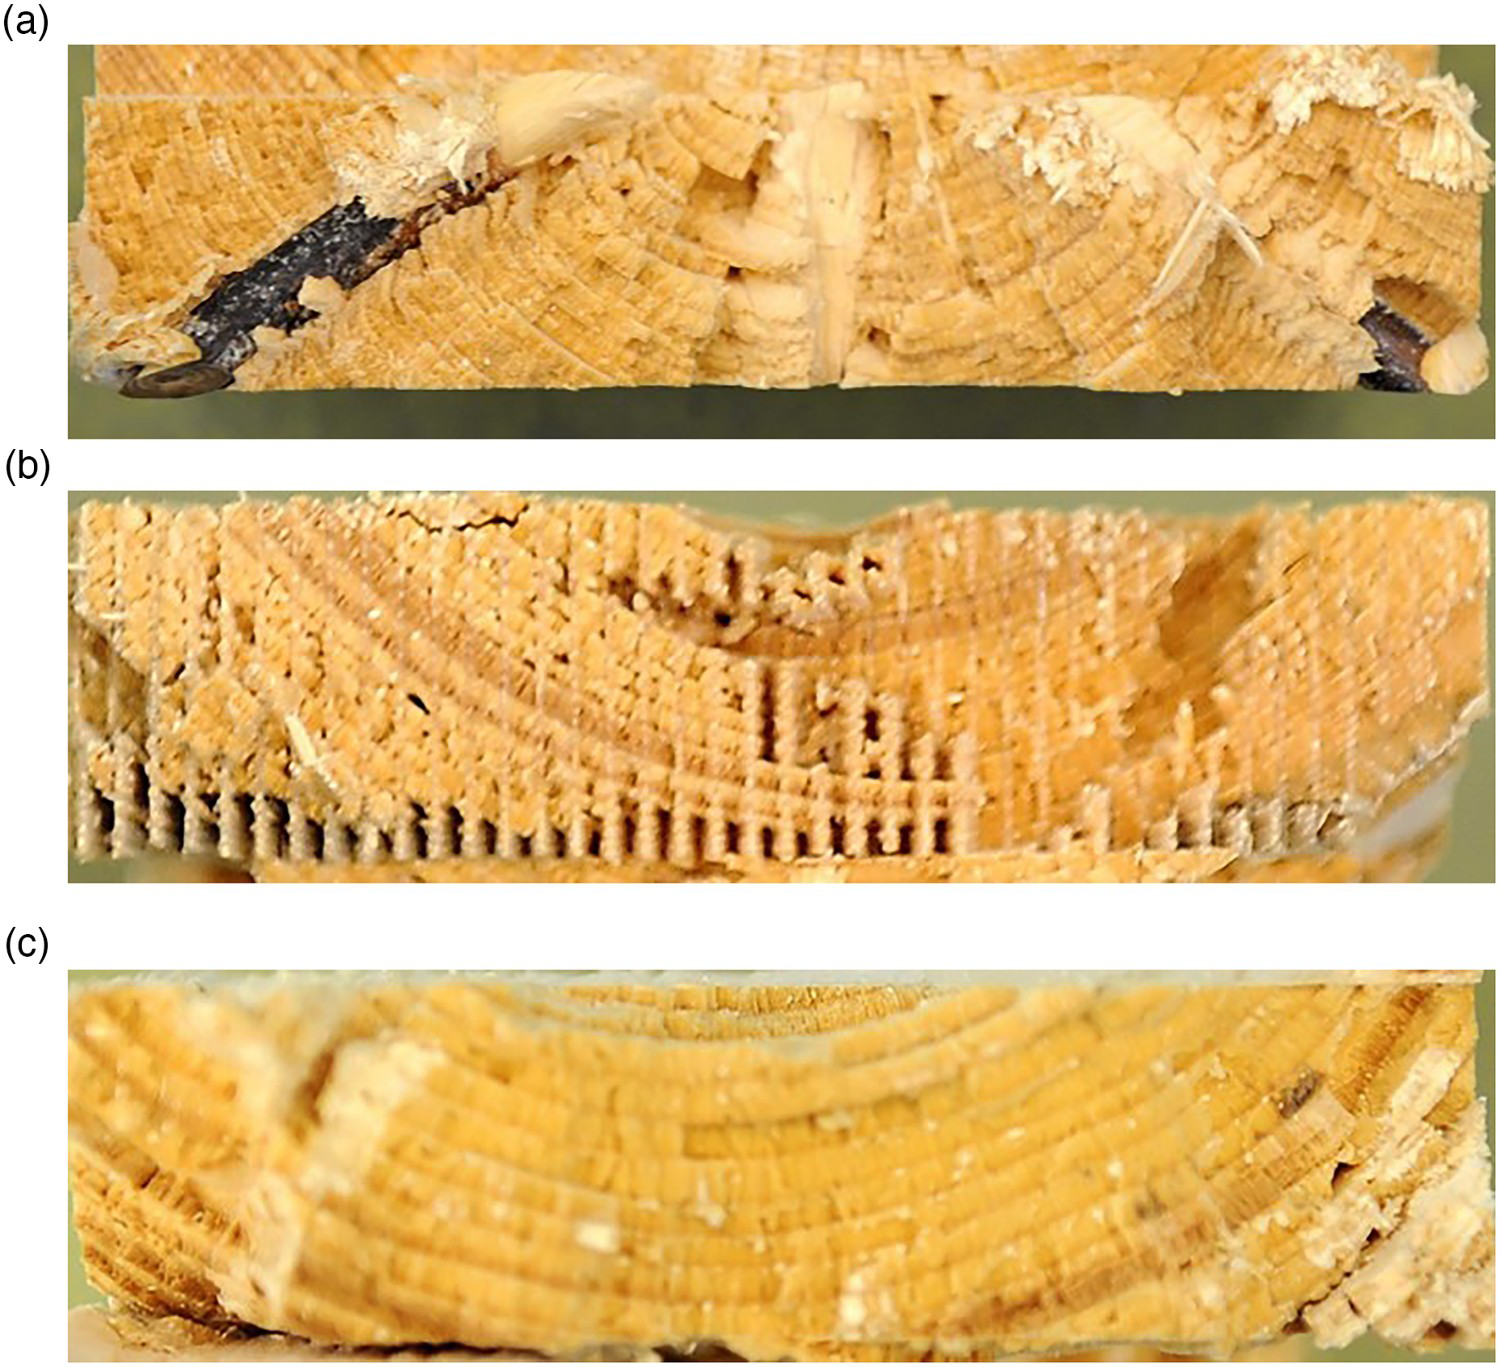
In many cases, the lamella failed as a combination of the above-mentioned types of failure. Those presented in Table 4 were the preeminent type of failure, identified from the ratio of the failed cross-section. For the visual inspection, the failed sections were cut out of the GLT beam.
As expected knot clusters has been the most relevant criteria for GLT beams of the lower strength grade. In this study, in all six GLT beams, the failure of the lowest lamella was at a knot cluster. For the higher strength class, the observed type of failures was more diverse, all three types of failure occurred. Although the number of test specimens is small, it is remarkable that very few failures in a FJ section occurred. Only in two beams (GL32h-11m-1, GL32h-19m-1) a FJ failure was observed in the lowest three lamellas. This can either be a result of the good quality of the FJ or also due to the fact that the number of FJ placed in the most loaded area is rather small for some specimens.
As mentioned earlier, specimen GL32h-11m-4 showed a conspicuously low bending strength compared to its bending stiffness. The failure of this beam was located in a knot cluster (lowest lamella) and a clear wood section (in the second lowest lamella). The failed timber board of the second lamella had a comparably high
 value. However, a closer look at the fracture pattern indicate compression wood, resulting in a significantly reduced tensile strength compared to normal wood. The comparable low bending strength of this particular GLT beam shows the importance of efficient strength grading and that, even for large GLT beams, one single timber board can result in a significant strength reduction. Furthermore, the example highlights one of the difficulties for predicting the bending strength of individual GLT beams.
FJ modelling
General aspects
In most probabilistic approaches to model the load-bearing behaviour of GLT beams, among others, a model to estimate the strength properties of FJ is embedded. For the development of such a model, it is essential that the strength properties are predicted most precise, a conservative approach is not suitable here.
The strength and stiffness properties of an FJ can be characterized by the mechanical properties of the two connected timber boards as well as the quality of the fabrication process. In this paper, the tensile strength of FJ is predicted based on a the dynamic modulus of elasticity
 of the adjacent timber boards. Here it is assumed that the weaker timber board (smaller
 ) is the relevant one. To predict the strength of FJ
 , a linear regression model is used:

 denotes the predicted tensile strength of the FJ
 ,
,
 are the regression coefficients,
 is the input variable
 and ε is the Normal distributed error term
 .
.
Theoretical the model can easily be extended with additional input variables and regression coefficients, in order to consider, e.g. the quality of the FJ manufacturer.
Test results
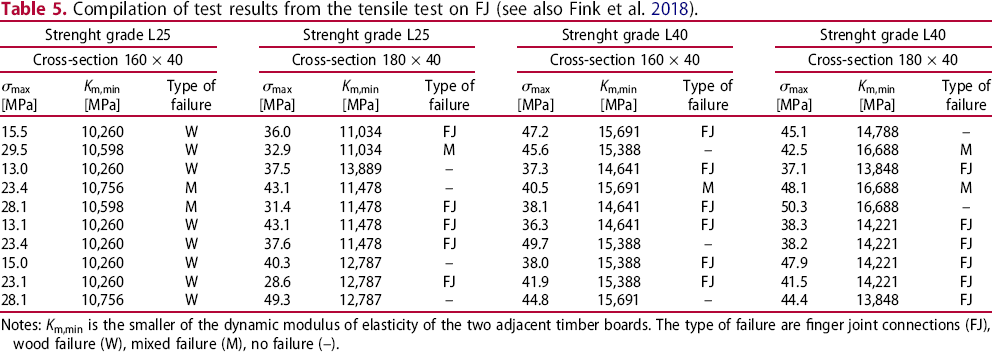
Compilation of test results from the tensile test on FJ (see also Fink et al. 2018).
 [MPa]
[MPa] [MPa]
[MPa] [MPa]
[MPa] [MPa]
[MPa] [MPa]
[MPa] [MPa]
[MPa] [MPa]
[MPa] [MPa]
[MPa]Notes:
 is the smaller of the dynamic modulus of elasticity of the two adjacent timber boards. The type of failure are finger joint connections (FJ), wood failure (W), mixed failure (M), no failure (–).
Type of information
The test result show that only a very limited number of specimens failed in the FJ. For samples without a FJ failure, a wood failure or a mixed failure, the actual tensile strength of the FJ is not known. However, it is clear that the tested FJ resisted the applied load.
Specimens with an FJ failure are categorized as equality type information (non-censored information). There the parameter of interest is identified in test and, accordingly,
 . The other failure are categorized as inequality type information (censored information). In those samples, the tensile strength of the FJ is at least equal to the maximal stresses applied during the test but might be even higher:
 . For more information and examples regarding the classification of different types of information in timber engineering it is referred to e.g. Köhler (2006) and Fink and Kohler (2015).
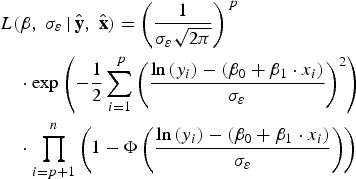
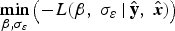
Maximum likelihood estimation for censored data
The regression parameters
 and the standard deviation for the error term
 are estimated by using maximum likelihood estimation. Assuming that the error term ε is normally distributed around the regression model
 , the maximum likelihood of the estimates of linear model's parameter can be derived from Chatterjee and McLeish (1986).
The likelihood function
 for the data is given in Equation (2), where the index
 represents uncensored data, the index
 represents censored data,
 contains the test results
 , and
, and
 are the input variables. By solving the optimization problem given in Equation (3),
 and
and
 were estimated.
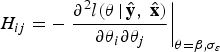
 and
and
 ) are derived from the covariance matrix
 (Equation (4)), where the diagonal elements are the variances of the estimated parameters
 and
and
 , and the other elements are the covariances between these parameters. The covariance matrix
 is defined as the inverse of the Fisher information matrix
 (Faber, 2012).

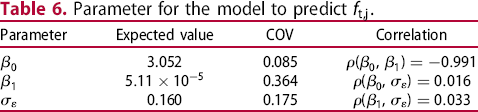
 and
and
 as well as the correlation between these parameters is summarized. The uncertainties of the estimated parameters appear to be substantial, especially for
 (
(
 ). This could be a result of the rather small number of tests, from which the model is derived.
Limitations
Parameter for the model to predict .
Summary and Outlook
On 12 GLT beams, four-point bending tests were performed. The load-bearing capacity as well as the bending stiffness were measured. The results show that the bending strength generally meets the requirements in the present codes, although the variance within the tests is slightly smaller than the recommended value. Similar observations were made regarding the bending stiffness, yet here the variance is clearly smaller compared to the proposed value.
The fracture line and the type of failure within the lowest three lamellas was investigated. Failed FJ were only observed in two beams of the higher strength class (GL32h), only one of them had the FJ in the lowest lamella. For beams of lower strength grade GL24h no failed FJ was found in the lowest lamellas.
The study shows complexity of predicting the strength properties of individual GLT beams as, due to the length of the GLT beams, a large variety of different weak sections were located in high stresses area of the GLT beam. One GLT beam showed a surprisingly low load-bearing capacity compared to its high bending stiffness. For this specimen, compression wood is suspected within the failed cross-section. Although the bending strength has been above the characteristic value, this example highlights the importance of efficient grading methods that are able to identify all relevant strength reducing effects. Especially for the production of high-quality GLT beams.
In addition, 40 tensile tests were performed on finger-jointed timber boards of the same basic set of boards that the GLT beams were fabricated from. The tensile strength as well as the type of failure were investigated. Based on the measured tensile strength and the identified machine graded indicator
 (dynamic modulus of elasticity) of the finger-jointed boards, a material model that predicts the tensile capacity of FJ was developed, using maximum likelihood estimation for censored data to estimate. The presented approach appeared to be very efficient for modelling the tensile capacity of FJ, including also the uncertainties associated with the model.
In combination with previous studies the presented work provide a wide database, to develop and validate numerical models for the prediction of individual GLT beams.
Footnotes
1
For two specimens (GL32h-19m-1, GL32h-19m-2), the ultimate load was estimated too low for the interval , thus the third load cycle is used.
Acknowledgments
The authors would like to thank Martin Bacher from MiCROTEC for their support in this project and providing the grading information of the timber boards.
Disclosure statement
No potential conflict of interest was reported by the author(s).