
Abstract
In the era in which activities performed by mobile users are tracked through various sensing mechanisms, the movement data collected through these sensors is submitted into a data mining algorithm in order to determine the movement pattern. The movement pattern refers to the pattern that mobile users generally take to move from one base location to another base location through multiple intermediate locations. This paper provides a proposal and case study on how the movement pattern can be extracted from mobile users through transforming the user movement database to the location movement database and subsequently transferred to an algorithm Apriori-like movement pattern (AMP) and movement tree (M-tree). The result is a list of sequences in which mobile users frequently go through that which satisfies min-support and min-confidence. The result of this movement pattern mining exercise opens up a new future for the prediction of the movement for the individual mobile user.
Keywords
Introduction
A rapid adoption of information technologies in societies have improved many aspects of our daily lives. With the availability and ever increasing performance in communication technologies, the communication network is ever growing through strong support by consumers who wish to benefit from the ability to stay in touch anytime, anywhere, and the ability to retrieve useful information anytime and anywhere [2]. This led to the wide deployment of wireless service points around the geographical space in order to provide services to the mobile users through the mobile devices they carry [12].
Mobile commerce [26] has led to a wide deployment of mobile services which in turn has led to the need for mobile devices to communicate with the mobile service providers in order to authenticate themselves and receive services. The most widely used mobile service is the mobile phone service. The need to login and authenticate oneself and receive mobile services have led to the ability for mobile service providers to track the identity and location of mobile users, thus providing location dependent information [32] to these users.
Tracking the identity of a mobile user involves identifying the unique mobile user identification number and matches it against the customer database in order to retrieve details such as name, age, gender, and address. The retrieval of such personal data, also known as the mobile user profile, will lead to the identification of mobile users. Even if the mobile device is carried by a different mobile user at different times, the ability to authenticate oneself in the mobile device allows the specific identity to be retrieved.
The tracking location of the mobile user [1] involves the identification of the direction and signal strength from the wireless service station [18, 19, 20]. A more effective means of tracking the location of a mobile user is through the global positioning system (GPS) device located in the newer generation of mobile phones. The mobile phone will activate its GPS device which will return the current coordinates on earth in latitude and longitude. This location data can then be sent to the wireless service provider to get the accurate location of mobile users [33].
Due to the ability for gathering data from mobile users that cover most aspects of the mobile users' life as mobile moves around the mobile environment, this presents a valuable opportunity for data miners to gather interesting patterns and knowledge through detailed analysis from the data collected from these users. Data mining [24, 30, 31, 34] itself is an established research field, while application of data mining into mobile users' data requires more investigations. Previous work in data mining includes examining the association rule [21], sequential pattern [22], periodic pattern [13–15, 27], spatial pattern [5, 6], spatial association rules [16], and surprising pattern [23] through various algorithms and data structures [17].
Background
The mobile environment refers to a boundary in a 3-dimensional geographical space, where the area is serviced by wireless service providers through wireless stations. Wireless service providers are companies which provide services through the mobile device carried by mobile users. These services are generally but not limited to mobile phone and infotainment services. Wireless stations are built around the mobile environment to ensure adequate coverage to meet the bandwidth, processing, and storage requirements for mobile users.
The mobile user in the mobile environment may carry multiple mobile devices. Each mobile device can be identified by a unique physical address. However, the mobile user himself might not be identifiable at current technology. A mobile user may allow his mobile device for a friend to use for two days. It is assumed that mobile users carry their mobile device most of the time.
A mobile device is any electronic device which can be carried by mobile users in which it interacts with the wireless stations in order to provide services to mobile users. This can be mobile phones or personal digital assistants, which provide telecommunication, internet and email, and infotainment services to mobile users. Mobile devices are growing at a rate in which a newer generation of mobile devices are equipped with better processing power, better memory, and better bandwidth access in the mobile network.
The user movement database (UMD) is the raw database for movement pattern mining. It consists of a 2-dimensional database in which each column represents the individual mobile user and each row represents individual time, and the duration between each time unit represents an equal duration, whether it is 1 second, 1 minute, or 1 hour. Each cell in the database represents a coordinate which identifies the current position of mobile user at the given time. Table 1 shows an example of the user movement database.
User movement database (UMD)

User movement database (UMD)
User location database (ULD) is the database after validation and conversion from user movement database (UMD). It is validated to ensure data are present in each cell, and irrelevant data are ignored. Irrelevant data are data, which shows drastic movement between tn and tn+1. Drastic movement can occur when mobile user is on a transportation vehicle. As the goal of converting UMD to ULD is to identify the locations which the mobile users have associated themselves with, mobile users sitting in a vehicle cannot be satisfied as properly associating themselves with the particular location they are in. If the mobile user is sitting in a vehicle waiting for a traffic light, it is quite likely that the location is not registered in location of interest database (LOI-DB) which will be explained later, thus not returning any location.
Time horizon is the term used to refer the time series in the user movement database (UMD). It is the total duration starting from t=0 to t=n. Time horizon represents the total time duration in which the raw data have been captured. The further the time horizon, the better knowledge the data mining algorithm can produce.
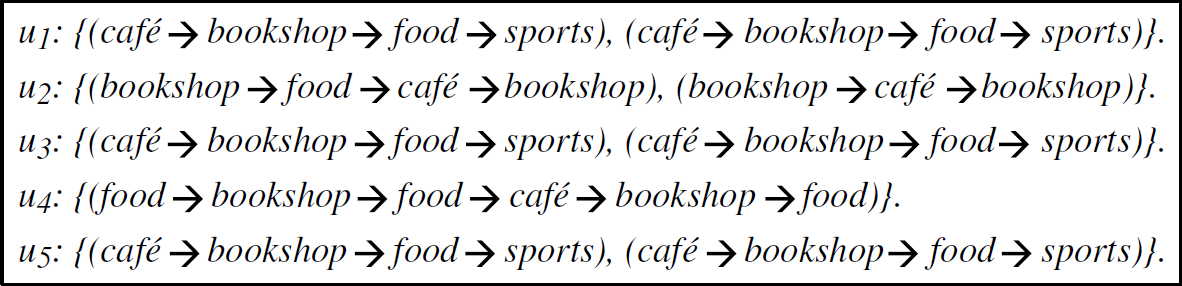
Movement refers to a concept where a subject such as the mobile user, moves from one base location to another base location. Two further concepts of location are the base location and intermediate location. Base location is identified by records that show that the mobile user stayed at a location of interest for a duration greater than max-duration. Intermediate location is identified by records that show that the mobile user stayed at a location of interest for a duration lesser than max-duration. A movement is defined as a sequence of events where a mobile user moves from a base location to another base location through a series of intermediate locations. Table 2 shows a location movement database.
Location movement database (LMD)

Location movement database (LMD) is to sort out the movement sequence of mobile users into a structure suitable for data mining. As ULD contains only one sequence for each mobile user, it is necessary to divide this sequence into multiple sequences. In order to do this, a max-duration is defined in which it is the maximum duration in which a mobile user can remain in a particular location before the sequence is separated. Given a sequence for a mobile user before division is {café → bookshop → food → home → café → bookshop → home}, and this mobile user spent less than max-duration of time in all places except home, then this sequence will be divided into {café → bookshop → food → home} {home → café → bookshop → home}.
Location is divided into
Generic locations are locations which carry names that apply to multiple places. Specific locations are locations which carry names that apply to a single place. Examples of generic location are {café, mall, food, sports, and pool}. Examples of a specific location are {(10, 20), (10 Smith Street)} which carries an identification code to determine the precise position on the geographical area in a two dimensional representation.
Locations of interest (LOI) are generic locations which are applicable for the data mining exercise. It is determined by generating a list of generic locations present in the geographical area which its relationship with other mobile users will be contributory to the generation of useful knowledge and better understanding of mobile users.
Location of interest database (LOI-DB) is the database which contains the list of location of interest along with the respective areas within the geographical boundary serviced by wireless points. Each location of interest may contain more than one area of coverage in the mobile environment because locations of interest are a generic location. For example, there can be more than one café around the mobile environment, but they all belong to the same generic location named cafe.
Group Pattern [28, 29] is a previous work on mining knowledge of grouping relationships among mobile users from a given user movement database (UMD). In this study, it was considered that mobile users who frequently spend time with each other, by showing characteristics of being present within the distance of max-duration and for a duration of min-duration of time that occurs frequently, are considered to pose the same relationship among each other [3]. Another extension of the group pattern is through the trajectory approach [25] where partial data are gathered and movement location of mobile users is predicted through linear trajectories when the tracking mechanisms are not in ideal performance.
The static group pattern mining (SGPM) [8] is an improvement from the group pattern [28, 29] in which it not only tells the occurrence of a group of mobile users that are close together long and frequently enough, but it also tells the specific location where the group of mobile users meets. This is performed by the technique of first replacing the values of user movement database with a set of pre-defined locations of interests. Location of interests is pre-defined zones in the mobile environment where the location presents some interesting feature in which it is useful for knowledge extraction. For example, the neighborhood library would be a very good candidate of location of interest. The result of SGPM is as such: {u1, u2, u3, u4} is a group of mobile users that frequently spends time together at the coffee shop on Blackburn road. It provides a specific location of group pattern occurring.
Mobile user database static object mining (MUDSOM) [7] is a method in which it takes into consideration static barriers in the mobile environment which fall into the category of intelligent mobile mining [9–11]. Quite often in the mobile environment there will be static barriers, such as walls, doors, and glass windows in which it separates the relationships among mobile users. Although the location tracking device can determine the current location by pinpointing the exact location that mobile users are currently located in, if they are separated by a wall, glass window or a door, or river, it would be obvious that although they are spending time together, physically near to each other, and satisfying the measurement requirements of the group pattern, it will certainly have no relationship among them at all. MUDSOM defines a set of static barriers in the mobile environment, and provides an algorithm in order to track and detect the presence of static barriers through a source to destination walking process. If a static barrier is detected that separates two mobile users, the distance measurement between the two mobile users is disregarded even if the distance is lesser than max-distance. The result of MUDSOM is a more accurate result of group pattern.
Movement Pattern Mining
The mining movement pattern from the user movement database (UMD) involves the following steps which will show in detail how data is transformed to knowledge from the user movement database. The knowledge, which is the ultimate goal of this data mining exercise, will provide clues to decision makers who can tell the pattern of movement frequently conducted by mobile users to move from one base location to another base location through a set of intermediate locations.
Definition 1 (Mobile Users)
Let M be the list of mobile users as such {m1, m2, m3, …, mn} each element represents an individual mobile user. Each mobile user represents a physical person who carries a mobile device that has the capability of receiving service from the mobile environment, and also the capability of being identified and tracked.
Definition 2 (Location)
Let (x, y) be the coordinate structure where x represent the x axis value or the longitude and y represents the y axis value or the latitude. There is the generic location and the specific location. The specific location is the subset of the generic location where generic location is a collective term for one or multiple specific locations. Let L be the list of generic location of interest as such {l1, l2, l3, …, ln} each element represents a generic location of interest.
Definition 3 (Time Unit)
Let t be the time interval between each equal and uniform time unit between each of the rows in the user movement database and user location database. Variable max-duration is defined as such if m stays in location in location l for a duration of time greater than max-duration, the location l is deemed to be the base location for the mobile user, while other locations are the intermediate location for the mobile user.
Definition 4 (Sequence)
Let any given structure of (s1 → s2 →
s3 → … sn) be the template for a sequence. A
sequence is a list of events happening in the order of a sequence as such
ts1 < ts2 <
ts3 < tsn. The sequence can be separated
into sub sequences when the criteria are met. It is done during the conversion from the user
location database (ULD) into the location movement database (LMD).
The separation criteria are such that: If the mobile user m stays in a location l for a duration greater than
max-duration, the separation will occur, where the current sequence will be
terminated as (… x → y → z) and the next sequence
begins with (z → a → b …). Note that a sub
sequence ends with z and the next sub sequence begins with z, as
z being the current location where the mobile user m stayed for a duration greater
than the max-duration. If the mobile user m stays in a location that is not a location defined by location of interest
(LOI) in the database (LOI-DB), for a duration of time greater
than max-duration, then the mobile user is deemed to have separated from the
current sub sequence, and the separation of sequences is done in such manner as (…
x → y → z) and the next sequence beings with
(a → b → c). Note that the ending location of
interest of former subsequence is not the same as the beginning location of interest of the new
subsequence.
Definition 5
Given the support for a pattern (x → y → z) is x%, pattern (x → y → z) occurs in the given database for x% of the time. Given the support for a pattern (x → y → z) is x, pattern (x → y → z) occurs in the given database for x number of time.
Definition 6
Given the confidence for a pattern (x → y → z) is x%, it is calculated by the occurrence of all occurrence of (x → y → z) divided by the occurrence of all occurrence of (x → y →*) where * is a wildcard representing any location of interest. The confidence measures the certainty of the pattern by using the ratio of the pattern occurring to the ratio of all potential situations that may lead to pattern occurring. In other words, if confidence is x% for (x → y → z), it is possible to say that among all occurrence of (x → y → *), x% amount of time, it is occurrence of pattern (x → y → z).
Figure 1 shows a situation where in a mobile environment, there are 6 areas and a total of 4 locations of interest (LOI) and naturally they are generic locations. Each area is defined by its boundary and their names. Table 3 shows the location of interest database where interesting areas are covered through two set of coordinates that determines the lower left and upper right of the rectangle boundary zone. It is then subsequently named for their interestingness using generic location names, known as location of interest (LOI).

Mobile environment with 6 areas and 4 location of interest.
Location of interest database (LOI-DB)

Table 4 shows the user movement database. Each row represents a sample of the position coordinate for mobile users. The time units between each row are equal and uniform. Each column in the database represents the individual mobile user. The time unit can be adjusted according to the nature of the data mining exercise. For this case, the time unit is adjusted to 15 minutes per sample. A different application may require more frequent sampling frequency, such as 1 second per sample, or 1 minute per sample.
User movement database (UMD)

Table 5 shows a user location database. From user movement database (UMD) converted to user location database (ULD), each cell in UMD is queried against LOI-DB, and if a match of location of interest is found, it is replaced with the particular location of interest. For those coordinates that do not match the location of interest, it will be as such that the coordinate is not a location of interest. This can occur if the mobile user is traveling on a road, waiting for a traffic light, or moving at quite a velocity.
User location database (ULD)

User location database (ULD) now needs to be converted into location movement database (LMD) which is the suitable format for data mining. The step from converting user location database to location movement database is to separate the sequences by each individual mobile users at situations where either there is a prolonged absence of location, which occurred 3 times between t9 to t12, or there is a prolonged presence at a location, which occurred for u2 at t1 to t6, and t11 to t16, u4 at t1 to t6, and at t15 to t20.
Figure 2 shows a location movement database which is a final product of data processing from the user movement database. This location movement database details the movement sequences that each mobile user has performed based on a sequence where the former occurs earlier than later. In this case, it has essentially summarized multiple traveling records for each mobile user to a point that is necessary and interesting locations are recorded. Each of the subsequence shows how mobile users move from one base location to another through a series of intermediate locations. At this point of time, there is a need to set and explain all the parameters involved in the data mining exercise.
Location movement database (LMD).
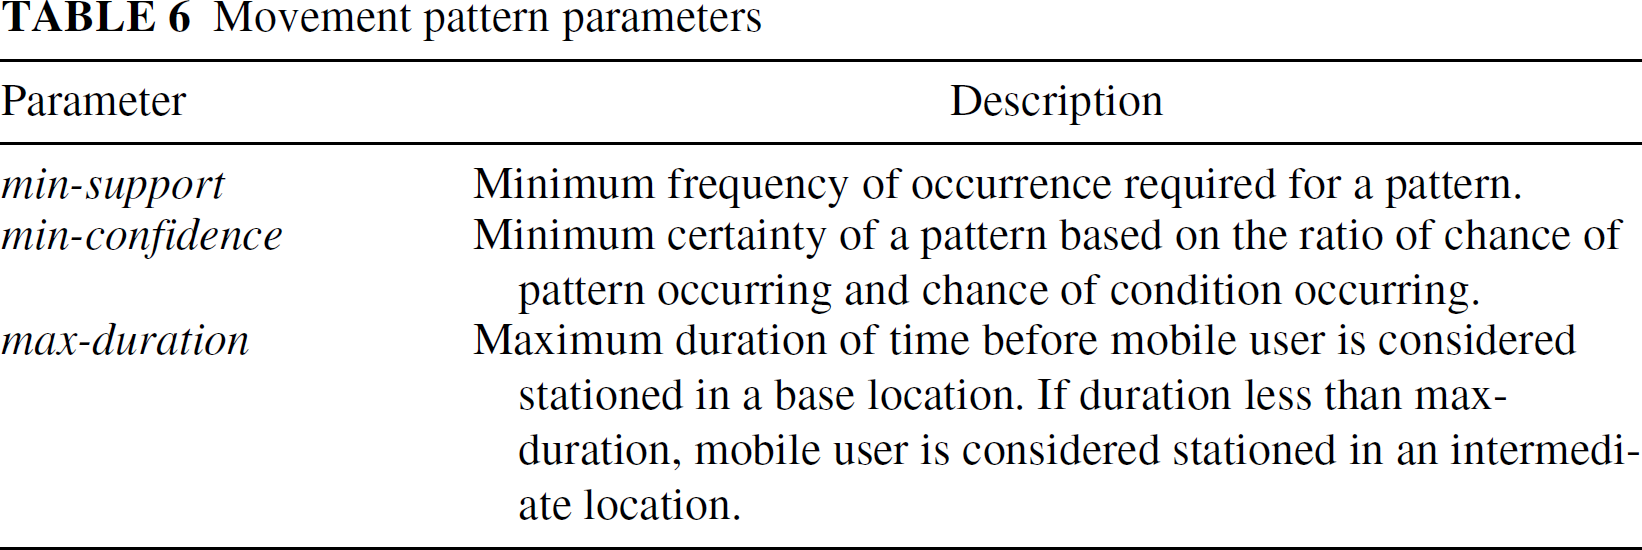
Table 6 shows the parameters required for the mining movement pattern. These are variables in which they need to be pre-determined before movement pattern mining starts as these will be used to distinguish significant and non significant sequences and have a direct relationship with the final output of the algorithm. It provides control by the data miner to determine the level of sensitivity of the algorithm when dealing with a different application environment and a different source data.
Movement pattern parameters
Algorithm AMP and W-Tree differs totally in terms of the approach used to solve the movement pattern mining problem. However, the principle remains the same, where a sequence movement pattern can only occur when it satisfies the min-support and min-confidence criteria. AMP employs an Apriori approach by generating a list of candidate sequences through identification of frequent locations and performs permutation among those frequent locations and cross count from the location movement database in order to determine their individual support.
The process will continue as long as the frequent sequences which have support greater than min-support that have length k equal or greater than 2 are found. In the end of the mining process, each of the frequent sequences found have their confidence calculated in order to determine the level of certainty that the sequence is significant. If the sequence met with min-confidence requirement, then it will be present in the final output.
Movement tree (M-Tree) on the other hand uses a tree in order to transform the location movement database into tree. The rationale behind this is that tree data structures have good capability of being traversed and analyzed. This is because only important relationships are recorded. Important data and relationship are such as the nodes which represents the individual unique location of interest, and the edges which details the direction of the link of sequences among two locations of interest, and with each edge, an identification number and count figure is used to record the number of occurrences for such a relationship.
Figure 3 shows the algorithm for Apriori-like Movement Pattern (AMP). The Algorithm Apriori-like Movement Pattern (AMP) exhibits the Apriori nature of solving the problem of mining. It begins by counting the total number of locations of interest (LOI) and then uses this list to generate a k=2 candidate sequence. This is a list of sequences generated by all the possible combinations derived from the location of interest database. It then filters out the frequently occurring sequences based on min-support, and removes all the non-frequently occurring sequences which have support lower than min-support.
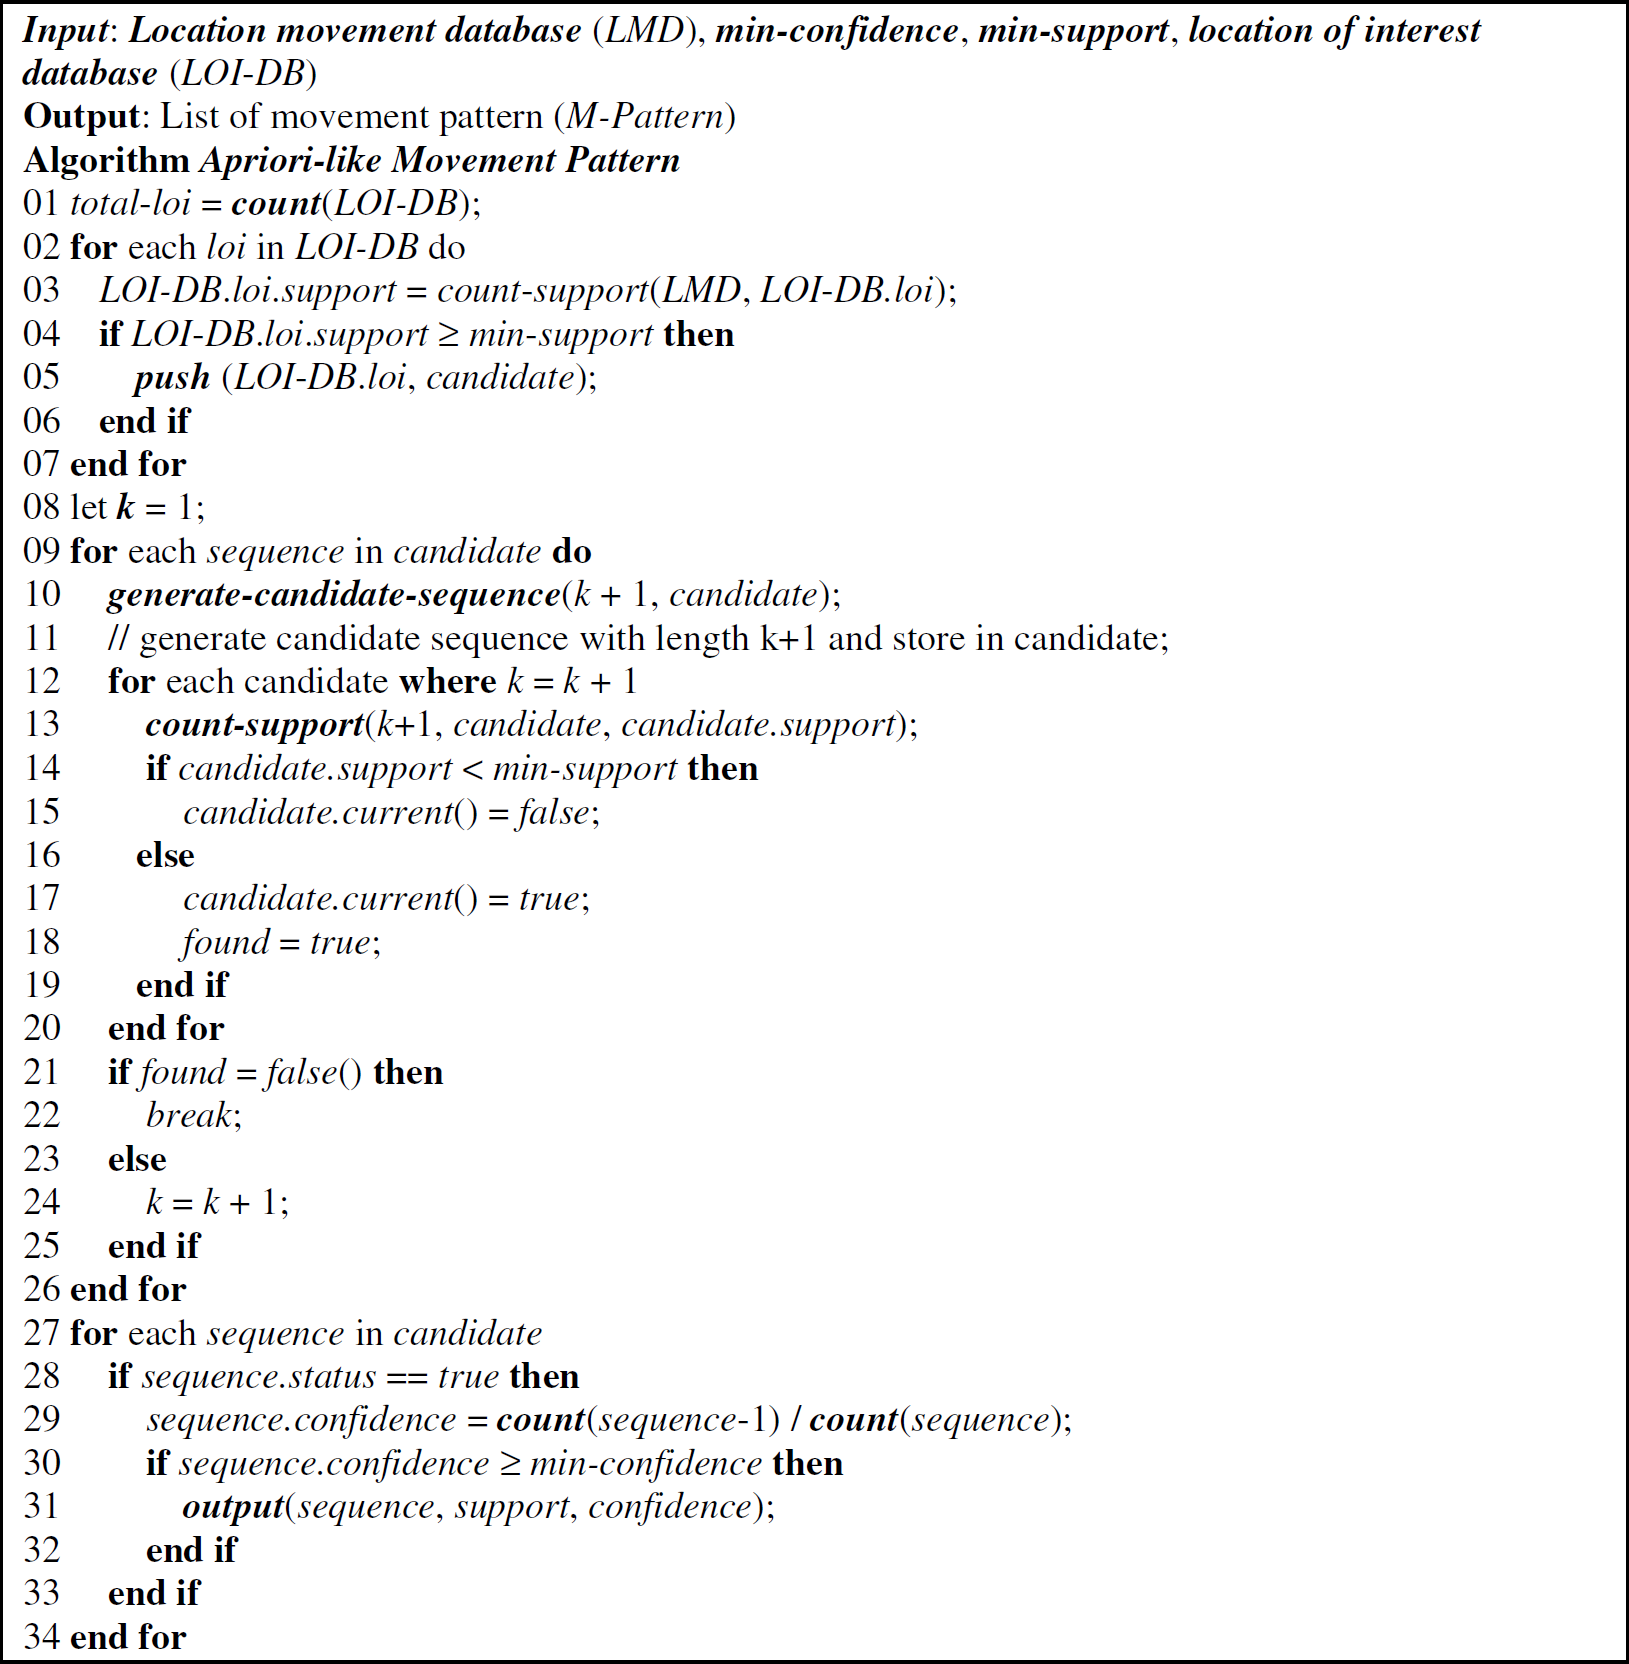
Algorithm Apriori-like Movement Pattern (AMP).
Given a scenario where there are 4 locations of interest namely {café, bookshop, food, sports}. There are 4 independently unique locations of interest, while each location of interest may very well represent a few areas within the geographical environment. For each of the locations of interest, they are counted against min-support in order to confirm that they are frequent by themselves.
Let min-support=3
Table 7 shows the initial counting for support for each unique location of interest (LOI) found from location of interest database (LOI-DB). In this case, all {café, bookshop, food, sports} satisfies min-support. These will be used to generate candidate sequence with length k=2.
Frequent location of interest

Table 8 shows the counting process for all combinations of candidate sequences where sequence length k=2. There are altogether 12 sequences generated. Note that the order of occurrence of location of interest matters in this mining exercise. In this case, only [{café → bookshop}, {bookshop → food}, {food → sports}} satisfies min-support. These will be used to generate candidate sequence with length k=3. In generation of candidate sequences for length k=3, the requirement is that for all {a → b} joining with {c → d}, it is only possible to join when b=c such that it will form a proper sequence. If b ≠ c, then it is not possible for the two length k=2 sequences to be joined to form candidate sequence for further mining.
Candidate sequence length k=2

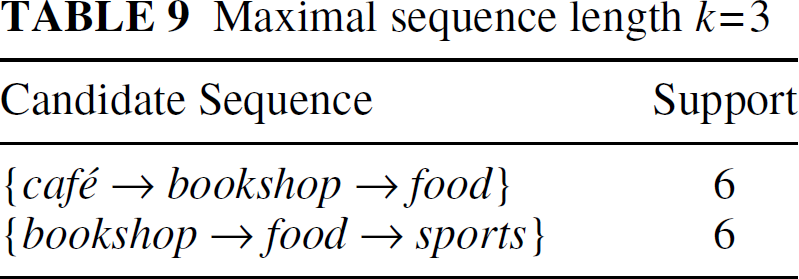
Table 9 shows the counting process for candidate sequences where length k = 3. In this case, both {café → bookshop → food} and {bookshop → food → sports} will be accepted as being part of the set of maximal frequent sequences as their support is greater than min-support. In other words, they have occurred frequently enough in the location movement database (LMD) and are objectively significant enough to be taken into consideration as part of the output of data mining. Until this point, the mining process stops because it is no longer possible to combine {café → bookshop → food} and {bookshop → food → sports} to form a length k=4 candidate sequence.
Maximal sequence length k=3
For each of the supported sequences that satisfied min-support requirement, each are checked again and have their confidence calculated. The confidence measure tells the degree of certainty that a particular sequences' occurrence is something that is useful for the decision maker for further investigation. In order to measure a degree of certainty, a measure by chance is used. Confidence is calculated by the ratio of the number of occurrences of the sequence in reference to the number of occurrences of the sequence in reference without the last item.
For example if {a → b → c} is a sequence that is found to be frequent enough due to support greater than min-support, then the confidence of {a → b → c} can be measured by all occurrence of {a → b → c} / {a → b → *} where * represents a wildcard that can be replaced by any location of interest (LOI). The following are a list of sequences that have satisfied min-support.
Table 10 shows the process of determining confidence. Confidence is determined for each frequent sequence where length is greater or equal to 2. In this case there are 5 frequent sequences with different length and each need to have their confidence determined. The confidence tells how certain it is that the frequent sequence is correct for the final output. It is based on chance of occurrence as such, given all the potential sequences that the frequent sequence may occur through, and there are x amount of occurrences for that particular type of sequence. A confidence of {bookshop → food} tells that given all the movement out from bookshop to something else, 90% of the time goes to food as the immediate next sequence.
Calculation of confidence

The Algorithm Movement Tree (M-Tree) simulates the representation of the location movement database (LMD) sequences. This provides the opportunity to solve the data mining problem in another data structure which may be more efficient.
Figure 4 shows the algorithm of movement tree (M-Tree). The algorithm first builds up the tree by freeing up the w-tree memory space. It reads each individual subsequence from location movement database (LMD) and gradually builds up the tree through examining whether the node has already been created. If it not has been created, relevant nodes are created at the relevant depth as indicated by k which can also be used to represent the relative position of the current location of interest in the subsequence. After the tree is built, it is processed through removing all nodes and edges where count < min-support. As a result, only significant nodes and edges remain. The final step of the mining process is to calculate the confidence and generate sequences that satisfy min-support and min-confidence as final output.

Algorithm Movement Tree.
During the movement pattern mining process, each node in the tree represents a location of interest. The depth of the tree is important. The following tree has a depth level of 6. This shows that the longest sequence in location movement database have a length k=6. Each layer represents the sequential order or the position of the location of interest in the movement sequence for mobile users from base location to intermediate location.
The root of the following tree is “nil” and is linked to 3 nodes namely “café, bookshop, and food” at the first level of the tree. Each node is connected via an edge that is directional in order to show the next connection of the sequence. Each edge is associated with a counter which shows the frequency of occurrence of such sequences that the edge has linked.
The tree is built up from the location movement database (LMD), through submission of each sub sequences for each mobile users, and gradually all mobile users. Each time when a sequence is encountered and depending on the position in the length of the sequence, new nodes may be created, and new edges may be created and counter of edges are incremented by 1. An initial location movement database is as such obtained from the location movement database in the background section.
Figure 5 shows an example of the movement tree building process. There are three sub figures from left to right named (a), (b), and (c). They are generated in sequence. Figure 5 (a) can be generated through parsing the following sequence {bookshop → food → café}. Figure 5 (b) can be generated through parsing the following sequence {bookshop → food → sports}. Figure 5 (c) can be generated through parsing the following sequence {bookshop → food → café}. For each time a sequence is read, there is an increment of 1 over the counter of each edge.
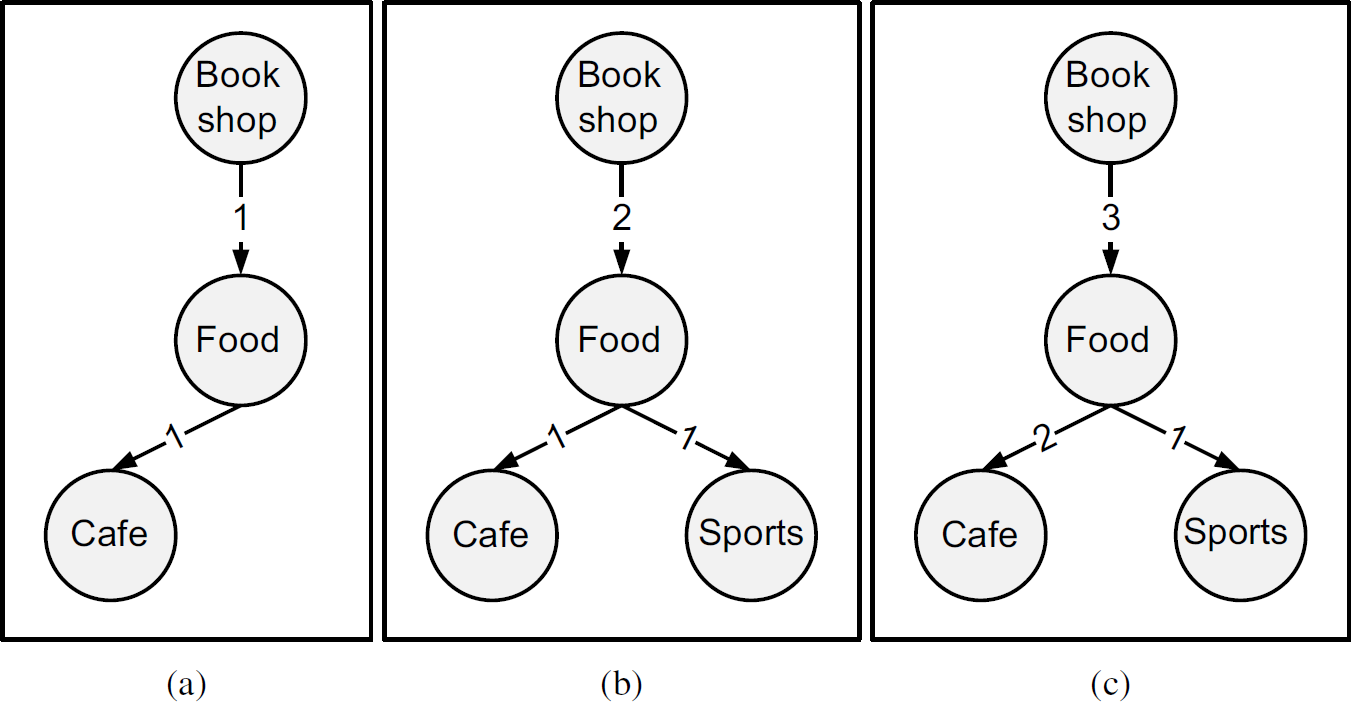
Example of movement tree building process.
Figure 6 shows the raw movement tree generated by Movement tree algorithm. Movement tree algorithm takes the location movement database (LMD), min-support, min-confidence and transforms the location movement database into a tree representation. This tree does have a root which is “nil,” similar to the hierarchical structure of the domain name system used on the Internet where the highest node is “nil.” The tree has a hierarchical structure. In this tree, the depth of the tree is 6 as there are 6 layers in the tree. This also tells that the longest sequence have length k=6.

Raw Movement Tree.
Figure 7 shows a processed movement tree in which those edges that do not have count greater than min-support are removed. Minimum support in this case is equal to 3, the same as the example used in Apriori-like Movement Pattern (AMP) algorithm. Nodes that are not connected by edges or connected by edges that have count lesser than min-support are also removed. This shows the processed movement tree where only the objectively significant nodes and edges are shown. Note that at this point confidence is not yet calculated. This processed tree directly tells that movement from café to bookshop, or the movement from bookshop to food or the movement from food to sports are prevalent in the mobile environment.

Processed Movement Tree.
Figure 8 shows a portion of the raw movement tree with all the nodes restructured for better presentation. The edges connection and count of each edge remains the same. In this case, the confidence of {bookshop → food → sports} is calculated by the occurrence of {bookshop → food → *} / {bookshop → food → sports}. It is calculated as 6 / 10=60%. This shows how confidence is calculated in a tree, where the values necessary to calculate the confidence can be derived directly from the variables stored on the edges of the movement tree.

Calculating confidence.
The performance evaluation was performed on three synthetic databases with varying degree of parameters in order to distinguish their difference in performance. Three parameters are used, namely time horizon, location of interest, and k-average. The performance evaluation was conducted on a Pentium IV platform with 384MB of main memory, using C programming language with data access through a file structure. Source data is synthetic data planned using Microsoft Excel and converted to plain text file and for reading in C programming language. Table 11 provides the parameters and description for each variable.
Performance Parameter

Performance Parameter
Table 12 shows the parameters for DB-A, DB-B and DB-C. Time horizon refers to the size of the time series in the user movement database (UMD). The longer the time horizon, the longer the data capture of the user movement database, thus the richer data have obtained, thus potentially better knowledge output. The LOI refers to the total number of locations of interest available in the database. The more the LOI, the greater the complexity of the database and therefore, the greater permutations required for each candidate sequences generation. Variable k-average refers to the average size of the sequences contained in the database, and the longer the average sequences, the more complex the mining problem.
Input parameters
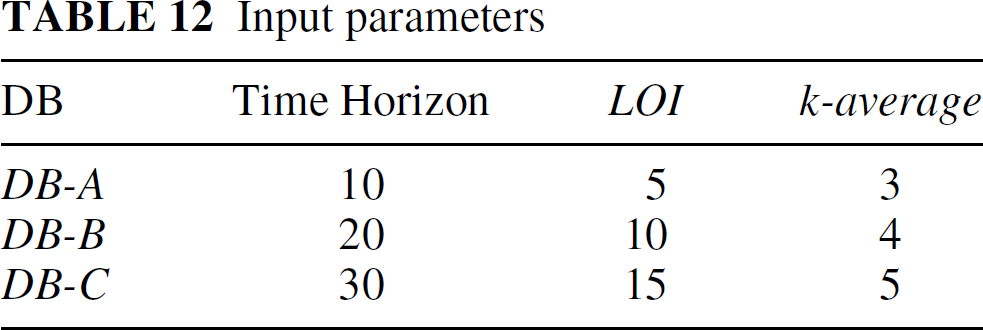
Figure 9 shows the performance graph. The performance graph is measured by means of k=2 candidate size, count of frequent sequences, count of confident sequences, and finally the number of location movement database (LMD) passes. It is found that at increasing level of database complexity, k=2 candidate size and number of location movement database (LMD) passes increased near exponentially. It is also found that at an increasing level of database complexity, the total number of frequent sequences and confident sequences increases at a near linear increase.

Performance Graph.
In conclusion, the movement pattern can be mined from the location movement database in order to determine how mobile users travel through the location of interest from base location to another base location via multiple intermediate locations. It is also possible to transform user movement database (UMD) which is raw data that records all grid coordinates of mobile users into a format called location movement database (LMD) that is suitable for data mining. For algorithm Apriori movement pattern (AMP), there is a requirement to go through the location movement database multiple times for counting, whereas for the algorithm movement tree (M-Tree) there is no requirement to traverse the location movement database for multiple times.
Future work is to look into predicting the next movement for individual mobile users based on their individual mobile user movement. In this paper, the movement pattern investigated is the overall movement pattern that is sourced from all mobile users from the mobile environment combined, and the output represents the movement pattern in the general population.