
Abstract
The expansion of big data has played an important role in the feasibility of the smart city initiative. The massive amounts of data offer the potential for cities to obtain valuable insights from a large amount of data collected through various sources. Usage detail records not only include plentiful spatial–temporal information, but also describe users’ activities in content space and time. They have three dimensions of information, which makes them favorable for the research of human behavior dynamics. To support smart cities, we collected usage detail records containing three dimensions of information from individuals and analyzed the relationship between them to get modes of users’ behavior. In this article, we propose a method to discover the needed content for users and a way to provide these data to them. The result shows that two of these three dimensions have an invisible association. New behavioral patterns that we discovered from usage detail records can be derived for configuring resources reasonably and supporting creation of smart cities.
Introduction
With the rapid development of mobile networks and devices, intelligent mobile phones coupled with mobile applications have led to an explosive increase in data traffic, to support various types of Internet services. Currently, mobile phones are not only the communication terminals but also the mobile sensors to sense the city. Big data generated by mobile devices provide an opportunity to re-understand the cities we live in and the people we meet, and are also consistent with the concept of smart cities.
From the perspective of network operators, it is urgent to understand the user behavior characteristics of mobile Internet. The awareness of user behavior is of great value. For example, if the required contents are known, network edges can store the contents in advance and provide them to the user. Similarly, varieties of resources can be pre-allocated in the city to improve the experience.
However, there are still great challenges to achieving an accurate analysis of user behavior. First, a priori knowledge of user behavior in mobile Internet is still limited, since it is hard to know detailed similar user behavior modes. Second, user behavior is related to many factors, including age, gender, and profession. Therefore, it becomes a challenge for researchers to obtain user behavior modes. A feasible mode-mining approach that is aware of the behavioral characteristics of mobile users is necessarily under the mobile big data situation.
This article is trying to combine data from time, space, and context dimensions and to discover user behavior modes from multiple views. Generally, intelligent mobile phones can be used to divide users into two groups. One group consists of users whose mobile phone’s price S is more than 2000 RMB (type I) and another group consists of users whose mobile phone’s price S is less than 2000 RMB (type II). This classification can be roughly divided between high-income and low-income people. Behavior modes of these two groups in different types of users are analyzed. In addition, to decrease the error rate in the classification of user types, an analysis is made only among users of type I and type II. Moreover, a detailed analysis of user behavior characteristics is made from multiple dimensions at the same time, according to the actual demands from third parties (manufactures, carriers, and service providers).
To ensure enough accuracy, the following information is needed in our proposed architecture: (1) the types of users interested and their usage patterns; (2) the usage scenarios; and (3) the visiting modes of the users. The remainder of this article is organized as follows. The online behavior modes’ mining architecture is presented in section “Related work,” where user behavior mode is mined from different dimensions. In sections “Mining architecture of user behavior modes” and “User behavioral pattern analysis based on scene and interest dimension,” several instances are studied to analyze the behavior modes of type I and type II users from multiple dimensions.
Related work
Gonzalez et al. 1 found that human trajectory has a strong regularity in the time and spatial dimensions, in that the user consumes most of the time in only a few locations. Similarly, Song et al. 2 found that users like to return to where they have been before and explore where they have never been. They have successfully interpreted the increasing number of access locations over time and the probability of users appearing at these locations. In addition, they also interpreted the pattern of the slow spread of user behavior in space. These two literatures have found some pattern that the uses had, but the behavioral pattern they found only in single dimension, the result is simple and not very reliable. According to the literature, 3 95% of users frequently access fewer than four locations, and Bagrow and Lin 4 propose a frequent location clustering algorithm to obtain periodic movement patterns of users. By computing the entropy of mobile user location sequences, Song et al. 5 found that 93% of mobile users are predictable. Pan et al. 6 found that mobile Internet users would store what content they obtained, and the more active the users are, the longer they store the content they obtained. These studies gave us some inspiration that users’ behavior is fixed and they will always appear in some places and access some server. A method of mining temporal association rules for complex patterns is proposed 7 in this article, and the relation between user time series is analyzed. A cascaded Poisson process is proposed to study the influence of periodicity on user behavior. 8 These two studies7,8 have proposed some methods to analyze user time series and found some user behavior but they did not explain why these behaviors occurred. Cole et al. 9 proposed a Markov chain–based pattern mining method, which uses user web access sequences to discover different behavioral patterns to distinguish and represent different tasks. Godoy and Amandi 10 designed an unsupervised learning method using network document data to obtain user images and get conceptual clustering results easily understood by users or machines, these two studies found users’ behaviors only in the content dimension.
In traditional methods, the analysis of user’s behavior preferences is only in either of the dimensions of time, space, or content. Xu et al. 11 proposed an implicit semi-Markov model to mine user online click patterns. Zhang et al. 12 used the hidden Markov model and multi-state model to find the app usage patterns of users. Yuan et al. 13 used a topic probability model to mine user interest. These three studies11–13 use Markov mode to analyze users’ behavior but the Markov mode is not suitable for medium- and long-term forecast. Park et al. 14 proposed an Eigen model and noted that the eigenvector of the user’s transfer matrix can provide detailed information for the user’s moving pattern. Lu et al. 15 used mobile phone data to analyze the movement patterns of large numbers of users and to train some Markov chain–based models to predict the actual location of each user’s access. Similarly, based on the topic probability model, Deb and Basu 16 proposed a trajectory pattern mining method based on the semantic information of user access location. They simply found users’ moving patterns but did not analyze them in combination with the content of access server. Zhou et al. 17 analyze the time interval where users return to the same interest, and use a fat-tailed distribution to model the content of mobile Internet users. Gonzalez et al. 1 describe the statistical characteristics of human trajectories with the spatial distance of adjacent records. Although these methods perform well in the target dimension, they ignore the potential association information between the other dimensions and the target dimension. 18,19 This study noted that the telephone call patterns of mobile users are strongly related to the co-occurrence model. Based on this feature, the user’s social relations are enhanced using the data obtained from the cellular data to enhance the user’s location prediction performance.
Some one-dimensional methods consider useful information in the other dimensions. Zhang et al. 18,19 use the user’s physical trajectory information to mine and predict app usage patterns. Pang et al. 20 introduce time context information to the mobile location prediction problem and propose a spatio-temporal context–based Markov model. These two studies19,20 analyze users’ behavior models in some special dimensions which have no universality. Based on the distribution of app, the mobile base station is divided into communities in space, 21 and then the app usage patterns in each geospatial region are extracted. The above methods use information on the auxiliary dimension to enhance performance in the target dimension, but they also cannot describe the performance of user behavioral patterns in the auxiliary dimension. Isaacman et al. 22 use semantic regression to mine semantic information of user access locations. From all of these studies, we collected usage detail records (UDRs) in three dimensions to analyze users’ behavior, this can reflect the user behavior model accurately, and the suitable method we used can ensure the validity of the result.
Mining architecture of user behavior modes
The mining architecture of user behavior modes includes four functional modules as follows: a data pre-processing module, a similar network construction module, a clustering computation module, and a data visualization module. This mining architecture is depicted in Figure 1.
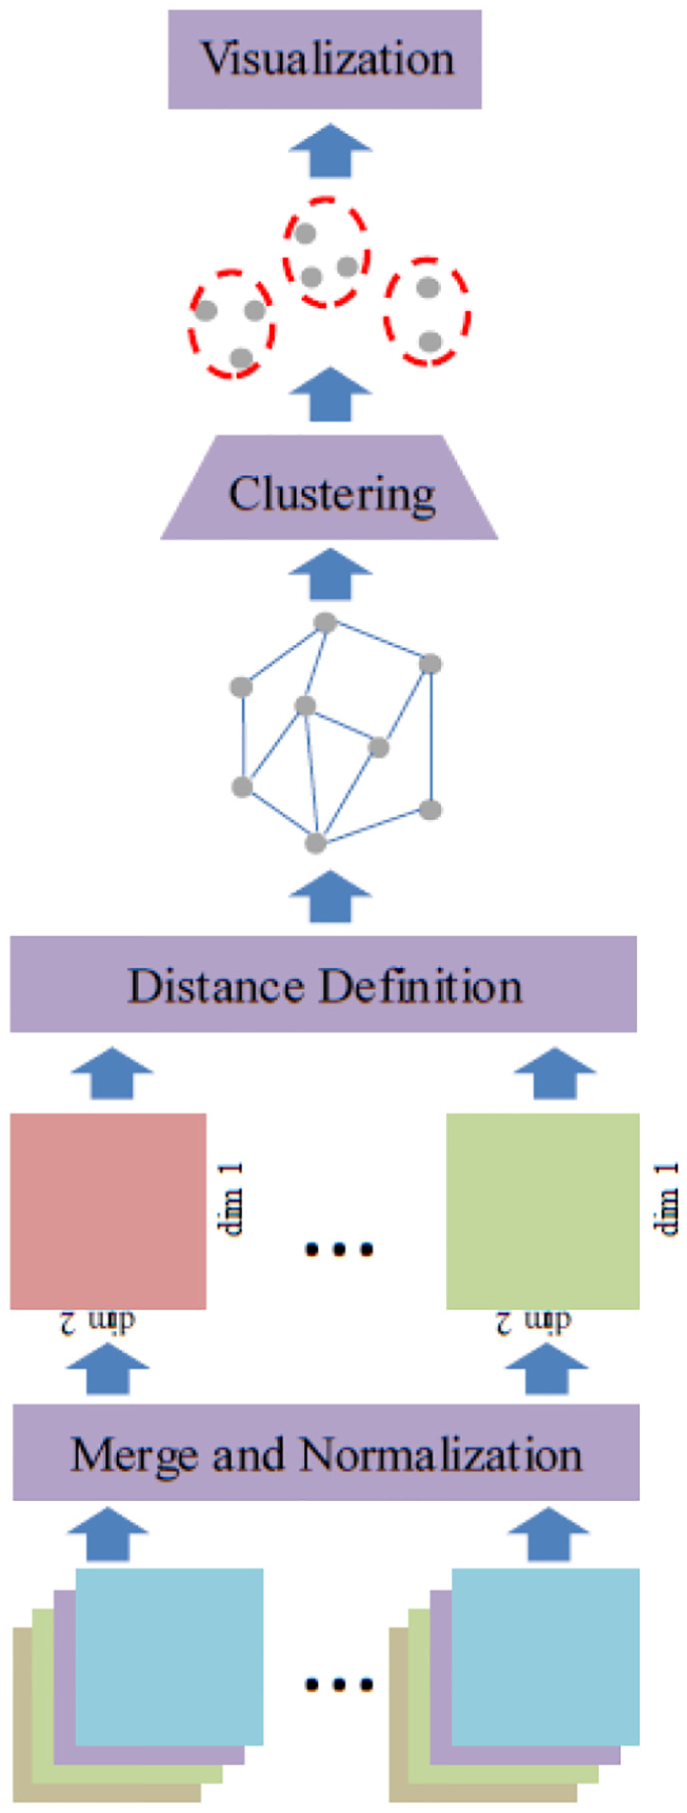
Mining architecture of user behavior modes.
In this mining architecture, original data will be transformed by the data pre-processing module into the online demand matrix. Second, the similar network of all users is built using user distance computation. Then, this similar network will be preceded by the clustering computation module and typical modes of network usage can be obtained and shown by the data visualization module.
Data pre-processing
In this article, 1000 users from the Beijing area and the Jinhua area are selected randomly. In addition, to keep the reliability and efficiency, these mobile Internet users using Internet for at least 1 year are selected.
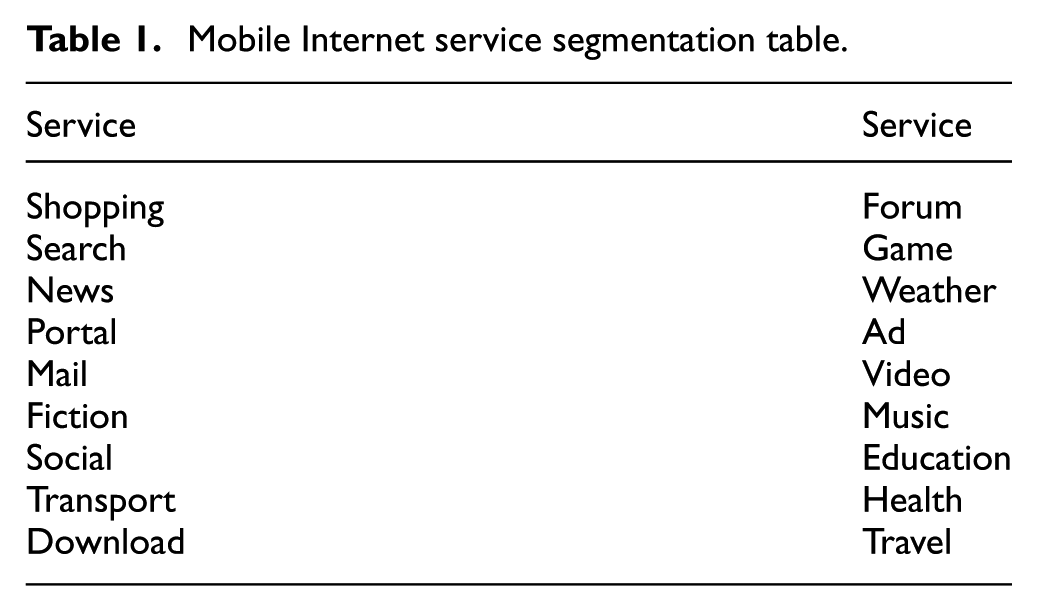
Raw data need to be processed by the data pre-processing module to be used by the subsequent modules. First, the “Host” field in the data table records the URL information of the user’s current access to resources for the whole network only. Therefore, the same mobile Internet service may have a variety of URL descriptions, which is not conducive to practical analysis. Second, the “Scenario” field in the data table is a natural language used to describe a particular location. Therefore, we classify the keywords in the URL and the “Scenario” fields by the purpose of visiting the server and what kinds of content information these users have accessed. And we also classify the places in which these users had accessed the server, because the behavior is related in the place they stayed. See Tables 1 and 2 for details.
Mobile Internet service segmentation table.
Mobile Internet scene segmentation table.

Next, we use the time, space, and interest dimensions in pairwise matching to obtain the user’s web usage matrix. Specifically, taking the time and interest dimensions as an example, during the whole observation period, we get the user i under the Internet frequency matrix
Distance measure
After getting a normalized net demand matrix for each user in two dimensions, we need to calculate the distance between pairwise different users. Inspired by the image quality evaluation index in the literature,
23
we use the correlation entropy introduced by Solomon Kullback and Richard Leibler in 1951 as the distance index between users. The correlation entropy

Since

By calculating
User community segmentation
Based on the distance matrix
The commonly used clustering algorithms are divided into two categories according to whether or not the number of clusters should be specified: (1) the number of clusters needed to be set for the algorithms, including the K-means algorithm, spectral clustering, and the clustering algorithm based on stability; (2) there is no need to set the number of clusters for the algorithm, including clustering algorithms based on density, hierarchical clustering, and clustering algorithms based on modularity. In this article, a clustering method based on modularity is adopted.
Modularity is a method of measuring the quality of a complex network community. 26 It describes the number of nodes in the community and the difference in the number of edges generated under random conditions. Its original definition is

Among them,
Considering the process of community discovery, it is necessary to find a cluster structure division that enables users in the same community to be closely related and where there is less user contact between different communities. If multiple users belong to a community, there must be some degree of association between them, and this association is far from the number of edges in a random network. Therefore, many algorithms use the optimal network modularity to find the optimal network community partition.27–29 A typical modular optimization algorithm for the Louvain algorithm 30 procedure is shown in Algorithm 1.
Modular optimal clustering algorithm.

For the clustering algorithms that need to assume the number of communities, judging the number of communities, the parameter n is very important. Therefore, many works use a two-step method 12 to complete the process of clustering, namely, using gap analysis in advance to determine the optimum number of community divisions and using a traditional clustering algorithm (such as K-means or spectrum clustering) to complete the community division. However, such a step method has obvious shortcomings, that is, the objective function to obtain the optimal clustering number (first step) and the community division (second step) are not consistent, so the community number is not the “optimal” number of communities, but a suboptimal community number. As a result, in the complex network partitioning module, we select a clustering algorithm that does not need to presuppose the number of communities. The density-based clustering method is very sensitive to distance, and slight changes in distance may lead to different clustering structures. It is necessary to set cluster parameters carefully so that the ability to use them is greatly constrained. Therefore, in this article, the modular optimization algorithm Louvain is used to perform clustering module tasks. Compared with other clustering algorithms, the modular optimization algorithm has two advantages: (1) it has a significant advantage of computing time, making it very suitable for large-scale network clustering scenarios; (2) we do not need to set the number of clusters and the optimal number of clusters obtained by the optimization module, which is the optimization goal for the clustering process. Therefore, the consistency between the best number of communities and the best community division is guaranteed.
We use modularity as a clustering evaluation index, and the evaluation results are shown in Table 3.
Clustering module degree evaluation table.

Through the evaluation results of modularity, we can verify the rationality of the behavioral pattern framework for clustering user behavior.
Visualization of community patterns
After the clustering module, users in the same community have similar network usage patterns, while users in different communities have different network usage patterns. Thus, for target communities, we extract frequent demand matrices for each user. The

where

where
Analysis of user behavioral patterns based on the time and interest dimensions
Identification of high-end and low-end users plays an important role in the process for pricing design, personalized recommendation, and marketing strategy. We analyze patterns of behavior and differences behind two typical user groups with equipment of different prices from the perspective of mining mobile Internet user behavior, to provide decision support for pricing design, personalized recommendations, developing marketing strategy, and so on.
It can reflect which users are interested in what content and what are their patterns of use on the timeline. By combining the temporal and content dimension information, we apply the framework to class I and class II user groups in the Beijing and Jinhua regions and rank the resulting user communities according to their size. The six major community patterns in the class I and II user groups in Beijing and Jinhua were selected. As shown in Figures 2–5, the horizontal axis is divided into hours and the longitudinal axis represents the network service.

The six most striking pattern features of class I user groups in the Beijing region.

The six most striking pattern features of class II user groups in the Beijing region.

The six most striking pattern features of class I user groups in the Jinhua region.

The six most striking pattern features of class II user groups in the Jinhua region.
We can clearly see the six most striking features of classes I and II based on user groups in Beijing and Jinhua:
Almost all patterns show a horizontal line in social services (such as QQ/WeChat/Weibo), indicating that social services play an important role in the user’s online behavior. Social networking is an ideal choice for manufacturers who want to promote effective product delivery.
Social services and other services, such as online shopping and online video, have a strong correlation. In all 12 modes, there are 10 patterns of co-occurrence. Therefore, it is important for social service providers to provide quick access to other services. In this way, social service providers can not only introduce user traffic from other services, to increase user stickiness, but also switch, through the optimization process, between users in social services and different services to enhance the user experience.
Class I and class II users in Jinhua have the same pattern of content preferences. They are portal sites (I (b) and II (a)), fiction (I (c) and II (c)), and search class (I (E) and II (b)) services. In the temporal dimension, the time patterns of the two types of users on the portal services are very close, and there is a distinct difference between the novel and search services. Among them, for the fiction service, class I users show a bimodal distribution on the timeline (see Figure 6), which shows that class I users have more leisure time. The value reached its peak at 12:00 and 22:00, but the peak value and the difference are not obvious, while the curve of class II users showed unimodal distribution, peaking at 21:00, with an average probability of using the fiction service at this time of 0.8. For search services, although two services are bimodally distributed, the peak value of the second (from 19:00 to 23:00) is clearly different, and class II users are more active. From Figures 2–5, the most typical user access time series between class I and class II users are selected to reflect the behavioral pattern, as shown in Figure 7.

Class I user’s access time series diagram of fictional app in Jinhua area.
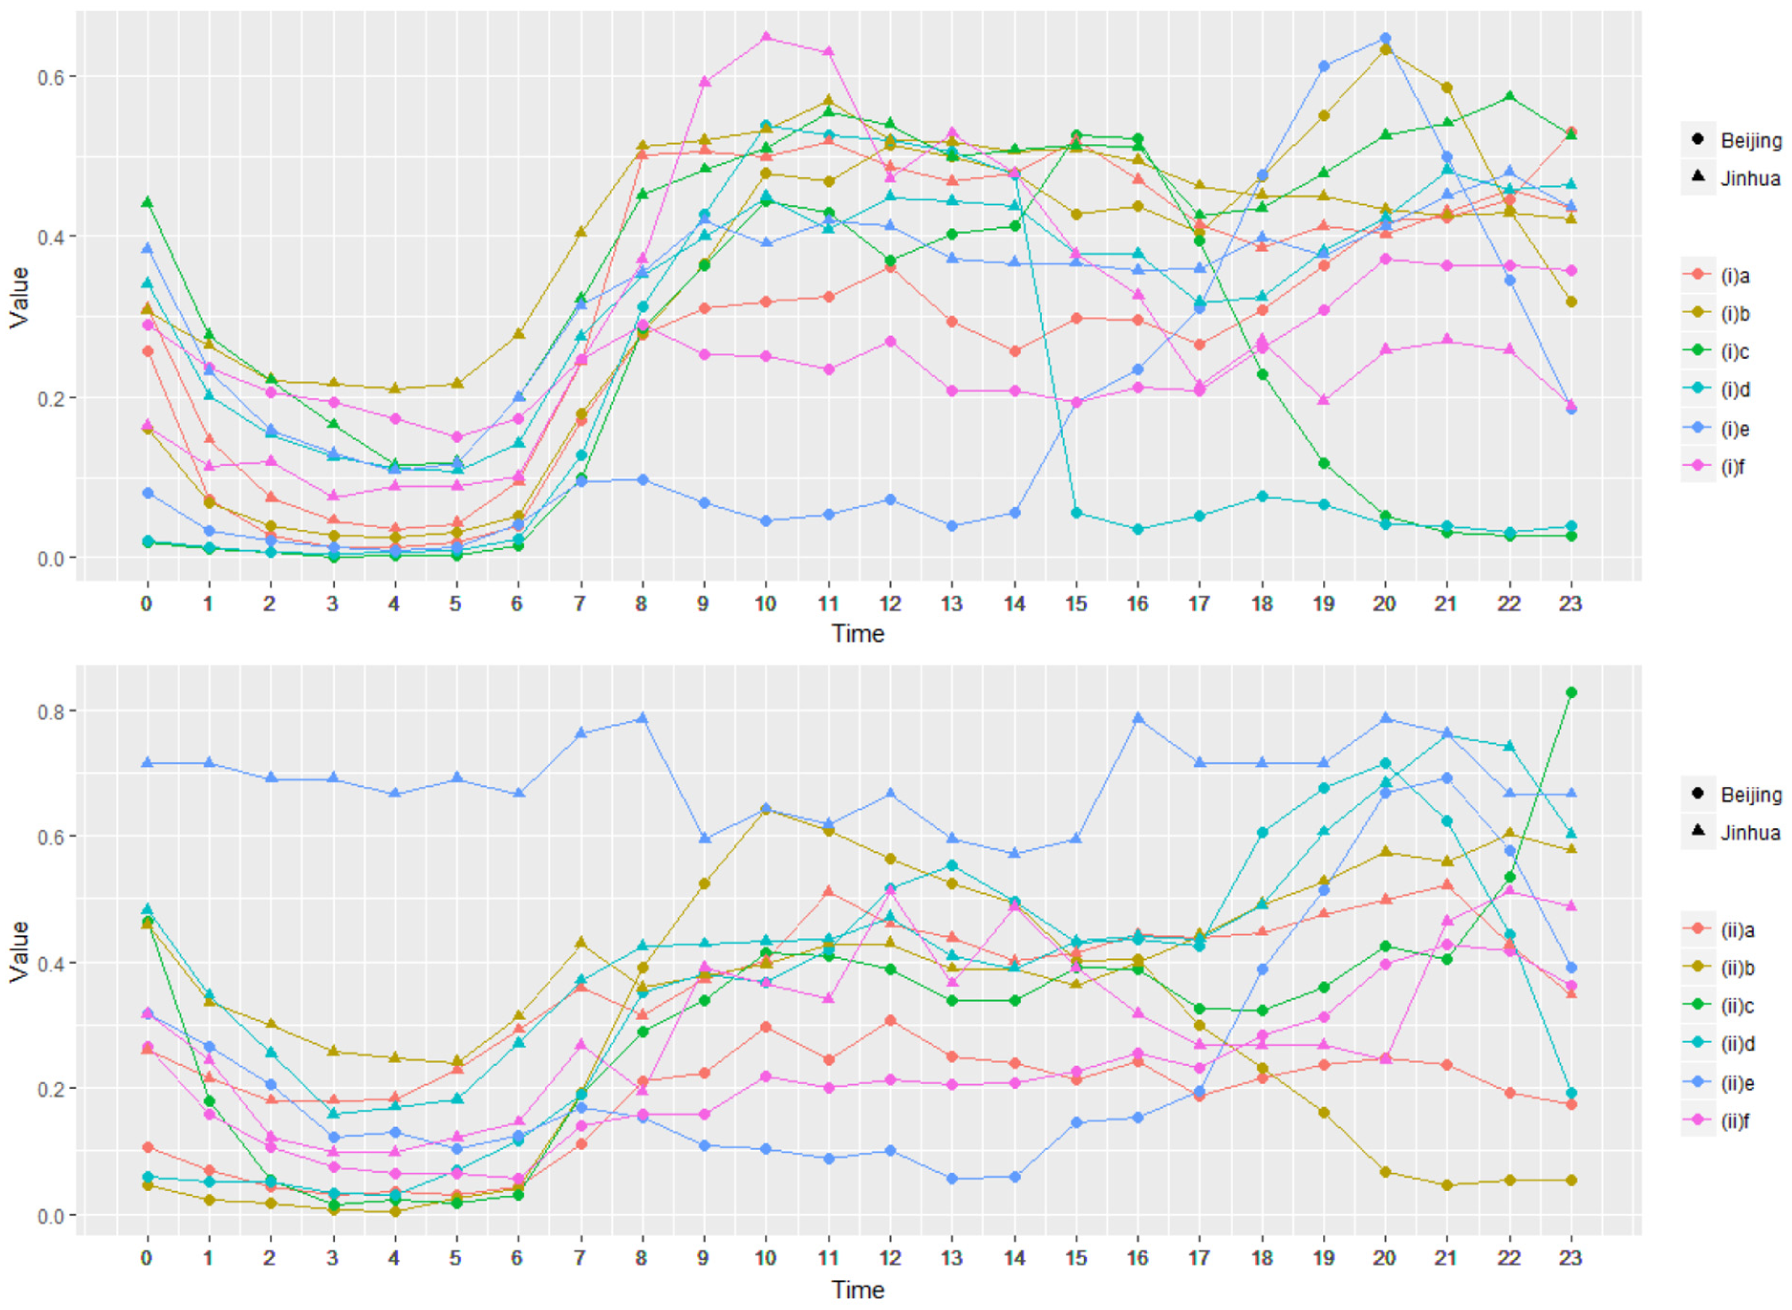
Typical time series pattern comparison diagram. The upper image is for class I mobile phone users and the lower one is for class II mobile phone users.
From Figures 2–5, we can obtain the most typical sequence of user access patterns, which, in the Beijing area, for typical class I users are as follows: social class, the user is the same; in the Jinhua area, typical class I services are portals, fiction, shopping, news, and search; for class II, they are portal, search, fiction, online shopping, cloud, and forum. By contrast, we can get the following:
Permeability of social services in the developed regions (Beijing) must be higher than that in the developing regions (Jinhua). In the developing area (Jinhua), the use penetration of app is more dispersed (people are more prone to portal, shopping, and other sites of interest). In addition, access to content is more prominent in the developed regions. These two phenomena profoundly reveal the phenomenon of regional imbalance in the development of the mobile Internet.
In both Beijing and Jinhua, in the time and content dimension constraints, clear characteristic network usage patterns exist for typical users, indicating that user behaviors in the time and content dimensions have potential associations.
User behavioral pattern analysis based on the scene and interest dimensions
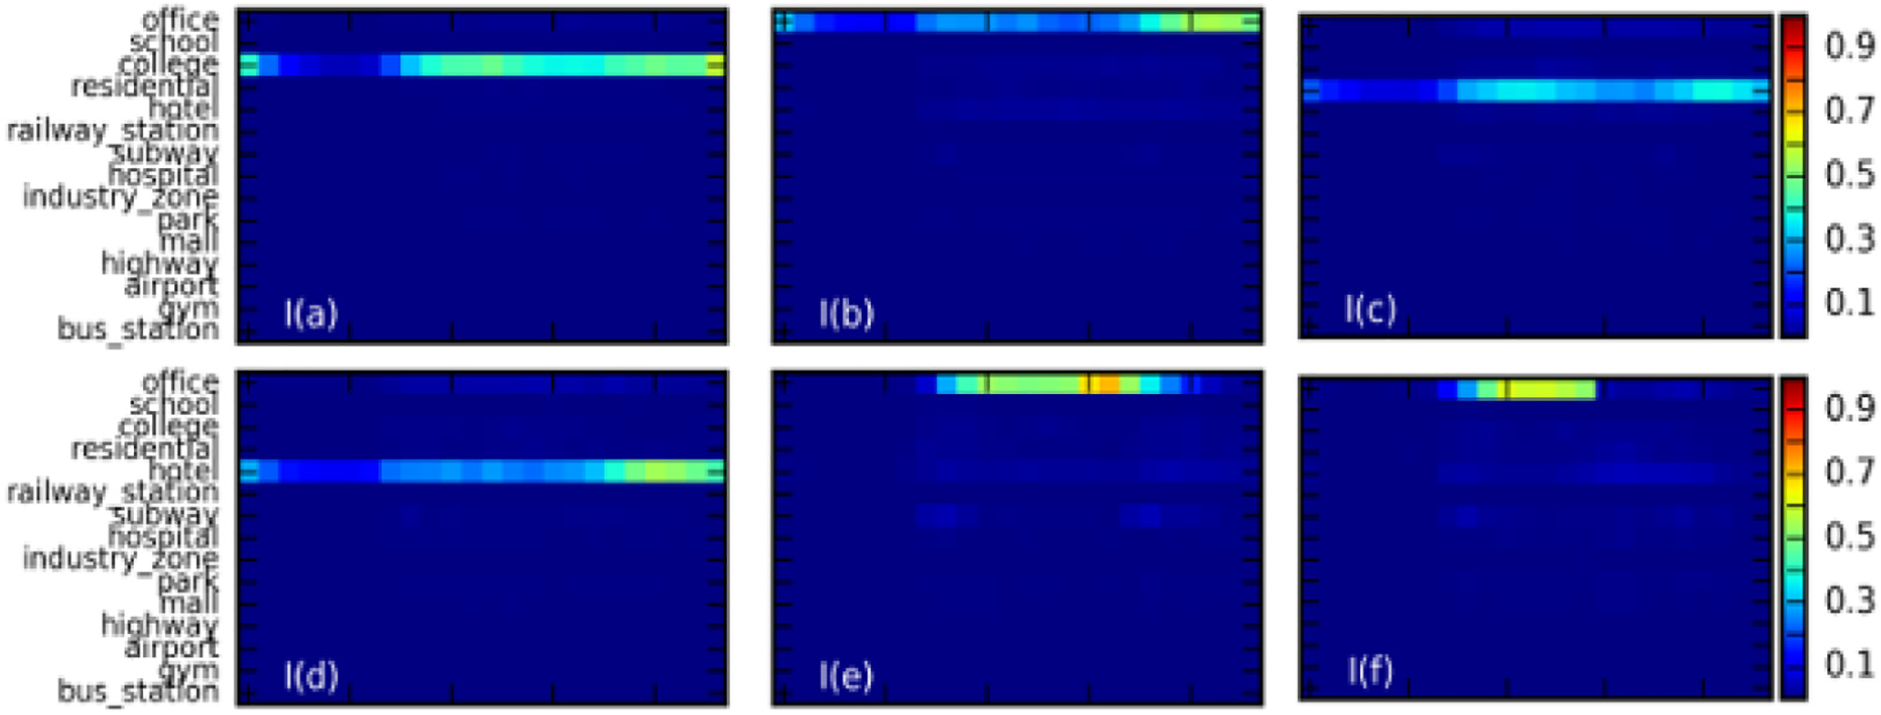
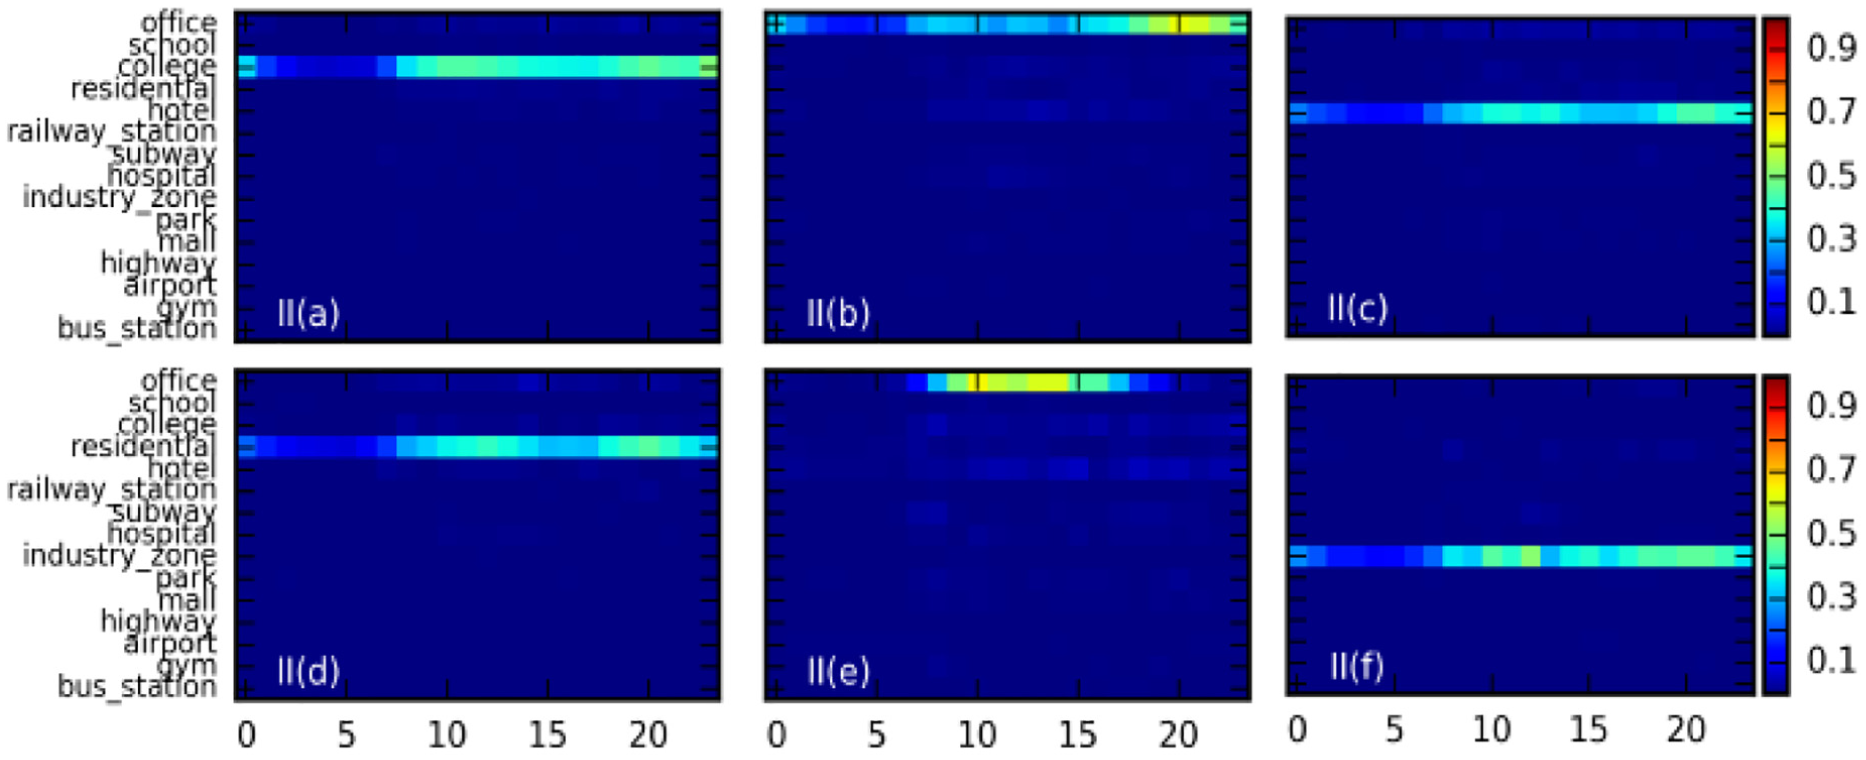
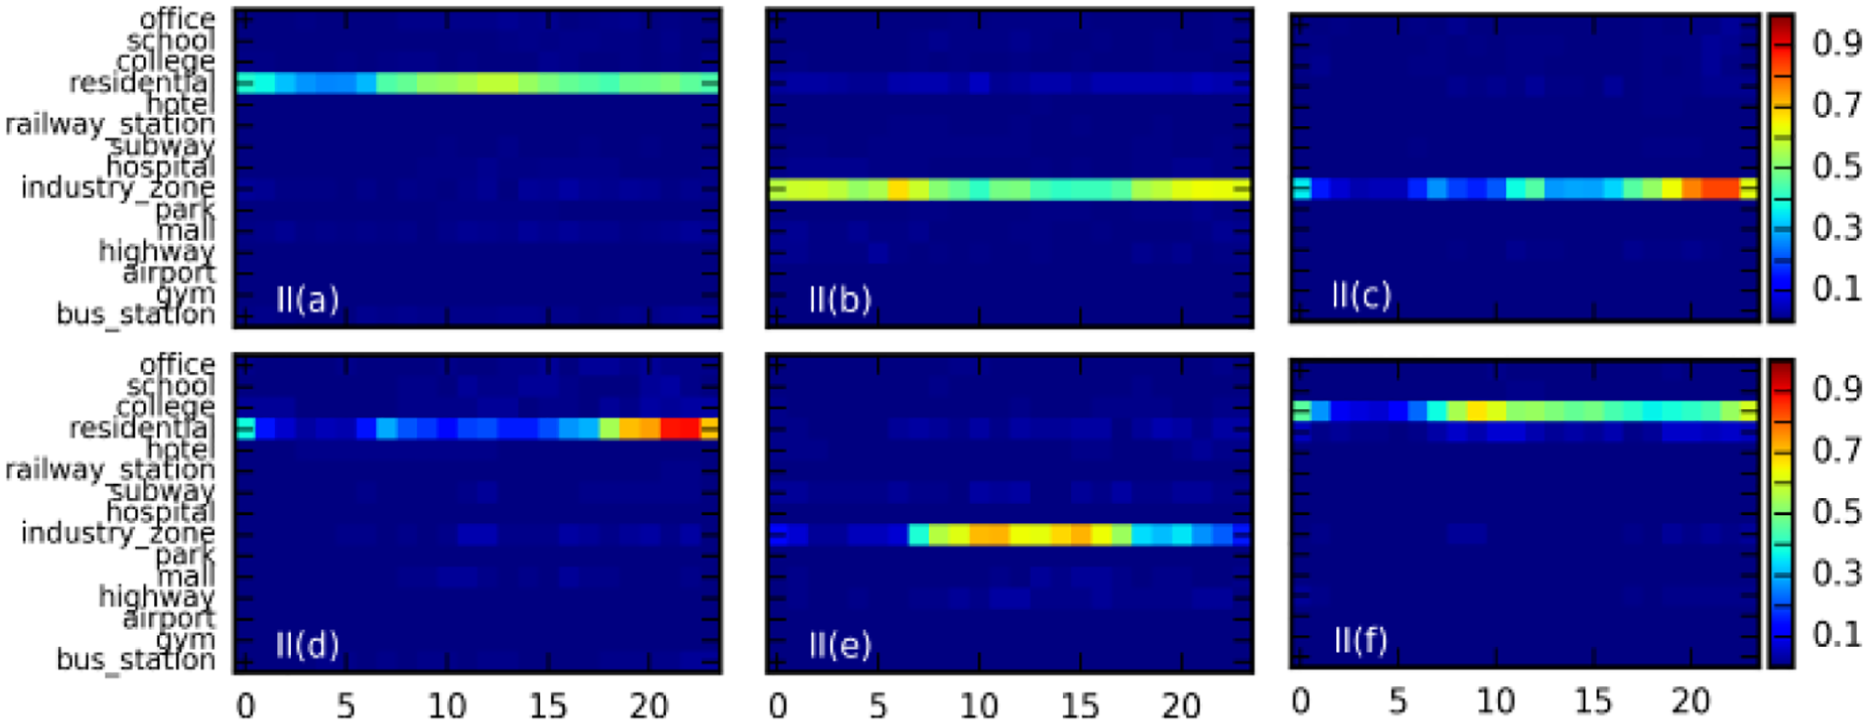
Next, we provide answer for the second question: which content are different user groups interested in, and what are their preferences for the content in different scenes? Through the combination of scene and content information, we apply the framework to class I and class II user groups in the Beijing and Jinhua regions, and the communities will be the size of the orders, respectively. Then, we select the Beijing and Jinhua areas in class I and class II user groups in the six largest community patterns for analysis. This is shown in Figures 8–11, with the horizontal axis for the service and the vertical axis for the scene.

The six major community patterns in Beijing class I users.

The six major community patterns in Beijing class II users.

The six major community patterns in Jinhua class I users.

The six major community patterns in Jinhua class II users.
Based on the six most important patterns of class I and II user groups in the Beijing area and the Jinhua area, we can obtain the following information:
In Beijing, social services are present in all patterns with high probability, which once again confirms the importance of social services in the use of the network. Compared to users of class II, users of class I are more likely to use shopping services while using social services, as shown in Figure 8 (I (a)–(f)).
Preferences of the same group in Beijing tend to show a trend of variety. For class I users, the preferences of the user groups in the different patterns are office (I (a)), school (I (b)), hotel (I (c)), residential (I (d)), hotel + office (I (e)), and hospital (I (f)). In addition, for users of class II, the preferences are office (II (e)), school (II (a)), hotel (II (c)), residential area (II (d)), school + office (II (e)), and industrial area (II (f)).
The two typical users in the Jinhua area always use Internet services in the residential, school, and industrial areas. The proportion of the three scenes in the class I is 4:1:1. And in class II it is 3:0:3. This phenomenon may be related to the user’s occupation. First, users in class II correspond to low-end mobile phone users, their occupation belongs to the workers; second, two typical users appear in the residential scenario, because Jinhua’s individual economy is developed. With a developed small commodity economy, more local residents in Jinhua tend to stay at home than those in Beijing.
Jinhua class I users’ service preferences in different scenes have significant differences. In the residential area, the users’ preference pattern for the services is portal (I (b)), shopping (I (c)), and fiction (I (d)) and users tend to search and portal (I (e)) in school, while in the industrial area, fiction dominates. This phenomenon is also related to the user identity attributes. Class II users’ service preferences in different scenes have significant differences. In the residential area, the users’ preference pattern for the services is fiction (II (c)), search (II (d)), and portal (II (e)) and users tend to portal (II (e)), portal (II (a)), fiction (II (b)), and search (II (f)) in the industrial area.
The scene preferences of mobile Internet users in different regions reflect the diversity of regional population occupations. Compared with users in developing regions (Jinhua), users in developed areas (Beijing) are more diverse and complex, reflecting the rich social career composition. By analyzing the relationship between scene and service, it is found that the users of developing regions (Jinhua) are more likely to appear in residential areas and industrial areas. In the developed regions (Beijing), compared to the developing areas (Jinhua), the user scene information is more diverse. Many users will use the mobile phone at a university (I (b), II (a)), an office (II (b)), or a hotel (I (e)), which shows that there are a large number of college students, staff, and travel personnel in Beijing, which is different from Jinhua. This also shows that multidimensional model analysis can be a detailed reflection of the occupational differences between the two places.
In the scene–content dimension constraints, the users in Beijing and Jinhua have clear network usage patterns, indicating that there is a potential association between the spatial and content dimensions in user behavior, that is, different users can form different user groups due to their own attributes or occupations, and different user groups will stay for a long time in one or several different scenes and access different types of content according to different interests based on their own attributes or occupations. For example, the group of people in Beijing (I (e)) is more likely to stay in an office or a hotel because of their occupation. In addition, business travelers, mostly composed of outsiders, are not familiar with Beijing traffic; thus, there is a greater demand for traffic services. Compared with the other user groups, such as college student groups (I (b), II (a)), other groups were found to have no demand for traffic services, indicating that the spatial and content dimensions in user behavior have a potential relationship due to user attributes.
Analysis of user behavioral patterns based on the time and scene dimensions
Then, we provide answer for the third question: which users are more likely to have Internet access in what situations, and what are their access patterns to the scenes on the timeline? We combined the time and scene dimension information and then applied the framework to class I and class II user groups in the Beijing and Jinhua regions. After that, the user community was sorted according to their size, and the six major community patterns in the class I and II groups in Beijing and Jinhua were selected. The results are shown in Figures 12–15. The horizontal axis represents the time interval, divided by hours, and the vertical axis represents the scene.
The six major pattern characteristics of class I user groups in Beijing.
The six major pattern characteristics of class II user groups in Beijing.

The six major pattern characteristics of class I user groups in Jinhua.
The six major pattern characteristics of class II user groups in Jinhua.
We can obtain the following information:
Beijing users have preference patterns for similar scenes. Specifically, I (a) and II (a) in the main users use the network service in a school scene; I (b), (e), and (f) and II (e) in the main users use the network service in an office environment; I (d) and II (c) in the main users tend to use network services in a hotel scene; I (c) and II (d) in the main users use the network services in a residential scene.
From Figures 12–15, the clustering user behavior College scene can be extracted. As shown in Figure 16, in the school scene, the typical user groups in Beijing and Jinhua are similar in temporal patterns of behavior. Two types of users are in an active state from 9:00 in the morning until 0:00 at night. This phenomenon can prove that users who attend colleges have a positive attitude toward mobile Internet services and are willing to invest more time in mobile Internet services. At the same time, the mobile Internet usage service model of user groups reflects the characteristics of this group since they are active at night to midnight. Mobile operators and service providers can provide targeted services for the characteristics of this user group.
In the office scenario, the behavioral patterns of Beijing users in the time domain are obviously different. Class I users generated three modes in the office scene as follows: users in I (b) are in an active state from 18:00 to 23:00; users in I (e) tend to use mobile Internet services from 9:00 to 18:00 with 16:00 being the peak; users in I (f) are active from 9:00 to 14:00, with 10:00 in the morning being the peak. In contrast, class II office users have only one mode (II (e)), and users are active between 8:00 and 17:00, with 10:00 and 14:00 being the peaks. In contrast, class II users in the industrial zone scene have only one mode (II (f)), and users are active between 8:00 and 23:00. In general, the majority of office users correspond to working-class workers, while the majority of users in the industrial zone are workers, and the above pattern characteristics also show that professional attributes affect the user’s purchasing power.
Different types of users in Jinhua have similar characteristics in scene preference and time patterns. For example, I (a) and II (f) show Internet behavior at a school scene and they are close to the active mode on the time axis, both in the morning from 8 am to 10 am, and at night at 23 pm the peak.
The same preference model exists in Jinhua users, but its time dimension on the model is a huge difference. For class I users, I (b), (d), and (f) show preference for residential area scenarios, but for I (b) the active period is from 7 am to 23 pm. I (e) has an active period mainly during the night, and there is a great probability of using mobile Internet only from 0:00 to 3:00 and from 21:00 to 23:00. The active period of I (e) is throughout the day but only shows a lot of Internet behavior between 2:00 and 6:00. For class II users, II (b), (c), and (e) show a preference for industrial area scenarios, but II (b) and (e) show a complementary trend, reflecting workers’ shift of the time law; II (c) is only the most active from 19 to 23 pm.
Similarly, the behavior characteristics of different regions in the scene–time dimension can lead to the following conclusions:
There are two typical user groups in Beijing and Jinhua, which have partial similarity (user behavior is similar in a single dimension) and global similarity (user groups are similar in two dimensions). Although the user profession information is missing, the differences between the different pattern features to some extent reflect the habits of mobile Internet users of different occupations, which can be mined through the above mode analysis method.
Under the constraint of “scene–time,” there are obvious network usage patterns for users in the Beijing and Jinhua regions, which indicate that there is a potential correlation between the spatial and temporal dimensions in user behavior, that is, different users form different user groups because of their own properties or professions. Different user groups will tend to stay for a long time in one or several different scenarios and have different Internet times according to different identities. For example, Beijing working-class workers (I (b), (E), (f) and II (E)) always stay in an office scene because of their identity attributes. Meanwhile, there is a “nine-to-five” activity law for some working-class workers. Therefore, user groups in such scenes did not utilize Internet content (I (E), (f) and II (E)) much in an office at night. At the same time, compared with other different user groups, such as college students, other groups were not found to have the “nine-to-five” phenomenon. This finding shows that the space and time dimensions in user behavior have potential relationships due to user attributes.
To sum up, this pattern mining framework can provide a detailed portrait of behavioral patterns of user groups in two dimensions. Compared to a single-dimensional pattern mining method, multidimensional pattern mining can subdivide user groups in another dimension, while the user groups behave alike in a certain dimension. Through fully mining the distribution difference of different types of users’ online behavior in multiple dimensions, abundant information for equipment manufacturers, network operators, and content providers can be obtained to improve service quality and user experience.

Time activity diagram for users of different categories and regions in college scenarios.
Conclusion
On pairwise combinations of time and space and the dimension of content on our information, through multidimensional pattern analysis community pattern features obtained, our study can answer the third-party questions directly (equipment manufacturers, operators, service providers, etc.) regarding the actual problem. At the same time, through the multidimensional pattern analysis of different types of user groups, we find that different types of user groups show significant differences in the usage patterns of network resources, specifically as follows:
By the combination of time and access to the content dimension information, we found that the correlation patterns of different types of user groups in access to the content on the dimension (e.g. acceptance in the way of getting information, high traffic, different types of users showed great differences), while found the corresponding groups in the dimension of time preferences. It reveals the unbalanced development of mobile Internet in developed areas (Beijing) and developing areas (Jinhua).
By the combination of space and access to the content dimensions, we found that different types of user groups with strong heterogeneity and scene preferences of mobile Internet users in different areas to a certain extent reflect the diversity of regional population occupation. Compared with the developing areas (Jinhua), the users in developed areas (Beijing) are more diverse and complex, which reflects the rich social professional compositions, and the multidimensional pattern analysis can reflect this difference.
By combining the temporal and spatial information, we found scenario preferences of Internet access for different groups and their access patterns to web resources on the timeline. In particular, in the two typical user groups in Beijing and Jinhua, there is a pattern characteristic of partial similarity (single-dimensional user behavior approach) and global similarity (user groups are similar in two dimensions). Different patterns reflect different occupations for users of mobile Internet, through multidimensional pattern analysis to the difference of mining, although the user information does not indicate occupation.
More importantly, through multidimensional user behavior analysis, clear patterns can be obtained from different regions and different types of user groups. These patterns indicate that the behavior of mobile Internet users has implicit associations in the time, space, and content dimensions, and how to effectively mine this association is the basis for a challenge of the mobile big data era.
This work can be extended to understand the user in the wisdom of the city dynamic and in different stages of regional economic development. This analysis method can be used to reveal the context information of users, such as mobile mode, flow mode, the user-selected contents, the user’s social network, and the relationship between these insightful information extraction algorithms and intelligent recommendation systems, the base station, and the pre-reading resources. It can help Internet service providers to access the mobile Internet portal in three dimensions of time, scene, and interest to understand and appropriately determine resource utilization patterns in different regions.
Footnotes
Handling Editor: Aitor Almeida
Declaration of conflicting interests
The author(s) declared no potential conflicts of interest with respect to the research, authorship, and/or publication of this article.
Funding
The author(s) received no financial support for the research, authorship, and/or publication of this article.