
Abstract
Sensor networks based on the de facto standard Berkeley TinyOS platform are changing the way environmental information is collected in the field. One such network has been designed, deployed, and tested in order to determine where ephemeral streams (small, temporary channels of runoff) form during precipitation events. This small, proof-of-concept test network was designed around a generic nondeterministic finite state machine component, which was built to be re-used in later environmental sensor network applications. A simplistic broadcast mechanism was devised to provide collective sampling interval changes to adapt to environmental conditions. In this paper, the design and testing of the ephemeral stream detection network are discussed, along with design features that can be re-used in later applications. Improvements for a later deployment of a larger, operational ephemeral stream detection network are also described.
Keywords
Introduction
The primary motivation for this experiment was the detection of ephemeral streams, or channels of runoff that contain water less than 30% of the time [1]. Detection of these streams is important for land use analysis and planning because pollutants that enter ephemeral streams will likely be transported to major bodies of water. With sensors that can gauge the total amount of soil moisture, it is possible to identify these streams by finding locations with high moisture content during storm events.
In order to compare soil moisture levels over a geospatial area, an inexpensive method or recording moisture data was needed. In addition, a power-efficient method to take samples and produce these records was required, because grid power was not available. To meet these requirements, Berkeley mote hardware was selected for its low power consumption, its ability to maintain a log of data, and its radio communication abilities for sharing information between nodes [2].
This small test network was designed around a reusable, abstract, finite state machine component that could determine when observed environmental changes were hydrologically significant [3]. In order to provide for collective adaptation to rainfall events, a simple broadcast protocol was employed to permit all nodes in the network to adjust temporal sampling resolution when soil moisture was increasing.
Mote Technologies
For this experiment, the Crossbow Corporation's Mica2dot mote was chosen. This mote features a low-power micro-controller, a 512 kb flash storage chip, six available 10-bit analog-to-digital (ADC) converter lines, and a 916 MHz radio [2]. Each mote was enclosed in a sealed housing, with its batteries and sensors connected externally. Software was written in the nesC language for the TinyOS operating system, and the software application was installed on each device.
The sensors used in this experiment were Delmhorst model GB-1 gypsum block sensors, typically used with the Delmhorst KS-D1 moisture meter (Delmhorst Instrument Company, Towaco, NJ). Comprised of a probe surrounded by a gypsum buffer, these sensors were designed to reach moisture equilibrium with the surrounding soil. Once equilibrium was reached, the total resistance to current flow was proportional to the total amount of moisture in the soil, and so the mote could measure the voltage drop through the sensor in order to gage relative soil moisture [4].
To operate the devices, software was written to run in the Berkeley TinyOS environment. Components were created to read the sensors, perform analog-to-digital conversions, log the observed moisture data, broadcast messages to other nodes, and keep track of the current time and date. Due to the complexity and steep learning curve of the Berkeley nesC language, programming the experimental network required several months.
The Finite State Machine Model
Underlying the software used in the experiment was the premise that “interesting” and hence, loggable events only occurred when there was a change in the sensor readings. Whenever the sensors remained at the same level, it was assumed that no event was occurring, and so no logging took place. This assumption was necessary due to the high current draw of writing to the flash chip [5]. As a result of acting only upon changes in the state, the principal model of software development was based on the concept of a finite state machine. This model has been used in other sensor network designs in the past [6]. Figure 1 shows how the application is designed to take advantage of a general finite state machine implementation.
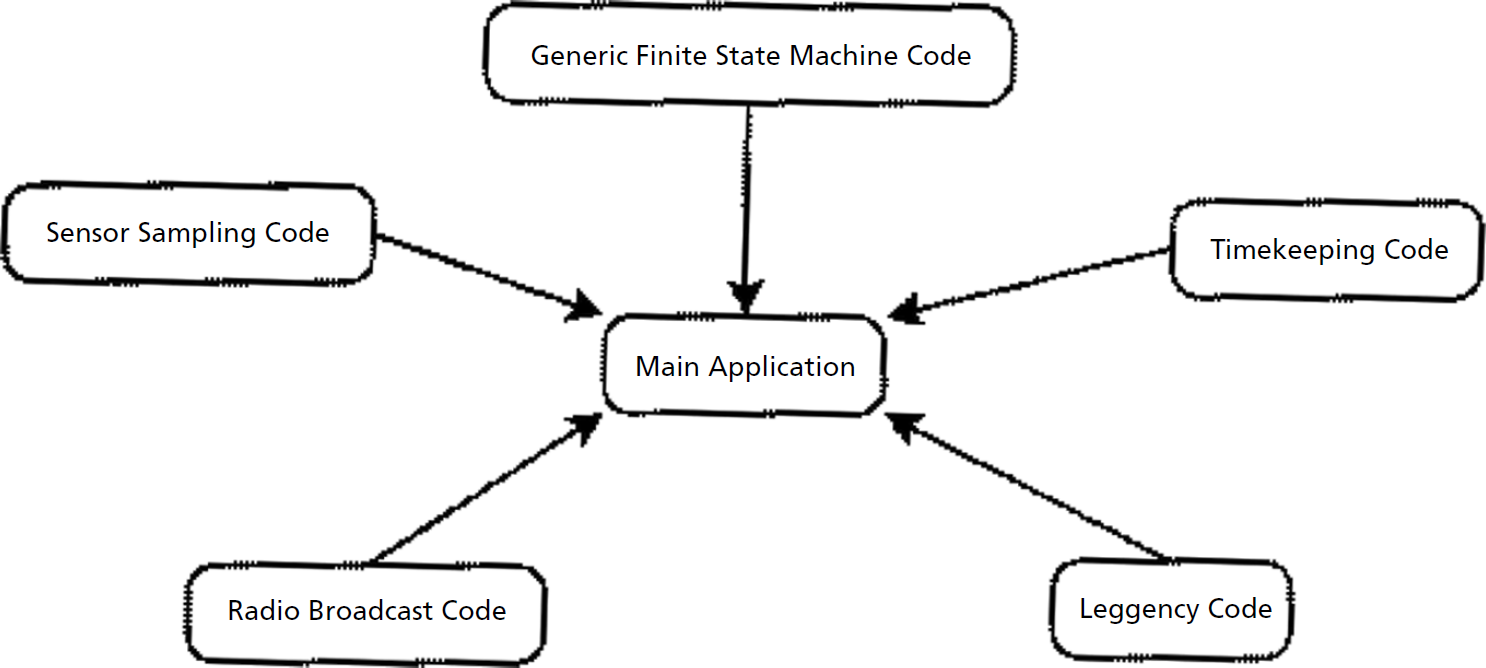
Component design of the soil moisture application.
The fundamental premise behind the operation of the finite state machine component is one of “sensor-focused design”, or a focus on building the sensor network around the sensors themselves, as opposed to creating a network and then adding the sensors to it. Since the operation of each node in the network is defined by the sensors, the network adapts itself automatically to the surrounding environment, responding only when interesting changes actually occur. While this model is simple in design, its effects are quite powerful, especially in terms of saving battery energy.
Unfortunately, a purely sensor-driven machine may not function as well as intended with the gypsum block soil moisture sensors, as there can be drift in sensor outputs relative to one another. Therefore, statistical checks were needed on the sensor output values to reduce the chances of one drifting sensor producing a false indication of a rainfall event. This check required comparing current sensor data to functions of historical values. With this model, transitions between internal node states (e.g., dry, damp, slightly wet, very wet) could not be determined from the sensor inputs alone. This resulting nondeterministic finite state machine model provided for a more reliable state transition model.
The state transition decision was made by first encoding the sensor readings on a 0–15
scale. The statistical mean and standard deviation
1
of these readings provided the historical record against
which the next sensor readings would be tested. When a timer module signaled that a new set of
readings should be taken, the mean of the new readings was calculated. If this new mean differed
from the historical mean by a scalar multiple of the historical standard deviation, then the sensor
network node would register a state change transition (Fig. 2). Otherwise, the new sensor readings would be discarded
and the historical record would be maintained until the next sampling. This Boolean transition
decision may be represented as:

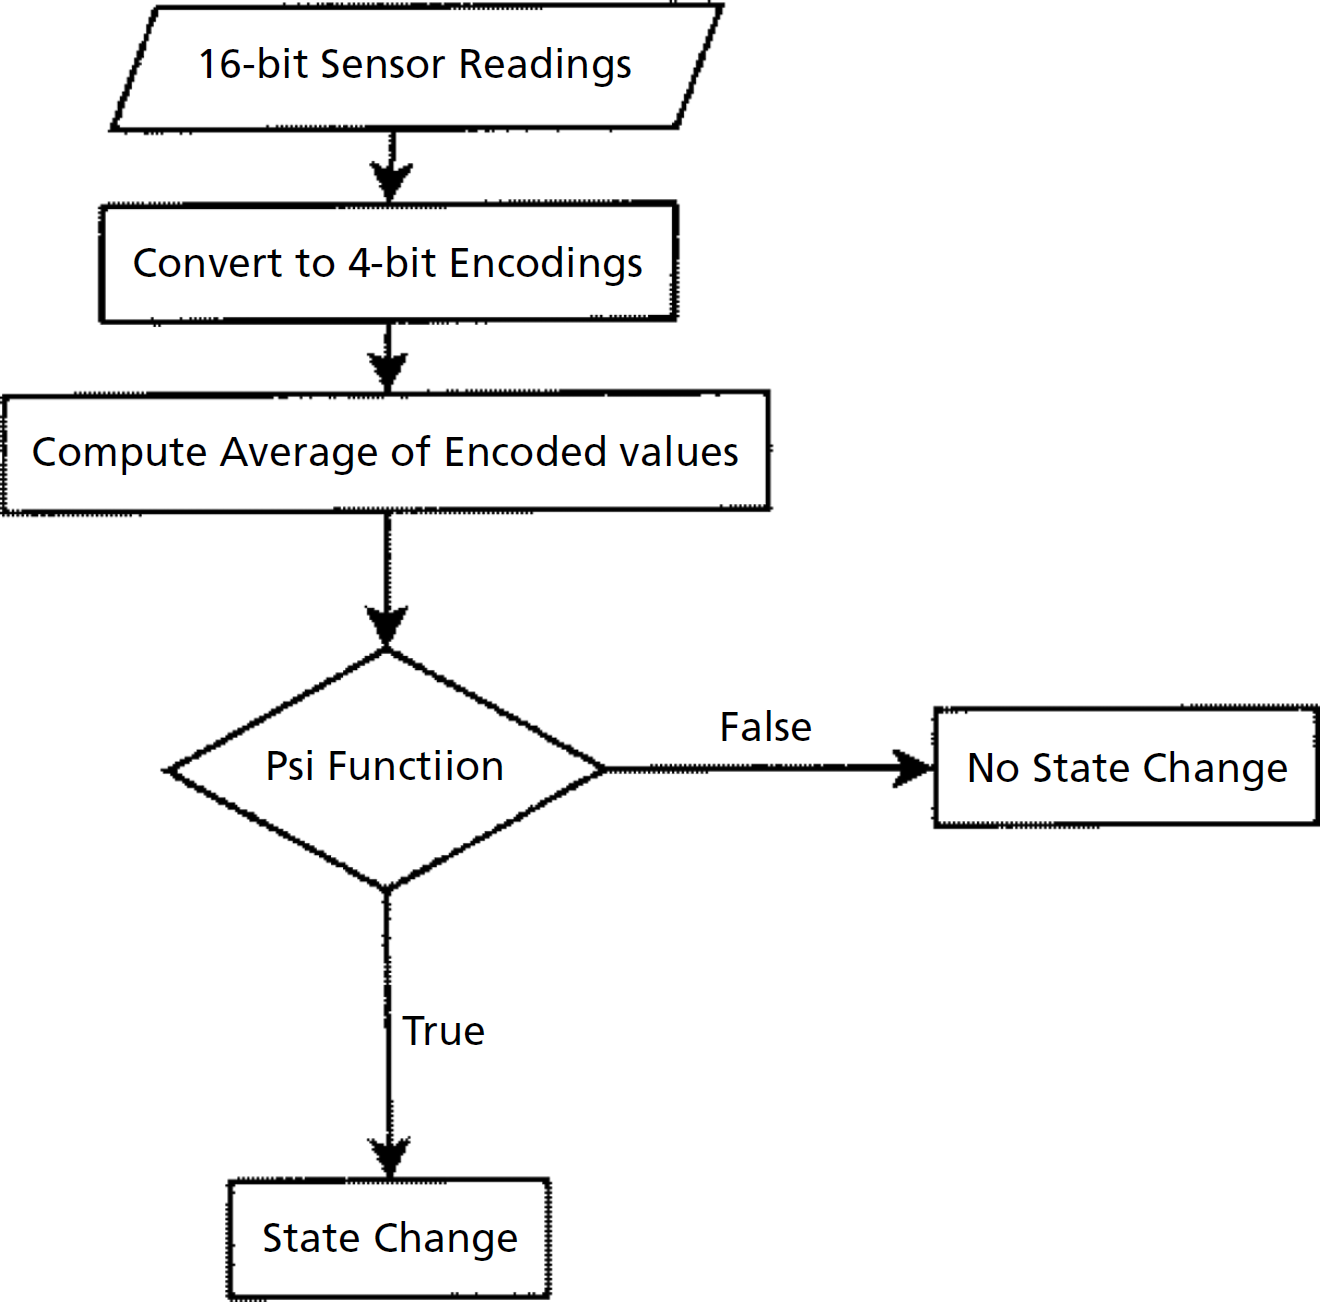
Generic finite state machine decision process.
where μ h and σ h correspond to the historical mean and standard deviation, respectively, and μ represents the new mean. The α symbol represents a constant 2 that allows for application-specific timing of the sensitivity of the state change decision by scaling the historical standard deviation in the ψ function. For this application, α was set to 1.0 at compile time.
In the event that ψ returns true for some given statistical inputs, the
new raw sensor readings are logged to the mote's flash storage memory. Furthermore, the new
mean and standard deviation replace the old mean and standard deviation for statistical logic
computations. The net result of the overall statistical state transition function A may be described
logically by:

In order to save power, it was necessary to take sensor readings typically at fifteen minute intervals. However, it was desirable to have better temporal resolution (5 minutes) during rainfall events, so that trends in soil moisture increases could be better identified. Moreover, since the primary purpose of the sensor network was for the detection of ephemeral streams (temporary rainfall runoff channels), it was expected that several nodes would record increases in moisture simultaneously. As this particular deployment lacked a gateway device for real-time data transmission, the purpose of network communications in this project was to provide for collective sampling interval adjustment.
Since a message indicating a state change on a single mote requires only a single data packet to transmit, a simple broadcast mechanism was used in lieu of a more complicated communications protocol. When a state change occurred to a state with higher average moisture, a radio message was sent to all other nodes within range. If this message was received by another node, and the average moisture state of the sending node was wetter than the historical mean on the receiver(s), then the receivers would adjust their sampling rates to five-minute intervals. Further state changes toward wetter states on any node would result in additional broadcasts. After a period of time without broadcasts, the sampling interval would be returned to fifteen minutes. These messages were used only for increasing moisture, as ground-level drying typically occurs at a much slower pace in the soils of Upstate South Carolina.
By using the simple broadcast message design, with every node broadcasting upon transitioning to a wetter state, all nodes in the network would collectively respond to rainfall events by decreasing the sample interval period. As rainfall events typically would affect the entire network, and broadcasts continued from each transitioning node even after the sampling interval was adjusted, state transition messages would be propagated through the entire network within a few samplings. Therefore, the broadcast mechanism was designed to be scalable to any size network with sufficient node density to maintain communications, assuming the density was not so great that broadcast packet collisions would be constant.
Clemson Experimental Forest Deployment
Prior to deployment of the network, it was necessary to seal the motes and their external batteries against water intrusion. Because the pins on the Mica2dot motes bent easily, it was also necessary to use a more robust connector for programming, testing, and deployment. As the mote has 18 pins, a 25-pin sub-D connector (DB-25) was chosen to connect the mote to external programming and power/sensing interfaces. The mote itself was enclosed in an inexpensive waterproof container obtained from a local vendor, with the DB-25 connector mounted on the exterior. Before deploying the network, silica gel desiccant was placed in each mote container, and the container was sealed with silicone.
Power to both the mote and sensors was provided by an external battery pack containing two AA sized lithium batteries. To protect the batteries from the weather, they were enclosed in a semi-sealed container similar to those used for the motes. A DB-25 cable was used to attach a mote, while a 9-pin sub-D (DB-9) connector attached the sensors directly to the battery box. Each sensor was wired to a dedicated pin on the mote's ADC converter and tied to a common ground. At the other end of the sensor wires, each gypsum block was buried under a shallow layer of soil. All connections were given a coating of silicone sealant to seal out water ingress, and the mote boxes were elevated above ground level to avoid their being placed in flowing water conditions. Figure 3 shows an example of the mote and battery box setup.
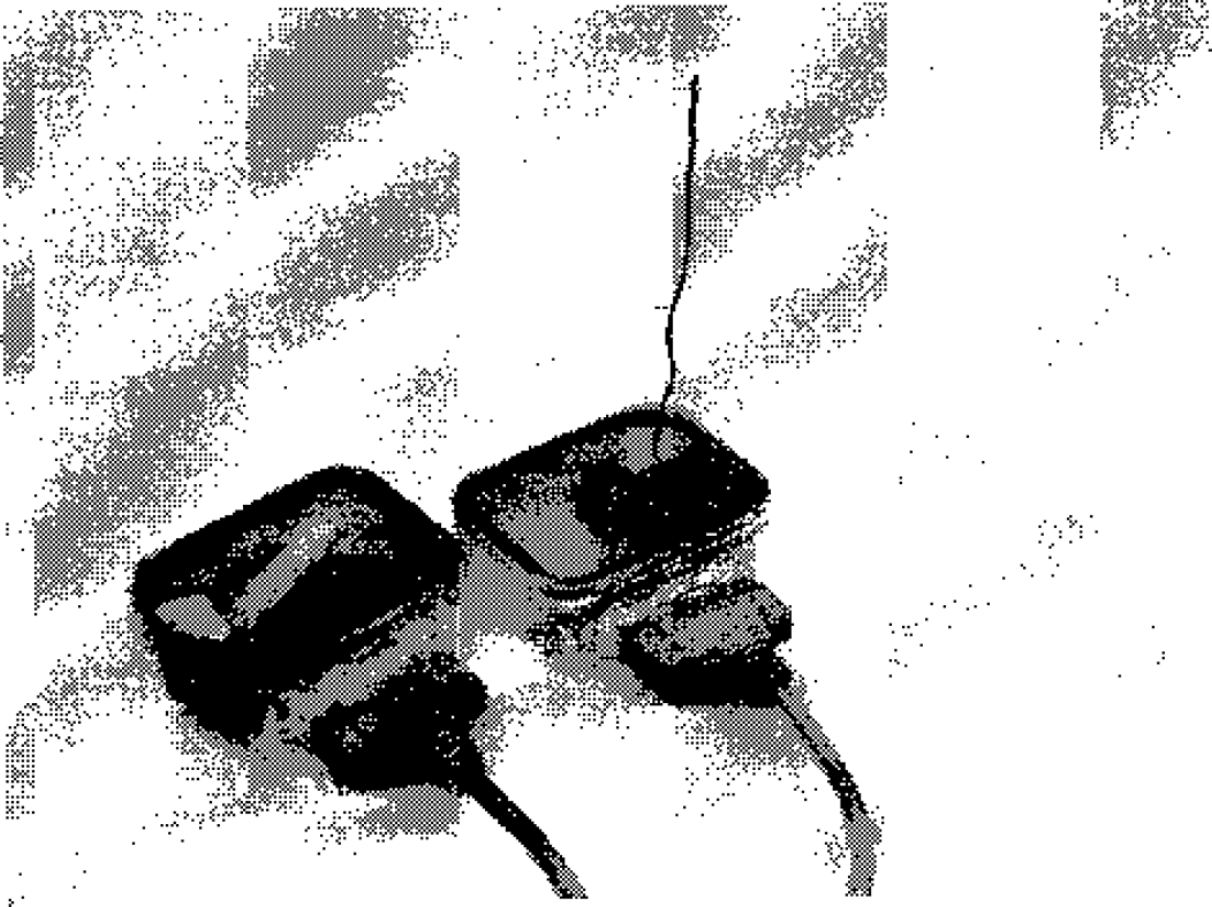
Mote and battery box setup.
After being prepared, the combined sensor, battery, and mote units were deployed in a section of the Clemson Experimental Forest, an outdoor research environment owned by Clemson University [7]. The sensors were deployed well away from the nearest roadway, on the side of a relatively steep hill in a portion of the Kenamore I watershed. During the deployment (Fig. 4), sensors were installed in three types of terrain feature: areas known to be ephemeral streams (as determined by the expert knowledge of hydrologist Dr. Tom Williams), areas known to be outside ephemeral stream channels, and areas adjacent to the stream channels, where the runoff parameters were not fully known. The exact times of battery insertion (i.e., boot times) for each mote were recorded on paper as each node was initialized.

Deploying the sensor network.
Fifteen days after the field deployment, the sensors, motes, and batteries were retrieved to the laboratory. In the process, the experiment ending time was noted individually for each node in the network. Log contents from each mote were downloaded to a workstation and analyzed. A multimeter was used to measure the final voltages of the battery packs in each battery box.
During the deployment period, which began on February 17, 2005 and ended on March 4, 2005, the surface rainfall observation station in Anderson, SC (KAND) observed measurable precipitation on February 20–21, February 24, and February 27–28 [8]. This station was the closest site to the deployment area for which data were readily available. Also, because the weather pattern for these days involved widespread regional precipitation, it was assumed that the network observed events on these dates. The results of the deployment are summarized in Table 1.
Post-deployment data
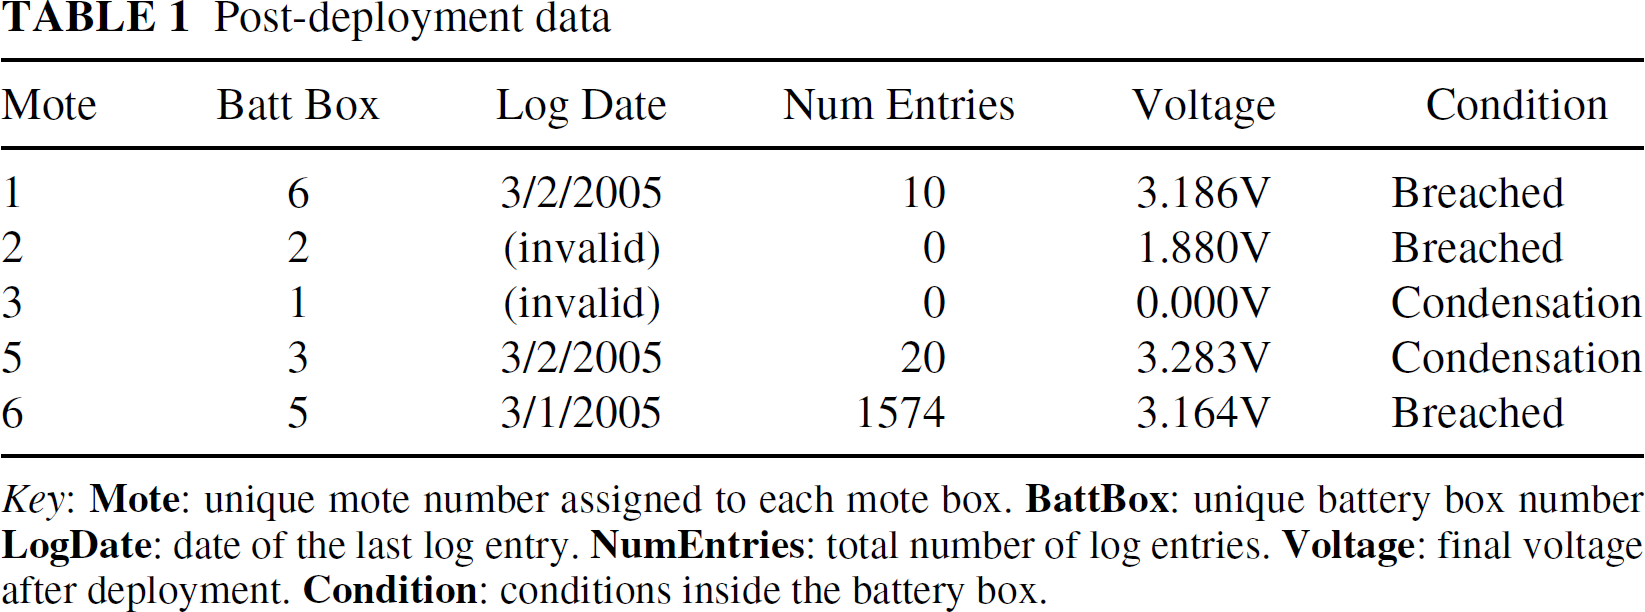
Post-deployment data
Key:
Each battery box contained some water upon retrieval. If the water level was minimal and generally indicated by droplets on the underside of the cover, it was assumed that condensation had occurred. For the three boxes in which measurable standing water was observed in the bottoms, it was determined that rainwater had breached the seals around the connectors. Fortunately, the seals on the mote boxes fared much better, as the insides of each mote housing were completely dry.
Two motes failed to log on the deployment (motes 2 and 3). The failure of mote 3 was due to human error: one of the batteries was installed backwards, and the mote never received power. The low final voltage of battery box 2 indicates that it likely flooded during the first rainfall event, creating a short circuit. The substantial number of log entries for mote 6 are attributed to a hardware wiring failure in the sensor harness. Further analysis of the data revealed that the majority of entries were zero entries, with the exception of a few nonzero entries believed to be caused by short circuits during one of the rainfall events. Because the standard deviation of zero data is itself zero, the mote logged events at each sensor reading. However, the time stamps of these readings showed that the logging interval did change between five and fifteen minutes during the deployment, confirming operation of radio communications.
Of the motes that logged properly, none recorded events on each date when rainfall occurred. Motes 1 and 5 both recorded events on February 20, while mote 6 continued to read only zero values for all sensors. Mote 1 recorded some drying on February 22, as did mote 5 on February 23. Mote 5 recorded a trend toward more moisture beginning on February 25 with data running through March 1. At about the same time in late February and early March, mote 6 appeared to short-circuit due to moisture intrusion as nonzero data was recorded. Some issues with event reading may have been caused by problems with the sensors: several of the gypsum blocks partially disintegrated over the fifteen-day deployment, well ahead of expectations.
Overall, the results of the experimental deployment were both encouraging and discouraging. Many features of the software worked properly, while many aspects of the hardware failed miserably. Water intrusion was a major culprit in the hardware failures. Future deployments will use a single sealed container for both the mote and its battery, minimizing the risk of water intrusion and associated short circuits.
As a result of the observed disintegrations, it, was determined that better soil moisture sensors should be used for future deployments. The chosen replacement sensors for the next test will be the Decagon Devices “ECHO” sensor probes, which are accurate to within 3% of soil moisture [9]. Due to the cost of these sensors, it will be necessary to scale back the number of sensors per mote from six to three.
Attendant with the reduction in the number of sensors, it will be necessary to adjust the transition function to perform a statistical analysis on a time series of data instead of on the deviations in individual measurements. In addition, some adjustments will be needed to determine the threshold at which state changes and logging occur. On the initial deployment, 1.0 standard deviations in the encoded data were needed to trigger a transition. However, that number is relatively high and likely caused the Type II error of failure to detect several events.
While a much larger ephemeral stream detection sensor network is planned for future deployment, the ramifications of this small test network and its design project further into the problem space of sensor networking in general. In the realm of development and deployment experience, the ephemeral stream network demonstrated the large number of computational and environmental issues that must be considered in generalized sensor network creation. Hardware failures and environmental impacts can have significant consequences for real-world sensor networks.
Within the software design, this test network demonstrates the viability of constructing a sensor-based network around the concept of a generic, nondeterministic finite state machine. At the base level, such a design implies that a suitable environmental-sensing network (at least with essentially instantaneous sensors) can be built around a statistically-oriented kernel of functionality that only produces network events when some aspect of the surrounding environment changes. In further generalizing this idea, the notion of a sensor-focused design emerges: rather than add sensors to a network of tiny computers, one adds computational and networking capability to environmental sensors. Thus, the sensors themselves, along with assumptions and observations about the surrounding environment, are the key element to the sensor network. Beyond any routine diagnostics and synchronization procedures, nothing happens inside the sensor network unless something in the external environment affects the sensors.
The principal consequence of the sensor-focused network design is that it tends to simplify the network. In the case of a sensor network with low-bandwidth sensors and relatively long sensing intervals, such as the ephemeral stream detection network, the actual networking protocols can be simplified (e.g., broadcast). However, these approaches can lead to incredibly powerful results when the level of simplicity is compared to the outcomes. While basic in its implementation, the broadcast mechanism in the ephemeral stream network did, in fact, accomplish its task of providing for collective sampling interval adjustment.
Although the ephemeral stream detection sensor network was, from a hydrological perspective, a failure, the net results in terms of design perspective and experience were encouraging. A future version of this same network is planned, though with a substantially greater number of nodes (200 or more). In addition, other networks built around the generic finite state machine component are planned for such tasks as stream turbidity monitoring and forest fire analysis.
Footnotes
1
Calculated with n − 1 degrees of freedom.
2
With only minor code changes, it would be possible to make α dynamic.