
Abstract
A two-stage, clonal-expansion model of liver tumor risk in mice was developed by Kodell et al. (Food Addit Contam 18:237–253, 2001) based on the hypothesis that fumonisin B1, a naturally occurring mycotoxin in corn, is not genotoxic, but rather causes cancer through the disruption of sphingolipid metabolism. This disruption is assumed to cause an increase in apoptosis, in response to which cells proliferate to compensate for reduced tissue mass. The resulting differential increase in the number of pre-neoplastic cells at risk of mutation during cell division is assumed to lead to an increase in the incidence of tumors. Two-year liver tumor incidences predicted by the model using data on organ weight, cell proliferation, and sphingolipid metabolism provided a reasonable match to the actual 2-year observed incidences in a study conducted at the National Center for Toxicological Research. The predictions indicated no risk at low doses (even a possible hormetic effect) and high risk at high doses in females, as well as a complete absence of a dose response (or perhaps, a hormetic effect) in males. This paper provides a commentary on the risk-assessment implications of the modeling results, pointing out that the model's low-dose predictions provide scientific support and justification for the U.S. Food and Drug Administration's low-ppm guidance levels in corn products. These guidance levels are significantly higher than would be obtained using linear extrapolation, the method most often used for genotoxic carcinogens and other carcinogens for which low-dose linearity cannot be ruled out.
INTRODUCTION
Fumonisin B1 is a naturally occurring mycotoxin produced by various Fusarium species of molds. It is found in corn and corn-based food products consumed by humans and in animal feeds (Dutton, 1996). Fumonisin B1 is highly toxic to horses (Kellerman et al., 1990) and pigs (Haschek et al., 1992), is carcinogenic in rodents (Gelderblom et al., 1992), and may be linked to esophageal cancer in humans (Marasas et al., 1988). A 2-year bioassay with rats and mice was conducted at the National Center for Toxicological Research under the National Toxicology Program (NTP, 1999) to characterize the risk of toxicity and carcinogenicity from consumption of food containing fumonisin B1. To enable the investigation of toxic mechanisms, the bioassay included ancillary studies of cell proliferation and apoptosis and of sphingolipid metabolism in the two target organs, liver and kidney. These ancillary studies were prompted by the presumed carcinogenic mechanism in rodents, that is, the promotion of initiated cells to tumors through continual induction of apoptosis and subsequent cellular regeneration (NTP, 1999). This nongenotoxic mechanism is believed to begin with the interruption of sphingolipid synthesis in cells due to the inhibition of ceramide synthase by fumonisin B1 (Riley et al., 1998). The resulting increased intracellular levels of sphinganine are associated with increased apoptosis (Tolleson et al., 1996; Yoo et al., 1996; Delongchamp and Young, 2001). It is hypothesized that compensatory proliferation of cells in response to increased apoptosis puts more cells at risk of mutation to malignancy, hence increasing the risk of cancer.
The nongenotoxic mechanism of carcinogenic action for fumonisin B1 has fairly strong support among scientists engaged in assessing the toxicity and carcinogenicity of fumonisins (Cohen et al., 2000). For this reason, the present authors and their colleagues previously adopted that mechanism in developing a mechanistic mathematical model to predict the risk of liver tumors in the mice that were exposed through diet to fumonisin B1 in the NTP study (Kodell et al., 2001). As was noted in the 2001 World Health Organization document on the safety evaluation of mycotoxins in food (WHO, 2001), the model was able to produce reasonably well the observed tumor rates in both female and male mice, predicting substantially increased rates above background only in females at the highest doses of fumonisin B1.
This paper will briefly review the modeling that was done by Kodell et al. (2001) to point out key characteristics of the model's representation of the hypothesized nongenotoxic mechanism for liver cancer. The reader will need to refer to Kodell et al. (2001) for complete details. The degree to which the low-dose nonlinearity of the model was reflective of the observed lower-than-background liver tumor proportions at low doses will be discussed in the context of possible hormesis. The relatively high fumonisin guidance levels set by the FDA (2001), which are supported by the low-dose nonlinearity of the mechanistic model, will be contrasted with the much lower guidance levels that would have resulted had linear extrapolation been employed to derive such exposure levels.
MECHANISTIC MODEL AND RESULTS
Key Characteristics of the Model
Kodell et al. (2001) implemented a two-stage, clonal-expansion model of liver tumor risk in mice based on the hypothesis that fumonisin B1 causes cancer through the disruption of sphingolipid metabolism, which leads to an increase in apoptosis, in response to which cells proliferate to compensate for reduced tissue mass. A schematic diagram of the model is given in Figure 1. It is especially noteworthy that if the assumed apoptotic effect of fumonisin B1 was modeled on both normal cells and pre-neoplastic cells (i.e., through both δ N (t) and δ P (t) in Figure 1), then inadequate predictions of liver tumor risk were obtained. When the apoptotic effect of fumonisin B1 was assumed to act only on the pre-neoplastic cells (i.e., only on δ P (t) in Figure 1) the predictions of tumor risk matched the observed tumor proportions reasonably well. This is consistent with observations using other stimulators of apoptosis in liver (e.g., caloric restriction) that cells with markers for pre-neoplasia are more sensitive to the stimulus than are normal cells (Muskhelishvili et al., 1996). Hence, it is the differential increase in the number of pre-neoplastic cells at risk of mutation during cell division, due to the increase in β P (t) in Figure 1 to compensate for the increase in δ P (t), that leads to the predicted increase in the incidence of tumors. In Figures 2 and 3, predictions of the 2-year liver tumor incidences by the model developed from the aforementioned mechanistic data are overlaid with the actual 2-year observed incidences (Figure 2: female mice; Figure 3: male mice). The predictions are in line with the tumor data, indicating no risk for females at low doses and high risk at high doses (with a possible hormetic effect), as well as the absence of a dose response for males (with perhaps a hormetic effect there, also).
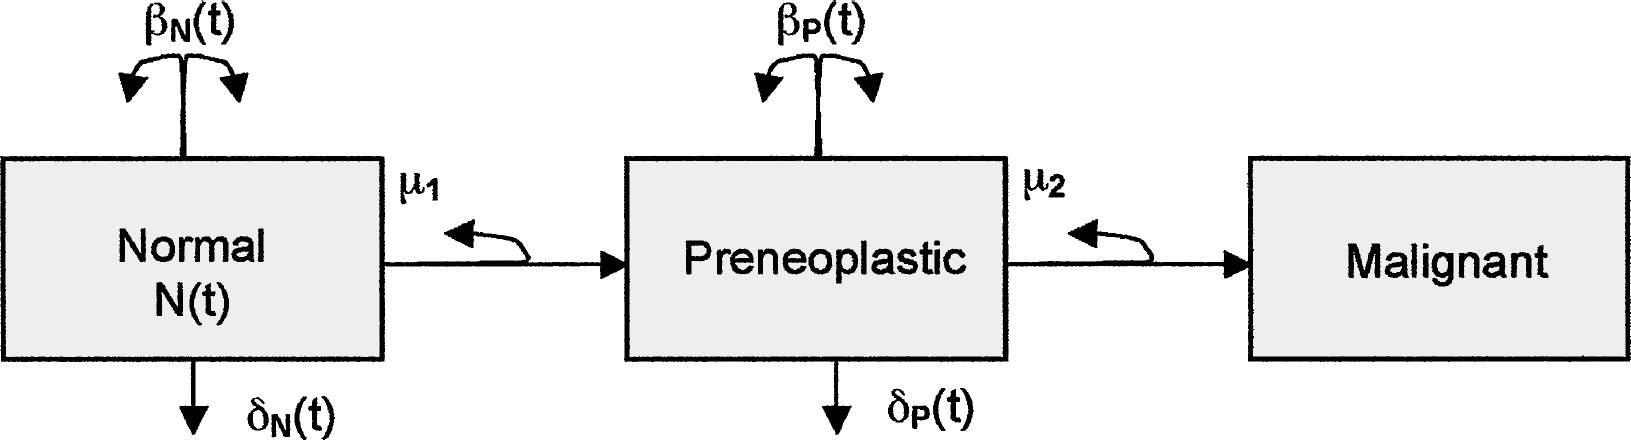
Schema of the two-stage, clonal-expansion model of carcinogenesis implemented by Kodell et al. (2001) for fumonisin B1 risk prediction: N(t) is the number of normal liver cells at time t, β N (t) and β P (t) are birth rates of normal and pre-neoplastic cells, δ N (t) and δ P (t) are death rates of normal and pre-neoplastic cells, and μ1 and μ2 are mutation rates of normal and pre-neoplastic cells, respectively.

Survival-adjusted, observed 2-year liver tumor incidences in female mice at 0, 5, 15, 50, and 80 ppm overlaid with predicted values from the mechanistic model. Observed: 0.117, 0.065, 0.021, 0.427, 0.883; predicted: 0.096, 0.085, 0.102, 0.291, 0.990.

Survival-adjusted, observed 2-year liver tumor incidences in male mice at 0, 5, 15, 80, and 150 ppm overlaid with predicted values from the mechanistic model. Observed: 0.268, 0.211, 0.190, 0.213, 0.213; predicted: 0.199, 0.201, 0.198, 0.233, 0.237.
Is the Nonlinearity Evidence of Hormesis?
The 2-year unadjusted liver tumor proportions (hepatocellular adenomas and carcinomas combined) observed in females at 0, 5, and 15 ppm were 5/47, 3/48, and 1/48, respectively. Corresponding tumor proportions in males were 12/47, 9/47, and 9/48. The fact that the 5-ppm tumor rate was below the 0-ppm rate and the 15-ppm rate was below the 5-ppm rate in both sexes suggests the strong possibility of a hormetic effect. The only statistically significant “reduction” in tumors below the background rate occurred at 15 ppm in females, where a one-sided chi-squared test at the 5% level indicated a significant difference between the 0- and 15-ppm tumor rates (p < 0.044). (With Fisher's exact test, however, this difference was not statistically significant at the 5% level (p = 0.097)).
For estimating risk at the experimental doses of fumonisin B1, survival-adjusted rates (NTP, 1999) rather than raw observed tumor rates were used, but there was little difference between the unadjusted and adjusted rates because of comparable survival rates in the low-dose groups. Although the model does predict slightly less-than-background risk at 5 ppm in females and 15 ppm in males, it does not reproduce the full degree of reduction in tumor rates below the background rate that is actually observed at both 5 and 15 ppm in both sexes. The model's prediction of slightly less-than-background risk in female mice at 5 ppm (Figure 2) coincides with a slightly lower average level of sphinganine in the liver at that dose (Kodell et al., 2001). However, at 15 ppm the average tissue level of sphinganine was higher than that at 0 ppm. In fact, the tissue sphinganine data showed a high degree of variability (Kodell et al., 2001: Figure 10), with average liver concentrations in females of 2.3 ± 0.9 (standard error), 1.7 ± 0.4, 3.2 ± 0.9, 5.1 ± 2.0, and 5.2 ± 2.5 nmol/g at 0, 5, 15, 50, and 80 ppm, respectively. Hence, it is not possible with these data to argue that tumor risk will be below background whenever tissue sphinganine is below that of controls and vice versa. An alternative explanation of the low-dose nonlinearity might be that the effect on cell death has a “threshold” for tissue regeneration. That is, it could be that at very low doses the effect of increased apoptosis actually reduces the risk of cancer because of the reduced population of pre-neoplastic cells and that only after a certain level of apoptosis is reached is compensatory cell proliferation triggered. However, the estimated rates of apoptosis and proliferation at 0, 5, and 15 ppm were virtually indistinguishable (Kodell et al., 2001: Figures 8 and 9).
With the present model and data, it is not possible to resolve whether the apparent hormetic effect reflected in the observed liver tumor proportions at low doses is real. However, the mechanistically derived model is decidedly nonlinear at low doses and gives strong evidence against low-dose linearity (Figures 2 and 3). This has important implications for risk assessment and for the setting of acceptable exposures.
Implications for Risk/Safety Assessment
The FDA's Center for Food Safety and Applied Nutrition and its Center for Veterinary Medicine recently published guidance levels for industry to control total fumonisins (fumonisins B1, B2, and B3) in various corn-based human food products and animal feeds (FDA, 2001). These (nonbinding) guidance levels represent maximum total fumonisin levels that the FDA considers adequate to protect human and animal health and that are achievable in human foods and animal feeds with the use of good agricultural and good manufacturing practices. For example, the concentration of total fumonisins in degermed dry-milled corn products (e.g., flaking grits, corn grits, corn meal) should not exceed 2 ppm. For cleaned corn intended for popcorn, the guidance level is 3 ppm. In animal feeds intended for poultry being raised for slaughter, the maximum concentration of total fumonisins should not exceed 100 ppm (no more than 50% of diet), whereas for horses and most pet animals the guidance level is 10 ppm (no more than 50% of diet).
It is noteworthy how close the guidance levels for human foods are to the experimental doses of the NTP rodent study. It is quite unusual for regulatory agencies to set levels this high relative to experimental levels. In the regulation of chemicals, often the absence of sufficient information to rule out low-dose linearity leads to much lower allowable levels that are determined by linear extrapolation from the experimental dose range down to doses expected to correspond to negligible public health risks (e.g., 10−4 to 10−6). The mathematical model's prediction of no increase in risk at low doses in mice based on a generally accepted nongenotoxic cancer mechanism for fumonisin B1 provides strong support for the FDA's deviation from linear extrapolation in its comprehensive safety assessment to set guidance levels for fumonisins.
To gain additional perspective, suppose that linear extrapolation via the multistage model had been used to determine acceptable exposure levels. Although the data for female mice are decidedly nonlinear (actually U-shaped), a multistage model can be fitted that is not rejected by a goodness-of-fit test (Figure 4). Figure 5 shows the background-subtracted best-fitting multistage model and the (linear) upper 95% confidence limit on excess (added) risk above background in the extreme low-dose region. Note that the upper confidence limit on excess risk at 5 ppm, the lowest dose in the mouse studies, is 10−2, which is several orders of magnitude above what most regulatory agencies consider acceptable public health risk. To assure an excess risk of no more than 10−6 (in mice, at least) would dictate a dose level of 0.0005 ppm (500 ppt; Figure 5). This suggests that much lower guidance levels than those actually set by the FDA might have resulted had there not been a generally accepted nongenotoxic mechanism for fumonisin B1 with mechanistic data to support it.

Observed 2-year liver tumor incidences in female mice (5/47, 3/48, 1/48, 19/47, 39/45 at d = 0, 5, 15, 50, 80 ppm) overlaid with predicted values from the best-fitting multistage model: P(d) = 1 — exp(-0.06354779 – 0.00000371d3).

Background-corrected best-fitting multistage model overlaid with 95% upper bound on excess risk at low doses.
DISCUSSION
The availability of mechanistic data on the purported nongenotoxic mechanism of carcinogenic action of fumonisin B1 provided an opportunity to develop a mathematical dose-response model (Kodell et al., 2001) whose low-dose predicted tumor risks in mice could be compared to the nonlinear (less-than-background) tumor rates actually observed in the experimental animals (NTP, 1999). Although the model was developed primarily from ancillary mechanistic data, the predictions matched the observed tumor data reasonably well, indicating no increased risk of liver tumors at low doses in females and significantly increased risk at high doses. The model's successful predictions of tumor risk in female mice were validated by its prediction of no increased risk in males throughout the whole experimental range, in agreement with the observed data.
Although the mechanistic data and model are not strong enough to demonstrate conclusively a hormetic effect in the tumor response at low doses as suggested by the 2-year tumor proportions, they are sufficiently strong to rule out low-dose linearity, which has immediate consequences for regulating exposures to fumonisin B1. In this regard, the model's results provide scientific support and justification for the FDA's low-ppm guidance levels in corn products for both humans and animals (FDA, 2001). Those levels are significantly higher than would be obtained using linear extrapolation, the method most often used to regulate purported genotoxic carcinogens and other carcinogens for which low-dose linearity cannot be ruled out.
In its characterization of fumonisin B1's dose-response relationship for cancer, the Joint FAO/WHO Expert Committee on Food Additives included an extensive discussion of the implementation by Kodell et al. (2001) of the mechanistic model in mice (WHO, 2001: pp. 198–203) while also relying heavily on the observed threshold-like kidney tumor response in the experimental rats from the same NTP study. The case of fumonisin B1 provides an example of the impact that credible data and models relevant to a hypothesized mechanism of action can have on exposure levels that are set by public health agencies.