
Abstract
The National Toxicology Program (NTP) dose-ranging studies typically employ five dosages and a concurrent control and are conducted for 2- and 13-week exposure periods. Because five doses are employed it suggested the possibilities of the occurrence of sub-NOAEL doses in many of these bioassays and of evaluating the occurrence of hormesis within the NTP bioassay. As a result, 59 environmentally relevant agents in the NTP toxicity database were assessed for their capacity to affect hormetic dose responses for growth as measured by change in weight gain. Hormetic effects were observed with 51 (88%) of the 58 agents evaluated. When considered by species, hormetic effects were observed in 48% (98/205) of bioassays involving mice and 14% (29/204) of bioassays involving rats. Hormetic effects were seen in a comparable fashion between males and females of both mice (i.e., 47 male and 51 female) and rats (13 male and 16 female rats). These observations represent a new finding within the NTP bioassay database that have potential implications for issues relating to study design and endpoint measured, as well as underlying biological mechanisms that affect efficiency of nutrient utilization under conditions of low-level toxicant exposure.
Keywords
INTRODUCTION
Hormesis is a dose-response phenomenon characterized by a high-dose inhibition and a low-dose stimulation (Fig. 1). Recent publications have revealed that hormesis is highly generalizable according to agent, biological model, and endpoint measured (Calabrese and Baldwin, 1997, 2001a; Calabrese et al., 1999). Other research has indicated that hormetic effects may be seen in up to 40% of toxicological experiments that satisfy a priori study design requirements (Calabrese and Baldwin, 2001b) and are more common than the traditional threshold model in a substantial direct comparison (Calabrese and Baldwin, 2003). Because study designs that include a substantial number of dosages are more likely to have the opportunity to assess hormetic phenomena, it is suggested that the dose-range-finding studies of the National Toxicology Program (NTP) may offer potential to explore hormetic responses because these experiments typically contain a current control and five doses. Consequently, this paper evaluates the occurrence of hormetic dose responses within the NTP database for dose-range-finding experiments.

Quantified features of hormetic dose-response curves.
MATERIALS AND METHODS
Database Selection
The NTP toxicity database is a highly systematic and substantial government-mandated toxicological program. The range of NTP chemicals studied focuses primarily on organic compounds produced in high volume by U.S. industries (Table 1). The study design of the subchronic toxicity bioassay typically consists of a control plus five doses and is conducted for 2- and 13-week exposure periods with both sexes of young (i.e., 4–8-week week-old) Fisher 344 rats and B6C3F1 mice. This permits evaluation of the capacity of young animals to display hormetic responses within the contexts of interspecies variation, gender, and exposure scenario.
List of chemicals (including mixtures) and agents in the NTP toxicity database available for evaluation

Endpoint Selection
Gain in body weight was chosen as the parameter for evaluation of hormetic response. Due to its possible impact on body-weight, feed consumption data (when available) were also assessed and directly compared with body-weight gain. Because disease incidence is essentially negligible within the 2- and 13-week exposure scenarios of the toxicity studies it is not an appropriate endpoint. Other parameters, such as serum chemistry and hematology data, also do not lend themselves to hormetic evaluation because any change from homeostasis would be considered harmful or of unknown significance.
Evaluation Criteria
Evidence of hormesis was evaluated for gain in body weight using the quantitative ranking scheme of Calabrese and Baldwin (1997; Table 2) for inverted U-shaped curves. The capacity for an experiment to demonstrate hormesis was assessed by comparing the summation of point values to point ranges established for six evidence categories: high, moderate-high, moderate, low-moderate, low, and no-low.
Summary of criteria with assigned point values used in the quantitative evaluation of hormesis

The point value is multiplied by the number of experimental doses falling within the corresponding percentage range. For example, if an experiment has three doses exhibiting stimulatory responses within the 125–150% range, then the total number of points will be 3 × 1.0 = 3.
Source: Calabrese et al., 1999.
Dose-Response Curve Quantification
The features of the dose-response relationships quantified in this analysis are the maximum stimulatory response, the width of the stimulatory zone, and the distance from the maximum stimulatory response to the zero equivalent point (ZEP; i.e., the highest dose showing a response equal to the control response; Fig. 1).
Relational/Retrieval Database
Data for those studies demonstrating evidence of hormesis were entered into an existing relational/retrieval database created in FoxPro to facilitate evaluation.
RESULTS
Quantified data for calculation of percent weight gain were provided in 48 of the 49 NTP toxicity reports. Evidence of hormesis was observed in 45 of these 48 reports (94%). A total of 409 dose-response relationships (i.e., bioassays) involving 58 agents and rats and/or mice were evaluated for evidence of hormesis. Assessment by individual dose-response relationships revealed that hormetic effects are present in 31% (128/409) of dose-range-finding bioassays involving rats and mice (Table 3). Based on the ranking scheme, the majority of these dose-response relationships demonstrated low evidence of hormesis (i.e., 76%) or 98/128). Low-to-moderate evidence was observed in 16% (21/128) of the dose-response relationships, moderate evidence in 5% (6/128), moderate-to-high evidence in 1.5% (2/128), and high evidence in 0.8% (1/128). Representative dose-response relationships derived from the NTP toxicity data are displayed in Figure 2.

Representative dose-response relationships depicting hormetic responses in weight gain (expressed as percent control) in young B6C3F1 mice exposed to a wide range of environmentally relevant chemicals. Data derived from NTP toxicity dose-range finding studies.
Summary of findings organized by NTP Toxicity Report Number (Tox #)

Rat strain = F344/N and mouse strain = B6C3F1 unless otherwise stated under comments.
Note: H denotes positive evidence of hormesis; 0 denotes no evidence of hormesis based on evaluation scheme of Calabrese and Baldwin (1997).
Abbreviations: D = dermal; F = feed; G = gavage; I = inhalation; IP = intraperitoneal; W = drinking water; WB = whole body;
denotes hypothesis testing results reported.
Feed consumption information was generally only reported when the route of exposure was through feed. Of the 10 reports presenting quantitative feed consumption information, the data did not appear to account for the hormetic effects observed for weight gain (Fig. 3).

Representative dose-response curves incorporating food consumption information.
When evaluated by species, hormetic effects were observed in 48% (98/205) of bioassays involving mice and 14% (29/204) of bioassays involving rats (i.e., hormetic effects were more often observed in mice than rats by a factor of 3.4). Assessment by gender revealed that hormetic effects were observed similarly in males and females (i.e., 47 male and 51 female mice; 13 male and 16 female rats).
Concordance of the hormetic response over time (i.e., hormetic effects observed at the end of the 2-week bioassay were also seen at the end of the 13-week bioassay) was observed only in mice with females showing concordance 1.7 times more often than males [i.e., 11 of 18 bioassays (61%) involving female mice showing evidence of hormesis at 2 weeks also showed evidence of hormesis at 13 weeks compared to 8 of 22 bioassays (36%) involving male mice].
Assessment by agent revealed that hormetic effects were observed with 51 (88%) of the 58 agents tested. (Quantitative weight data was not provided in the toxicity report on ethylbenzene.) Hormetic effects were not observed in bioassays with p-chloro-α,α,α-trifluorotoluene, m/p-cresol, n-hexane, mixture of 25 groundwater contaminants, pesticide fertilizer mixture (Jowa), sodium sclenite, or tetrachlorophthalic anhydride.
Quantitative features of the dose-response relationships displaying evidence of hormesis are presented in Table 4. Evaluation of the magnitude of the maximum stimulatory response revealed that 77% (i.e. 99/128) showed a maximum stimulatory response between 109 and 140% of the control response. The width of the stimulatory zone was less than 20-fold in 81% (34/42) of the dose responses evaluated. The distance from the maximum stimulatory response to the ZEP was less than 5-fold in 69% (34/39) of the dose responses evaluated.
Summary of quantitative features of the hormetic dose-response relationships
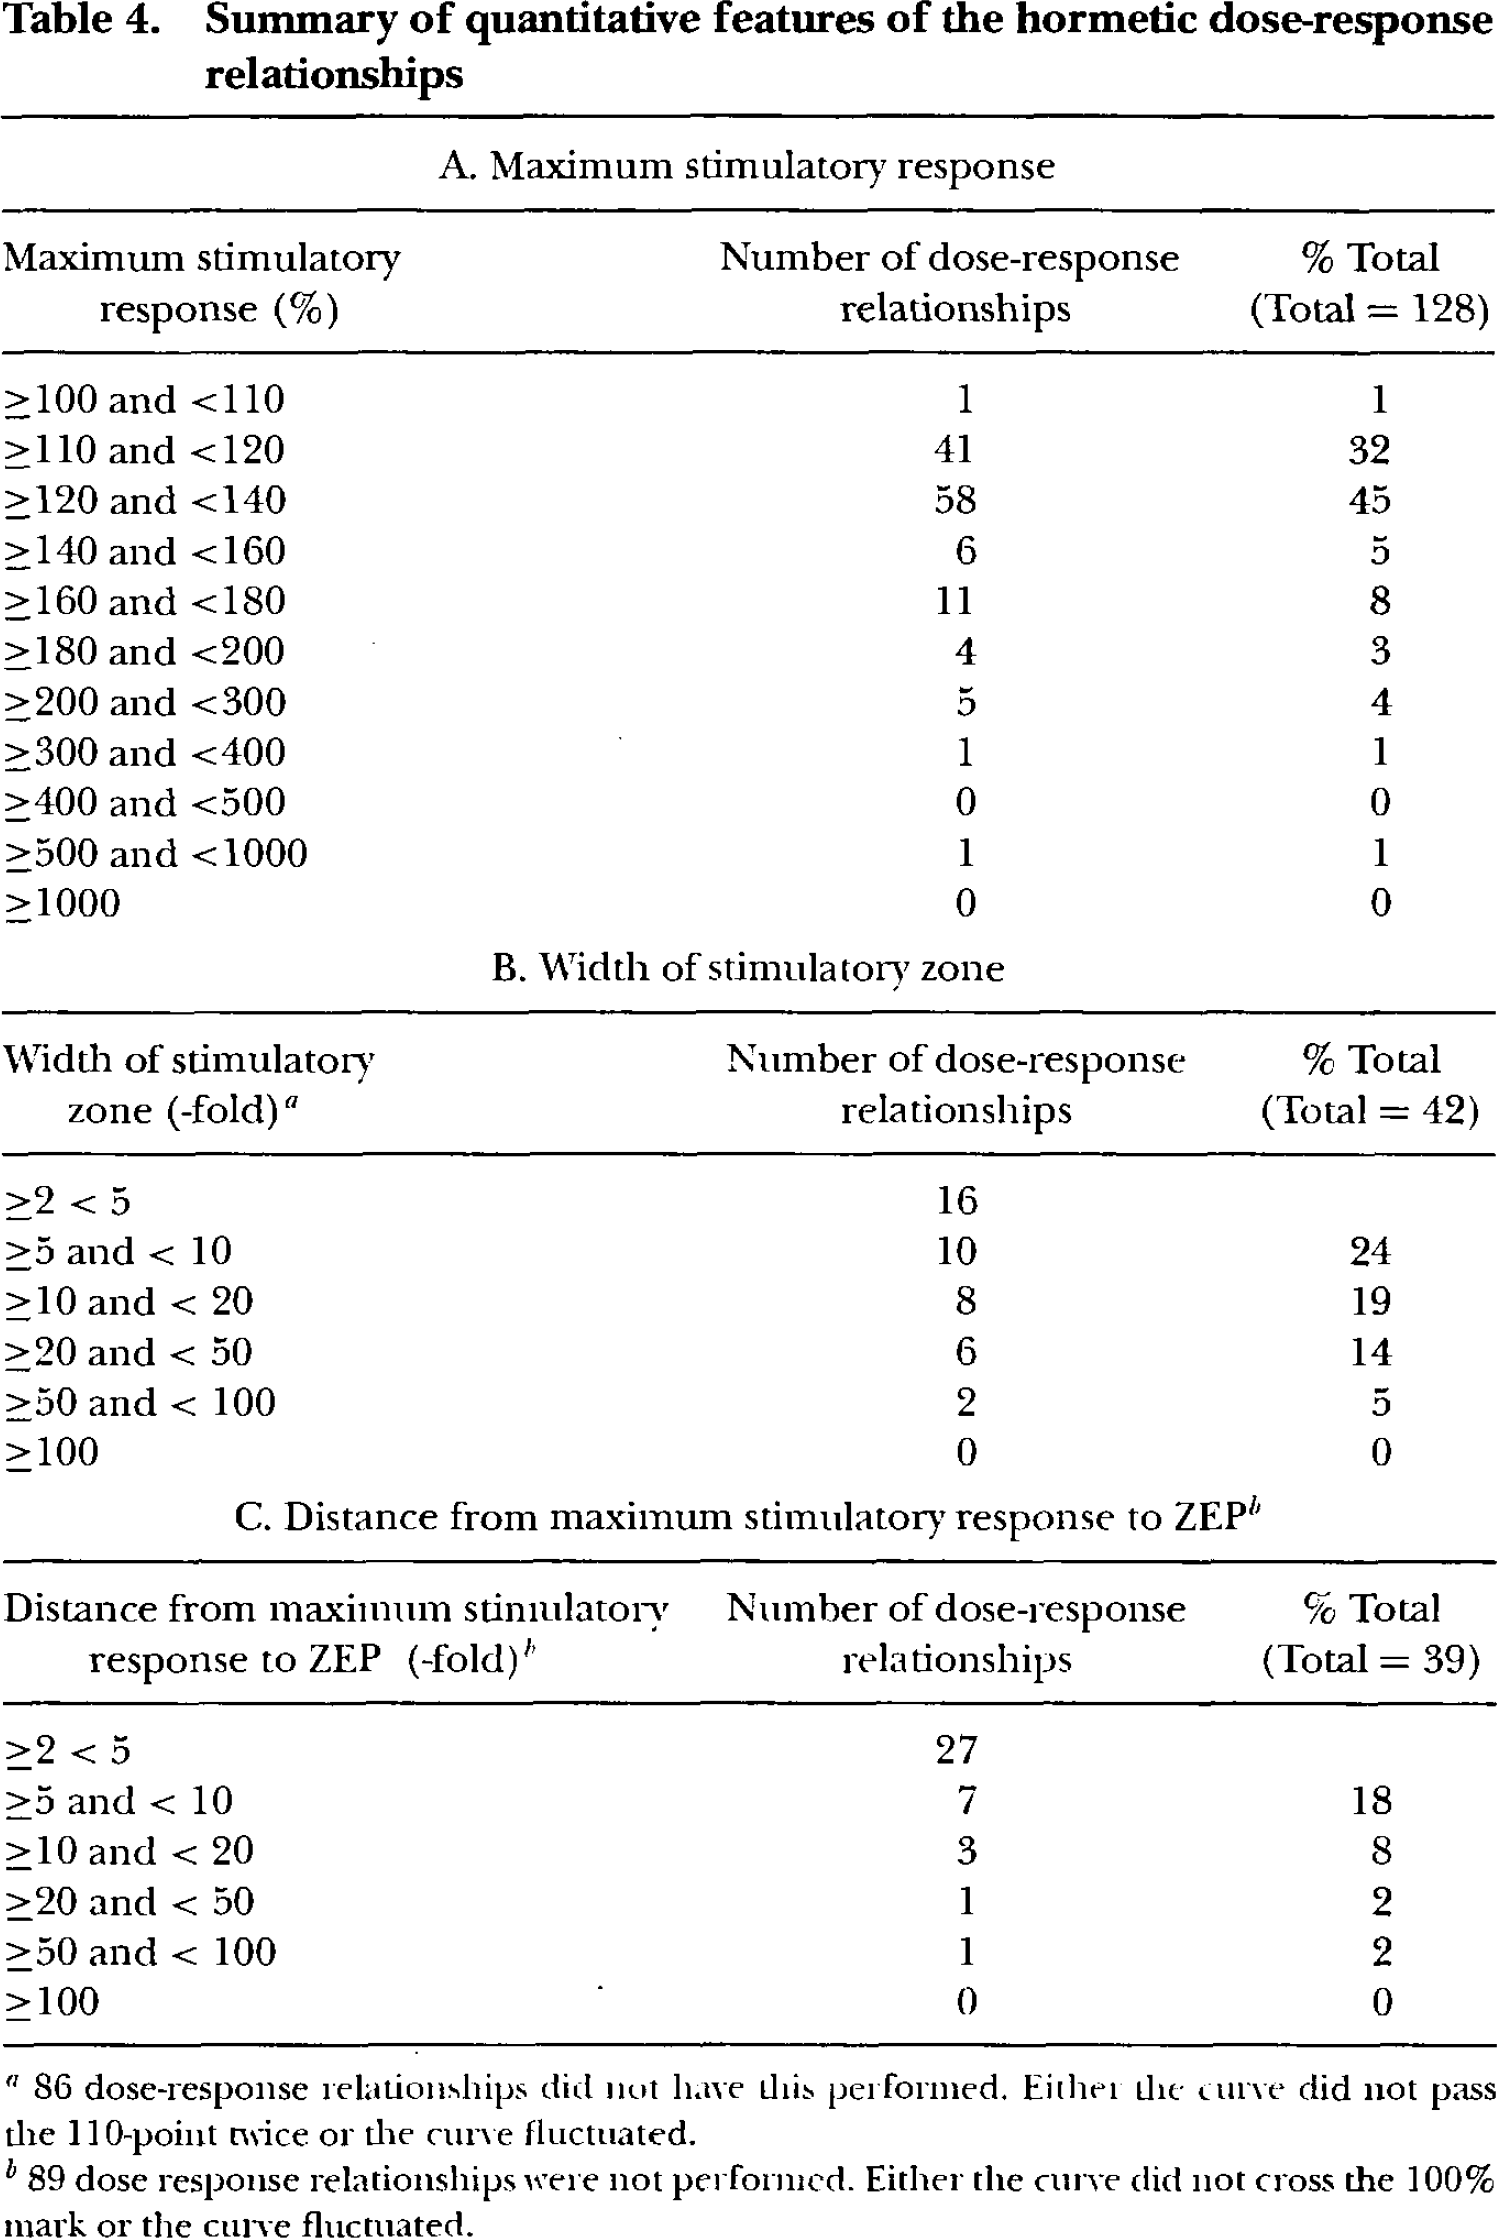
86 dose-response relationships did nut have this performed. Either the curve did not pass the 110-point twice or the curve fluctuated.
89 dose response relationships were not performed. Either the curve did not cross the 100% mark or the curve fluctuated.
DISCUSSION
The occurrence of hormetic dose-response relationships within the NTP bioassay database represents a new finding. The hormetic observations in these NTP range-finding studies demonstrate the significance of study design features in the assessment of possible hormetic dose-response relationships. In the present case, the dose-range-finding studies of the NTP typically employed five dosages along with a concurrent control. The dosage selection was also focused on trying to estimate the highest dosages that could be administered over a normal experimental lifetime. These two factors [i.e., number of dosages, and their intention to discern a possible dosage that would approximate a chronic no adverse effect level (NOAEL)] enhanced the chances of observing hormetic dose response. The additional dosages are critical to demonstrate a dose-response pattern consistent with the hormetic model. The attempt to identify a quasi NOAEL is also important because it provides an opportunity to denote the dose-response transition from a hormetic response, just below the NOAEL, and the traditional toxic response as the NOAEL is exceeded.
While the dose-range studies of the NTP offered the aforementioned study design advantages, it also had important limitations especially with respect to endpoint selection. Because the mice and rats were very young and the studies were of limited duration (2–13 weeks), disease incidences were not expected to increase and typically did not occur, thereby precluding a wide range of toxicological endpoint comparisons. Nonetheless, during this developmental period there are notable changes in growth patterns as reflected in changes in body-weight gain. The body-weight-gain pattern is also one that represents an integration of overall developmental progress and offers important insight for biomedical and toxicological interpretation.
The quantitative features of the hormetic dose-response patterns were similar to those reported in previously published studies for various biological models, endpoints, and other chronic agents. This was the case for both the magnitude of the stimulation and the stimulatory range.
The findings revealed that hormetic responses were more common in mice, especially in males, than in rats. While there is no explanation to yet account for these observations it may have both biological as well as study design considerations.
Despite the large number of examples of hormetic dose-response relationships presented and the relatively strong NTP study designs assessed in the present paper, it is important to emphasize that the magnitude of the hormetic stimulation is modest. This places special need on not only the quality of the study design but also the need for replication of findings, a feature generally absent in the NTP bioassay database. Such lack of replication limits confidence in the observed findings and the hormetic interpretation.
Finally, the observation that the enhanced weight gain at low dosages was not accounted for by an increased consumption of feed is intriguing (Figs. 3A—H). Although of a preliminary nature, it suggests that at the low dosages where hormetic responses were observed there may have been an enhanced efficiency in the utilization of consumed nutrients. The issue of growth stimulation by low doses of other toxic substances such as antibiotics (Luckey, 1956, 1958, 1978; Luckey et al., 1956) and diethylstilbestrol (DES) (Nicol and Ware, 1960) has long been recognized. Although their dose-response features are similar to the findings of the present study, no clear understanding of the mechanisms underlying this phenomenon have been clarified.