
Abstract
Surface treatments of primary circuit components in light water reactors are regarded as possible ways to mitigate environmentally-assisted cracking (EAC). To date, it is not fully conclusive which surface condition is suitable to reduce the EAC initiation susceptibility. Constant extension rate tensile (CERT) tests were performed by several labs using flat tapered tensile specimens with different surface conditions (ground, industrial face milled, advanced face milled and shot peened), exposed to a boiling water reactor normal water chemistry environment at 288°C. Despite some scatter in the results, the CERT tests revealed that the EAC initiation susceptibility seems lowest for the advanced face milled surface and highest for the shot peened surface. However, it must be emphasised that the differences were moderate and that the surprising behaviour of the shot peened surface can be explained. The mechanical grinding of the surface did not significantly retard EAC initiation compared to industrial face milling.
Keywords
Introduction
Alloy 182 is widely used as a filler metal/welding electrode for dissimilar metal welds between austenitic stainless steels, Ni-base alloys and low-alloy steels [1,2] for the shielded metal arc welding process. However, several cases where Alloy 182 suffers from environmentally-assisted cracking (EAC) in light water reactor environments have been reported [3,4]. EAC is one of the major failure mechanisms occurring in light water reactors, affecting the safe, reliable and economic production of nuclear energy. Although more resistant weld metal fillers, e.g. Alloy 82 and 52 are used in new designs, numerous plants still have a considerable amount of weldments made of Alloy 182. Moreover, specific information on EAC crack initiation is not available as the cracks are typically detected at a mature state of development, owing to practical limits of detection tools and inspection intervals or, very rare, after the mature crack has developed to penetrate the component wall causing leaking.
The condition of the surface exposed to the primary circuit coolant plays a major role in the initiation susceptibility of components to EAC. However, many international and national standards and guidelines do not include requirement on surface condition of critical components in nuclear power plants [5]. The conventional manufacturing of the nuclear components requires surface machining, which inevitably results in different levels of surface cold working, depending on the specific process. The cold working can influence the surface layer mechanical properties, residual stress profiles, oxide layer and machining deformation microstructure, which alter the EAC behaviour (initiation and early-stage growth) of Ni-based alloys [6–9]. Furthermore, the surface treatments or modifications on the primary circuit components in light water reactors are considered as potential methods for mitigating EAC initiation. Reliable prediction of the EAC initiation behaviour of Alloy 182 with different surface treatments is therefore considered to be very important for the safe long-term operation of existing nuclear power plants, as well as for the development of promising mitigation solutions to inhibit EAC. Although numerous studies have been conducted to study the EAC initiation of Ni-based alloys [10 14], to date there are no sufficiently qualified and quantitative data available on the effect of surface machining on the initiation of EAC for Alloy 182, and it is not clear which surface condition can inhibit EAC initiation of Alloy 182 most effectively under light water reactor environments.
In this work, the effects of machining surface finishes (ground, industrial face milled, advanced face milled and shot peened) on the EAC initiation susceptibility of Alloy 182 material were studied by several labs with constant extension rate tensile (CERT) tests on flat tapered tensile (FTT) specimens tested in simulated boiling water reactor (BWR) environment. This work focuses on evaluating: (1) the surface finish, machining deformation and microstructure associated with different surface treatments, (2) the effect of surface finish and strain rate on the EAC critical stress and (3) the scatter of EAC initiation data generated by several labs. This study was carried out in the framework of the EU Horizon 2020 project titled ‘Mitigating Environmentally-Assisted Cracking through Optimisation of Surface Condition’ (MEACTOS, www.meactos.eu).
Experimental
Material, surface treatments and specimens
The procured Ni-base weld metal Alloy 182 was produced by weld overlay technique on an Alloy 82-cladded low-alloy steel plate by Equipos Nucleares S.A. (ENSA), as schematically shown in Figure 1(a), and was post weld heat treated at 600 °C for 15 min. The thickness of the weld overlay Alloy 182 layer was around 20 mm and its chemical composition is shown in Table 1. The post weld heat treated Alloy 182 had a yield stress and ultimate tensile stress of 358 and 591 MPa, respectively.
(a) Schematic of low-alloyed steel (LAS) bed pieces and Alloy 182/Alloy 82/low alloy steel weld overlay structure. (b) Alloy 182 specimen orientation: L direction is parallel to the welding direction of the overlay weld. (c) Schematic of the Alloy 182 flat tapered specimen used for CERT test, where the dimensions are in mm. Chemical composition (wt-%) of Alloy 182 material investigated.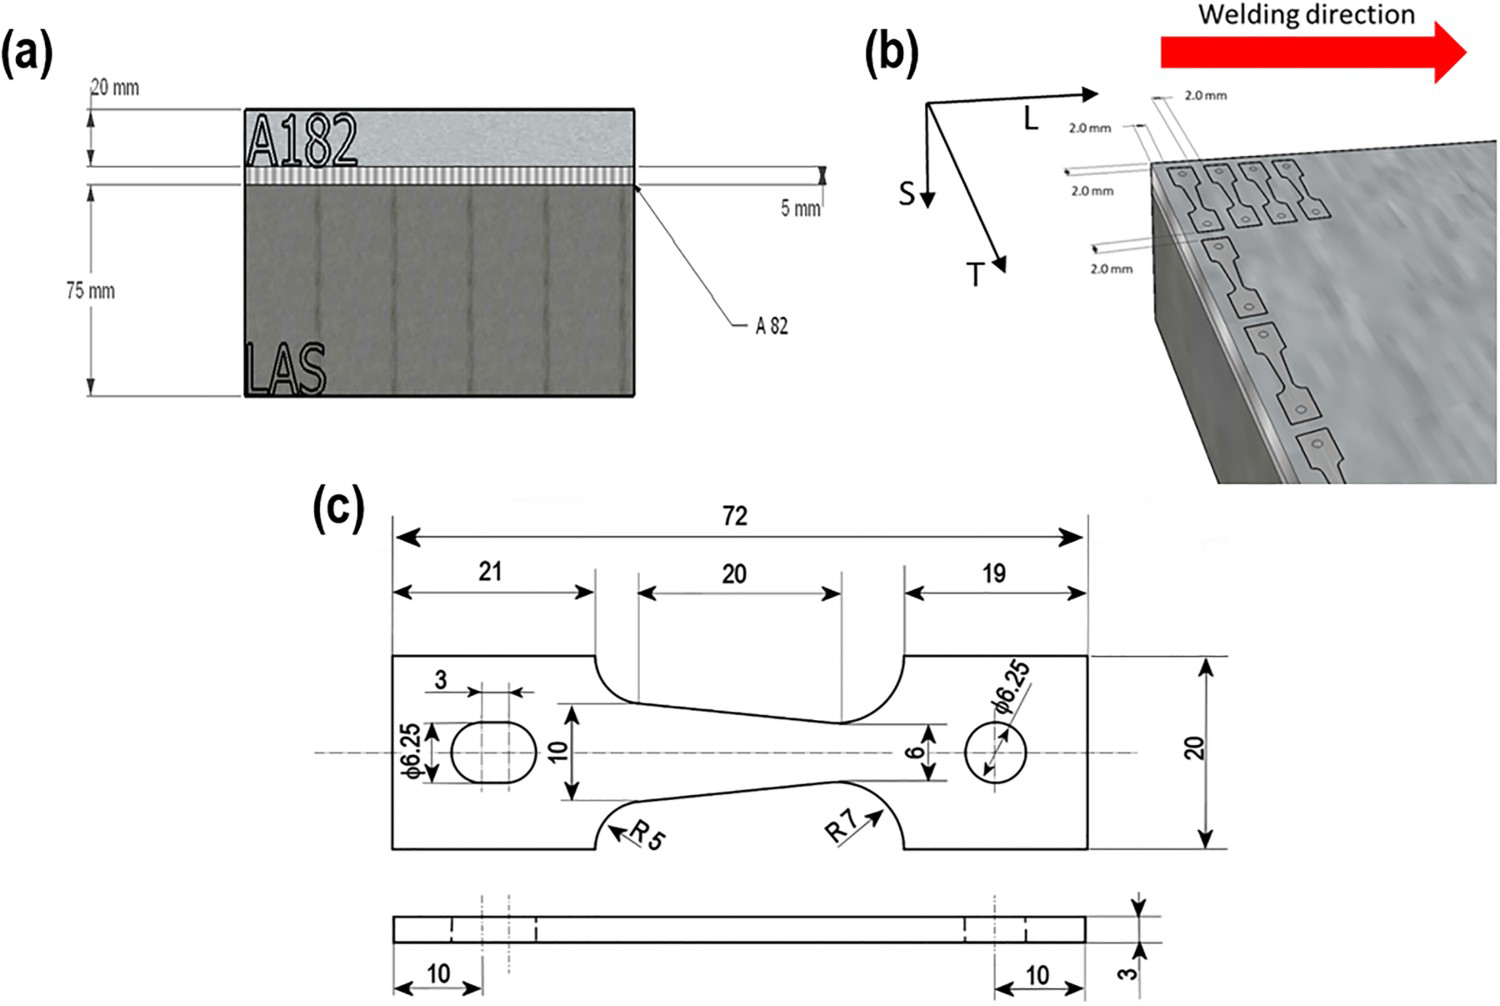

Four kinds of different surface treatments were studied in this work, namely reference surface (RS), surface treatment industrial (STI), surface advanced machining (SAM) and shot peening (SP). RS consisted of grinding on progressively finer grades of SiC paper (in the sequence of P800, P1200, P1500 and P2000). STI finish was carried out by flat face milling. Flat milling is typically used for machining components in the nuclear industry that get in direct contact with high-temperature water in service. SAM is a cryogenic machining process with face milling and it is a surface finish option for future nuclear industry when machining new components that will be exposed to high-temperature water environments in service condition. More details of these three surface finishes are available in [10]. SP surface treatment was applied by peening on a rough ground (SiC P80 paper) surface with ceramic balls of 0.6 mm in diameter and coverage ratio of 125%. Since each FTT specimen had two surfaces, one was prepared with STI, SAM or SP while the counter one was the RS for control purposes. Thus, three variants of specimens were tested in this work: RS/STI, RS/SAM and RS/SP.
The type of samples used in this work consisted of FTT geometry whose schematic representation and dimensions are shown in Figure 1(c). The advantage of using a tapered geometry is that on each sample there is a stress gradient along the gauge length, and therefore, in a reasonable timeframe it is possible to determine the EAC critical stress. More information about the methodology used can be found in [15]. The orientation of all FTT specimens was TS, as schematically indicated in Figure 1(b): the loading axis of each specimen was parallel to welding direction (T) and the expected orientation of EAC crack growth was along the through-thickness direction (S).
CERT tests and EAC critical stress
For screening purposes, accelerated EAC initiation tests were performed in order to obtain the EAC critical stress in a relatively short time frame. The CERT tests served as a screening for future constant load tests, which could further verify and validate the EAC critical stress [15]. The CERT test is an accelerated environmental test technique, applying mechanical strain at a suitably low strain rate stimulating and accelerating the initiation of EAC cracks. Such tests were conducted in four different labs using refreshed high-temperature water autoclaves. The CERT tests were performed with nominal strain rates (i.e. average values along the 20 mm gauge length) of 1·10−6, 5·10−7 and 1·10−7 s−1, corresponding to pull rod displacement rates of 20, 10 and 2 nm s−1, respectively. Each specimen was strained until fracture or until the maximum load was exceeded. All the tests were performed in oxidising BWR normal water chemistry (NWC) high-purity water environment at 288°C, corresponding to a pH 288°C of 5.7, a dissolved oxygen content of 2 ppm, an autoclave inlet conductivity of 0.055 μS cm−1 and an electrochemical corrosion potential of approx. +0.1 VSHE. After mounting the specimens in the autoclave, the samples were pre-oxidised at the target test conditions for 7-10 days at a pre-load of 200 N.
After the CERT test, the EAC cracks were searched for on both sides of the specimens using a scanning electron microscope (SEM) and following a pre-defined common procedure.
A crack was qualified as a valid EAC crack if:
it had a minimum surface length of 20 μm, it was mostly straight and with orientation roughly perpendicular to the loading axis, at high magnification on the crack surface, a cleavage-like or intergranular appearance could be seen.
The main purpose of such investigation was to find the EAC crack that was closest to the wide end of the gauge length. The longitudinal position of the so-called last EAC crack served as a boundary between cracked and non-cracked regions. The derived EAC critical stress was calculated on the basis of last EAC crack location, beyond which there were no further qualified EAC cracks observed on the treated surface. For each last qualified EAC crack, the corresponding FTT specimen thickness at the crack position on the strained specimen (after the CERT test), and the width at the final crack position from the specimen on the non-strained specimen (before the CERT test) were determined. With the dimensions of width and thickness, the critical cross section corresponding to the last qualified EAC crack was obtained. The maximum load was determined from the loading curve. The EAC critical stress was finally calculated by dividing the maximum load by the critical cross section for each side of the specimen. This accelerated EAC initiation testing technique has been further developed in the framework of another collaborative research initiative (MICRIN) and more details can be found in Ref. [15]. The EAC critical stress is intended as a comparative parameter to evaluate the EAC initiation susceptibility for the different applied surface treatments.
Digital image correlation
Digital image correlation (DIC) was employed to quantify the strain development along the gauge lengths of FTT specimens. These analyses were conducted in air at room temperature, in order to reveal the potential effect of SP on inhibiting the straining/cracking behaviour and to identify the local straining. In fact, SP is expected to introduce surface compressive stress and retard plastic deformation with respect to the untreated surface (i.e. RS surface) at the very beginning of the straining. DIC is a non-contact optical technique widely used to measure deformation, contour, and strain, which can be used simultaneously with many tests including tensile, bending, torsion and combined loading for both static and dynamic applications [16,17]. White basecoat and black speckles were applied by spray painting on the specimen surface. The DIC was performed with a LaVision StrainMaster DIC software equipped with two 5 megapixel Imager M-lite CMOS cameras (recording in 12-bit mode). The step size in the entire DIC mesh was about 10 pixels (approx. 0.25 mm on the specimen surface). Only one surface of the specimen was measured with DIC technique during each test. Images were recorded at 1 Hz.
In order to obtain the same stress state as in the autoclave, CERT autoclave clevises were used in the tensile load-train for the DIC test in air. The target load was set to 9.183 kN (close to the maximal load in CERT tests), so that the stress at the smallest cross section was around 573 MPa; the stress linearly decreased along the gauge length to 322 MPa in the widest area. To keep DIC test duration reasonable, tensile tests were performed at room temperature air with a constant displacement rate of 0.01 mm min−1 (with a nominal strain rate of around 8.3·10−6, which was higher than those of the CERT tests).
Electrochemical measurements
High-temperature electrochemical impedance spectroscopy (EIS) tests were conducted at the corrosion potential Eoc of −0.47 VSHE on flat samples that had RS (2.2 cm2) and SP (0.8 cm2) surfaces. The SP surface was only on one side, so the rest of the SP sample was covered with several layers of PTFE tape to prevent the influence of the other SP surface from influencing the current signal. The counter electrode was Pt metal, and a Ni/NiO-reference pair mounted inside an yttrium stabilised ZrO2 tube was used as the reference electrode. The tests were performed at 288°C with the addition of 100 ppm SO4 2– (added as Na2SO4 to increase the conductivity of the solution and facilitate the polarisation of the samples), and with a dissolved oxygen content of DO2 < 1 ppb (purged with 5N N2, to simulate the condition at the crack-tip enclave). An Ivium Compactstat equipped with high-sensitivity and frequency response analyser modules was used at an AC signal amplitude of 20 mV. Linearity was checked by measuring spectra at different amplitudes (5-25 mV), whereas causality was verified by a compliance test to the Kramers–Kronig transform. Points that did not pass the test were discarded. More experimental details are available in [11]. The electrical analogue model and the ZView (Scribner Associates) fit were implemented according to the EIS data.
Results
Baseline characterisations
Figures of the four surface finishes before testing in the autoclave are shown in Figure 2. RS surface had shallow grinding marks that were slightly inclined with respect to the loading axis. The SAM surface showed machining marks resulting from the face milling procedure and were site-specific depending on the respective specimen-mill tool position. The STI surface had parallel grinding marks with an around 45° angle to the loading axis. The SP surface revealed a peened appearance with severe flaws, pits and cracks induced by the knocking of ceramic balls on the ground surface.
SEM images of the outer surface before the testing in autoclave as function of the different surface finishes. (a) RS surface; (b) SAM surface; (c) STI surface and (d) SP surface.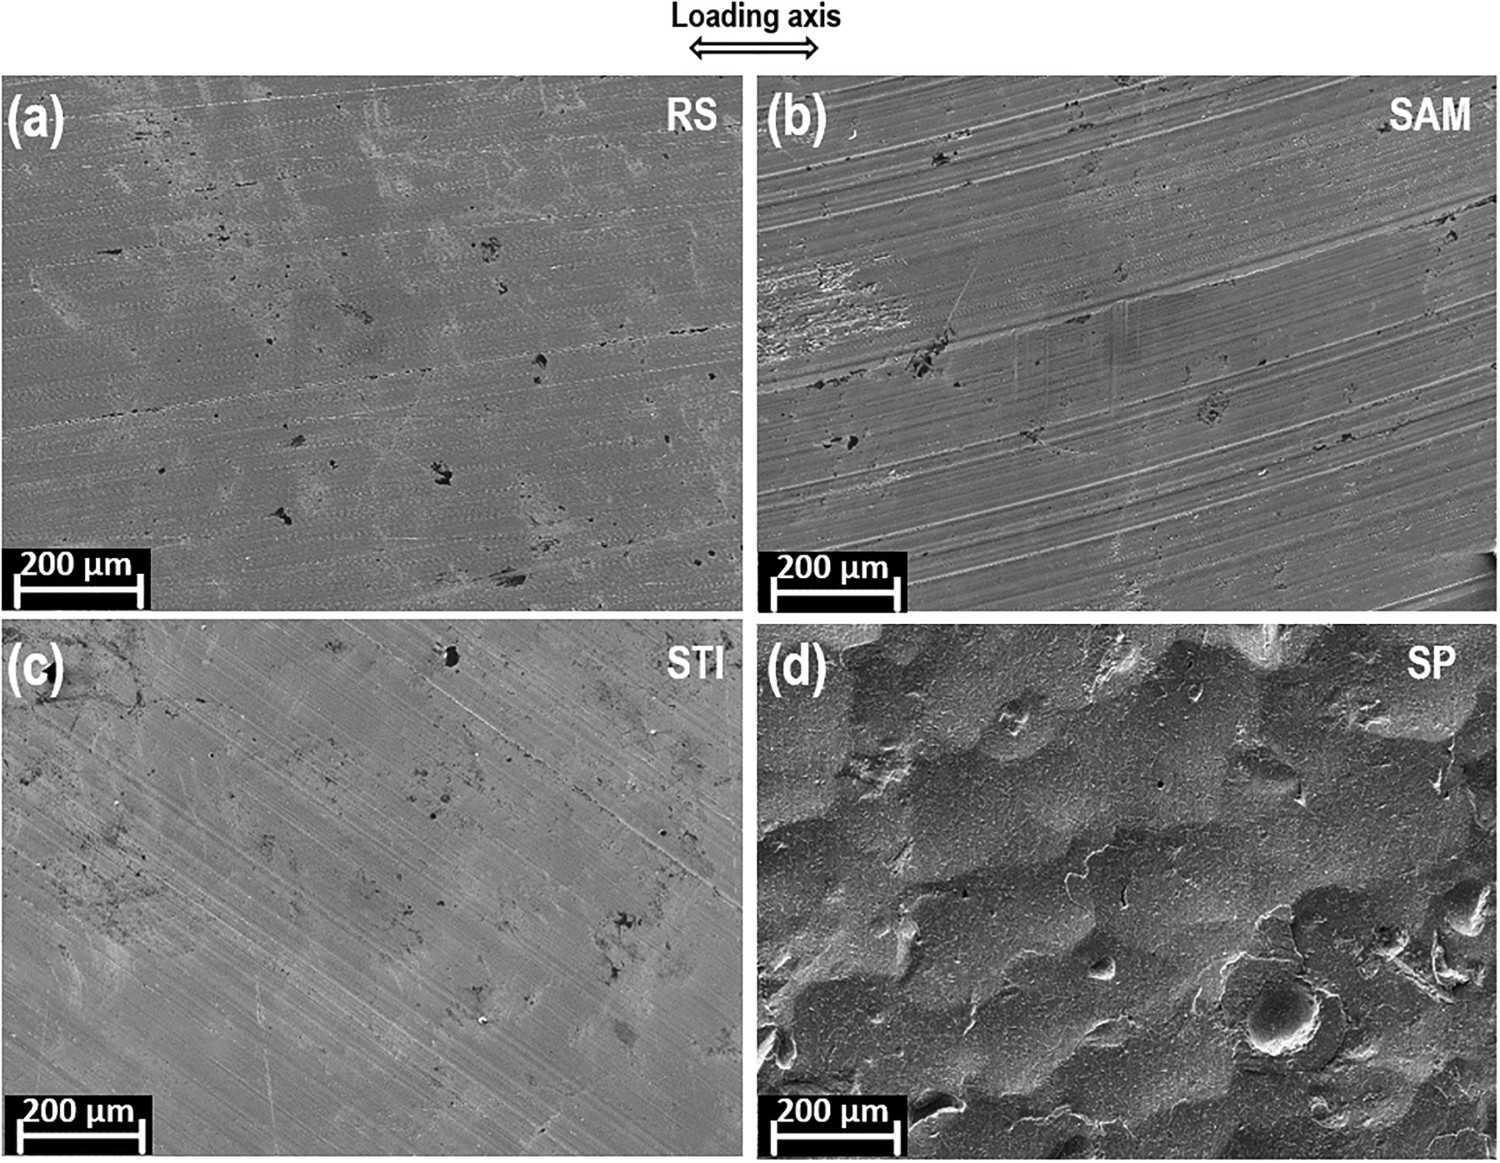
The representative microstructures of the sub-surface machining-induced deformation microstructure from the four surface treatments are shown in the SEM backscatter electron (BSE) images in Figure 3. The RS surface showed a very shallow deformation structure beneath the surface with a ∼200-300 nm thick deformed layer. A strong manufacturing deformation layer for the SAM surface was observed. A 2-3 μm thick ultra-fine grained (UFG) layer and ∼6-7 µm deformed structure was observed. Deformation bands that extended approximately ∼20-30 μm into the specimen with SAM surface was found. Specimen with STI surface showed a specific multi-layer deformation structure that extended ∼5 µm into depth, revealing a ∼0.5 µm thick UFG layer adjacent to the treated surface and ∼4 µm thick deformed structure with elongated nano-grains. Specimen with SP surface showed a two-layer machining deformation microstructure, with a 2-5 µm UFG layer and a >∼15-25 µm second deformed layer. Deformation bands were observed at a distance >100 µm beneath the second machining deformation layer, as documented in references [10,11].
SEM-BSE images of the cross section of machining-induced deformed layer of the specimens as function of the different finishes. (a) RS surface; (b) SAM surface; (c) STI surface and (d) SP surface.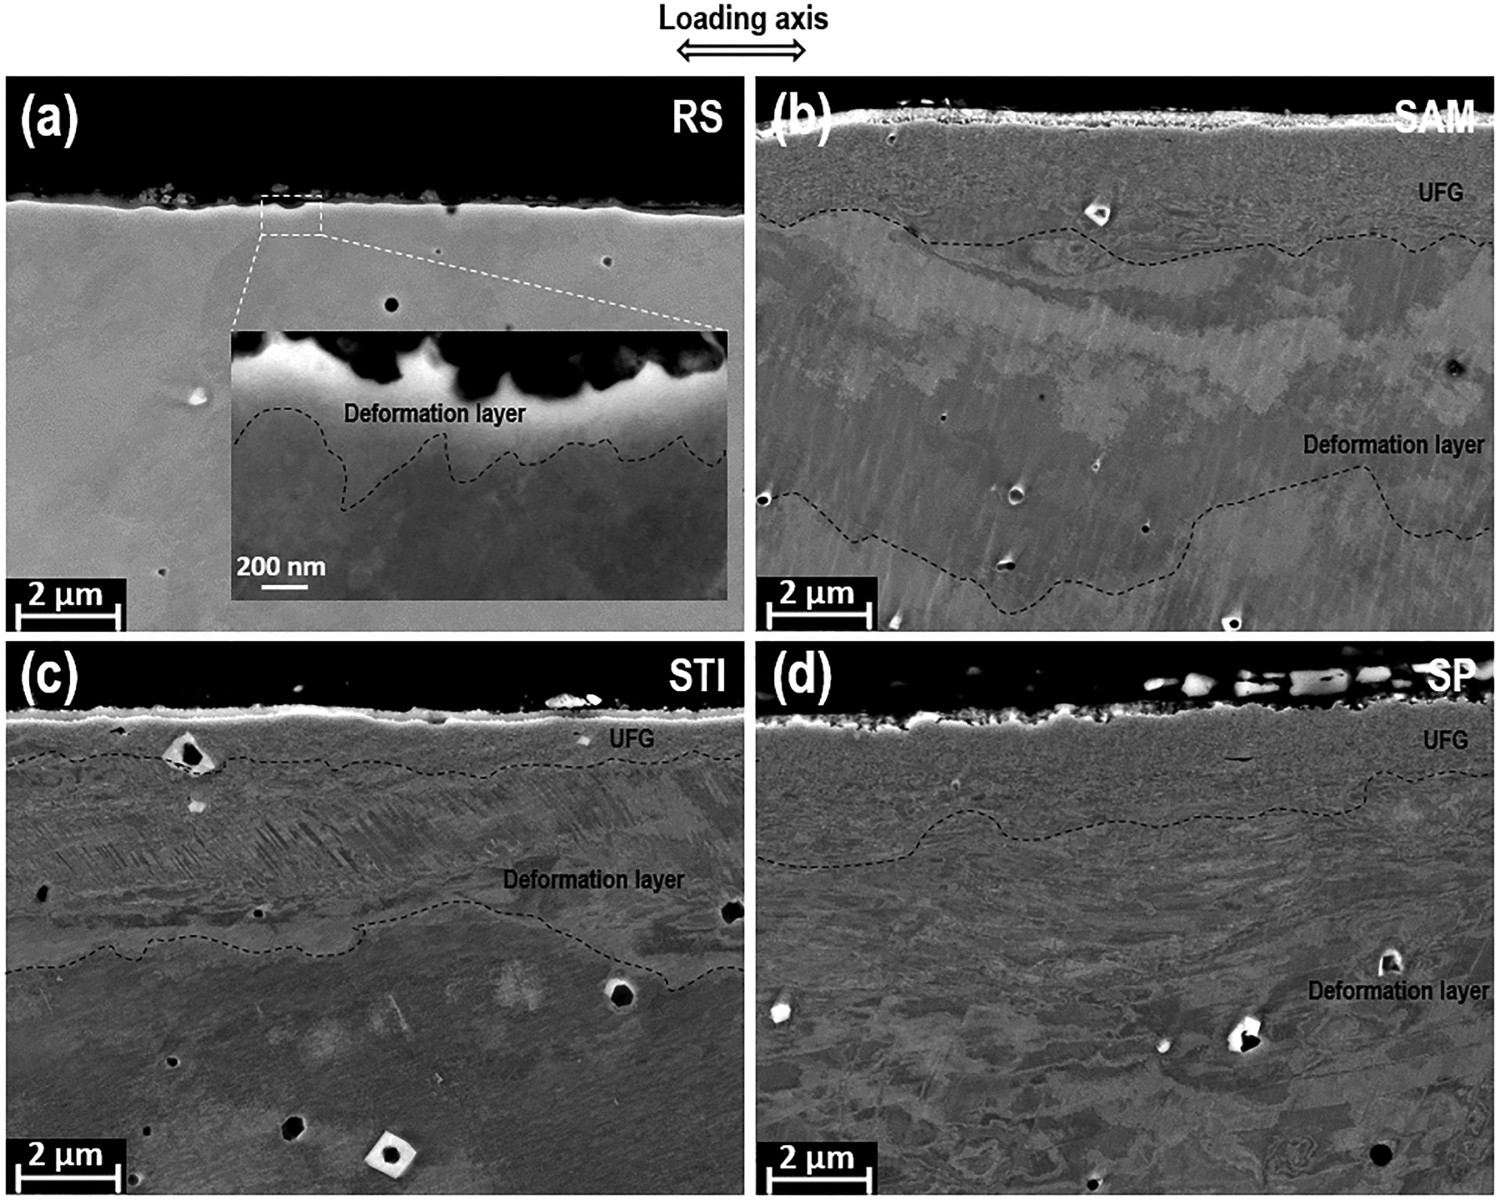
CERT tests
Assessment of the strain distribution in FTT specimens
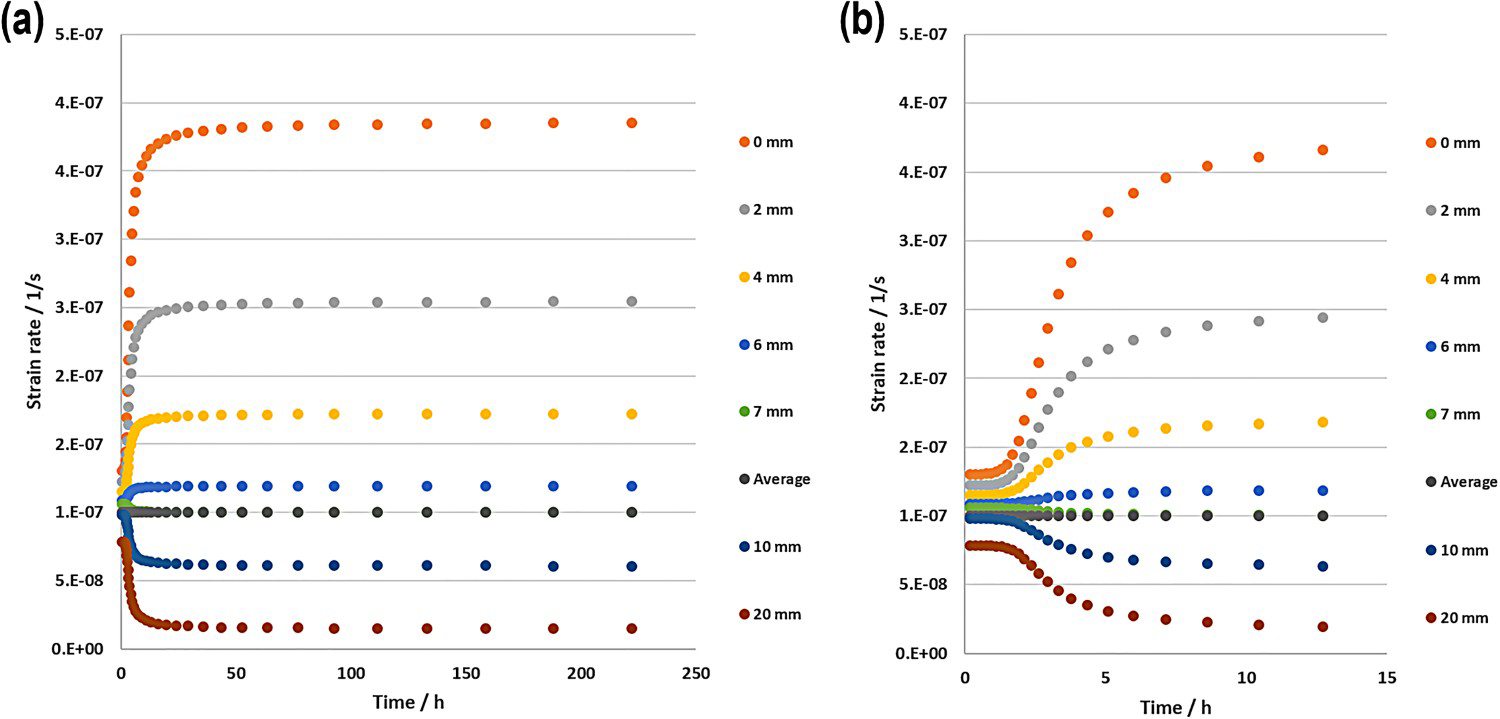
CERT tests on FTT specimens were applied to evaluate in a reasonable time schedule the EAC initiation susceptibility associated with the four surface finishes. The strain rate and the strain were the highest in the minimal gauge section and they decreased along the gauge length of the specimens towards the widest cross section. The distributions of strain rate and strain along the gauge length at a nominal strain rate of 1·10–7 s–1 were calculated using a Ramberg-Osgood approximation. For this purpose, the Ramberg–Osgood relationship was fitted to the experimental true stress–strain curve of the dedicated tensile test with standard (constant cross section) specimen. The load and the strain as a function of time for different initial positions along the tapered gauge length is shown in Figure 4. Note that at 7 mm from the minimal gauge section is the ‘average gauge position’, where the local strain rate equals the nominal strain rate. The strain rate over the duration of the CERT tests at a nominal strain rate of 1·10–7 s–1 for different positions along the tapered gauge length is shown in Figure 5. After ∼20 h, which is ∼10% of the total duration of the experiment, the strain rate stabilised to a given value. For positions with distances larger than 7 mm from the narrowest cross section, the initial strain rate was at its highest and decreases to reach a steady value after 20 h. For positions with distances smaller than 7 mm from the narrowest cross section, the initial strain rate was low and it increased to reach a steady value after 20 h. For a simplification of the discussion, the nominal strain rates averaged over the whole gauge length of a FTT specimen are used throughout the text.
The calculated load and the strain as a function of time for different position along the tapered gauge length at a nominal strain rate of 1 × 10⁻⁷ s–1. The origin (0 mm) is at the narrowest cross section. (a-b) The calculated strain rate over the duration of the experiment for different position along the tapered gauge length at a nominal strain rate of 1 × 10⁻⁷ s–1. The origin (0 mm) is at the narrowest cross section. (b) shows the magnified details for strain rates close to the initial time in (a).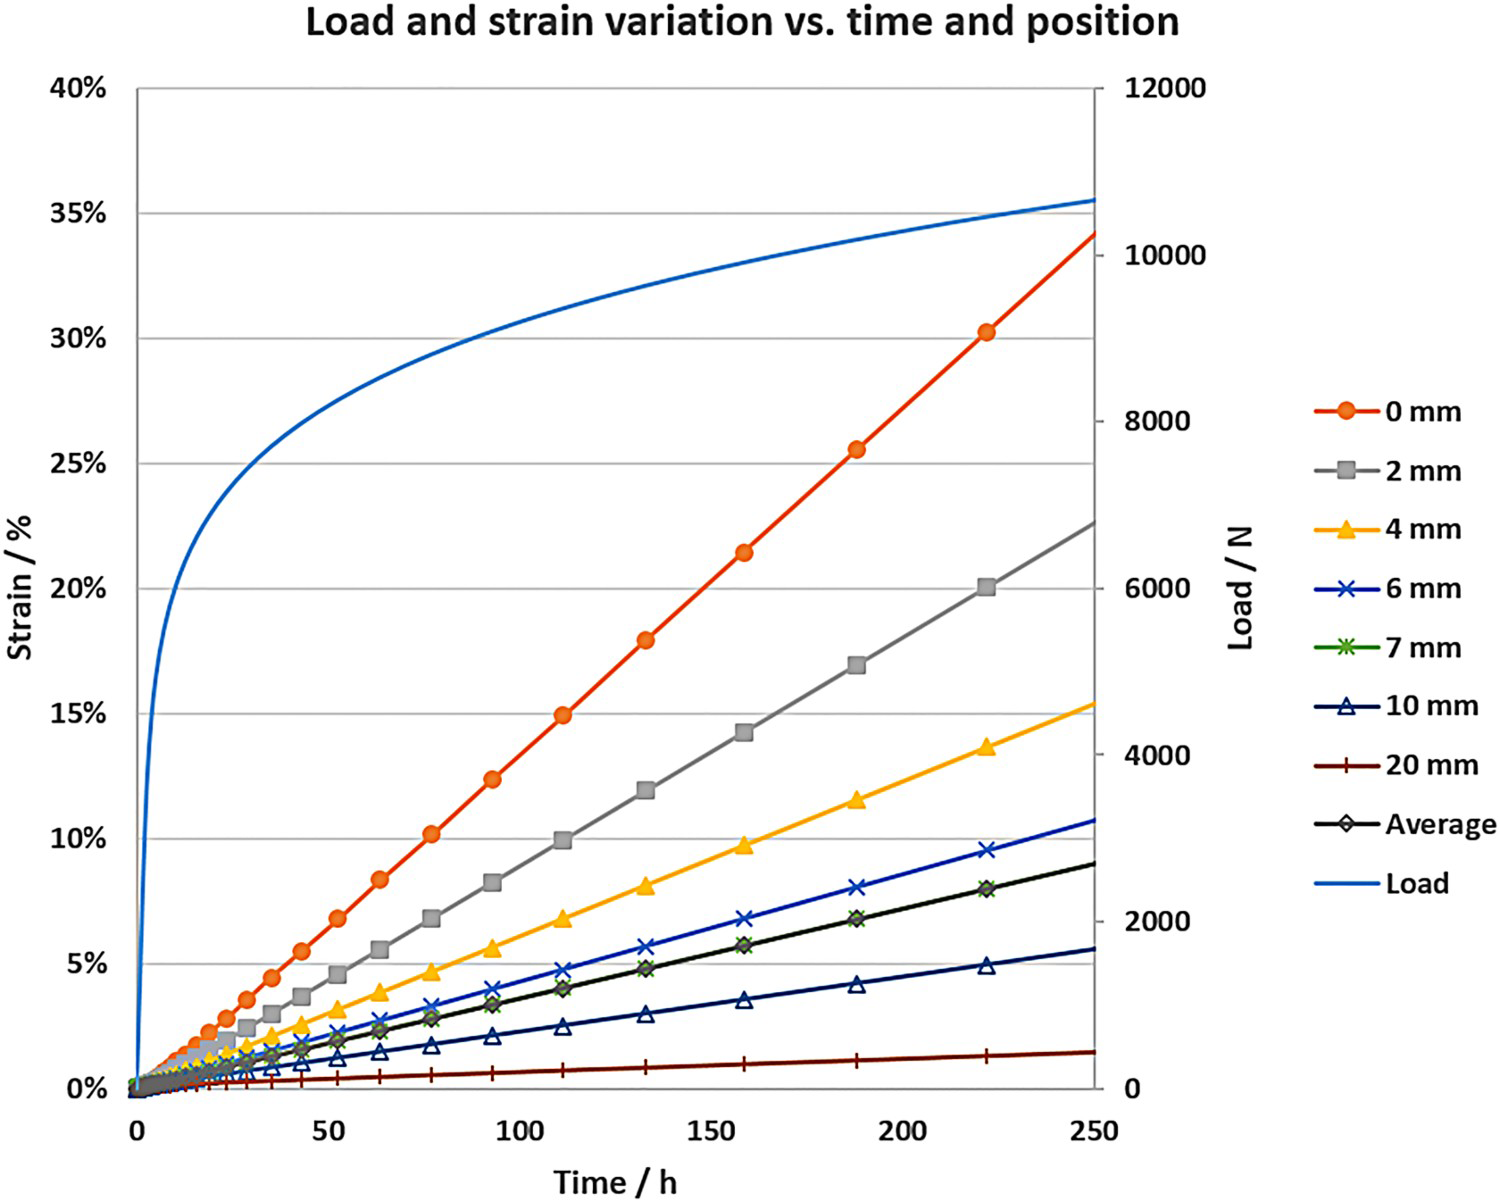
EAC critical stress
Representative images of the last EAC cracks detected on the FTT specimen surfaces with four surface treatments are shown in Figure 6. The cracks were almost perpendicular to the loading axis and had a similar appearance.
Representative EAC cracks from the surfaces with various surface treatments. (a) RS surface; (b) SAM surface; (c) STI surface and (d) SP surface.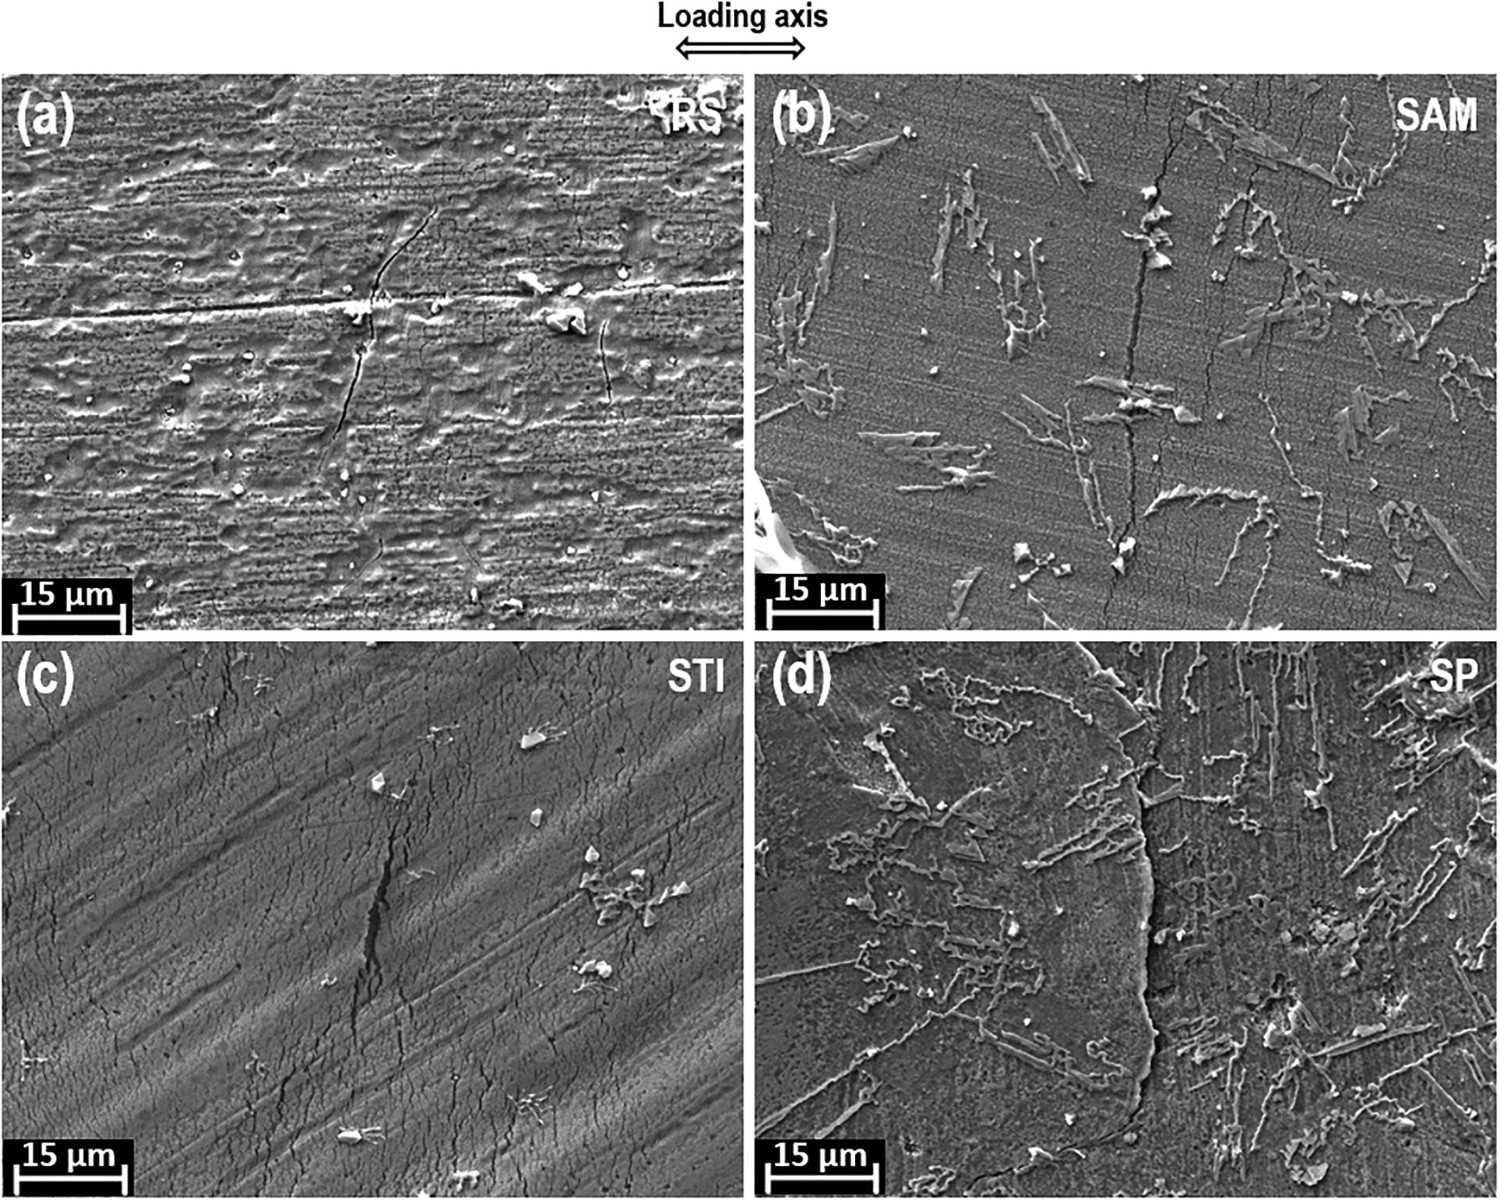
The graphs in Figure 7 present the effect of strain rates on the EAC critical stress for RS and STI surfaces (data only from the RS/STI specimens). For both surfaces, the EAC critical stress increased with the strain rate. To determine the characteristic critical stress (the extrapolated value of EAC critical stress at zero strain rate), the data points in Figure 7 were fitted with the exponential curve (Equation (1)):
The graph showing strain rate dependence of the EAC critical stress of RS and STI surfaces (from RS/STI specimens) with best exponential fit and 90% confidence band. The different colours indicate the data from 4 different labs, thus showing the scatter of the data. The obtained characteristic critical stress value (EAC critical stress extrapolated to zero strain rate) with 90% confidence interval is presented at the left side of the fitted curve.
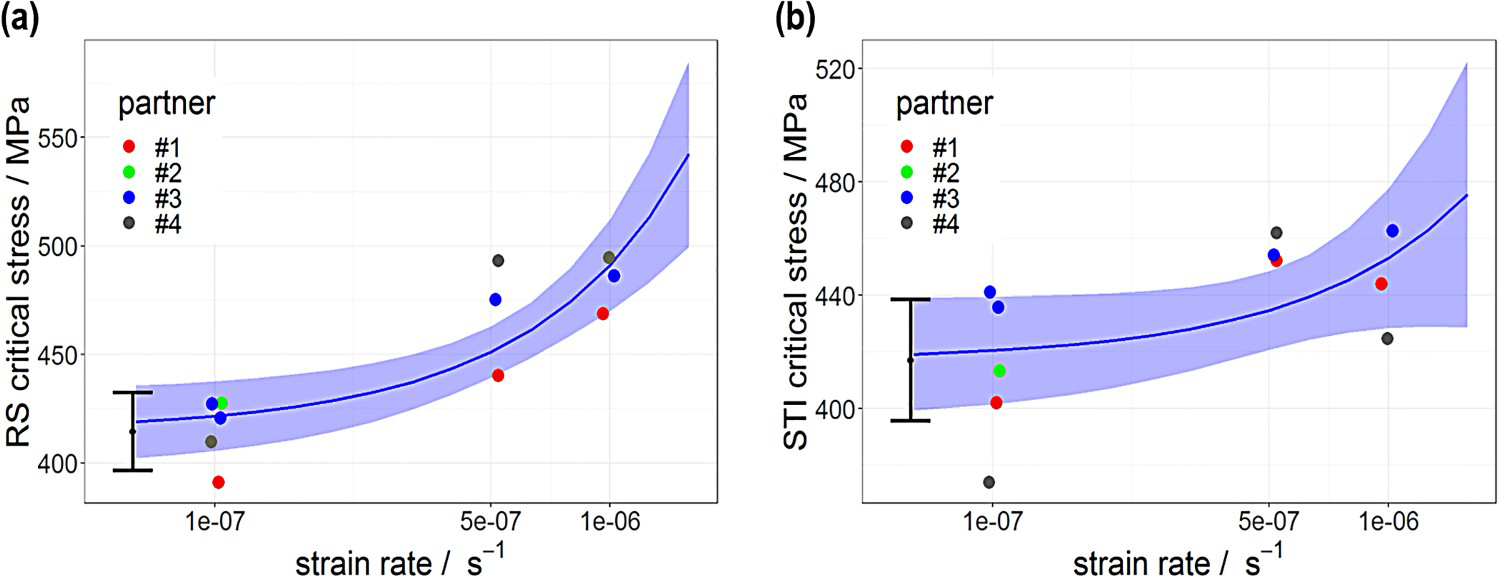
The data points and best fit curve with 90% confidence band, as well as the determined characteristic critical stress and associated confidence interval, are presented in Figure 7. The difference between the determined characteristic critical stresses for RS and STI surfaces is rather small, less than 5 MPa.
Figure 8(a) shows the summary of measured EAC critical stresses at the lowest employed nominal strain rate of 1·10–7 s–1 as a function of surface treatment conditions. For each category, the individual EAC critical stress measurements are given along with the superimposed box plot (1st quartile, median and 3rd quartile) to aid in comparison. The RS/ALL data in Figure 8(a) were calculated from all RS surfaces in RS/STI, RS/SAM and RS/SP specimens. The median EAC critical stress at the lowest strain rate was found to rank as SAM > RS > STI > SP.
Summary of the distributions of determined EAC critical stress as a function of surface machining treatments on the Alloy 182 specimens measured at the strain rate of 1 × 10⁻⁷ s–1. (a) EAC critical stress of SAM, RS, STI and SP surfaces. Here for the RS data all specimens were included. (b) Distributions of determined EAC critical stress of RS side as a function of surface machining treatments on the other side of the specimens. The RS data were from RS/STI, RS/SAM and RS/SP specimens, respectively. Truncated box plot represent the 1st quartile, median and 3rd quartile. Star represents the mean of the category.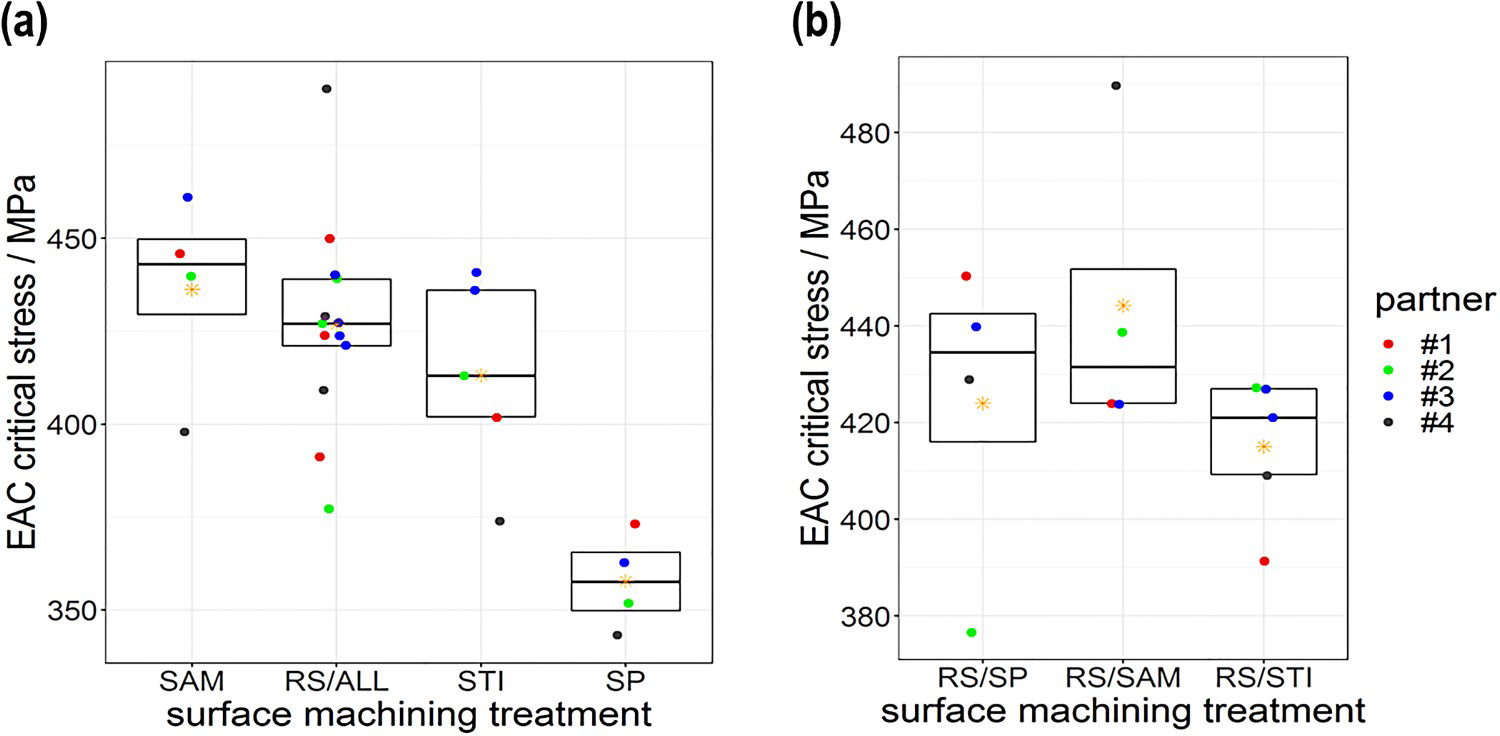
Since each tapered specimen had two surfaces, one surface RS and the counter one either STI, SAM or SP, it is not possible to fully exclude that one surface affected the EAC critical stress of the opposite surface. For this reason, the statistics of EAC critical stress of RS side as a function of surface machining treatments on the other side (STI, SAM or SP finish) has been represented in Figure 8(b). This figure indicates that the median EAC critical stress of RS side could be slightly influenced by the other side treatments.
DIC investigations
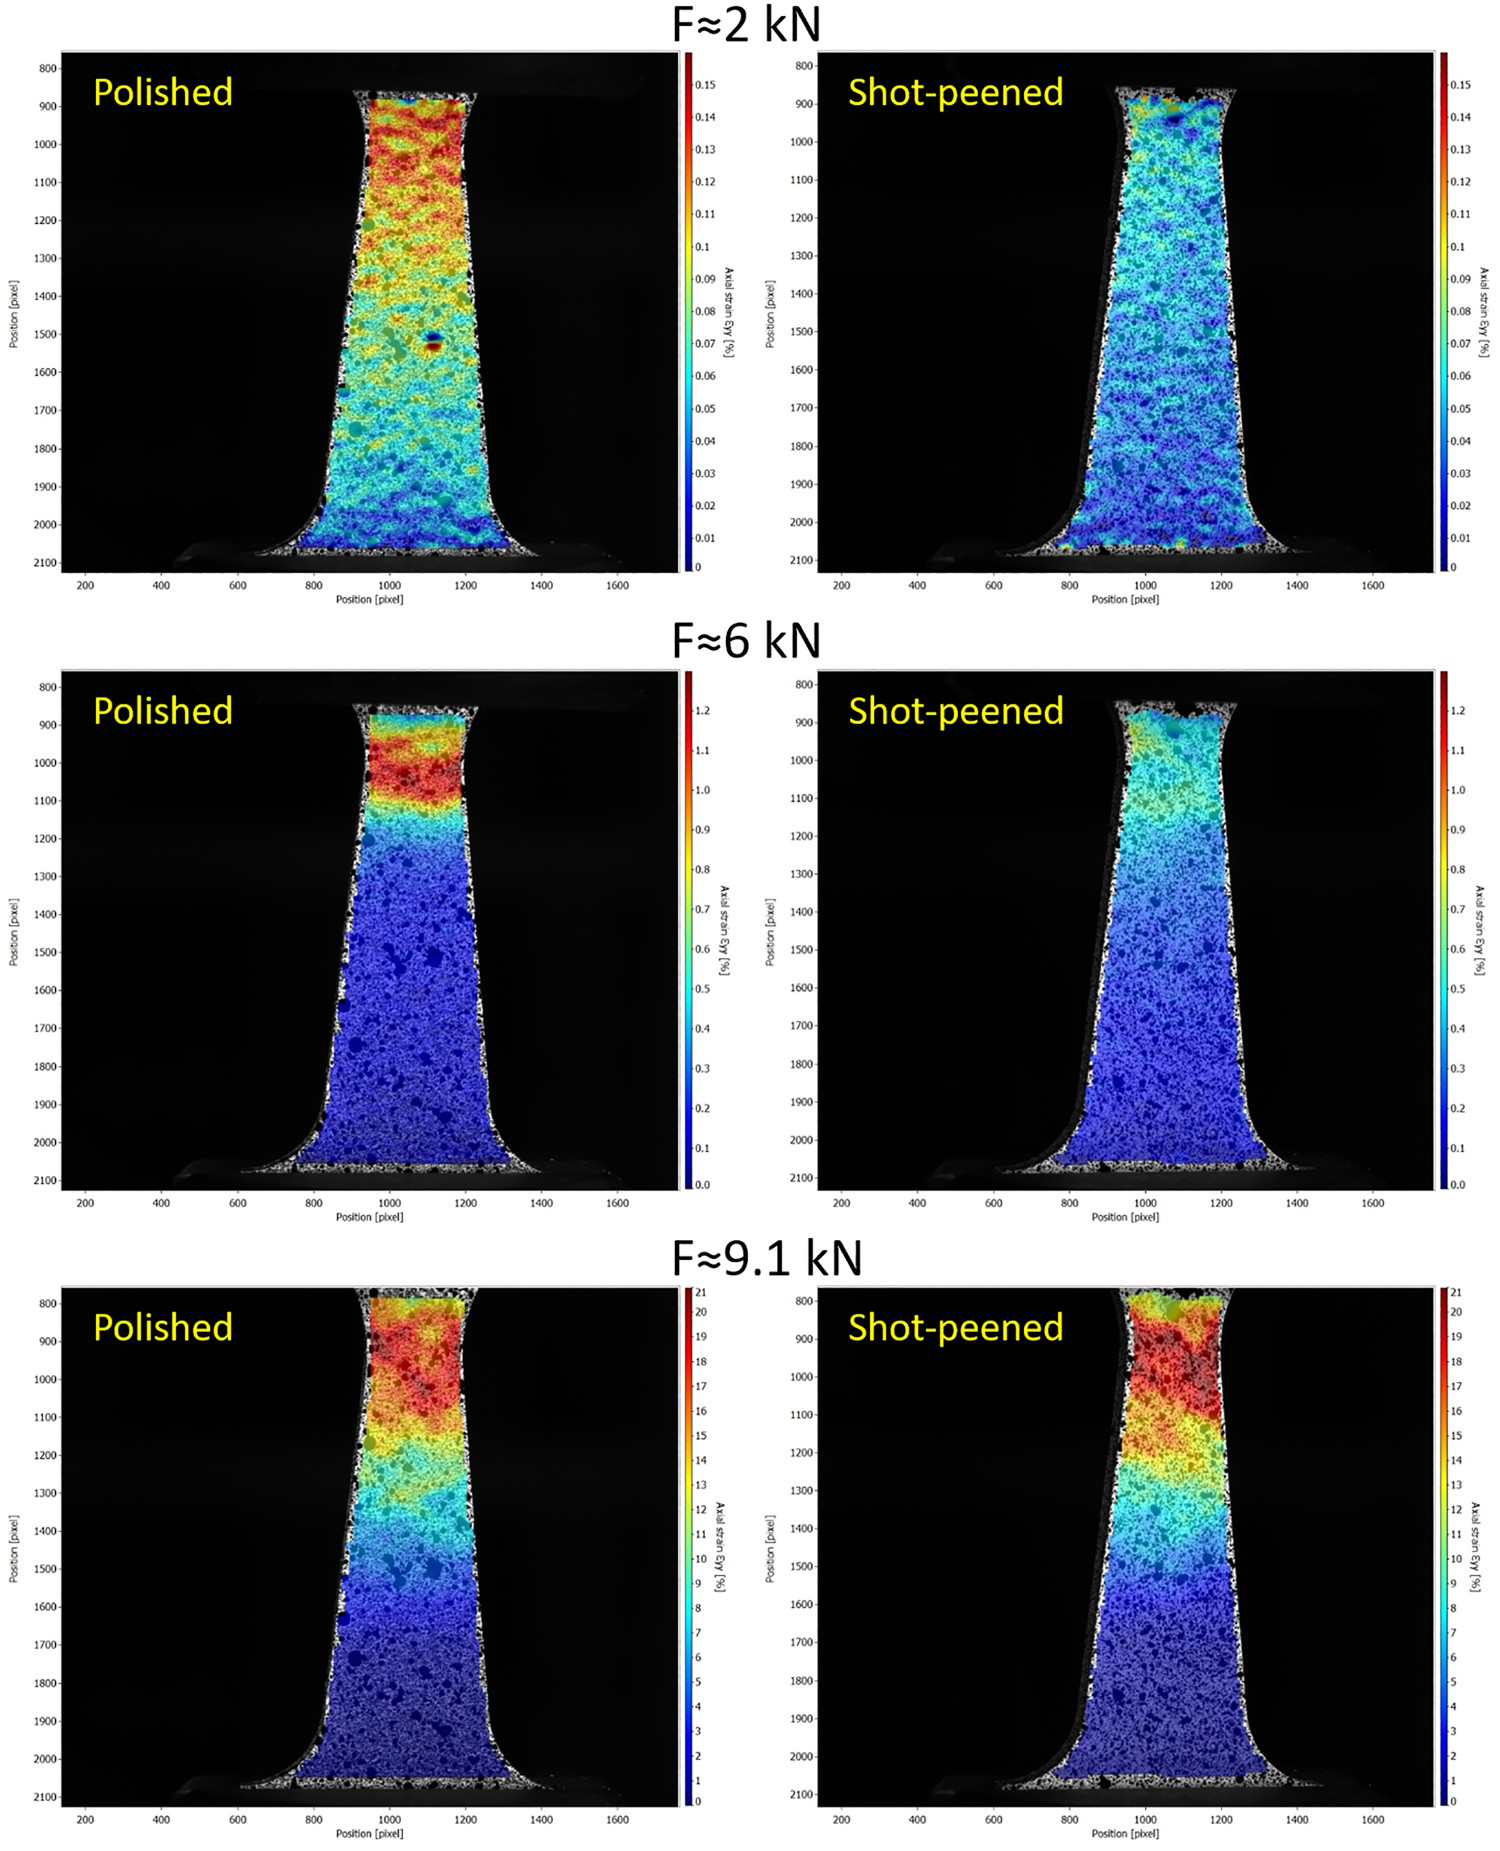
The stress–strain curves in the narrowest region (smallest cross section) of FTT specimens with RS/SP surfaces are shown in Figure 9. The stress was derived dividing the load by the cross sectional area of the sample, while the strain was captured using DIC. The two different surface finishes showed a repeatable but different straining behaviour up to a stress of approx. 250 MPa (Figure 9(a)). At higher stress and strain level, the slopes of the curves for the two surface preparations converged towards each other (Figure 9(b)). With a compressive stress caused by the peening on the SP surface and a negligible stress on the RS surface, the samples had a slightly bowed shape. When the samples were strained, a smaller tensile strain at the same nominal stress level could be seen on the SP side due to the straightening of the sample, which was visible in the early stages of straining (Figure 9(a)). However, when there was large plastic deformation the residual stresses were washed out and the stress/strain curves converged (Figure 9(b)). The evolution of the longitudinal strain-field for both sides of RS/SP specimen, as obtained from DIC, is presented in Figure 10. Note that the strain scale at each force level is equal for both SP and RS images, but the upper limit of the scale increases as a function of applied force. This result suggests that the bowed shape of the sample, associated with the presence of compressive stress on the peened surface, decreased the effective surface stress due to delayed straining and therefore retards crack initiation compared to the RS surface of the same specimen at low nominal stress levels. On the other hand, at equal strain levels, the effective stress on the SP side is expected to exceed that on the RS side due to deformation hardening caused by the peening process, which is detrimental with regard to EAC [18].
Stress–strain curves at the minimum cross section of the Alloy 182 FTT specimens with RS/SP surfaces. (a) Curves magnified at low strain level; (b) Curves at a full strain level; (c) Plot showing the slightly bowed shape of the RS/SP specimen. Longitudinal strain-field from DIC during tensile loading for peened and polished surfaces. Mind that in order to facilitate the observation of local straining, the strain scale bar at each load level is set differently. However, the scale bar is the same for peened and polished surfaces at each load level. The longitudinal strain scale bar is 0-0.16%, 0-1.3%, and 0-21% for figures at F = 2, 6, and 9.1 kN, respectively.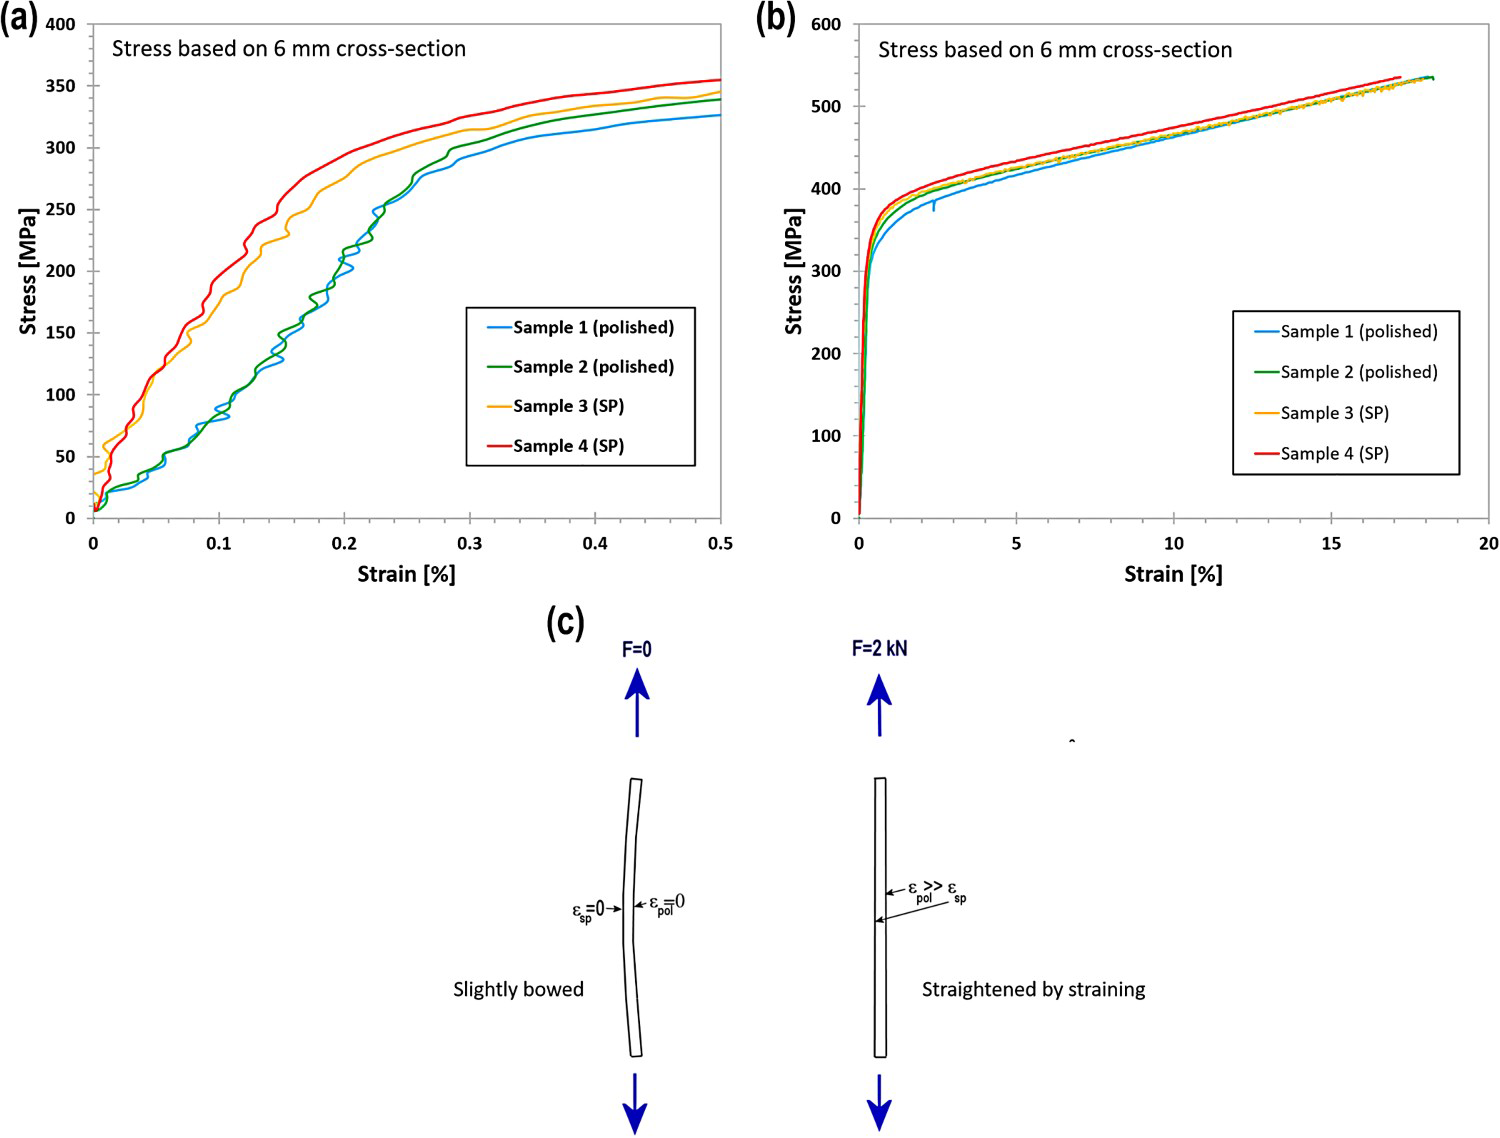
EIS investigations
ZView software (Scribner Associates) was used to model the low-frequency part of the impedance spectra (the total spectra is published in [11]) with the simple electrical analogue model (R1–Ws1) shown in Figure 11 (Nyquist-plot). The diffusion coefficients for ionic transfer of interstitial cations through the inner oxide, calculated from the analogue model for the RS and SP surfaces, were DRS = 1.4·10−12 cm2 s−1 and DSP = 5.7·10−12 cm2 s−1, respectively. These diffusion coefficients are rather high, at least partially due to using the total oxide thickness of about 200 nm [11] to represent the barrier oxide layer thickness. The oxide thickness chosen for the calculation, while affecting the absolute value of the diffusion coefficients, does not influence their relative magnitudes. Thus, it is reasonable to state that the diffusion of ions through the oxide on RS surface was about four times slower than that through the oxide on the SP surface, indicating that the corrosion rate of the SP sample was about 4 times higher than that of the RS sample.
The impedance (low-frequency end of the spectra, 1-4 mHz) of RS and SP materials presented in Nyquist-coordinates (Zʹ – the real part, Zʹ – the imaginary part). The dashed lines present the fits to the measured spectra using the electrical analogue model shown (R1 = uncompensated resistance, WS1 = Warburg-element for a diffusion process).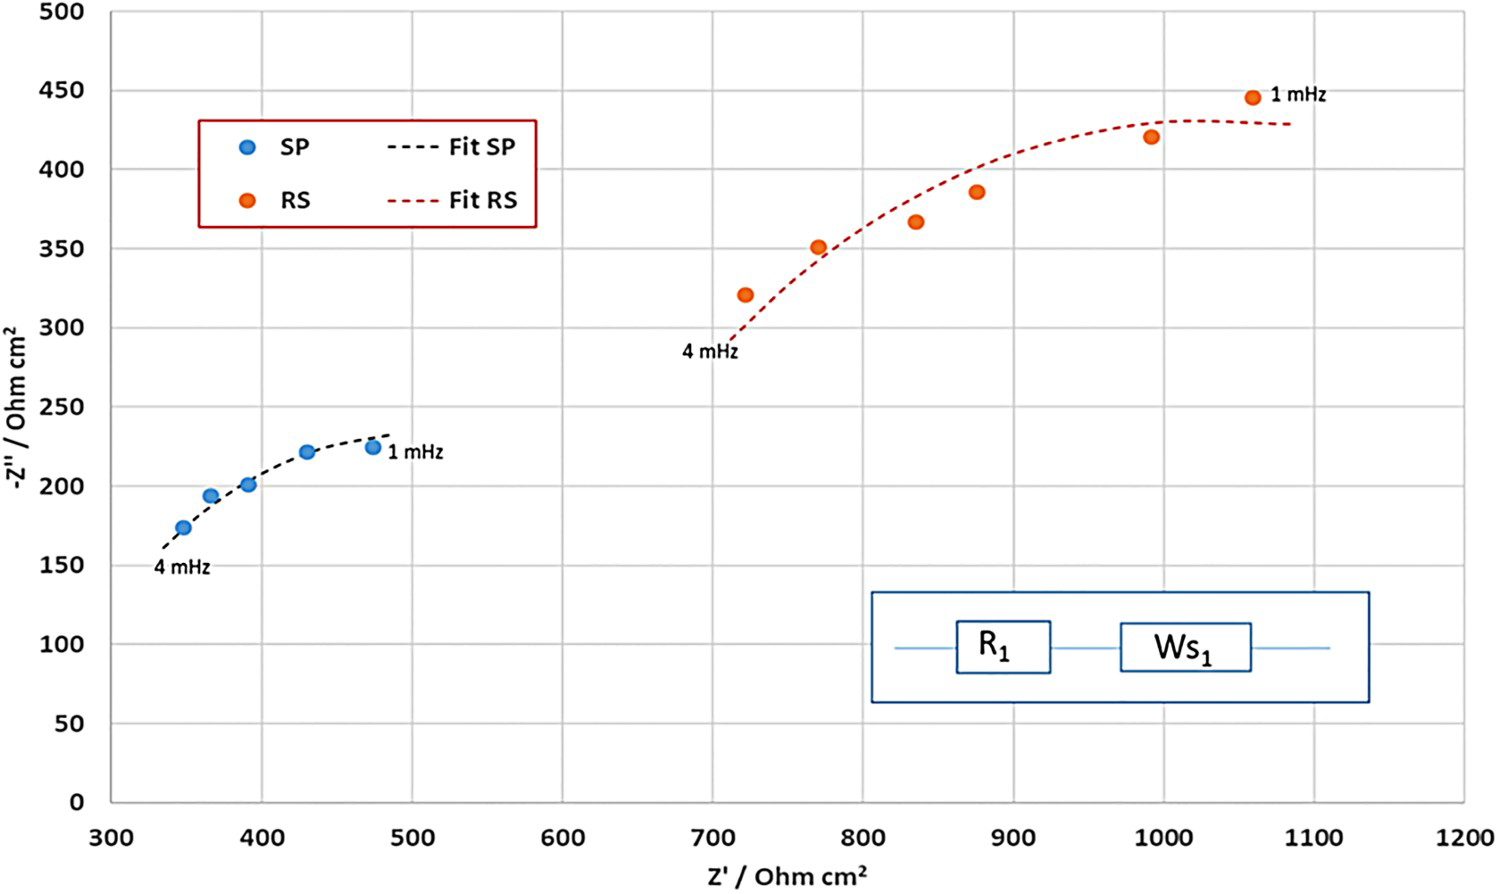
Discussion
CERT tests
In this work, CERT test technique with FTT specimens was applied to examine and compare the EAC initiation susceptibility of Alloy 182 material with four surface finishes (RS, SAM, STI and SP). Some degree of scatter in the EAC data is expected from such challenging experimental investigations. It originates from various factors, e.g. the variation of weld microstructure from different locations of the block, the variation of surface roughness and machining deformation in specimens, the small differences in the experimental set-ups in the partner labs, the subjectivity of determination of the last EAC crack and the calculation of EAC critical stress by different researchers from different labs, etc. Therefore, a large data set produced by various labs was needed to reliably establish the tendency of effects of surface treatments on the EAC critical stress. Despite the scatter in the results obtained from various labs, trends for the differently treated surfaces could still be identified.
In a CERT test, due to the dynamic loading, both the mechanical cracks and environmental-assisted cracks were present. Most of the mechanical cracks were found at locations close to the narrowest cross section since the higher strain rate promotes mechanical failure. Towards the wider cross section along the gauge length, the contributions of dynamic strain rate and strain become lower (Figure 4 and Figure 5) and thus the cracks found on the specimen surface are mostly EAC cracks. The EAC critical stresses were calculated based on the observed ‘last’ EAC cracks, which serve as the boundaries between environmentally-assisted cracked and non-cracked region. Lower calculated EAC critical stresses (higher EAC initiation susceptibility) for both RS and STI treated surfaces were determined with the decrease of the nominal strain rates (Figure 7), which was as expected, and in accordance with previous investigations [19 21]. This behaviour is due to the fact that the EAC initiation of Alloy 182 material in high-temperature water is a time-dependent electrochemical process [22,23]. The prolonged duration of the test enables the high-temperature water to interact with the surface of the specimen (that promotes general oxidation process, local precursor reactions and EAC initiation). The CERT test incorporates the mechanical contribution to EAC initiation but by fitting the EAC critical stress with decreasing nominal strain rate to zero, the asymptotic value of EAC critical stress can be justified. For Alloy 182, the EAC characteristic critical stress determined by extrapolation to zero strain rate was similar for RS and STI surfaces with a minor ∼5 MPa difference. This result indicates that the surface mechanical grinding (which is known to promote far less surface damage than machining) may not significantly retard the EAC initiation compared to industrial surface milling of STI.
The EAC critical stress in the simulated BWR NWC high-purity water environment was found to follow a sequence of SAM > RS > STI > SP (Figure 8, particularly when taking only the RS data from RS/STI specimens into consideration) at a nominal strain rate of 1·10–7 s–1. The ranking of the EAC initiation susceptibility with the surface treatments indicates that the SAM surface could retard the EAC initiation whereas the SP surface treatment could deteriorate the EAC resistance. CERT technique with FTT specimens is efficient for screening purposes [24]. However, this accelerated technique could overlook the precursor events of EAC initiation [25] and need to be verified by additional constant load tests. Effect of the surface treatment processes on EAC initiation is partly verified by our preliminary constant load test results and high-temperature electrochemical measurements [11]. The sequence of the EAC initiation susceptibility of the investigated surface machining processes determined by constant load tests have been found similar to that from CERT tests [11].
An interesting question stemming from the test programme is whether the surface treatment on one side can influence the EAC critical stress of the other side. The median EAC critical stress of RS side in Figure 8(b) from RS/STI, RS/SAM, RS/SP specimens shows that there might be a slight influence of SAM and SP finishes on the EAC resistance of RS side. In this study, flat tapered specimens with two different surfaces were used to generate data from two different surface finishes from one specimen. Boursier et al. [26] investigated the behaviour of samples that were either shot peened only on one side (with the other side polished) or peened on both sides; from this study, they concluded that the specimens with only one side shot peened had shorter initiation time compared to specimens that were both side peened. However, no specific mechanism explaining the different behaviour was given and future study is needed to address this point fully.
Shot peened surface
Peening methods, e.g. water jet peening, cavitation peening, laser peening and SP have been recognised as effective methods for mitigating cracking susceptibility [14,27,28]. The enhancement of the cracking resistance by peening methods mainly resulted from the beneficial surface compressive residual stress [29 31]. However, as reported in this paper, the EAC resistance of SP surface, which is the only one with a residual compressive surface stress appeared to be the lowest among all tested surface treatments in BWR NWC water.
SP-induced surface defects (Figure 2(d)) could be the main potential reason for the deteriorated EAC initiation resistance of the shot peened surface treatment in addition to the fact that at higher strain levels the real stress on the SP side is higher than on the RS side due to higher local yield stress caused by the peening process. The SP treated surface was highly defective with a large amount of incipient surface micro-cracks. There were some indications that the EAC cracks observed on the FTT specimens with SP surface can initiate from the pre-existing defects/cracks. Pre-existing peening-induced defects/cracks, together with the severely deformed near-surface microstructures and the hardened surface layer, promote the EAC initiation and early crack growth, which can lead to the decreased EAC resistance of the shot peened surface treatment in the BWR NWC water in this study..
Peening needs to be performed after the manufacturing and before EAC starts, otherwise it is not very effective in retarding either crack initiation or growth [32]. Furthermore, some work on a Japanese nuclear power plant showed that peening prevented further crack length propagation but did not suppress crack deepening [33]. However, the practical problem with remedies such as SP is to ensure that the underlying substrate is never strained beyond yield. In fact, when a material with a cold-worked surface is strained beyond yield, tensile stresses as high as 1000 MPa can be generated, e.g. in the cold-worked layer of Alloy 600 tubing [18]. The detrimental effect of compressive stress generated by SP has been reported on austenitic stainless steels exposed under dynamic deformation [34] as well. This can be qualitatively explained considering that, when the substrate of the material is in the elastic region, the superficial stress is still compressive (no crack could theoretically develop in this region). Moreover, when the material is strained beyond yield, the ductile substrate can plastically deform allowing high deformation. However, when the superficial layer (i.e. the shot peened one) is strained, since it has already been highly work hardened, it can develop very high tensile stresses and incipient cracking if the surface material does not have any residual ductility.
Finally, it must be emphasised that SP still can be an excellent EAC mitigation technique, but great care has to be taken on the quality of the SP process, as well as when to apply SP to surfaces of highly stressed structural materials.
Summary and conclusions
The investigation of surface treatment effects (RS, SAM, STI and SP) on the EAC initiation susceptibility in Alloy 182 weld material was performed in BWR oxidising NWC environment using the CERT test technique with FTT specimens with a set of nominal strain rates (1·10−6 s−1, 5·10−7 s−1 and 1·10−7 s−1). The main findings are:
As expected, the EAC critical stress increases with the nominal strain rate. Despite some scatter in the CERT results from various labs, trends for the differently treated surfaces could be identified. The CERT tests performed by multiple labs revealed that the EAC initiation susceptibility with different surface treatments at a nominal strain rate of 1·10–7 s–1 ranks, from least susceptible to most susceptible, as: SAM < RS < STI < SP. However, it must be emphasised that the differences were moderate. The mechanical grinding, which produced the lowest surface deformation out of the investigated surfaces, did not significantly retard the EAC initiation compared to industrial face milling. Despite the presence of highly compressive surface residual stress present on their surface, the shot peened specimens displayed by far the lowest EAC critical stress values. This can be attributed to the cold-worked and highly defective surface layer that is less resistant to EAC than the underlying bulk material. Furthermore, it was postulated that during the rather ‘aggressive’ CERT testing plastic deformation could wash out the compressive residual stress and promote the formation of high tensile stresses in the cold-worked surface region.
Footnotes
Acknowledgements
This project received funding from the Euratom research and training programme 2014-2018 under grant agreement no. 755151. The authors would like to express their gratitude for the excellent contributions and support from Ulla Ehrnstén (VTT), Alice Dinu (RATEN), M. Grace Burke, Liberato Volpe (both from Materials Performance Centre – University of Manchester), Francisco-Javier Perosanz (CIEMAT) and from the other members of the MEACTOS project consortium.
Disclosure statement
No potential conflict of interest was reported by the author(s).
Data availability
The original test data and results are available in the public domain (upon request) in the engineering database ‘MatDB’ in the online data & information network of the EC Joint Research Centre (ODIN, https://odin.jrc.ec.europa.eu/odin/) [![]() ].
].