
Abstract
The applicability of an accelerated test technique using tapered tensile specimens for investigating the stress corrosion crack (SCC) initiation behaviour of structural materials in high-temperature water was assessed in the framework of a European collaborative research project (MICRIN – MItigation of CRack INitiation). The main advantage of using a tapered geometry is, that in a single test a stress gradient is obtained through the gauge length, and therefore a stress threshold for SCC initiation can be determined in a reasonable timeframe. This method was used to investigate two different materials that were known to be susceptible to SCC in light water reactor environment: a high-Si stainless steel and a Ni-base weld metal (Alloy 182). The results of the international test programme confirmed that the tapered specimen test methodology could be used to identify a SCC initiation stress threshold, albeit that significant scatter was present in the data.
Keywords
Introduction
Although the reliability of nuclear power plants has increased, stress corrosion cracking (SCC) continues to influence plant performance and availability significantly. Recent examples are instances of SCC degradation of Ni-base alloys used in pressurised water reactors (PWRs), cold-worked austenitic stainless steel (SS) and dissimilar metal welds in boiling water reactors (BWRs) and irradiation-assisted SCC incidents in both types of reactors [1 7]. Therefore, reliable prediction of the SCC behaviour of given materials with different surface treatments is considered very important for the long-term operation of existing plants, as well as for the development of mitigation methods to avoid SCC. In the past decades SCC investigations were primarily focused on crack growth rather than initiation, partly because initiation studies are extremely challenging and time-consuming. However, for crack growth rates that are typically encountered for some of the high-temperature water SCC issues, crack initiation becomes a key element in the time-to-failure and safe and economic nuclear energy production.
The classical approach for SCC time-to-failure testing is a constant load test using a desired specimen geometry. The time-to-failure is determined as function of the applied stress [8,9]. This is illustrated in Figure 1. The lower the applied stress, the longer is the time-to-failure. Under a certain critical stress, the time-to-failure goes to (semi) infinite. This is the so-called critical stress limit or stress threshold. To find this stress limit can be time-consuming, as failure times can be extremely long. For example, primary water stress corrosion cracking (PWSCC) of Ni-base alloys in high-temperature water can take more than 10-20 years to occur [10]. If for such a material-environment system a threshold stress must be obtained according to the approach presented in Figure 1, testing will take years or even decades.
Classical approach for finding SCC stress thresholds.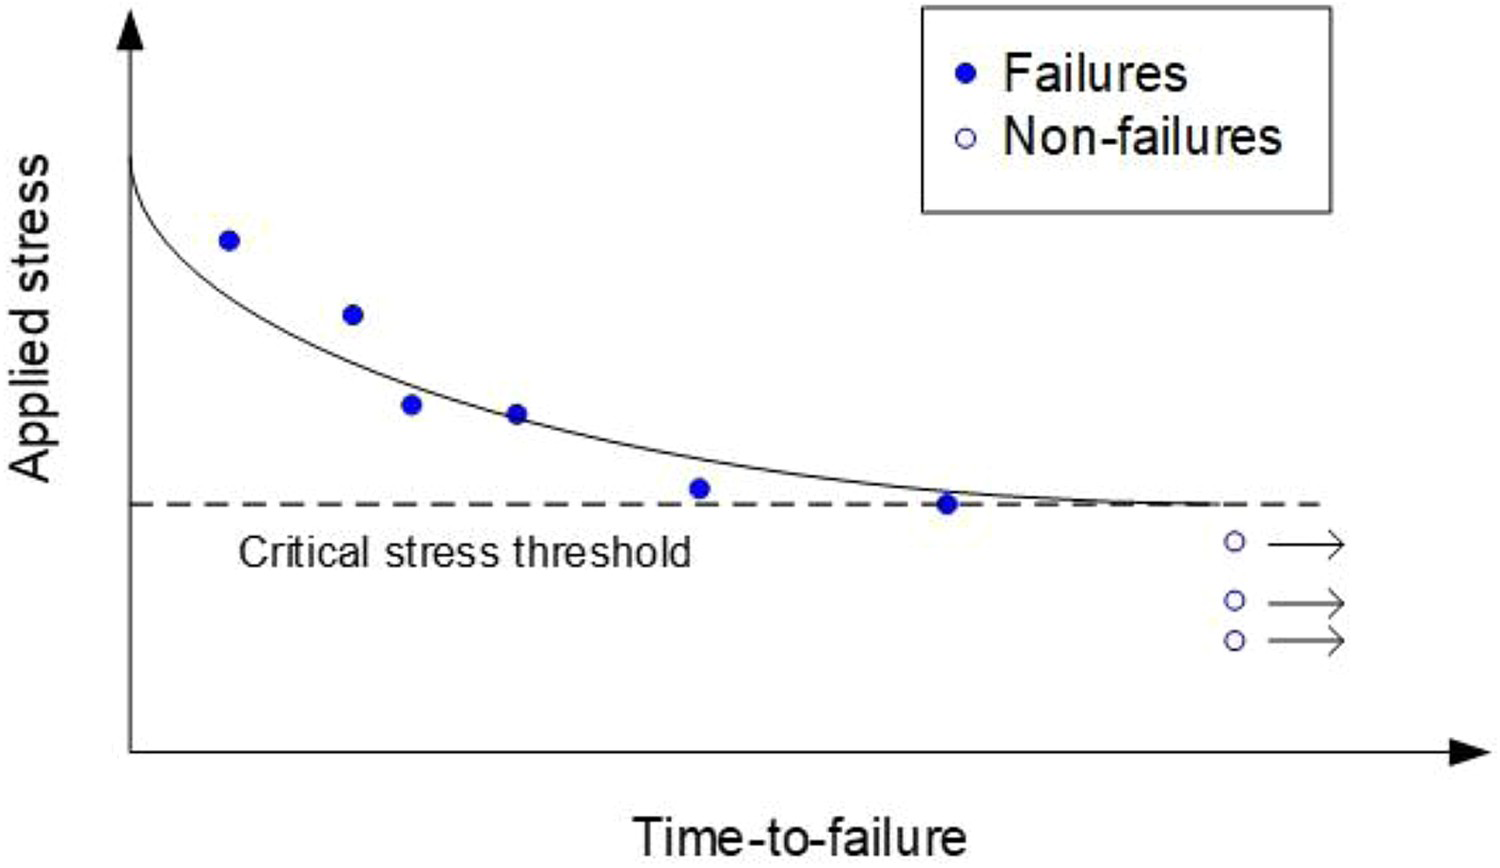
Therefore, the aim of this work is to develop an accelerated test method to assess SCC initiation. The accelerated test method will be used to identify tensile stress thresholds for crack initiation in relevant environments. In addition, the test method should enable the investigation of various parameters that can influence the material's SCC susceptibility, such as temperature, strain/strain rate, surface finish and roughness, as well as microstructure of the material.
A possible accelerated test technique to identify a stress threshold in a single test is the use of a tapered tensile specimen [11 25]. With the tapered specimen test method, a metallic specimen of variable cross-section is exposed to the environment of interest. At the same time a constant or varying load is applied to the specimen. The aim is to determine the relationship between the applied load and the first surface cracks, which can then be related to a so-called stress threshold for SCC initiation. The main advantage of this tapered geometry is, that in a single test a stress gradient is obtained through the gauge length, and therefore a stress threshold for SCC initiation can be determined in a reasonable timeframe.
Although tapered specimens have not been used extensively, some work has been reported over the past 40 years. Jonas [11] described how tapered specimens could be used to determine a stress corrosion threshold stress in 1978. The applicability of the test method was confirmed by testing of several materials in different environments. One of the main conclusions was that the threshold stress could be determined with fewer tapered specimens compared to greater number uniform specimens required. Beaver [12] used tapered specimens for SCC testing of pipeline steels in carbonate–bicarbonate solution. The main conclusion was that a difference in SCC susceptibility could be determined that was not apparent in conventional slow strain rate tests. Tapered specimens were also used by Parkins [13], Leis [14] and Fazzine [15] to determine crack initiation in pipeline steels in various environments. Yu [16] used tapered specimens to determine crack initiation stresses of various SCC systems (brass in ammonia solution, copper in nitrite and mild steel in carbonate–bicarbonate, hydroxide or nitrate solutions). The results were in good agreement with constant load tests on plain cylindrical specimens. Only a limited amount of work has been reported in high-temperature water systems. Yang [17] has performed slow strain rate tests with type 316 stainless steel tapered specimens in chloride-containing water in the temperature range of 150-300°C to evaluate the crack initiation strain. Brozova [18] used tapered specimens to study SCC of low-alloy steel in high oxygen-containing water in the temperature range of 150-320°C. Cao [19] used tapered uniaxial tensile samples to compare SCC of Alloy 600 and 690 in supercritical water.
Tapered specimens have also been used for non-SCC studies. An interesting application was reported by Singh [20], who utilised a tapered gauge tensile specimens to determine the threshold stress for the reorientation of hydrides in Zr-2.5 Nb over the temperature range of 250-400°C. Henry [21] employed tapered tension-tension fatigue specimens to determine the fatigue damage for various stresses with a single specimen.
The applicability of the tapered specimen to SCC initiation in high-temperature water autoclave systems was part of the collaborative MICRIN (MItigation of CRack INitiation) project [22,23], a NUGENIA initiative. The method developed in this project was subsequently applied by Bai [24,25] to study the effect of hydrogen on the SCC susceptibility of Alloy 182 in BWR environment.
The objective of the current research programme is to use these tapered specimens in combination with the following SCC acceleration factors:
Straining: the strain or deformation rate has a strong influence on the time-to-failure, i.e. without any dynamic strain some materials may not fail. This is typically valid for Ni-base alloys in high-temperature water [26,27] Temperature: SCC is a thermally activated process, which is particularly true for Alloy 182 in high-temperature water [2,28 30]. With increasing temperature, the crack propagation increases significantly. For instance, the crack growth rate of Alloy 182 in PWR water increases by a factor of 10 when the temperature is increased from 300 to 350°C [29]. Surface condition: smooth (polished) versus rough (ground) surface. The effect of the surface condition on SCC has been the subject of several studies [22,28,31,32]. It was shown that the surface condition can have a significant effect on the SCC susceptibility.
Owing to the large number of tests and the desire to assess reproducibility, a European consortium of nine test laboratories was set up in the framework of a NUGENIA association initiative. This specific project consortium, representing a majority of the laboratories in Europe with ‘nuclear environmentally assisted cracking and corrosion’ test capabilities, has further developed and executed the tapered specimen testing methodology and have applied it to screen the SCC initiation behaviour for some relevant material-environment systems.
To assess the suitability of the accelerated SCC test method with tapered tensile specimens, the work programme was divided into two phases. The first one used the high-Si stainless steel, with an additional objective to assess the influence of the tapered tensile specimen geometry (flat versus cylindrical), and a second phase evaluated the effects of test temperature, surface condition and strain on the SCC stress threshold of Alloy 182 weld.
Thus, the aim of this work is to investigate how this tapered specimen method can be used, and identify the specific issues and boundary conditions required for successful application. This paper will first discuss the test methodology and constrains. Next, a short description of the test materials will be presented including the distribution of the tests among the participating laboratories. Finally, the test results will be discussed with respect to the applicability, advantages and disadvantage of the tapered specimen method along with recommendations for further improvements.
Experimental methods
Test materials
To investigate this tapered specimen test method, two materials that are known to be susceptible to SCC in high-temperature water were chosen. The first material is a high-Si duplex stainless steel, developed for the Euratom-funded FP6 project PERFECT [33]. It is a model alloy designed to simulate the ‘grain boundary composition’ in neutron-irradiated stainless steels (reflecting the irradiation-induced Si and Ni enrichments at the grain boundaries). This model alloy is sensitive to SCC in high-temperature water in contrast to a ‘normal’ (non-irradiated) austenitic stainless steel. The consequence of the high-Si concentration is that the material has a duplex microstructure and that the cracking mechanism is not necessarily similar to that of irradiated austenitic stainless steels. However, it is a useful surrogate as the material is susceptible to SCC in high-temperature water without being irradiated.
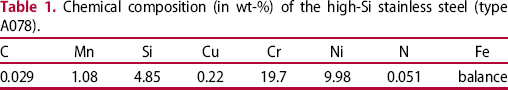
Table 1 lists the chemical composition of the model stainless steel alloy. The duplex austenite-ferrite microstructure of the alloy is shown in the optical micrographs of Figure 2.
Light optical micrographs showing the duplex structure of the type A078 stainless steel: light grey is austenite, dark grey is ferrite (etched with Behara solution; 0.2 L HCl, 1 L H2O, 1 g K2S2O3). Chemical composition (in wt-%) of the high-Si stainless steel (type A078).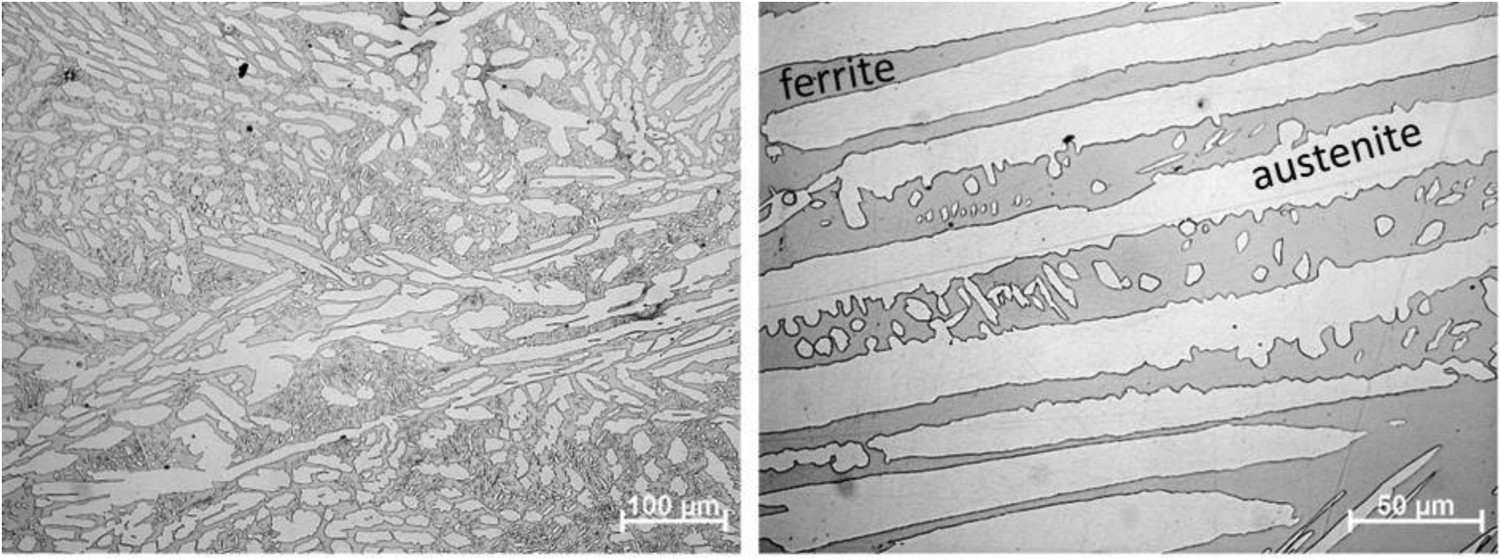
For the second phase of the test programme, a representative Alloy 182 weld was acquired from the PWR plant of Lemoniz (Spain) that was built, but never commissioned. Alloy 182 is still present in many dissimilar metal welds in operating PWRs and BWRs and is thus of great relevance.
A large part was retrieved from the Lemoniz plant; this part contained the forged reactor pressure vessel nozzle, the safe end and part of the cold leg pipe, which included a welded-in elbow. The production component included a buttering layer on the carbon steel nozzle and an Alloy 182 weld between the buttering layer and the austenitic stainless steel safe end. The carbon steel nozzle's inner surface was covered by a stainless steel cladding. Figure 3 contains a macrograph of the dissimilar metal weld with the involved materials (Figure 3(a)) and the microstructure of the weld (Figure 3(b)). Table 2 lists the chemical composition of the weld metal.
Alloy 182 dissimilar metal weld with: (a) macrostructure showing the weld, the reactor pressure vessel steel and the stainless steel safe end; (b) the microstructure showing dendritic weld structure. Chemical composition (in wt-%) of the Alloy 182 weld metal.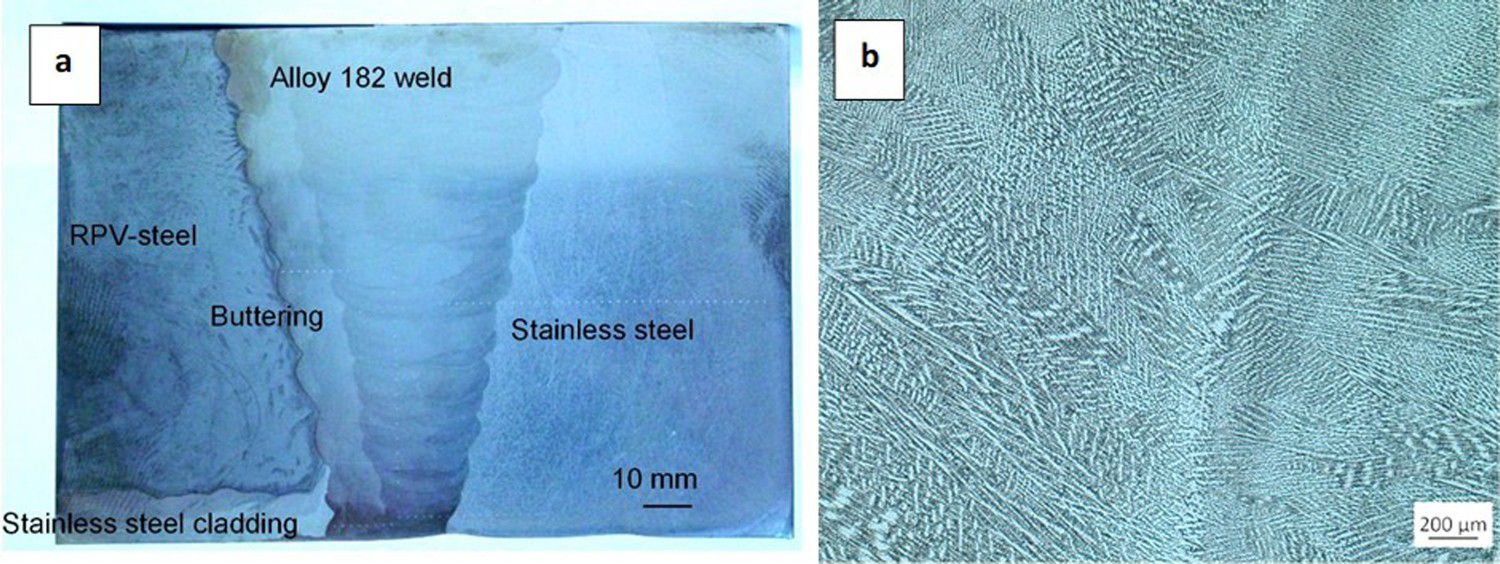
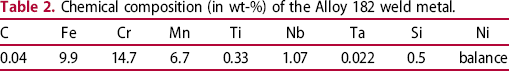
Figure 4 illustrates how the specimens were cut from the dissimilar metal weld. The specimens were cut out in the TL direction, which gives the highest susceptibility to SCC. In addition, it optimises the number of specimens that can be obtained from the weld material. In total 60 specimens were extracted from the weld and were tested at the participating laboratories.
Lemoniz (PWR) cold leg dissimilar metal weld and tapered specimens’ cutting plan.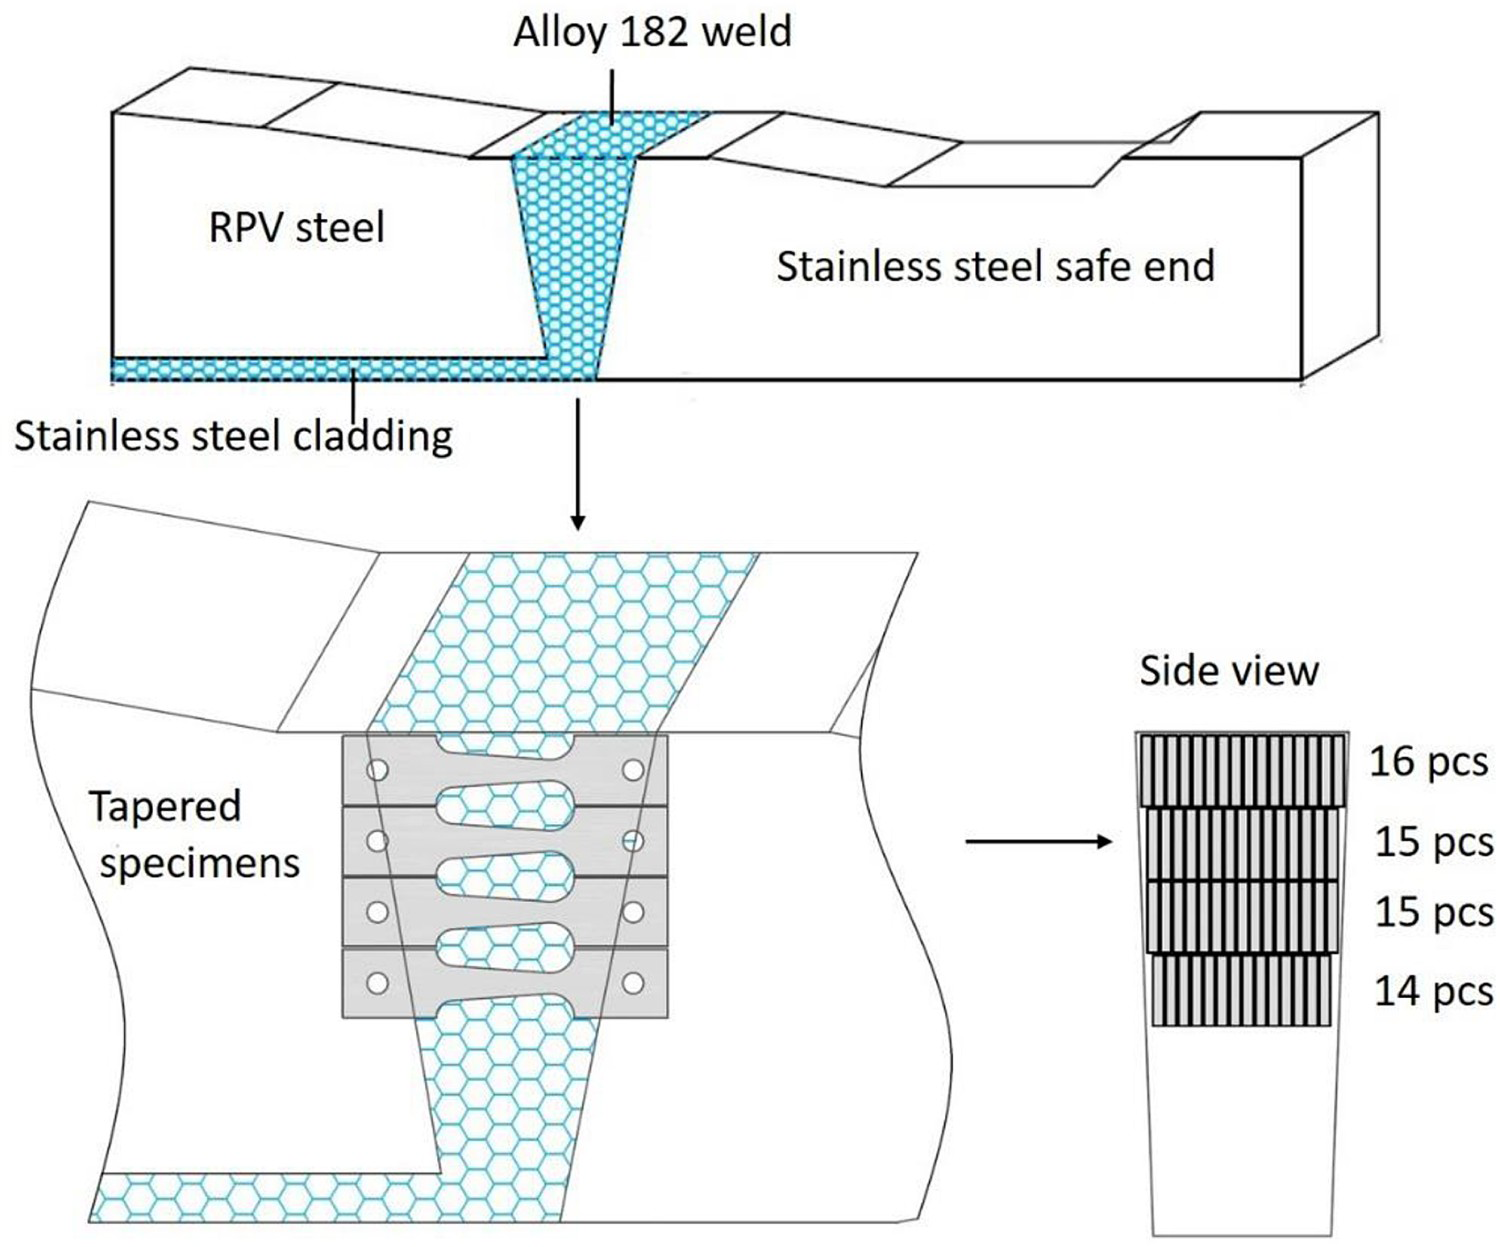
To assess the grain structure within the Alloy 182 weld, an electron backscatter diffraction (EBSD) characterisation of the entire weld cross-section was performed using a Zeiss Sigma Variable Pressure field emission gun SEM, operated at 20 kV and equipped with an Oxford Instruments EBSD detector and Aztec analysis system. The specimen was initially metallographically polished using a Struers Tegramin 25, with a final polishing using a 50 nm silica oxide polishing suspension. A step size of 10 μm was used for the EBSD data acquisition. Approx. 1000 sub-maps were acquired and montaged to generate the final EBSD map shown in Figure 5. This EBSD analysis covered the entire weld section, including the butter layer and the 316 stainless steel base metal. The EBSD analysis documented the variation in microstructure within the whole weld. Figure 6 allows a clear identification of the cladding with grain orientation, as well as the weld structure and grain size. The microstructure in the Alloy 182 is in general homogeneous throughout the weld thickness.
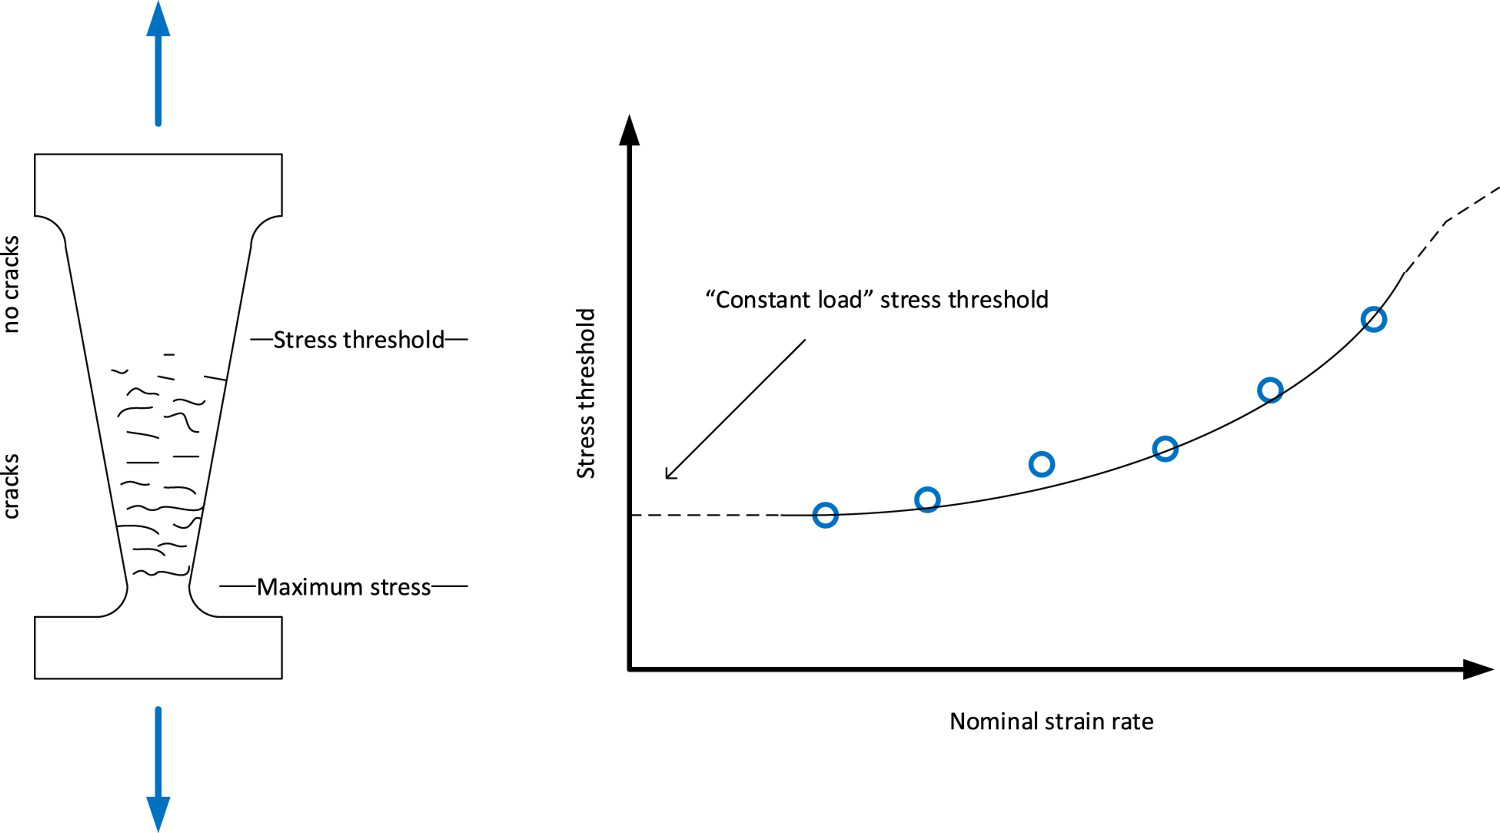
EBSD analysis of the Alloy 182 weld. Schematic illustrating the determination of the stress threshold as function of nominal strain rate.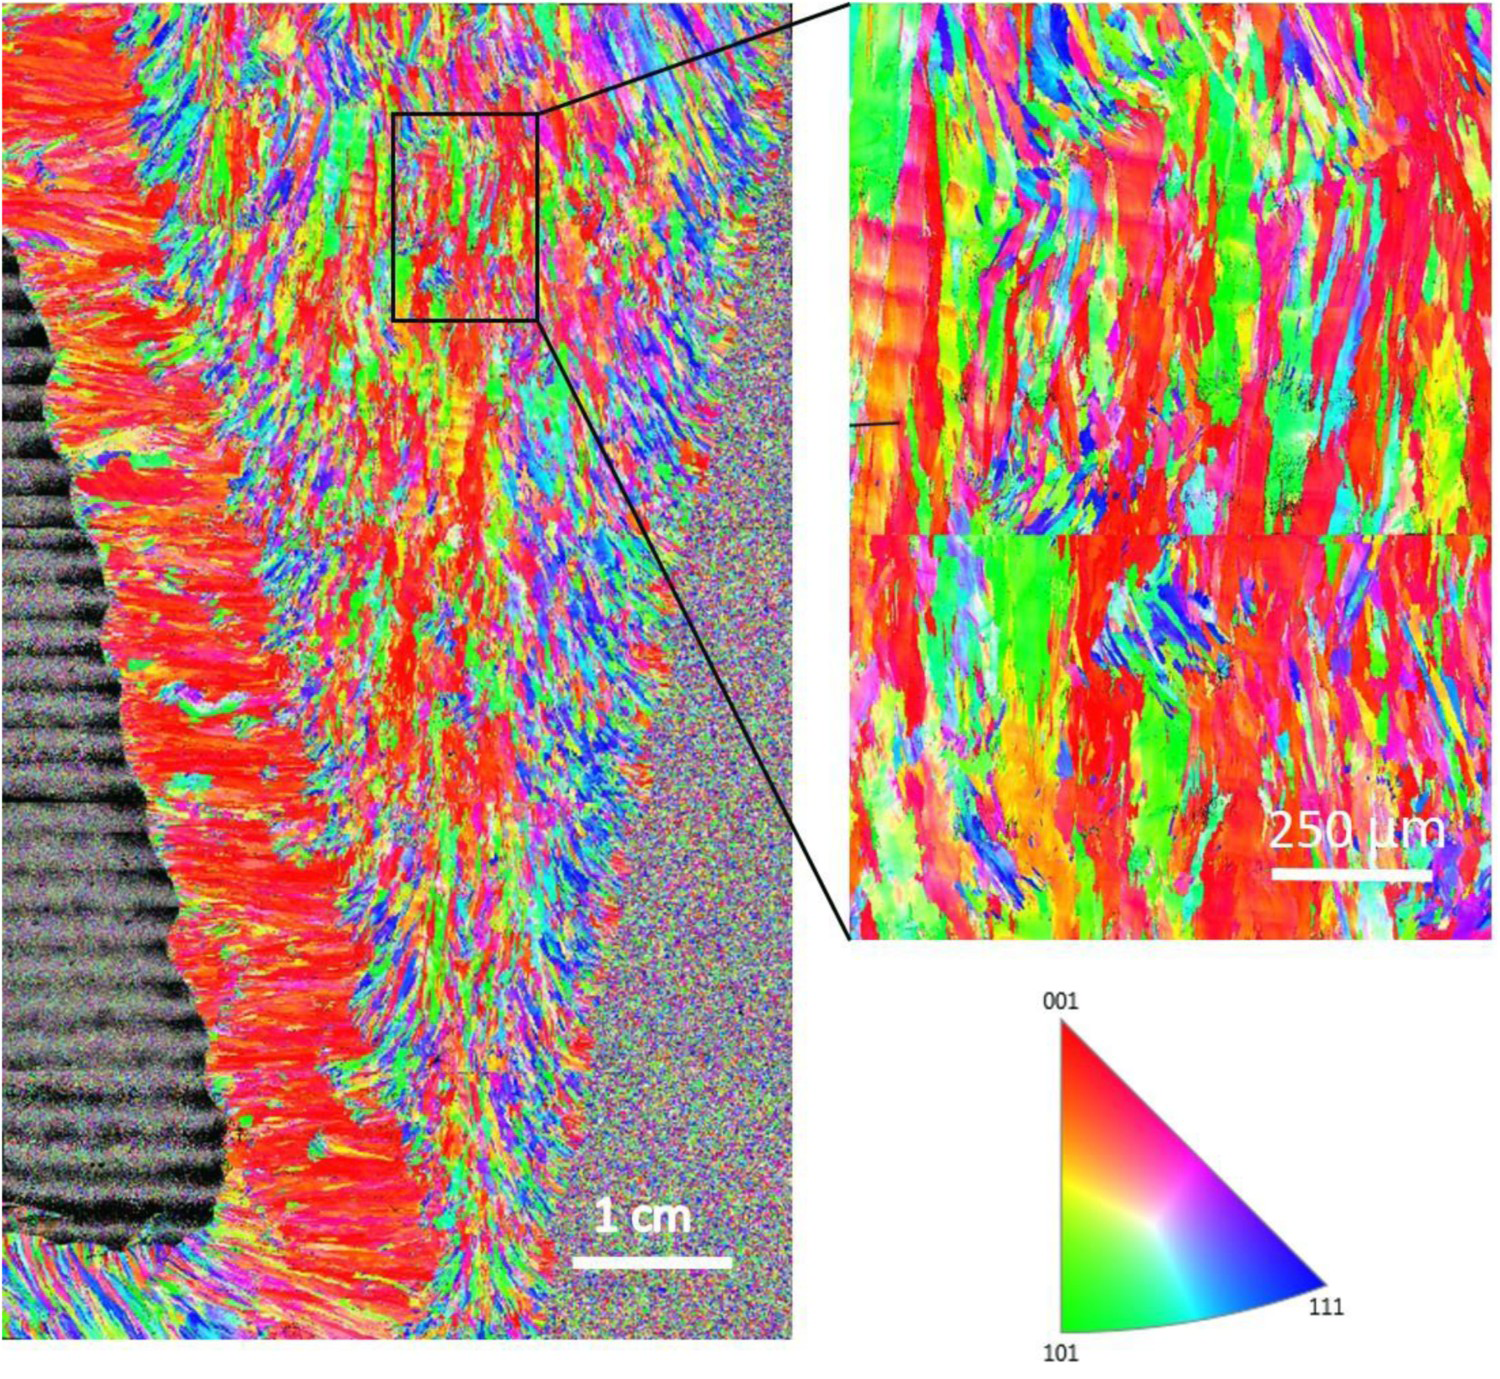
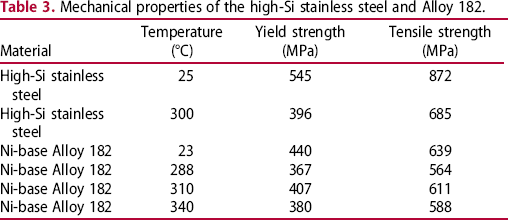
Mechanical properties of the high-Si stainless steel and Alloy 182.
Tapered specimen testing
The principle of the tapered specimen test method is shown in Figure 6. A constant extension rate tensile (CERT) test is performed to failure, using a tapered specimen. The specimen surface is then examined using a scanning electron microscope (SEM) to identify the location along the gauge length beyond which cracks are no longer detected. This cross-section location is related to the critical stress corresponding to the test conditions under which no SCC will occur. Several such tests can be performed at different strain rates to construct the graph as shown on the right-hand side in Figure 6. Notice that these strain rates depend on the local cross-section of the specimen and so there is a strain rate gradient along the specimen gauge section. Therefore, the term ‘nominal strain rate’ is introduced. The nominal strain rate is equal to the displacement rate divided by the complete tapered gauge length. It is assumed that an extrapolation to a very low (‘near-static’) nominal strain rate would resemble the ‘constant load’ stress threshold, i.e. a stress threshold that is independent of the strain rate.
Strain rates used for slow strain rate tensile tests are typically in the range from 10−5 and 10−7 s−1 [34 36]. For stainless steels and Ni-based alloys in high-temperature water, they are chosen more at the low end of this range, i.e. around 10−7 s−1 [34,37]. Therefore, in this study the strain rates were distributed around the values of 10−7 s−1, which means that they varied between 10−6 and 5·10−8 s−1.
Figure 7 shows that the specimens used were either flat or round, both with the common feature of having a gradual change in the cross-sectional area along the tapered gauge length. The tapered section was designed so that there was a reduction in the area of 40% from the largest to smallest cross-section (5-3 mm for the flat and 3-2.32 mm for the round specimen).
Schematic diagram of the flat and round tapered tensile specimens (dimensions in mm).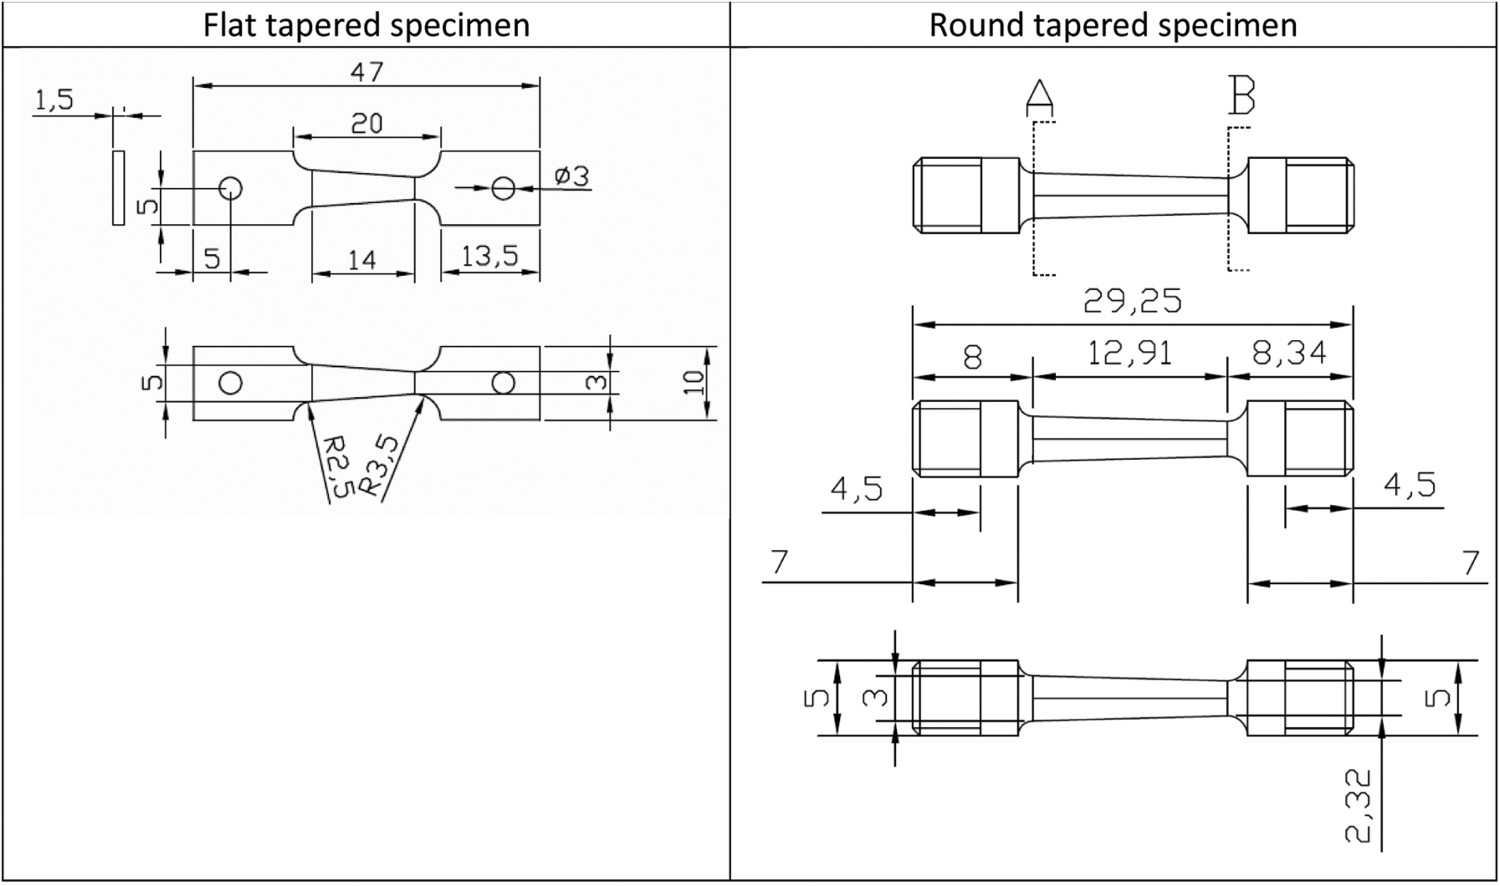
There is a strain gradient along the gauge length of the tapered specimen, which depends on the surface area of the local cross-section and the shape of the stress–strain curve. That means that the strain and strain rate will change during the test as function of time and position at the tapered gauge length. To illustrate this, the strain and strain rate distributions over the gauge length were calculated with an Excel macro using a Ramber–Osgood approximation of the constitutive law that best fit the tensile data of the stress–strain curve. As a calculation example (representative for the tests in this work) the tensile data of Alloy 182 at 300°C were used. The tapered specimen test was modelled for an average strain rate over the gauge length 10−7 s−1 and the results are shown in Figure 8. The stress–strain curve is plotted as blue dots up to the ultimate tensile strength of 620 MPa (2800 N in Figure 8), which was the part used for the calculations. The strain distributions at several distances from the smallest cross-section were calculated, where 0 mm represents the smallest cross-section and 14 mm represents the largest cross sections. It is clear from these results that a major part of the straining takes place close to the smallest cross-section of the tapered specimen.
Load and strain variation versus time and position of a tapered specimen – calculated for Alloy 182 at 300°C for an average strain rate of 10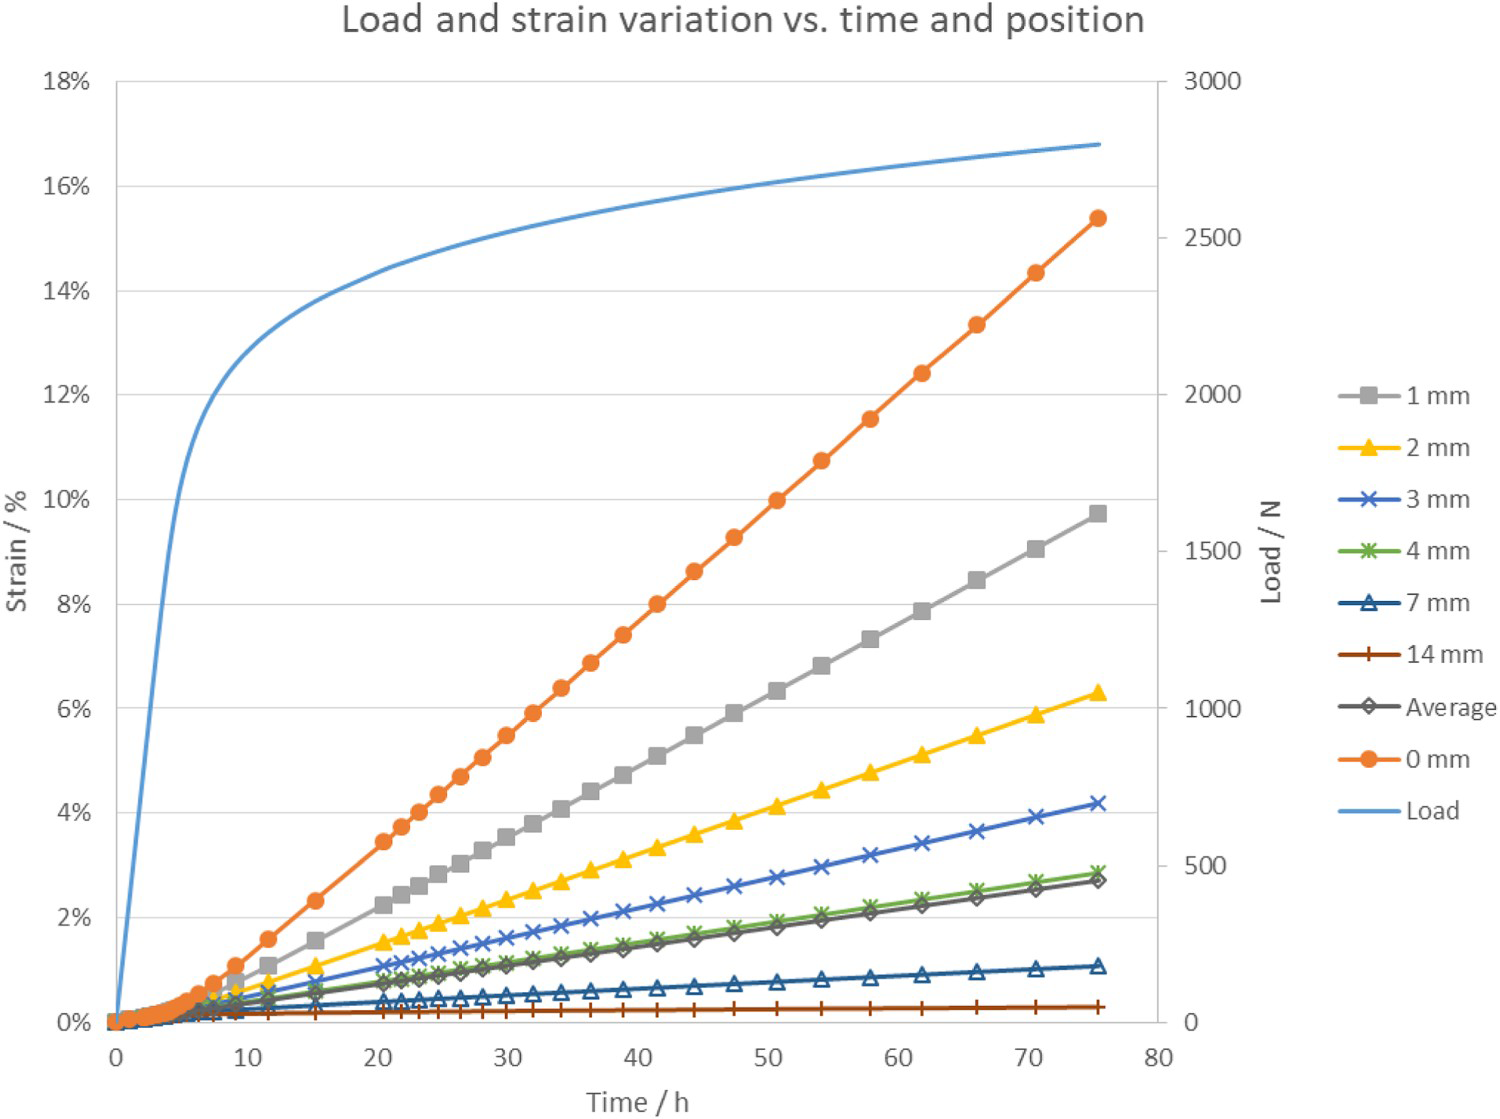
The results of Figure 8 were used to calculate the strain and strain rate as a function of the tapered gauge length. The results are shown in Figure 9. From this figure, it is possible to see that the average strain rate is positioned at about 4 mm from the smallest cross-section of the tapered specimen. Depending on the position of the crack boundary the real strain rate can be lower or higher than this average nominal strain rate. For the higher range of strain rates, where SCC has little time to develop, the stress boundaries are generally closer to the smallest cross-section and so the real strain rate is underestimated. For smaller strain rates were SCC is more dominant, the stress boundaries are closer to the largest cross-section and so the nominal average strain rate is overestimated. That means that the average nominal strain rates as used in the plots to find stress thresholds (as demonstrated in Figures 14 and 18) cover in reality a wider span of strain rates.
Strain and strain rate variation over the length of a tapered specimen – calculated for Alloy 182 at 300°C for a strain rate of 10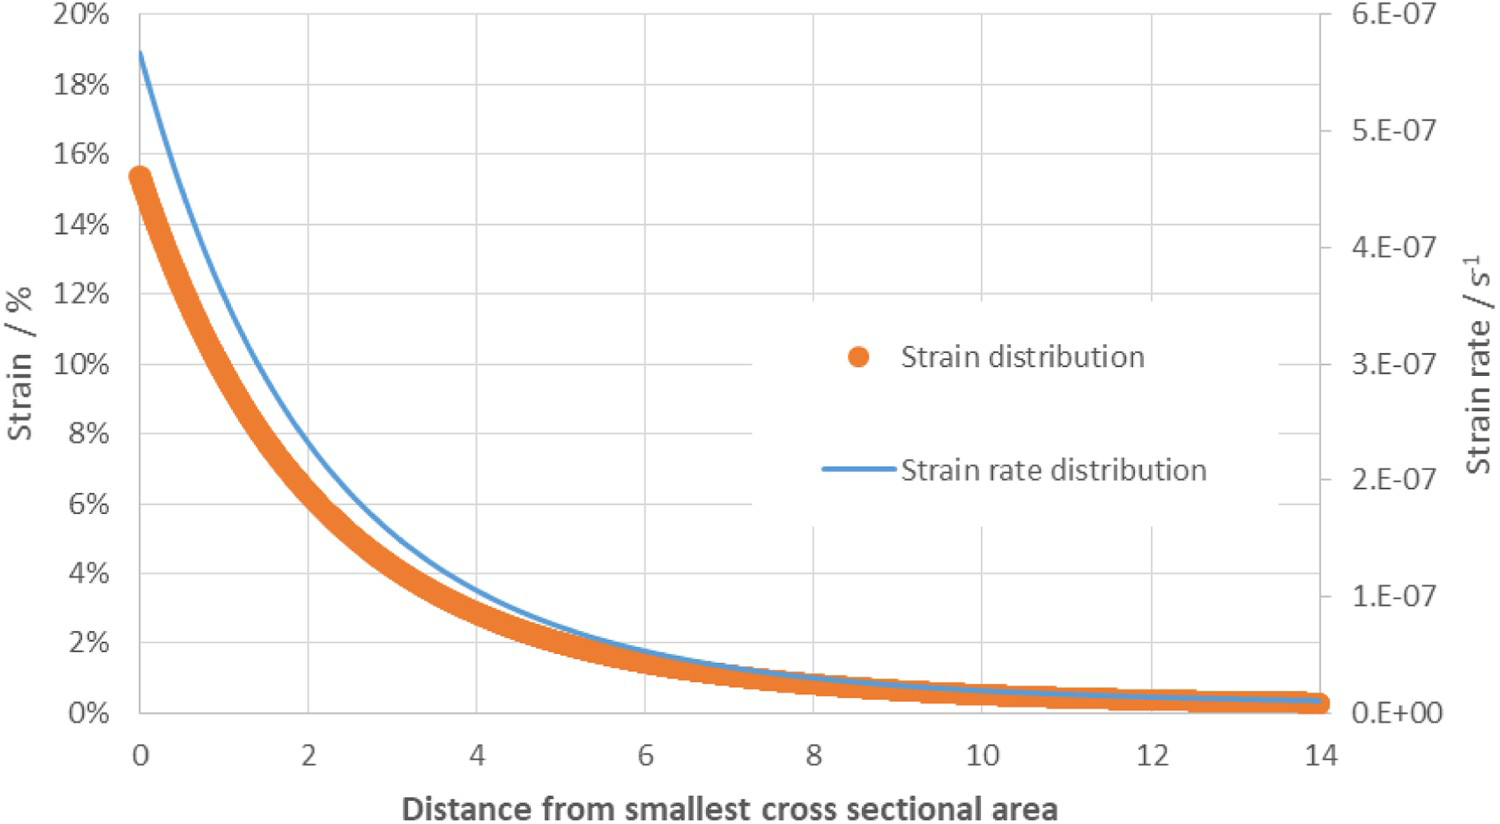
The current test programme consisted of two phases: (1) assessment of the specimen geometry (flat versus round tapered specimens); and (2) evaluation of SCC initiation stress threshold as a function of test temperature, strain and surface condition using flat tapered specimens. The phase 1 experiments were conducted using the high-Si stainless steel with both flat and round tapered specimens. All specimen's surfaces were grinded up to 1200 grit paper (ISO/FEPA). The Alloy 182 was used for phase 2 experiments with only flat tapered specimens. The flat tapered specimen provides the advantage of permitting the evaluation of the effect of surface condition (polished versus ground) on the SCC stress threshold. This increases the testing efficiency in that one specimen can provide a full gradient of different stresses together with two different surface conditions combined in one single test. The surface finish of the specimen was 180 grit (ISO/FEPA) on one side (named ‘side A’) and up to 1 μm diamond polish on the other side (named ‘side B’). The grinding and polishing of all specimens were performed by one laboratory in the same way.
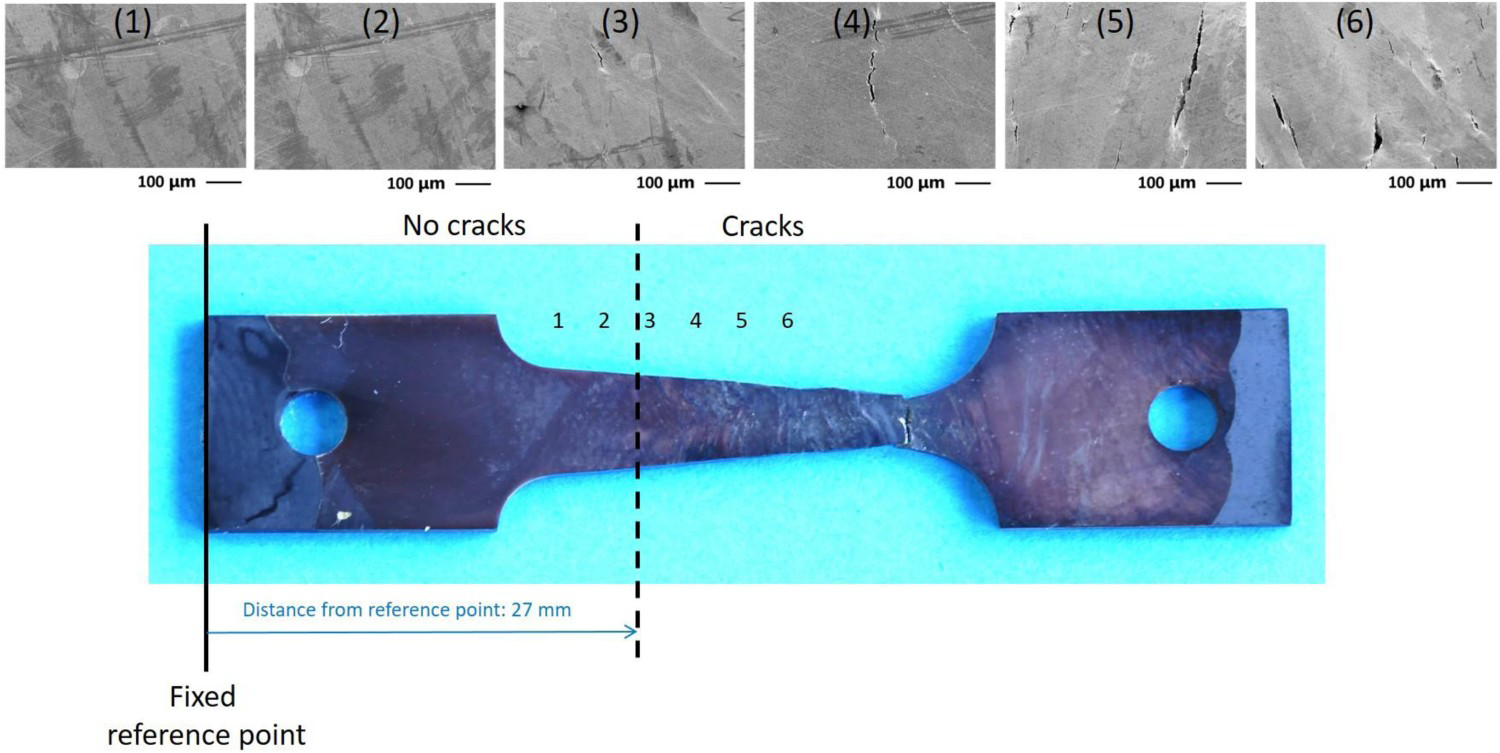
For both phases of this programme, a well-defined test procedure was developed (see Section 2.3 and the Appendix). The post-test specimen analysis was performed in two steps: (1) the maximum load was obtained from the load-displacement curve; and (2) the surfaces of the tapered specimens were evaluated using SEM in order to identify the boundary between the cracked and non-cracked areas along the gauge length. This is illustrated in Figure 10 for the high-Si stainless steel and in Figure 11 for Alloy 182.
Post-test tapered high-Si stainless steel specimen with secondary electron (SE) images from largest to smallest cross-section showing how the boundary between crack-containing and crack-free region was obtained. Post-test tapered Alloy 182 specimen with SE images obtained along the gauge length from the widest to narrowest cross-section showing how the boundary between crack-containing and crack-free region was obtained.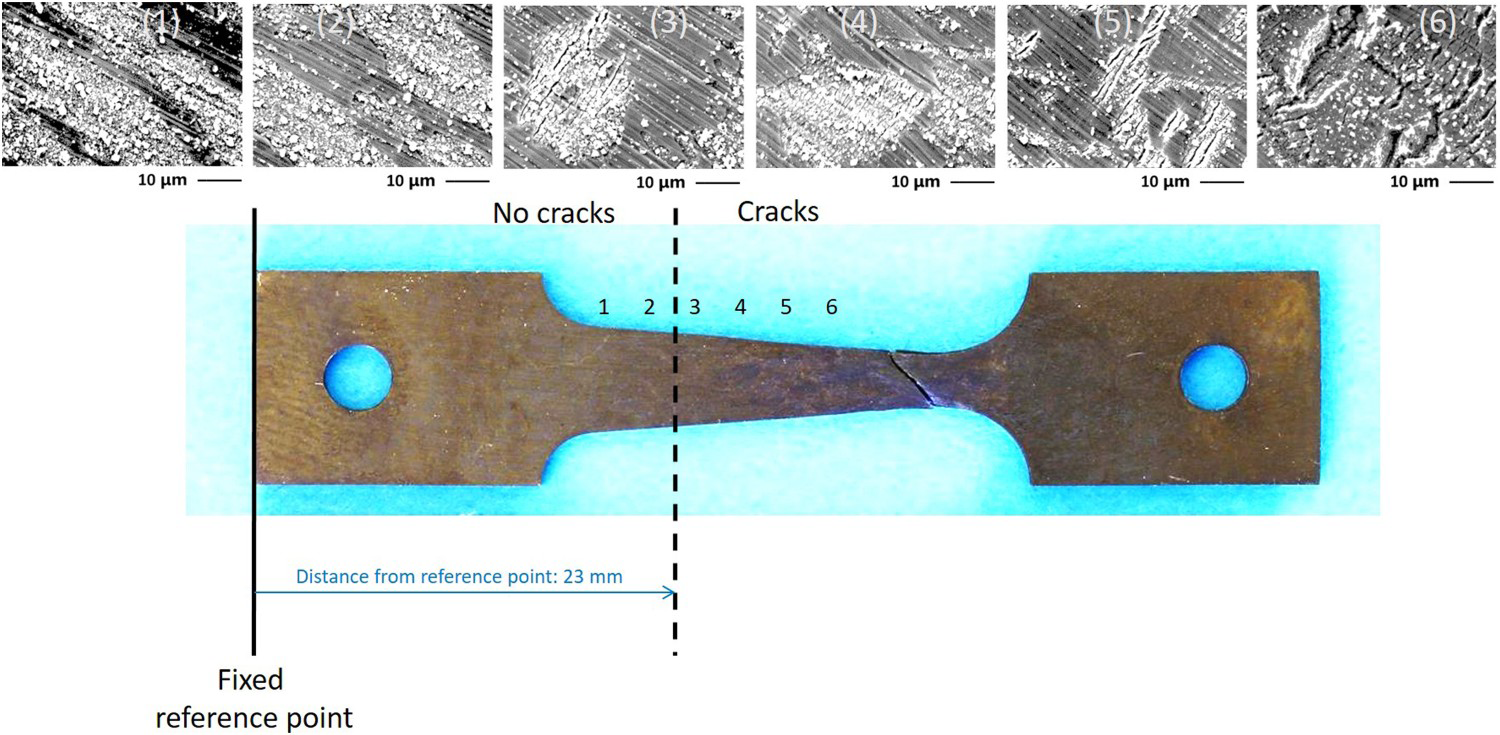
The stress thresholds obtained with the tapered specimens do show a large amount of scatter. Part of the scatter can be related to the stochastic nature of SCC, part however is inherent to the analysis method, whereby different individuals had to interpret what was a valid SCC crack. The determination of the stress thresholds was thus subjective. To minimise the human factor-related scatter, the proposed analysis method was as follows. The maximum magnification to map the specimens’ surface by SEM was set to 1000×, which means that cracks of approximately 10 μm in extent are readily detected (1 cm at 1Kx = 10 μm). Each SEM operator performing the analysis scanned the specimen surface starting from the narrowest part to the widest part of the gauge length. The justification for this approach is that it is easier/more consistent to examine the crack-containing regions of the sample to identify the cracked/non-cracking transition than starting the examination from the non-cracked portion of the gauge length, i.e. cracks becoming finer and finer instead of suddenly appearing on the sample. In addition, examples of secondary electron (SE) images of cracks were shared among all the participating laboratories to obtain consensus on crack definition and identification. Examples of such images are presented in Figures 12 and 16. For example, Figure 16(c) was determined to be an SCC crack, whereas Figure 16(d) was an oxidised grain boundary and not considered to be a crack.
The critical length was defined and the cross-section at this location was calculated. In this exercise, the original surface area of the cross-section was used. As it was assumed that crack initiation will occur before notable plastic deformation has occurred, so that the cross-section remained relatively constant in size. The critical stress (threshold) was then calculated by dividing the maximum load by the surface area at the critical cross-section.
Test procedure and conditions
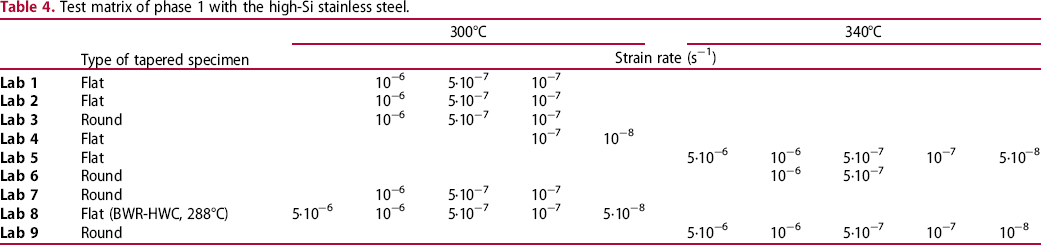
Test matrix of phase 1 with the high-Si stainless steel.
Test matrix of phase 2 with Alloy 182.
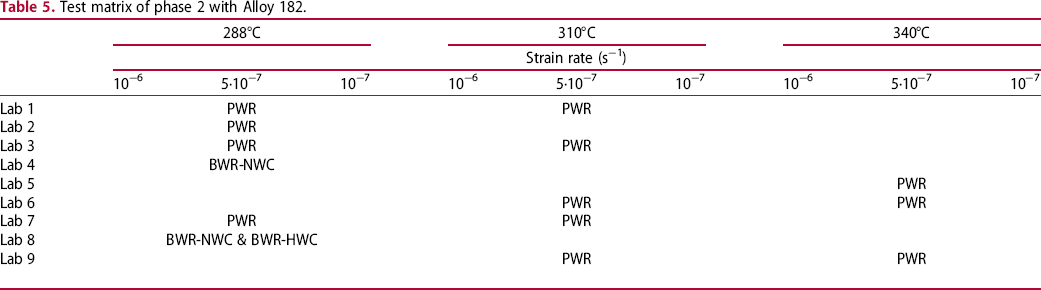
The test matrices for phase 1 (high-Si stainless steel) and phase 2 (Alloy 182) are listed in Tables 4 and 5, respectively. The distribution of tests among the participating laboratories was such that each laboratory was supposed to perform at least three tests with a low, medium and high strain rate. This ensured that the workload (or test time) for each lab was similar (the longest test time was assumed to be 30 days, including the one-week pre-oxidation phase). In reality the testing time varied as the SCC susceptibility could not be precisely determined in advance. On a voluntary basis, the participating laboratories could perform two additional tests: one at a higher and one at a lower strain rate. For Alloy 182 the number of tests was increased to six for each laboratory to cover all the test temperatures. The test matrix combined the tests in such a way that the influence of strain rate, temperature, surface finish (ground versus polished) and water chemistry (oxidising versus reducing) could be determined.
All tests started with a one week conditioning phase at the desired water chemistry conditions and with a small pre-load (to keep the specimens in place), followed by a CERT phase until final rupture of the specimen. The experiments in phase 1 were conducted at three temperatures (288, 300 and 340°C) and up to five different nominal strain rates. In the second phase the tests were carried out at three temperatures (288, 310 and 340°C) and three different nominal strain rates.
Furthermore, it may be noted, that most of the original test data and results are available in the public domain in the engineering database ‘MatDB’ in the online data & information network of the EC Joint Research Centre (ODIN) [40].
Results of the laboratory tests
Phase 1 – high-Si stainless steel
In the phase 1 programme, both flat and round specimens of high-Si stainless steel were tested. The stress thresholds were determined according to the description in the test procedure provided in Section 2.3 and in the Appendix. Figure 10 illustrates the analysis approach after the completion of the test. SEM examination using SE imaging mode was performed along the tapered specimen gauge length to look for cracks. Moving from the narrowest section to the widest section, the crack density steadily decreased until no cracks were detected.
The series of SE images in Figure 12 shows the crack appearance on the surface of a tapered specimen tested under PWR conditions at 340°C and with a strain rate of 5·10−8 s−1. Figure 12(a) shows the narrowest part of the tapered specimen where the final fracture occurred. The typical crack morphologies observed on the tapered specimen surface are presented in Figures 12(b,c), whereas Figure 12(d) shows an area where no cracks had formed. Figure 12(b), which contains numerous cracks, was obtained close to the fracture surface. The cracks were clustered and small in size, which meant that they could be hidden behind the surface oxides. The cracks detected for the Si-stainless steel were mainly present in the austenitic phase. A more detailed study on the nature of the crack morphology was performed by Penders [41]. It was shown that the cracks were transgranular in nature and, as such, different from the typical intergranular cracks reported for IASCC [42]. The reason is that the Si is not only enriched at the grain boundaries, but present throughout the steel, so there was no selective weakening of the grain boundary. That means that the strain-path plays a more important role in the SCC crack propagation, resulting in transgranular fracture.
SE images of a high-Si stainless steel tapered specimen after PWR testing (340°C, 5·10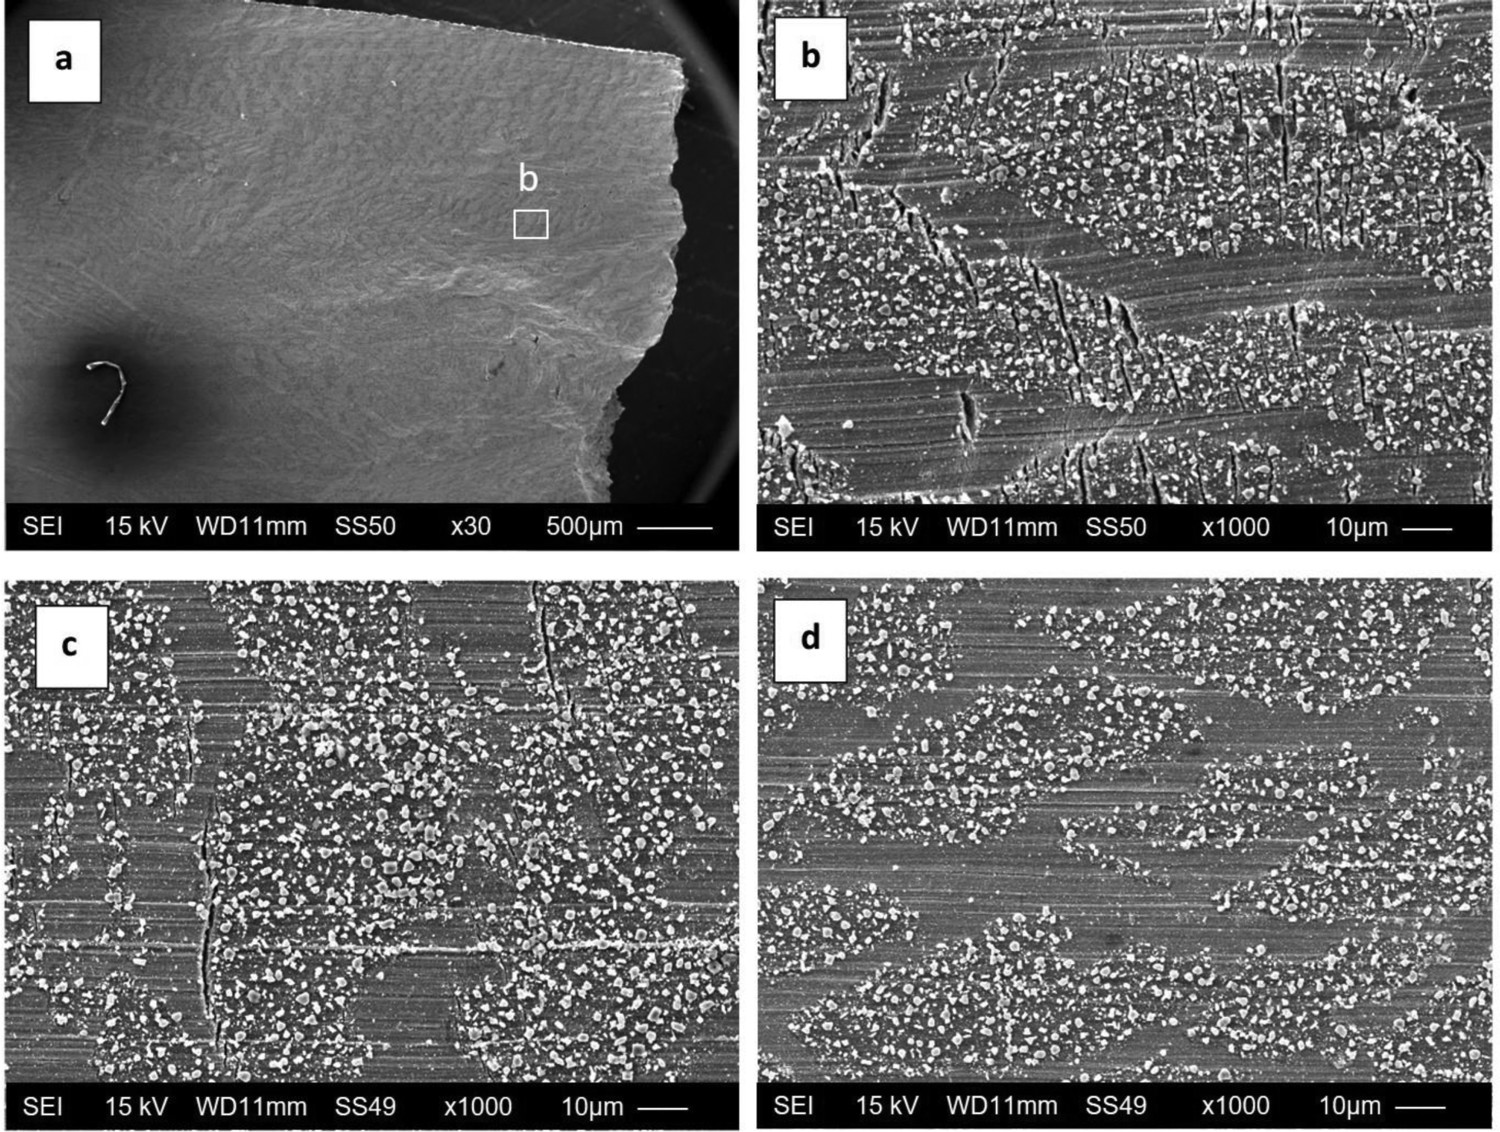
This crack morphology was very different from the results for Alloy 182, both in size as in morphology. In the tested high-Si stainless steel multiple clustered cracks were observed, whereas the Alloy 182 specimens exhibited more isolated cracks.
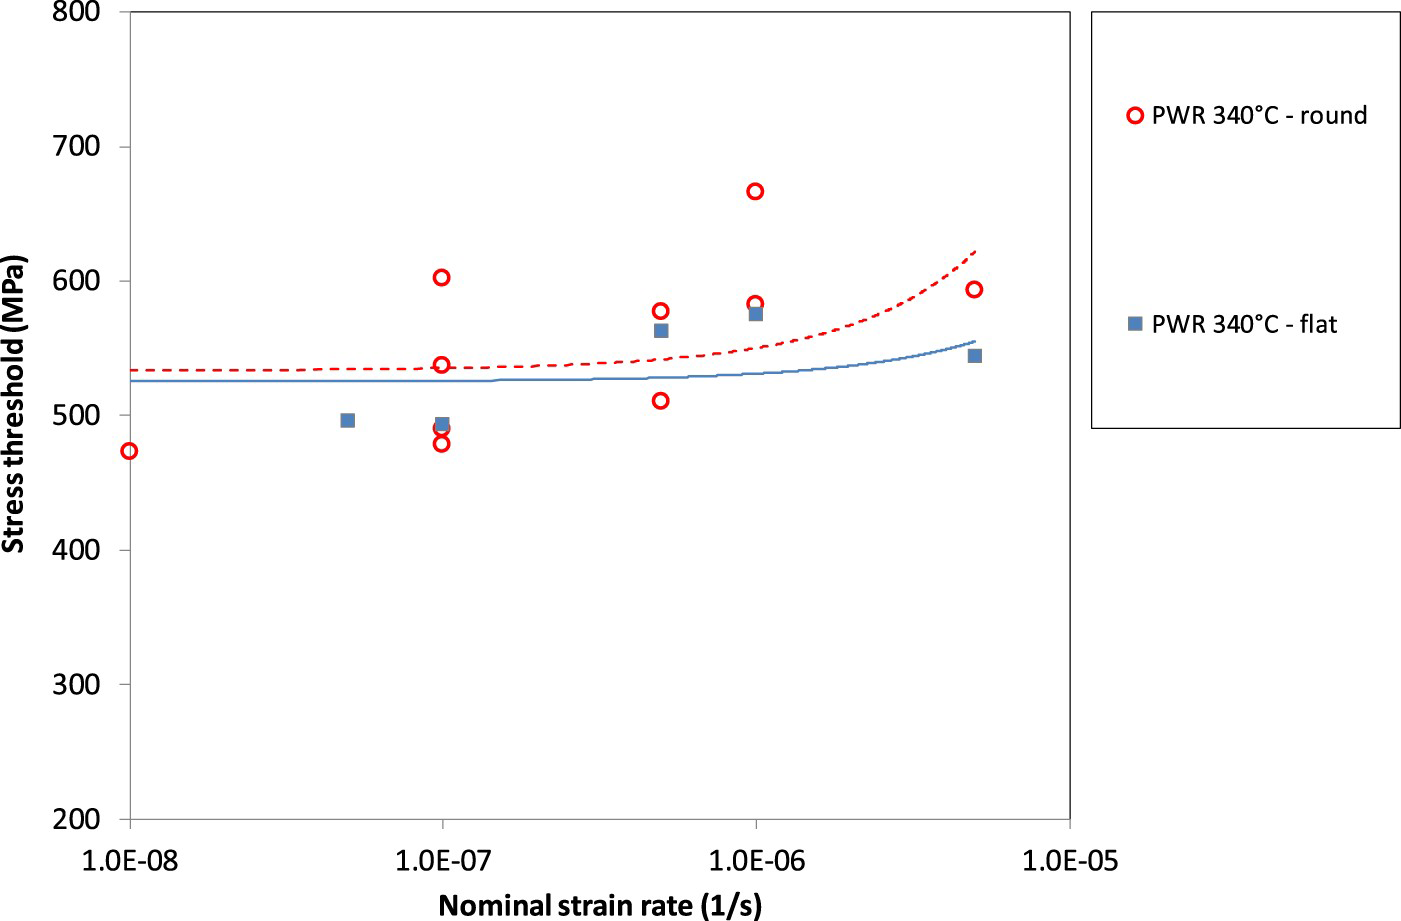
Figure 13 shows a graph of the results for the round and flat tapered specimens tested at 300 °C (PWR). A decrease in the measured stress thresholds with decreasing nominal strain rate, but also some scatter in the data, can be observed. A difference between the round and flat tapered specimens was noted, although at the lowest nominal strain rate there is only one data point for the round tapered specimens and so this had a strong influence on the extrapolated value. Figure 14 shows a graph of the results for the round and flat tapered specimens tested at 340 °C (PWR). There was also a decrease of the measured stress thresholds as a function of nominal strain rate, although some data scatter can be seen also here. There was only minimal difference between the measured stress thresholds for the round and flat tapered specimens. Thus, it was concluded that both specimen types can be used for tapered specimen tests, but one major advantage of the flat tapered specimen is the ease of post-test characterisation and analysis. Additionally, it is also possible to test two different surface conditions with one flat specimen.
Stress thresholds of flat and round tapered specimens as a function of nominal strain rates for the high-Si stainless steel tested at 300°C. Stress thresholds of flat and round tapered specimens as a function of nominal strain rates for the high-Si stainless steel tested at 340°C.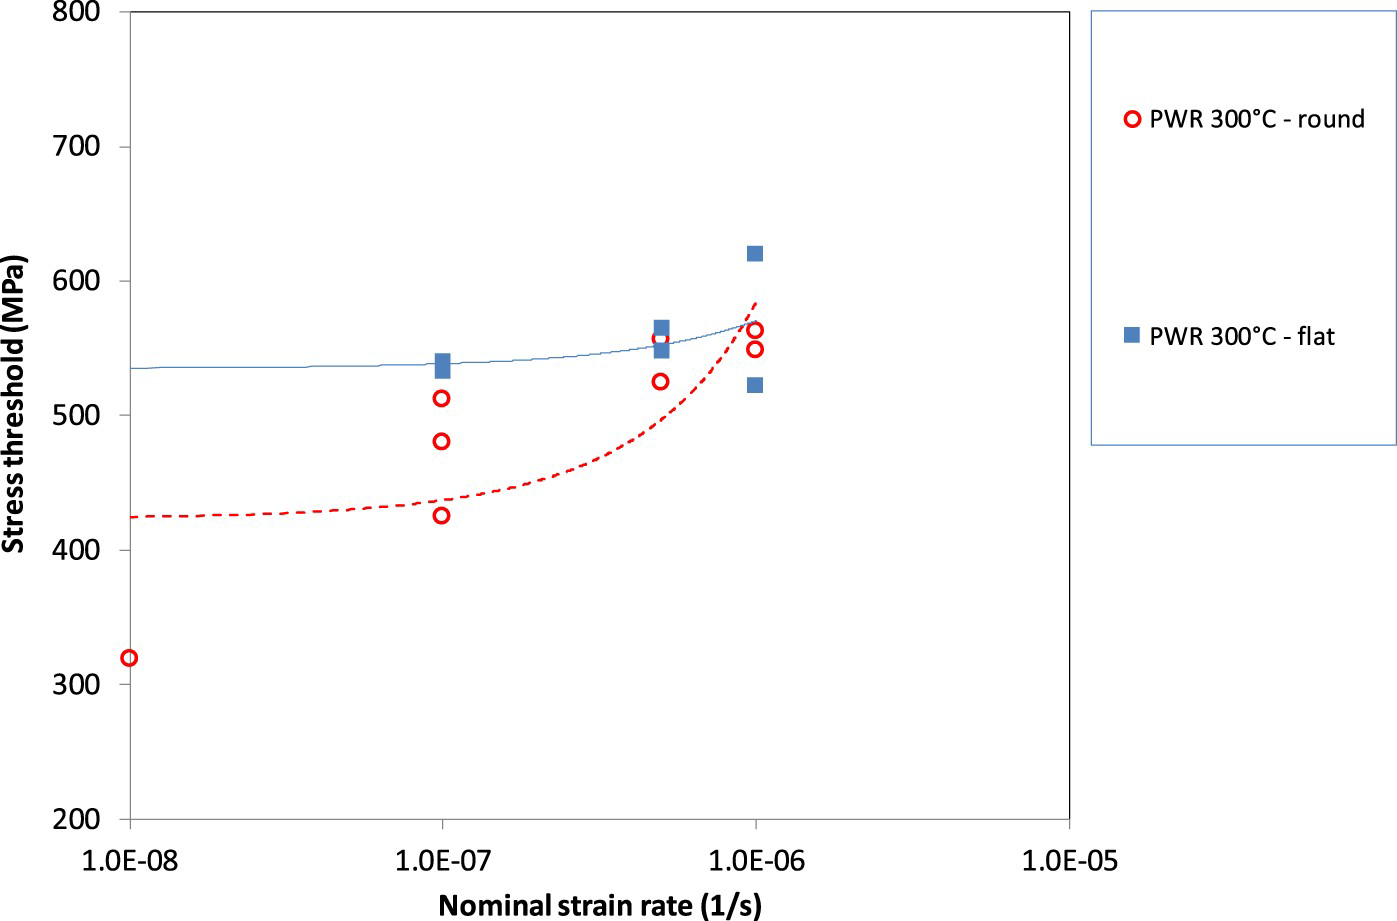
All data points obtained from the flat tapered specimen tests are summarised in Figure 15. The data from the flat tapered specimens were used to study the effect of temperature as they covered the largest temperature range. To facilitate better comparison of the results, trend curves (exponential fits) of the data sets for BWR-HWC (288°C), PWR (300°C) and PWR (340°C) were added to determine whether convergence to a ‘constant load/zero strain’ SCC initiation threshold could be obtained. These curves mainly served as a guide-to-the-eye, as there are insufficient data points to make a statistically relevant fitting.
Stress thresholds as a function of nominal strain rates for the flat high-Si stainless steel tapered specimens – effect of temperature. The insert shows the stress threshold for each conditions: open symbol 1·10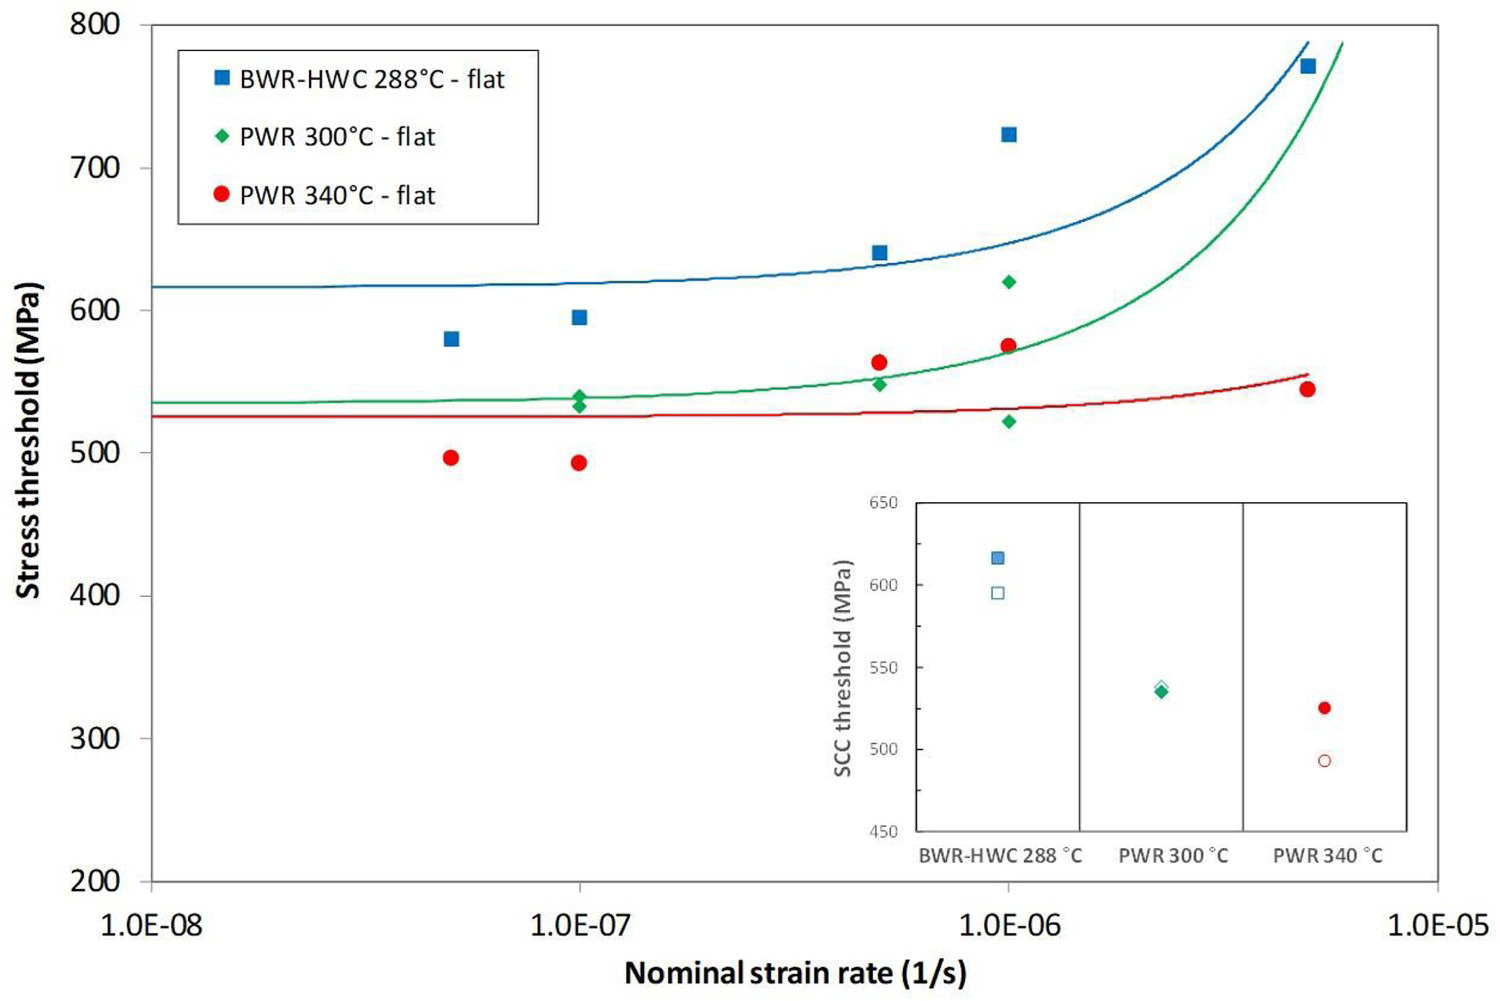
Despite the scatter and the limited amount of data, some conclusions can be drawn. The obtained stress thresholds decreased with increasing test temperature. These differences were more pronounced at higher strain rates as compared to lower strain rates. The stress thresholds obtained at very low strain rates (5·10−8 s−1) improved the extrapolation towards lower strain rates, but only to a limited degree. Therefore, one may choose to use 1·10−7 s−1 as the lowest strain rate. This strain rate was used for the Alloy 182 tests as shown in Section 3.2. Furthermore, all three trend curves show a decreasing stress threshold with decreasing strain rate. The thresholds from the extrapolated curves to ‘constant load’ conditions are plotted in the insert in Figure 15 together with the thresholds stresses obtained at a strain rate of 10−7 s−1. This clearly illustrates that the SCC initiation stress thresholds decrease with increasing temperature, revealing the highest SCC susceptibility at 340°C.
Phase 2 – Ni-base alloy 182
In phase 2, only flat tapered specimens of Alloy 182 were used with a different surface finish on each side. The tests were conducted according to the test matrix in Table 5. The determination of the stress thresholds was performed following the description in Section 2.3 and in the Appendix. Figure 11 shows the post-test analysis approach employed for each specimen. SEM examination using SE imaging mode was performed to locate cracks within the tapered gauge length. Moving from the narrowest section to the widest section within the gauge length, the proportion of cracks steadily decreased until no cracks were detected. Note the distinct difference in fracture orientation between the Alloy 182 in Figure 16 and the high-Si stainless steel in Figure 12.
SE images of an OPS-polished tapered specimen surface after a PWR test (340°C, 1·10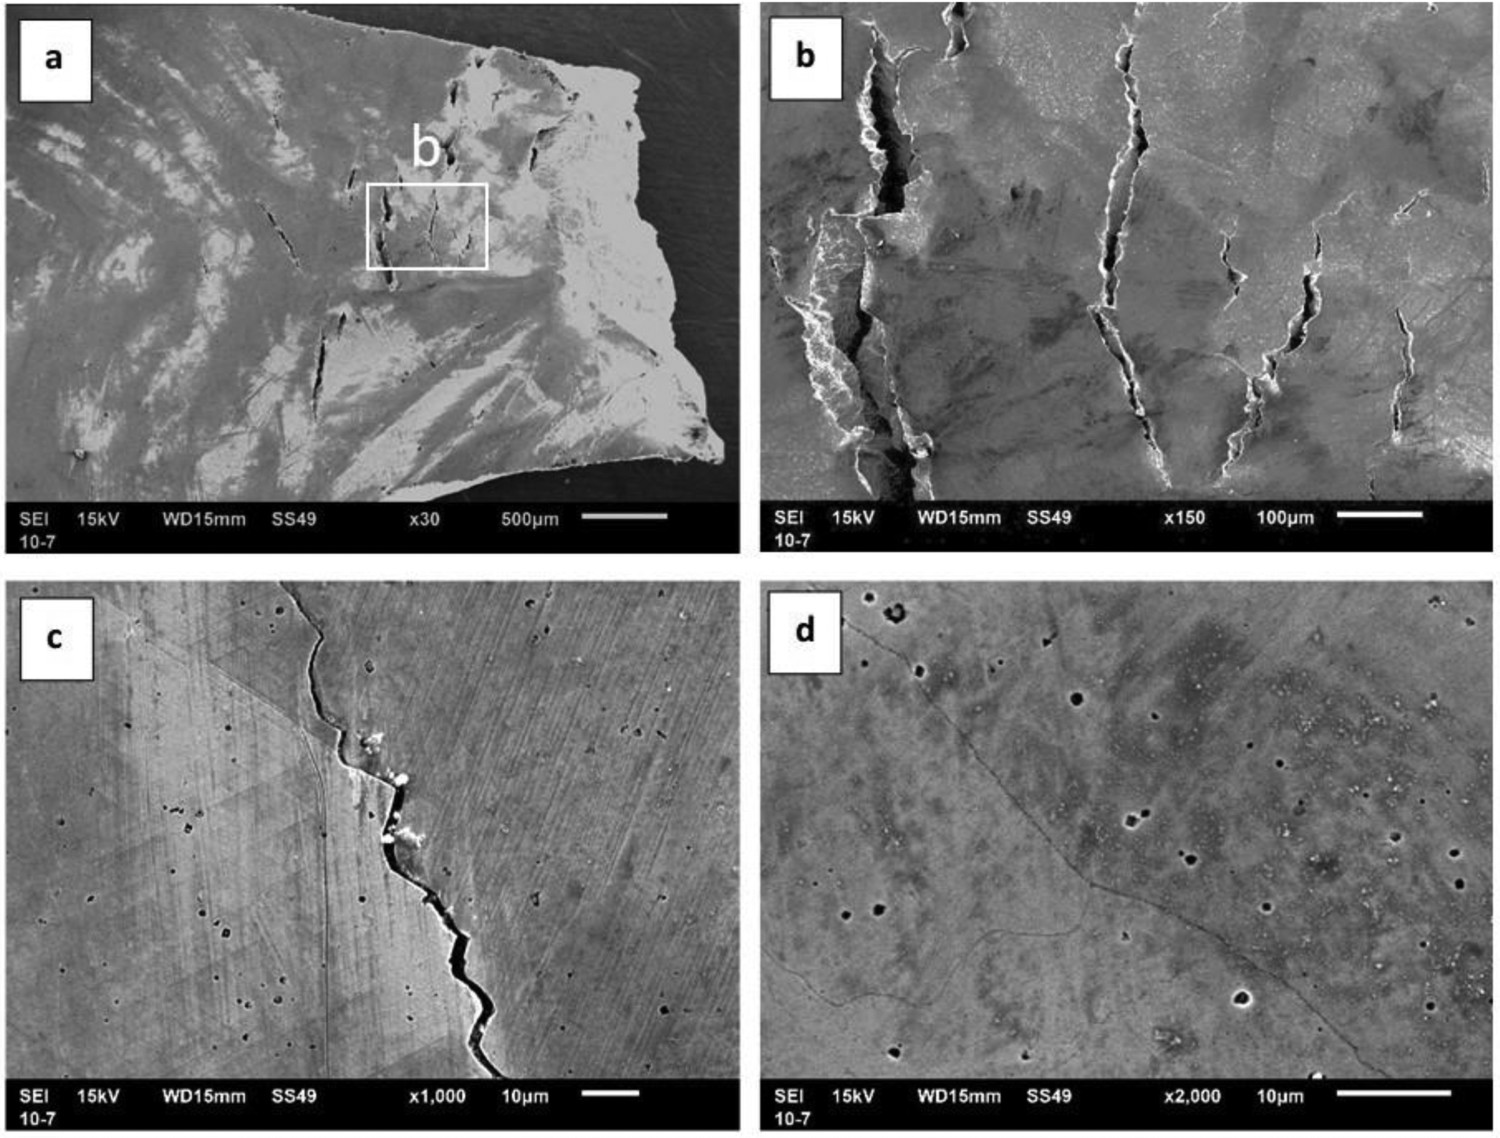
Figure 16 contains four SE images of the polished tapered specimen surface tested under PWR conditions at 340°C with a strain rate of 1·10−7 s−1. Figure 16(a) shows the part of the tapered specimen where the final fracture occurred, and large cracks are visible on the specimen surface. The typical crack morphologies detected on the tapered specimen surface are shown in Figure 16(b) and c. The cracks followed the dendrite boundaries of the solidified weld metal structure and have a similar appearance as reported by Scott [43] and Thomas [44]. Figure 16(d) presents an area in which no cracks were observed. The small darkly-imaging line visible on the surface in Figure 16(d) is a slightly etched grain boundary. Such boundaries were frequently observed on the specimen surface, as well as in the non-stressed regions of the specimen, and therefore were not classified as cracks.
The results of the SEM evaluation of the ground tapered specimen surface tested under PWR conditions at 340°C with a strain rate of 1·10−7 s−1 are provided in Figure 17. The SE images of Figure 17(a) illustrate the narrowest part of the tapered specimen where final fracture occurred; Figure 17(b,c) the typical crack morphologies observed on the tapered specimen surface; and Figure 17(d) the crack-free area. This ground surface was more oxidised, which resulted in a quite different crack appearance. Grain boundaries are not visible, although the cracks do follow a similar course as the cracks on the polished surfaces.
SE images of a ground tapered Alloy 182 specimen surface after a PWR test (340°C, 1·10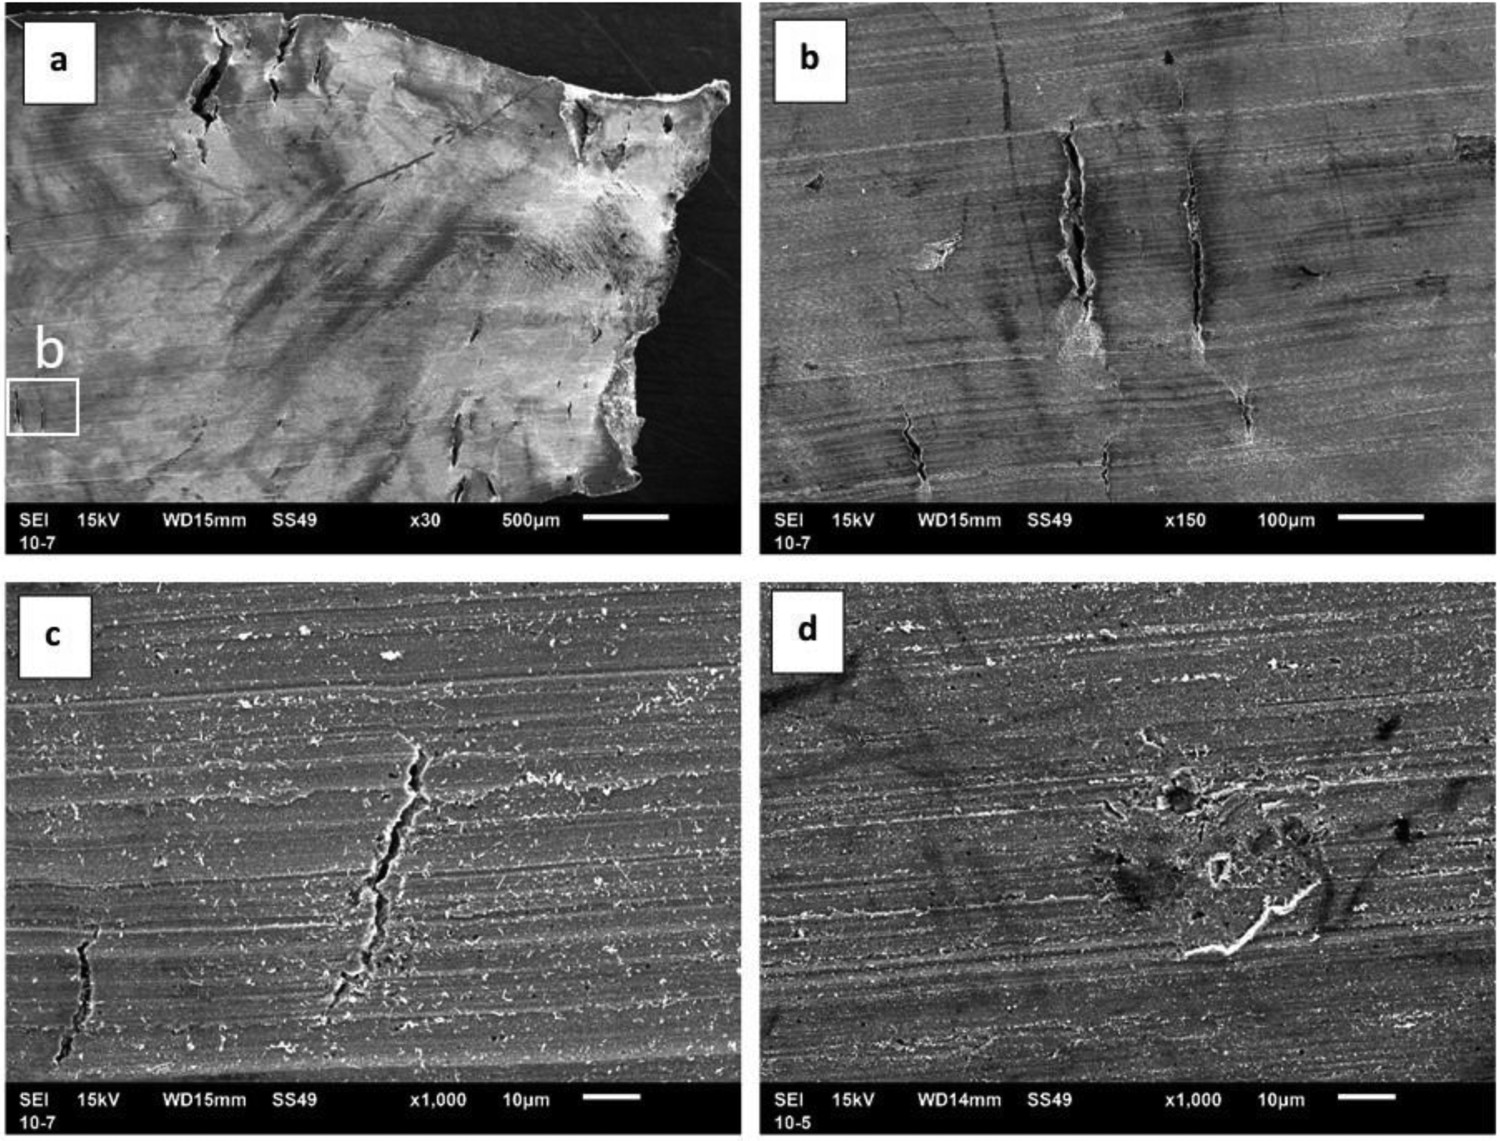
The Alloy 182 crack morphologies were very different from those observed for the high-Si stainless steel, where multiple cracks appeared to be more closely spaced. For the Alloy 182 specimens, the cracks appeared to be more widely spaced.
The graph of the results for the flat tapered specimens tested at 288°C (BWR) is presented in Figure 18. There is a clear decrease in the stress thresholds determined from the tapered specimen tests as a function of nominal strain rate although there is notable scatter also in these data. The effect of water chemistry (NWC versus HWC) is evident. Alloy 182 is more susceptible to SCC under HWC compared to NWC conditions. Here it must be noted that the hydrogen content for the BWR-HWC conditions was chosen in a way to end up at the Ni/NiO phase transition boundary, where other investigations have shown the highest SCC susceptibility of Alloy 182 [38]. Also, the effect of surface finish (ground versus polished) could be readily distinguished. The polished surfaces exhibited a higher stress threshold and therefore a lower tendency towards SCC initiation than the ground surfaces.
Stress thresholds as function of nominal strain rates for the Alloy 182 tapered specimens with ground and polished surfaces under BWR-NWC and BWR-HWC conditions.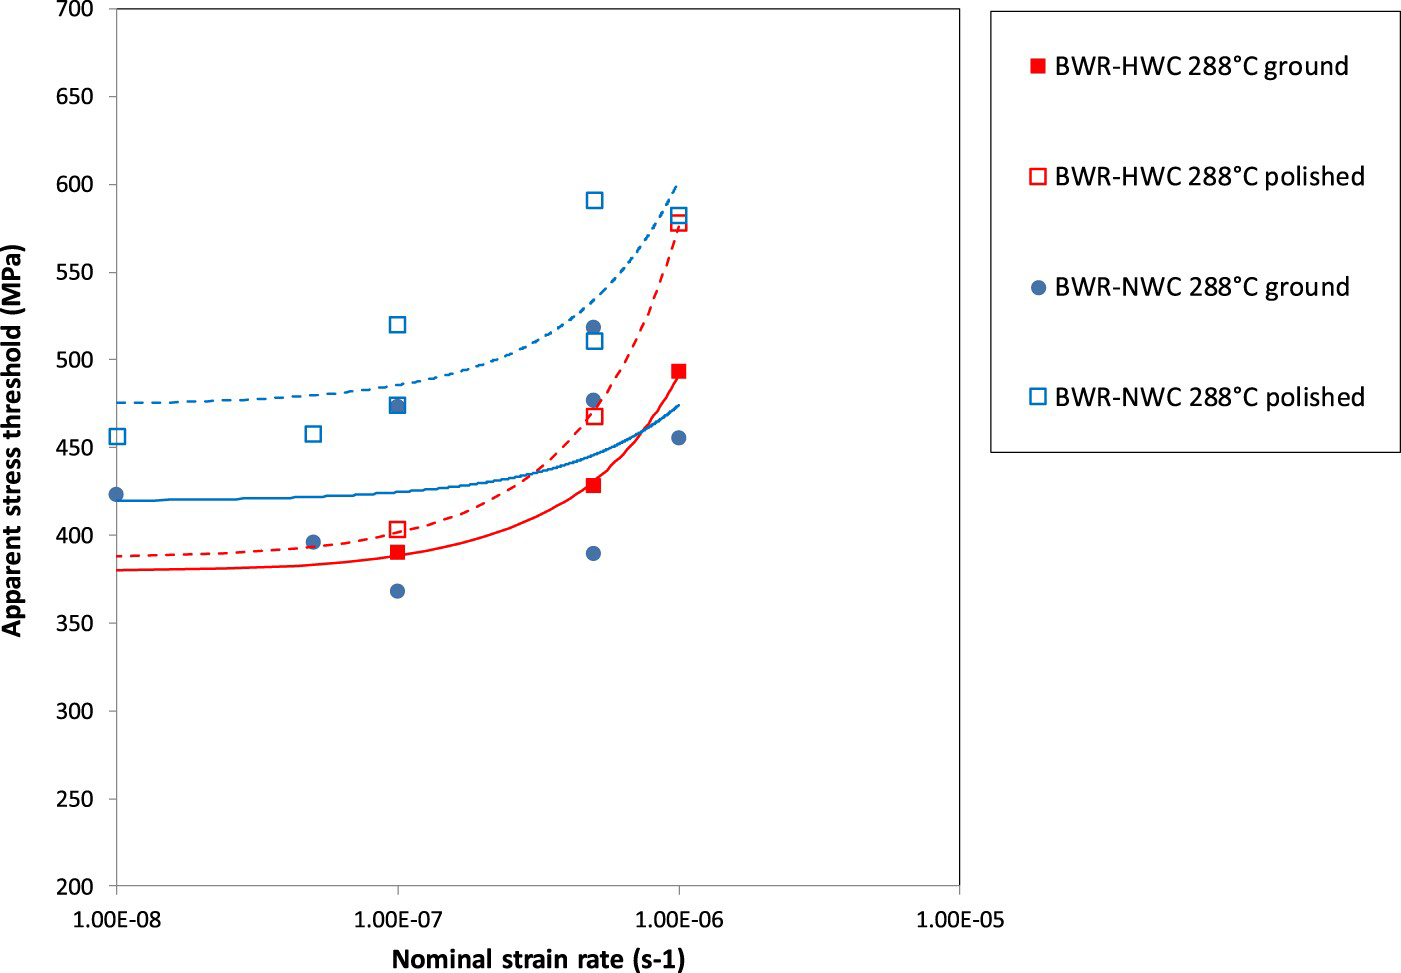
Figure 19 provides a graph containing all the data points from the tests conducted under PWR conditions. As the strain rate decreased, the stress threshold decreased, although there is considerable scatter in the data. The scatter complicates the determination of a threshold stress that can serve as an extrapolation to ‘constant load/zero strain’. Therefore, three trend curves (exponential fits) of the data sets for 288, 310 and 340°C were added to assess whether convergence to a ‘constant load/zero strain’ threshold could be obtained. These trend curves should be viewed as a simple guide, as there are insufficient data for a statistically sound result. Stress thresholds were obtained by using this extrapolation by taking the average value at strain rate 10−7 s−1 (if more than one result was available). The thresholds obtained in this manner are plotted as function of test conditions and are shown as insert in Figure 19. Despite the scatter and the limited amount of data, some conclusions may be drawn. The obtained stress thresholds decreased with increasing test temperature. The ground surface exhibited a lower stress threshold than the polished surface, although this difference diminished towards the highest temperature.
Stress thresholds as a function of nominal strain rates for Alloy 182 tapered specimens with ground and polished surfaces for PWR conditions at 288, 310 and 340°C. The insert shows the stress threshold for each conditions: squares 1·10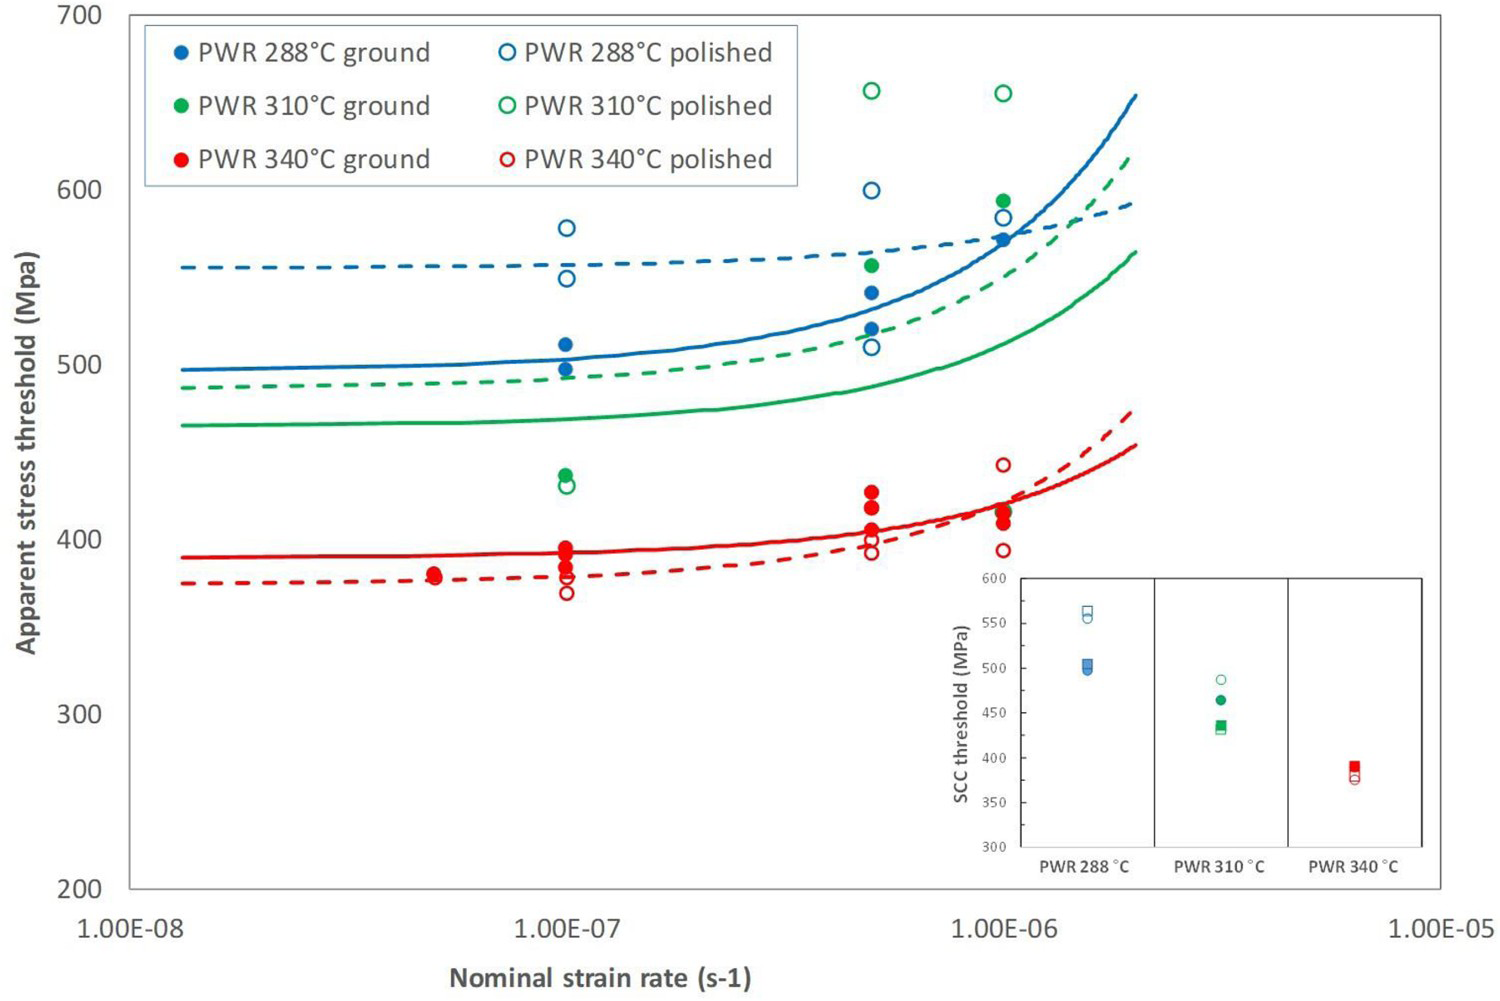
Summary of stress threshold for PWSCC initiation from the literature and from the current research work.
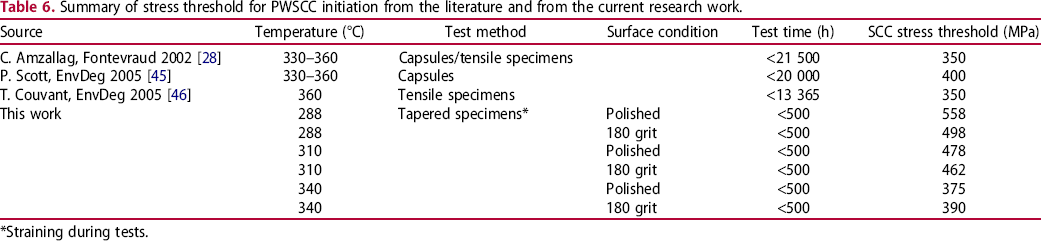
*Straining during tests.
Considering these results and the experience gained during this work, it can be concluded that CERT testing with flat tapered specimens can be regarded as a very promising accelerated test method for gaining valuable insights on the SCC initiation susceptibility of structural materials in light water reactor environments in a reasonable timeframe. However, some issues with the evaluation method as well as the scatter in the results still represent some concern. At this stage of the work it is difficult to judge what proportion of the scatter is due to the analysis method versus the natural scatter of the SCC process. Therefore, one of the major challenges is to find an objective, reproducible and universal method to determine the last crack along the tapered gauge section, which sets the critical stress initiation thresholds. Lab-to-lab variability, most probably related to the differences in individuals analysing the microstructural data, are difficult to avoid. Therefore, this methodology is part of further research currently being performed in the framework of a Horizon 2020 collaborative research project (MEACTOS, www.meactos.eu).
Summary and conclusions
An accelerated SCC initiation test method consisting of CERT testing of tapered specimens in high-temperature water was assessed by nine laboratories. Two different types of materials known to be susceptible to SCC in light water reactor environments were utilised for this purpose: a high-Si stainless steel model alloy and a Ni-base weld metal (Alloy 182). It was successfully demonstrated that a stress threshold for crack initiation could be obtained with one single test. The stress thresholds obtained for these materials were dependent on the nominal strain rate. However, with decreasing nominal strain rates, this influence diminished and an apparent constant load SCC initiation stress threshold could be determined in a reasonable timeframe. If only one test is to be performed, e.g. for a first screening of the SCC initiation susceptibility, a rather slow nominal strain rate of 1·10−7 s−1 would be recommended.
The tests using the high-Si stainless steel model alloy examined the effects of specimen type (flat versus round) and test temperature. The round tapered specimens showed lower stress thresholds than the flat tapered specimens at the lowest test temperature, but this difference disappeared at the highest temperature. The stress threshold decreased with increasing temperature under BWR conditions, but in PWR environment the effect of test temperature was small.
The tests with the Alloy 182 weld metal investigated the effects of test temperature, water chemistry and surface condition on the stress threshold in flat tapered specimens. Two surface conditions could be assessed in a single specimen. The stress thresholds obtained for Alloy 182 decreased with increasing temperature. The ground surface revealed lower stress thresholds than those for the polished surface, but this difference diminished towards the highest test temperature. The actual values of the SCC initiation stress threshold were close to the yield stress of Alloy 182 and in agreement with corresponding literature data.
It was concluded that the evaluated test method works reasonably well for the screening of the SCC initiation behaviour of structural materials under simulated light water reactor environments in a much shorter timeframe, compared to classical constant load tests. However, also potential for further improvements of the test technique was identified. A particularly critical aspect of this method is the determination of the stress thresholds by SEM SE imaging of the post-test specimen surfaces by different individuals. Although some procedural guidelines were developed to minimise the scatter in crack measurement/crack detection, it is still a subjective process. At present, it is not possible to distinguish between the inherent scatter of the SCC process and the scatter associated with the post-test analysis method. Therefore, this methodology is part of further research currently being carried out in the framework of a Horizon 2020 collaborative research project (MEACTOS, www.meactos.eu).
Footnotes
Acknowledgements
ENGIE Electrabel is gratefully acknowledged for providing the Alloy 182 test material. The research leading to these results was partly funded by the European Atomic Energy Community's (Euratom) Seventh Framework Programme FP7/2007-2013 under grant agreement No. 604965. The NUGENIA Association (currently the SNETP Association) is acknowledged for providing a framework for collaborative research under which this work was carried out.
The financial contribution from the following organisations is also acknowledged:
Slovenian Research Agency through the research programme No. P2-0273 (participated in the funding of ZAG research) Swiss Federal Nuclear Safety Inspectorate (ENSI) SAFIR 2018 programme (participated in the funding of the VTT-research) ENGIE
Disclosure statement
No potential conflict of interest was reported by the authors.