
Abstract
The aim of the study was to define the influence of microstructural properties on the electrochemical properties of copper in four different forms: copper in sheet form, copper doped with phosphorus, electroplated copper and copper wire. Open circuit potential and polarization resistance measurements were carried out in order to determine the electrochemical properties and corrosion rates of copper in 0.1 M NaCl solution in oxic conditions at ambient temperature. Statistical evaluation of the electrochemical data was performed in order to differentiate between the various forms of copper samples. Microstructural and electrochemical investigations were combined with electron microscopy and Raman analysis of the corrosion products after immersion of the copper samples in a 0.1 M NaCl solution for 30 days. The various morphologies of copper corrosion products were identified and analyzed by Raman spectroscopy for the various forms of copper.
Introduction
The electrochemical behaviour of copper in aerated chloride solutions is well documented [1–5]. Corrosion properties vary according to pH and the chloride ion concentration. In a neutral aerated chloride solution it is believed that the cathodic reaction for copper is the reduction of oxygen, according to the following reaction:

Electrochemical investigation showed that, at higher concentrations of chloride and/or higher anodic potentials, CuCl dissolves through the formation of CuCl2, which is stable, soluble and stops the protective behaviour of the copper. The dissolution of CuCl2 − is mass controlled [3,4]. The copper chloride complex may either dissolve away, or it can oxidise to form Cu2+, as was confirmed at higher anodic potentials [3,5]. Similar behaviour has been reported in high copper alloys such as copper–zinc and copper-nickel, with studies confirming a similarity to the behaviour of pure copper [6,7].
Recent studies of copper have been connected to the use of copper for canisters, backfilled with compacted bentonite clay, used to place spent nuclear fuel in geologic repositories. These are currently in place in both, the Scandinavian and Canadian high-level radioactive waste disposal programs, with the lifetime of the Cu container designed to be above 106 years [8,9]. A container made of Cu provides an absolute barrier to the release of radionuclides, so its corrosion has been studied extensively [10–16]. A number of environmental parameters can affect the corrosion behaviour of the copper container here, namely the solution chemistry (the presence of chlorides, sulphates, and bicarbonates), temperature and heat transfer, saturation of the surrounding bentonite, and the rate of consumption of the trapped oxygen. Following the consumption of oxygen, a supply of dissolved SH– to the copper surface will be detrimental [8]. Consequently, the corrosion of Cu in sulphide systems under anoxic conditions has been studied extensively [12–16]. Lately, many studies have been devoted to understanding the effect of different anion concentrations on the adsorption of HS– to copper under anoxic conditions [14,15]. It was shown that, in anoxic conditions, passivity is very much dependent on the solution chemistry and temperature [16]. It was, however, shown, that even small amounts of sulphide influenced the corrosion of copper during the early oxic repository period [17].
The effects of long-term exposure of copper to various environments can be evaluated using multiple non-destructive corrosion monitoring techniques. One possible technique for monitoring corrosion is the use of an electrical resistance (ER) probe [18–20]. Electrochemical impedance spectroscopy (EIS) measurements have also been performed during long-term exposure of copper to bentonite, with ER probes serving as working electrodes for the EIS [21]. Another possible method is measuring the spatio-temporal distribution of currents using coupled multi-electrode array (CMEA) sensors [22,23]. Copper CMEAs have been used in studies investigating copper pitting in drinking water, and for the long-term monitoring of copper exposed to bentonite in an oxic environment [24,23].
Copper can be delivered in many forms e.g. wires, sheets, or rods, with each of these copper products having undergone different manufacturing processes. When producing ER sensors from electroplated copper, and CMEA sensors from copper wires, it is important to be aware that the manufacturing history of a given material can affect its microstructural properties, which may subsequently impact both the mechanical and electrochemical properties of the final product. The main aim of this paper is therefore to study the effect of the microstructure on corrosion properties in different forms of copper.
It has been reported that, in a 0.1 M NaOH solution, the passive film of Cu(I) oxide is thicker at grain boundaries than on the grains, and that no metal is preferentially consumed by transient dissolution at the grain boundaries [25,26]. Martinez-Lombardia et al. investigated grain-dependent corrosion on microcrystalline copper in a 10 mM HCl aqueous solution and reported the dependence of grain orientation on corrosion [27]. No other relevant reports were found regarding the effect of microstructure on the corrosion behaviour of copper.
The aim of this study is to investigate the properties of four different forms of high-purity copper. The microstructural properties were studied and their effects on electrochemical properties were investigated in an aerated 0.1 M NaCl solution. The corrosion products that developed on different copper electrodes following immersion in an 0.1 M NaCl aqueous solution for 30 days were examined by EDS and Raman spectroscopy.
Materials and methods
Samples of copper in four different forms were supplied by various manufacturers:
a disc (θ = 15 mm) cut from 2-mm thick Cu-sheet (oxygen-free, high thermal conductivity of 99.95%, cold rolled and soft annealed) (Cu-sheet); Goodfellow, Huntingdon, England, UK. Phosphorous doped (62 ppm), 99.99% oxygen-free copper discs of 6 mm diameter and 4 mm height (Cu-OF); Swedish Nuclear Fuel and Waste Management Co. (SKB), Stockholm, Sweden. Electroplated copper (99.95%, 25 µm thick) on glass-fibre circuit board substrate (Cu-EP), cut into a disc of 15 mm diameter. Copper wires from phosphorus-deoxidised copper (99.90%, 1.4 mm diameter wires, cold drawn and soft annealed at 200 °C).
Electroplated copper (Cu-EP) was used to fabricate copper ER sensors for monitoring corrosion. The use of such copper sensors for the long-term monitoring of corrosion has been reported in our previous studies [19,17,28].
Copper wires (Cu-wire) were used to fabricate a CMEA consisting of 25 wire electrodes assembled into a 5 × 5 matrix in epoxy resin. The exact structure of the array, as well as the electrical configuration for the measurements, has been described in our previous work [22]. The use of copper CMEA sensors was demonstrated in our study monitoring the corrosion of copper in bentonite slurry over an extended period of time [23].
The samples (i.e. working electrodes) for electrochemical tests in this study were cut from sheet in the form of discs with a diameter of 15 mm (Figure 1(a,c)). In order to remove the oxide film, the samples were ground with 800-2400 grit SiC paper, with the exception of the electroplated copper on printed circuit board, which was used in the state supplied. The samples were ultrasonically cleaned in 96% ethanol for 3 min and then air-dried. For the metallographic investigation, the samples were polished with 1 μm Al2O3 paste and etched with 50 mL distilled water, 50 mL ethanol and 2.5 mg of ferric nitrate. All samples were cleaned in non-denatured 96% ethanol. A Carl Zeiss Axio optical microscope was used to examine the specimens.
Copper samples: (a) discs cut from 2 mm Cu-sheet, (b) Cu-OF copper, (c) Cu-EP and (d) a 5 × 5 1.4 mm Cu-wire CMEA.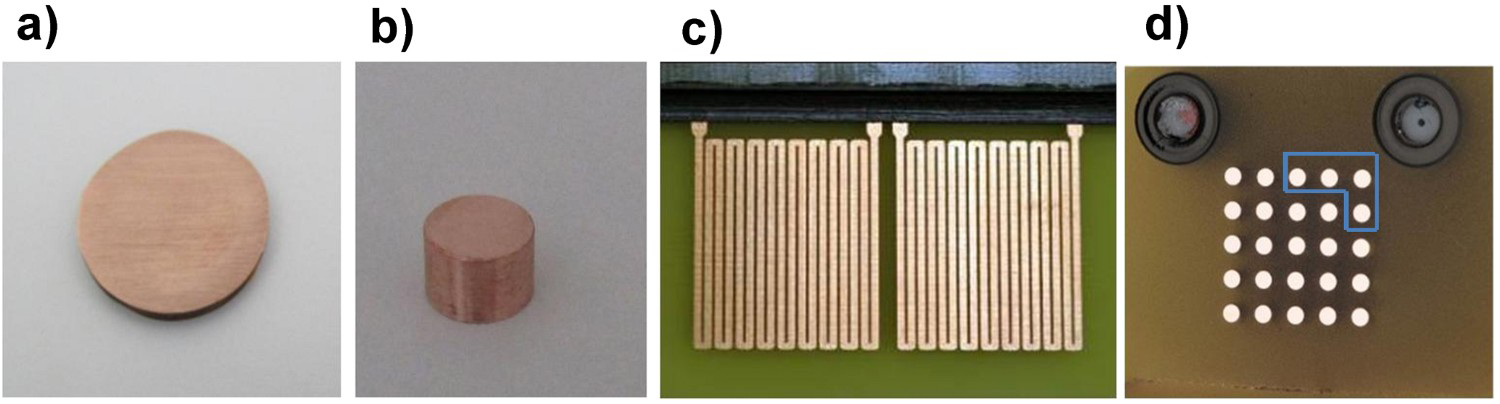
In the case of the Cu-sheet and Cu-EP, a three-electrode corrosion cell with a volume of 350 cm3 was used for electrochemical measurements, with the electrodes embedded in a Teflon holder. The corrosion medium was a 0.1 M NaCl solution with pH 5.9. The grade of chemicals used was p.a. The tests were conducted at room temperature in oxic conditions. In the case of the Cu-wire electrodes in a copper CMEA sensor, four wires were connected into one working electrode, exposing an area of 0.0616 cm2 (marked with a blue line, as shown in Figure 1(d)). The reference electrode was an Ag/AgCl with 3 M KCl, and the counter electrode a graphite rod (with an exposed area of around 15 cm2). A Gamry Ref 600+ expanded with Gamry framework software was used for data collection. Electrochemical testing was conducted after 1-hour stabilisation at open circuit potential (OCP), followed by linear polarisation measurements at ±20 mV vs. OCP at a scan rate of 0.1 mV s−1. All potentials are reported with respect to the Ag/AgCl scale (0.210 V vs. E NHE), and all values are normalised (Figure 2).
Electrochemical testing of 4 of the 25 Cu-wires in a copper multi-electrode array (CMEA) in 0.1 M NaCl solution.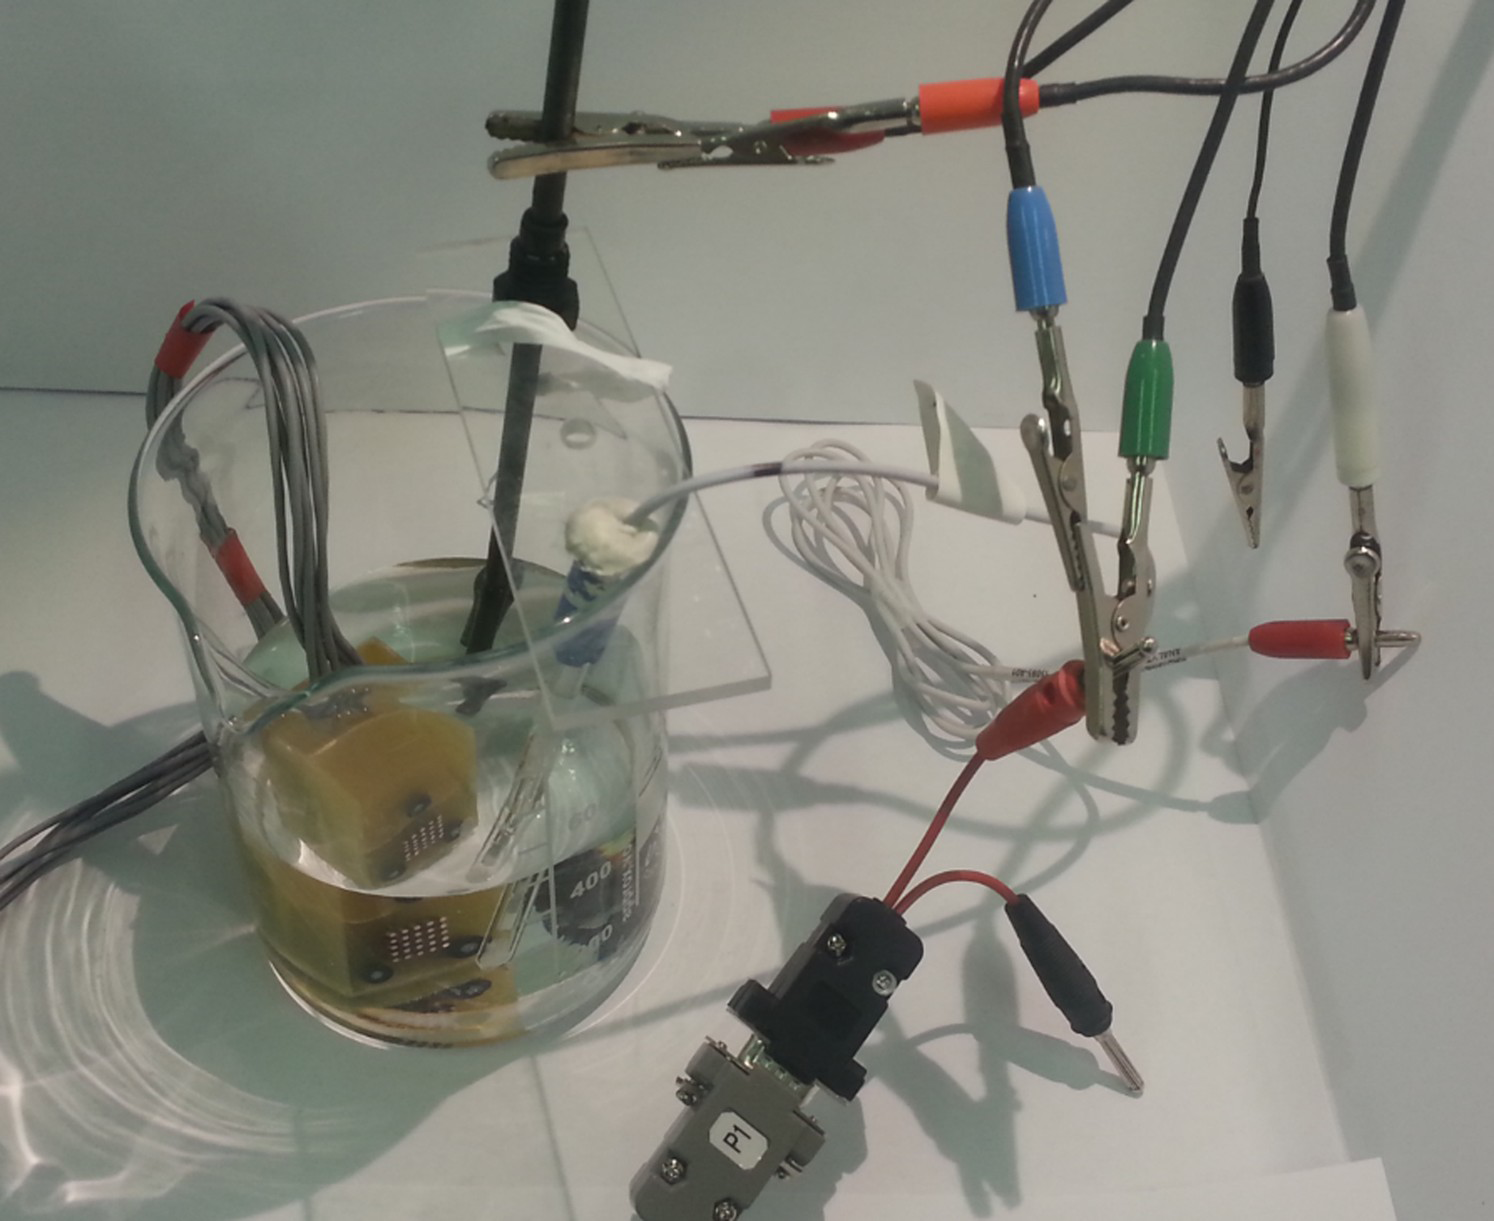
The samples of copper in Cu-sheet, Cu-OF and Cu-EP form were also immersed in a 0.1 M NaCl aqueous solution for 30 days with the intention to study the corrosion products developed after exposure to a corrosive environment. Following immersion, the samples were cleaned with 96% ethanol and then inspected to determine the shape and size of the surface corrosion products. This was done via Field Emission Scanning Electron Microscopy (FE-SEM, Zeiss ULTRA plus, Germany) operated at an accelerating voltage of 20 kV. Raman spectroscopy was applied to identify corrosion products on the copper. The Raman spectra were recorded by means of a Horiba Yvon HR800 spectrometer. The samples were irradiated with a green laser (λ = 514 nm) at a power of 14 mW. For 50× long distance objective, spot size of a laser was 1,25 μm. Multiple spectra were measured, while only the representative spectra are presented. The scanning range was 50-4000 cm–1, or 50-1000 cm–1 when only cuprite was expected.
Results and discussion
Microstructural analysis
The microstructures of the various copper samples were examined and the images are presented in Figure 3. The specific cross sections observed were those which would later be exposed to a corrosive medium during experimental work and/or operation of the sensors.
Microstructures of the different forms of copper: (a) Cu-sheet (b) Cu-OF (c) Cu-EP in transversal direction and cross-section and (d) Cu-wire.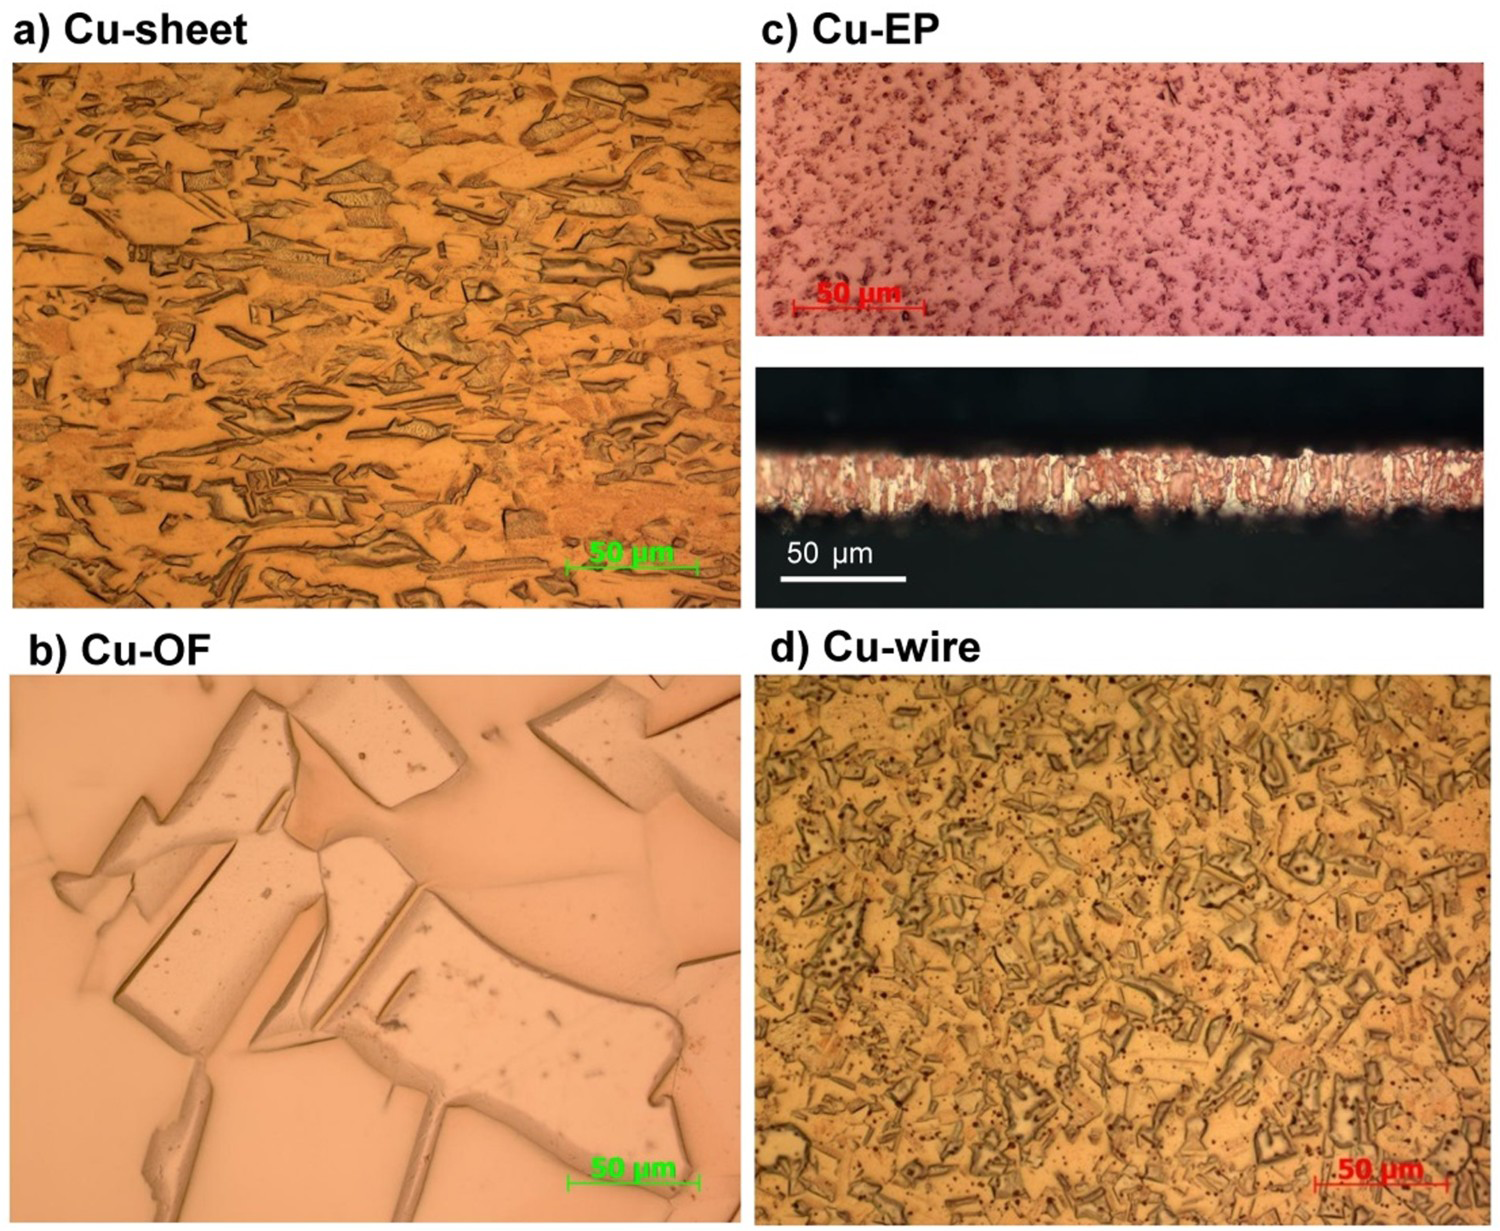
The 2 mm copper sheet (Cu-sheet) was cold rolled and soft annealed; consequently its α-phase copper crystal grains are very large, ranging between 60 and 80 µm, and are oriented and elongated in the rolling direction (Figure 3(a)). Alpha phase copper is predicted to be present on the basis of the chemical composition of the copper samples, which all contain at least 99.90 mass.% of copper [29]. The rolling direction was predicted from the shape and orientation of the crystal grains in the sample's microstructure, since the crystal grains of a metallic alloy become elongated in the direction of rolling (the direction of observation). Inclusions of P2O5 were detected in the microstructure of the Cu-sheet, both within the crystal grains and at the crystal grain boundaries.
The crystal grains of the oxygen-free copper (Cu-OF) are very large and the grain boundaries are the most distinguishable. The size of α-phase copper crystal grains varies between 50 and 150 µm. Owing to processing procedures the grains are uniformly oriented in all directions (Figure 3(b)). There are no visible inclusions of either Cu2O or P2O5 in the microstructure, as respectively observed under polarised light or in the dark field (images not shown); the small dots that can be seen are impurities arising from the metallographic preparation of the sample.
The electroplated copper (Cu-EP) consists of uniformly oriented α-phase copper crystal grains ranging in size from 5 to 15 µm (Figure 3(c)). The microstructure does not contain phosphorus to deoxidise the metal nor cupric oxide (Cu2O) inclusions. The crystal grains of the sample are elongated and oriented in the direction of the electroplating deposition, as observed by inspection of cross-section of the Cu-EP sample (Figure 3(c)).
The copper wire for electrode arrays (Cu-wire) has fine α-phase crystal grains, ranging in size from 10 to 20 µm (Figure 3(d)). Phosphorus oxide (P2O5) inclusions are present in the microstructure, as confirmed by light-coloured dots observed in the dark field (not shown). The crystal grains are most likely elongated in the drawing direction of the wire, but the longitudinal cross-section of the wire was not observed.
There were no visible inclusions in the microstructure of α-phase copper crystal grains in the Cu-OF samples, whereas cupric oxide (Cu2O) inclusions were observed in the α-phase copper crystal grains of the Cu-EP. Phosphorus oxide (P2O5) inclusions were observed in the α-phase copper crystal grains of the Cu-sheet and are present in an even greater abundance in the Cu-wire.
Electrochemical measurements
Open circuit potential
OCP of the different copper electrodes was measured six times in a 0.1 M NaCl aqueous solution. Between the replicate measurements, the copper surface was freshly ground and immersed in a fresh solution. In the case of Cu-EP, a new sample was used for each measurement. All OCP measurements are presented in Figure 4, and the results are summarised in Table 1.
Replicate measurements of OCP on (a) Cu-sheet, (b) Cu-OF, (c) Cu-EP and (d) Cu-wire in 0.1 M NaCl Electrochemical potential read at the end of the OCP measurement for each type of Cu material.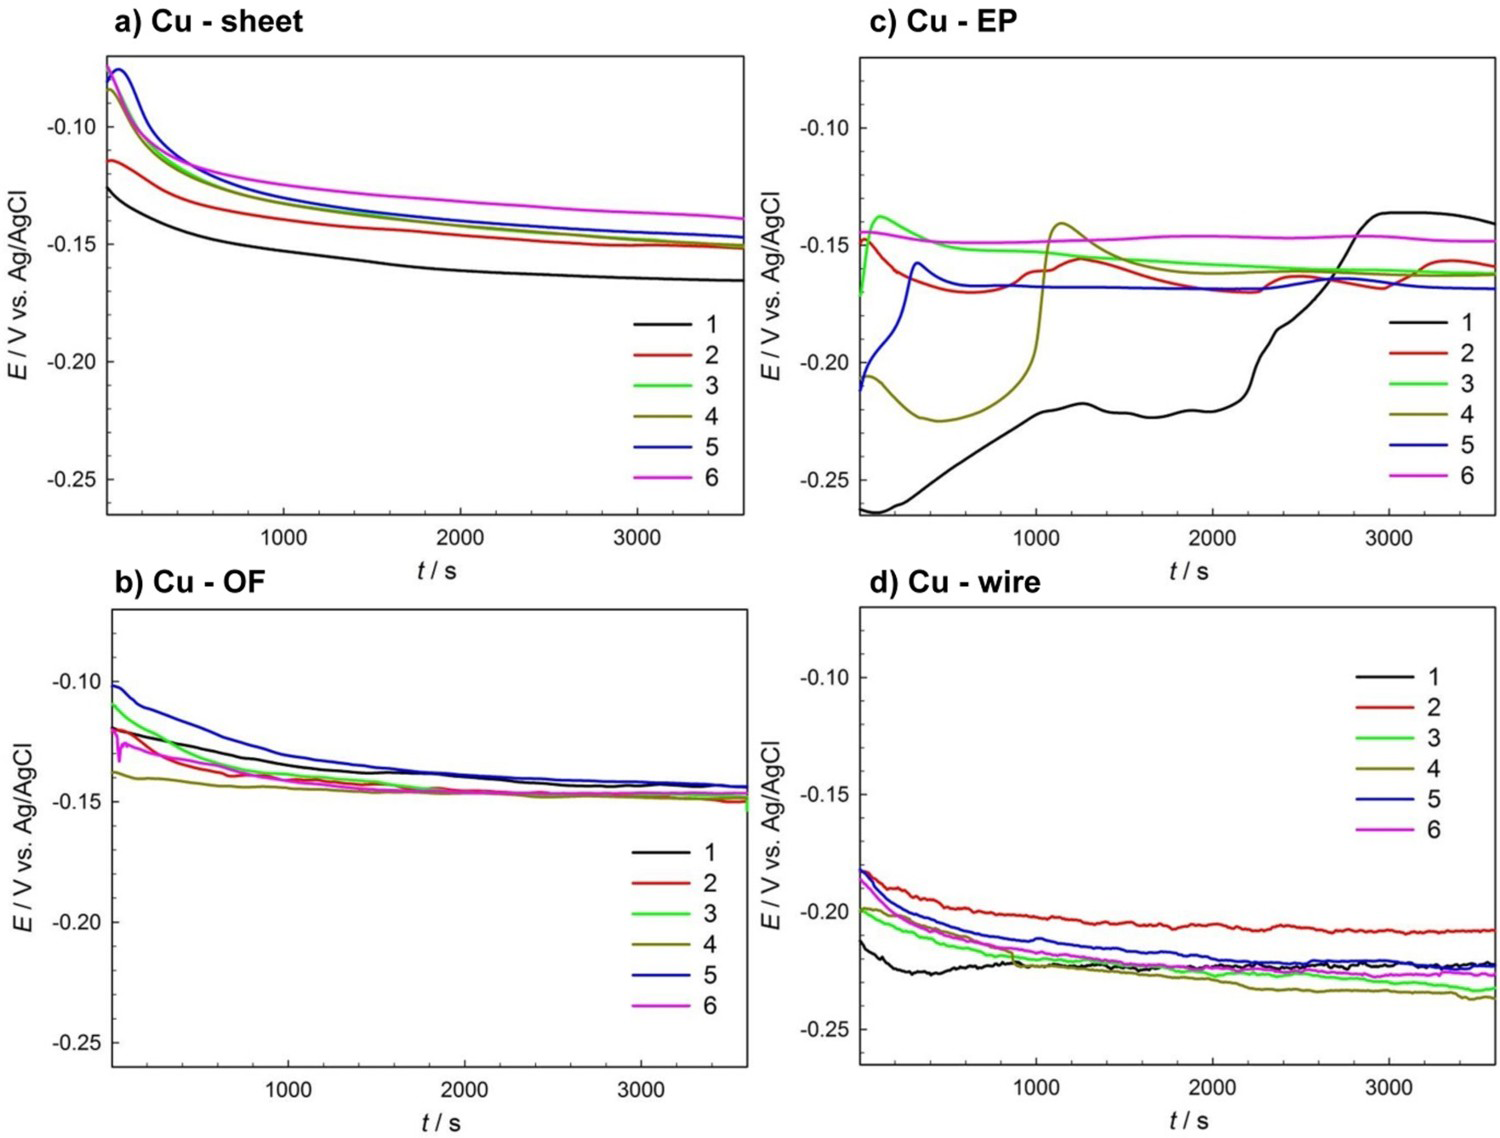
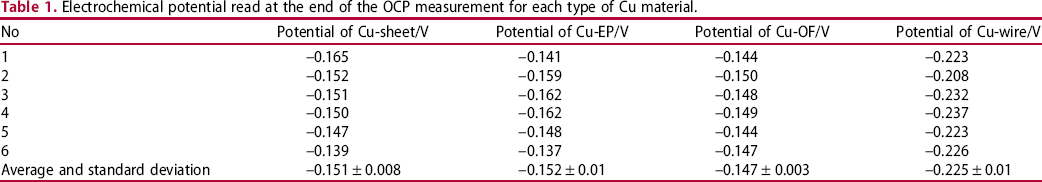
In the case of the copper sheet and Cu-OF, the potential at first decreased slightly when exposed to the solution (Figure 4(a,c), Table 1), but in general, it did not vary much with time or between replicate measurements (showing a standard deviation of only 0.005 V). The E OCP at 3600 s was –0.151 for the Cu-sheet and –0.147 V for Cu-OF (Table 1).
The initial OCP value of Cu-EP (Figure 4(c)) was more negative by about 50-100 mV upon exposure of the electrode to the solution, then stabilised to a constant value (at 1500 s). The OCP of the Cu-EP sample was –0.152 V, similar to that of the Cu-sheet sample (Table 1).
The OCP measurement of the Cu-wire (Figure 4(d)) was the lowest among all of the measured potentials (–0.225 V at 3600 s).
Variation between replicate measurements of OCP values was greatest in the Cu-EP and Cu-wire.
Linear polarisation measurements
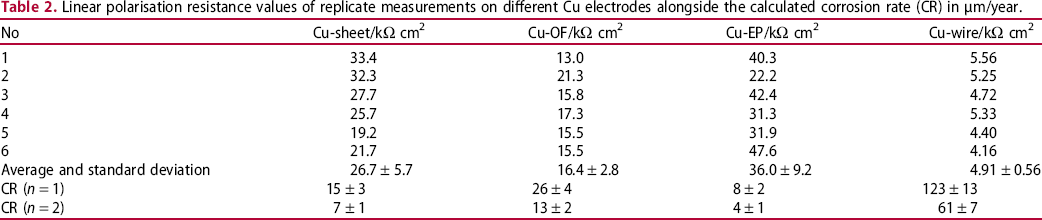
Each form of copper material was measured six times using the linear polarisation corrosion measurement, using a slow scan rate of 0.1 mV s−1 to ensure that the real kinetics of the reaction were detected and that the working electrode double layer could adjust to any potential change [30,31]. Linear polarisation measurements for the various copper samples are presented in Figure 5. Rp values represent the slope of the tangent to the curves where the current is 0. The values of polarisation resistance, Rp, in Ω cm2 are presented in Table 2. The corrosion rate values for one and two electrode processes (n = 1 and n = 2, respectively) are further given in Table 2. The c be discussed later in the text.
Replicate measurements of linear polarisation on (a) Cu-sheet, (b) Cu-OF, (c) Cu-EP and (d) Cu-wire in 0.1 M NaCl. Linear polarisation resistance values of replicate measurements on different Cu electrodes alongside the calculated corrosion rate (CR) in µm/year.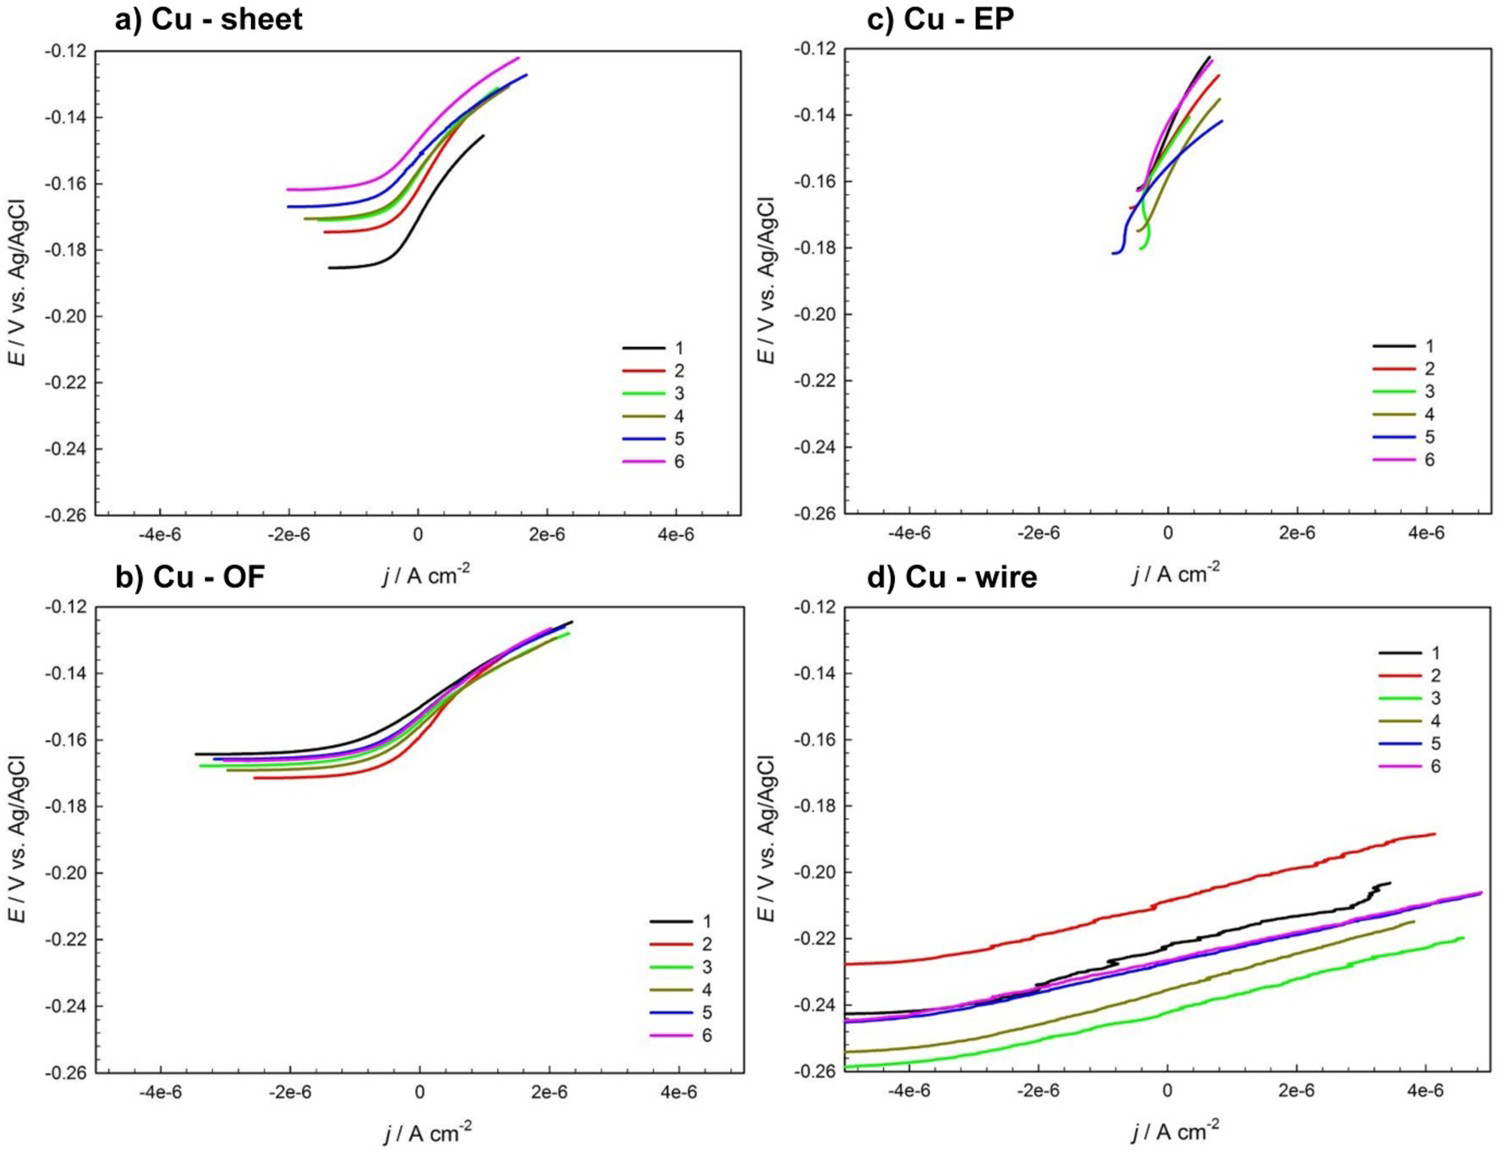
Polarisation resistance values, Rp, are highest in Cu-sheet and electroplated copper (Cu-EP), with respective values of 26.7 and 36.0 kΩ cm2 at similar average values of E OCP.
Rp values for the phosphorus-doped copper, Cu-OF, are lower, at 16.4 kΩ cm2.
The average Rp value for the Cu-wire (4.91 kΩ cm2) is lowest of all copper samples with more negative potentials than other copper samples, as can be observed in Figure 5.
Scatter diagrams for each copper sample, showing the variation in polarisation resistance across repetitive measurements, can be seen in Figure 6. In these diagrams, corrosion data are log-normally distributed [31]. Rp values were therefore transformed to log format [32]. It can be seen that the highest variation between measurements is observed in the Cu-EP samples. Although these exhibited the highest Rp values, this variation could also be owing to the different surface state of the Cu-EP samples, which were prepared by only ultrasonic cleaning, without grinding. A different Cu-EP working electrode was used each time, in as-received state, with the presence of cuprite on the surface, as is the case when using Cu-EP plates for the fabrication of ER sensors, as described in the Materials and Methods section. In addition to the impact of grain size, defects are present in this material, which may also have an effect on the variation between electrochemical results. It is also evident that the lowest Rp values are observed in the Cu-wire. This could be attributed to the more complex microstructure, which contains the highest percentage of impurities among all the copper samples investigated, as well as the inclusions of phosphorus oxide and the very small size of the crystal grains (Figure 3(d)).
Scatter diagram showing the logarithm of the polarisation resistance measured.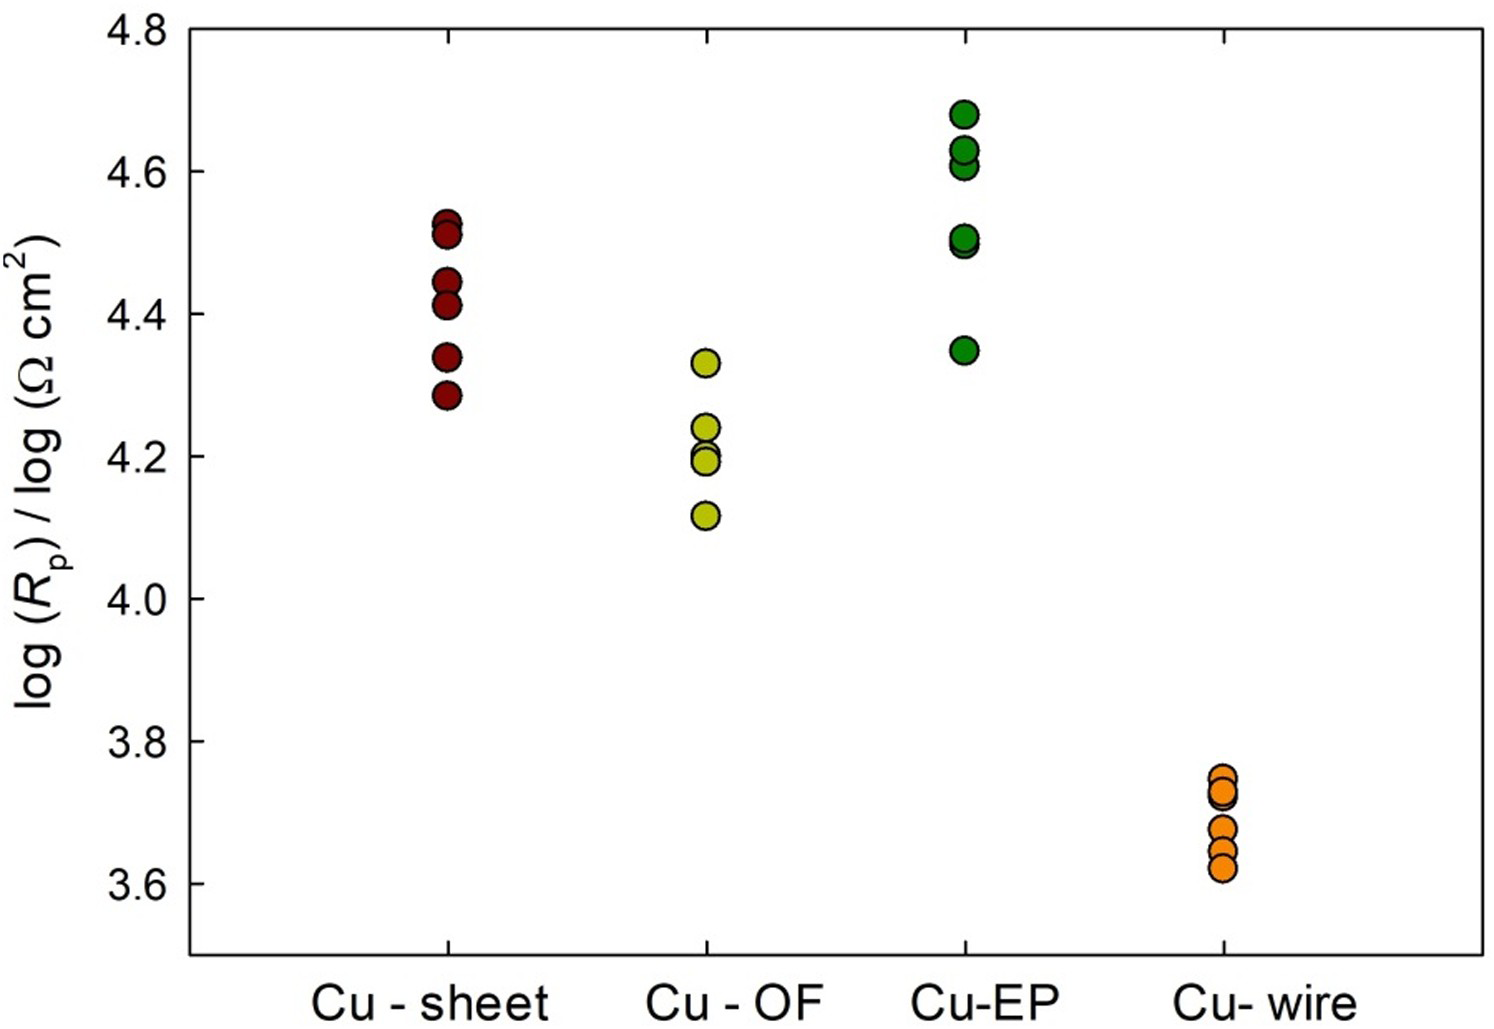
Results of the Mann Whitney test comparing the polarization resistance of the various forms of copper.
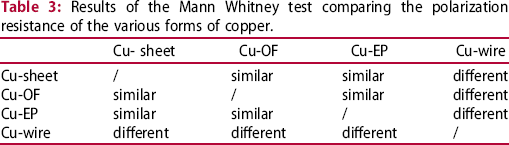
The Mann–Whitney test showed that the Rp values of the Cu-wire sample (Cu-wire) are lower than all of the other copper samples tested (Cu-sheet, Cu-OF and Cu-EP). Consequently, its corrosion rate, which is inversely proportional to the Rp value, is the highest of all the copper samples tested.
The corrosion rate, CR, in μm/year was then calculated using Faradaýs law [30], as follows:

j corr was calculated from the Rp values (Table 2):
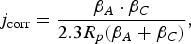
It can be seen from Table 2 that lower Rp values resulted in higher corrosion rates. Values for corrosion rates are given in the case that cuprite formed (n = 1) and when Cu2+ products formed (n = 2).
Taking into account that cuprous oxide was the predominant anodic reaction with n = 1, as indicated in Table 2, the corrosion rate measured in Cu-sheet, was at 15 ± 3 μm/year. The highest corrosion rate was measured in Cu-wires, at 123 ± 13 μm/year. The value for Cu-OF, which is copper free from impurities and detected inclusions in the form of Cu2O, is 26 ± 4 μm/year.
The corrosion rate for Cu-EP, however, is the lowest, at 8 ± 2 μm/year. As already stated, this low value can be attributed to the surface state of the electroplated electrode. This was not freshly prepared, but tested in an as-received state, meaning that Cu2O was potentially present during the testing. This was proven by SEM/EDS investigation of the Cu-EP electrode surface before electrochemical testing (not shown), which showed that the surface was, indeed, covered with Cu2O. Since the as-received state of Cu is typically used in the fabrication of ER sensors, the value obtained for comparison of the copper samples is correct. Sensors fabricated using electroplated printed circuit board (sample Cu-EP) would give a corrosion rate value of 8 μm/year, and when the corrosion rate needs to be estimated on the Cu-OF sample then it would be underestimated using copper ER sensors. If the sensors fabricated from Cu-wire were used to estimate corrosion rates and then compared to the Cu-OF sample, then the actual corrosion rate of Cu-OF would be lower than that measured by the Cu coupled multi-electrode sensors. The corrosion rate of Cu-OF would be 26 μm/year, which lies in between the rates for Cu-EP and Cu-wire.
This leads us to the conclusion that using copper sensors fabricated from electroplated copper measures a lower corrosion rate in a 0.1 M NaCl solution than that measured on Cu-OF copper. In the case of Cu-wire and the CMEA sensor, the corrosion rate measured on the CMEA sensor is higher than that of the Cu-OF copper.
This study shows that the microstructural properties of different forms of pure copper significantly influence its corrosion properties, even though the chemical compositions of the materials are extremely similar (minimum 99.90% copper). It is also important to be aware that this work does not address whether the differences in corrosion rate result from differences in microstructure, or from differences in impurity content. Special care should always be taken when estimating the corrosion rates of similar materials, as is shown in this study.
Analysis of surface corrosion products following long-term immersion
FE-SEM images and Raman spectra of corrosion products formed on the surfaces of the Cu-sheet, Cu-OF and Cu-EP samples after 30 days exposure to a 0.1 M NaCl aqueous solution are presented in Figure 7. Corrosion products on the Cu-wire of a CMEA sensor could not be studied owing to the large size of the sample, meaning that it could not fit into the investigation chamber. The corrosion products non-uniformly cover all the copper surfaces investigated (Figure 7(a–c)). The morphologies of the corrosion products can be seen at a smaller scale in the middle images of Figure 7(a–c). Observation of the Cu-sheet sample (Figure 7(a)) by the naked eye (photo not shown) points to the possible presence of cuprite, as the surface is mainly reddish-brown, with some patches of green. The corrosion products are in the form of cubic and octahedral structures (Figure 7(a)).
FE-SEM images and Raman analysis of corrosion products formed on Cu surfaces after 30 days exposure to the 0.1 M NaCl aqueous solution: (a) Cu-sheet (b), Cu-OF and (c) Cu-EP.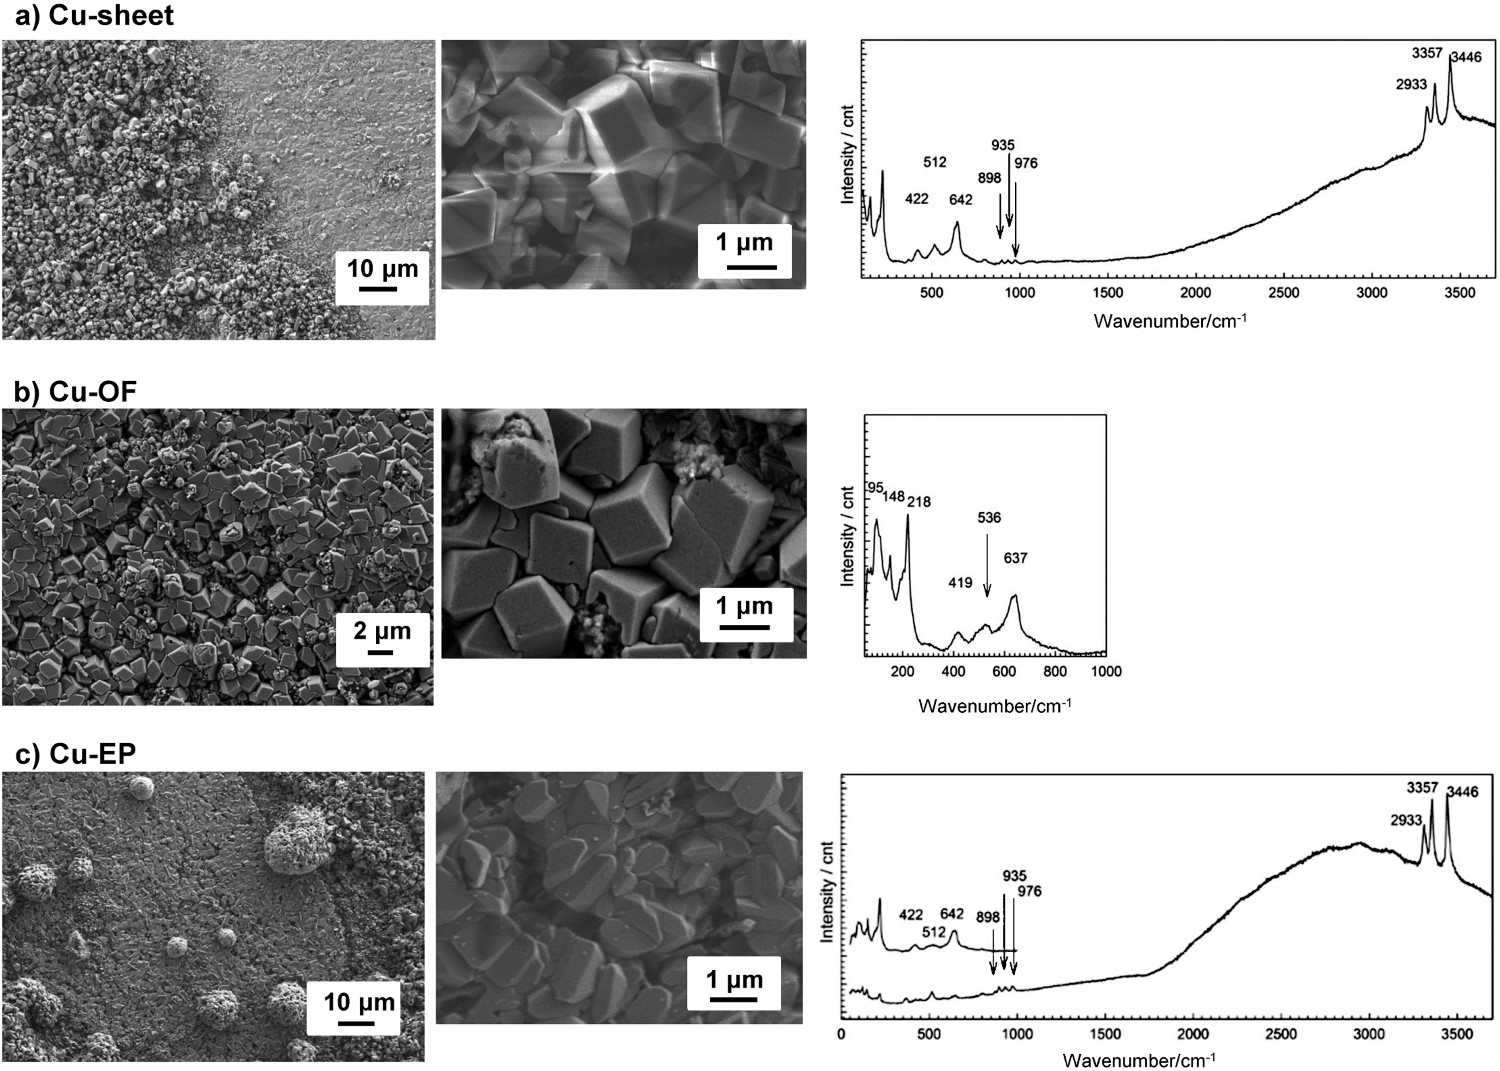
Raman spectra on the Cu-sheet (Figure 7(a)) revealed the presence of both cuprite and atacamite. Cuprite can be confirmed by the strongest bands in the spectrum, positioned at 422, 512 and 642 cm–1. Several characteristic bands in the Raman spectrum, positioned at 512, 898, 935, 976 cm–1, and the bands at 2933, 3357 and 3436 cm–1, further point to the presence of atacamite, Cu2(OH)3Cl [33–35]. The presence of tenorite, CuO, was not expected. Furthermore, paratacamite, a polymorph of atacamite, was not anticipated, since paratacamite is a phase more thermodynamically stable over 100 °C at ordinary pressures [36].
Corrosion on the Cu-OF sample (Figure 7(b)) primarily consists of cubic-structured corrosion products across the surface. The Raman spectrum for the Cu-OF (Figure 7(b)) consists of two main features: narrow low frequency bands at 144 and 216 cm–1, and three broad bands positioned at 419, 536 and 637 cm–1. The spectrum confirmed the presence of cuprite, Cu2O, as previously reported [34,35,37]. Raman bands at 898, 935, and 976 cm–1, in the range from 50 to 1000 cm–1, were absent, so it can be concluded that atacamite was not present in the Cu-OF sample.
It can be seen from the FE-SEM images that two distinctive corrosion product structures are present on the Cu-EP sample (Figure 7(c)): firstly cubic crystals, and in some areas, these are also covered by a layer of orthorhombic crystals. Both cuprite and atacamite were identified on the surface of the Cu-EP (Figure 7(c)), similar as to on the Cu-sheet. Cuprite was identified on areas with cubic crystals (the upper Raman spectra in Figure 7(c)), while atacamite was identified on areas with orthorhombic crystals (the lower Raman spectra in Figure 7(c)).
The large crystal grains (175 µm on average) of Cu-OF induced the growth of cuprite crystals, while Raman spectroscopy identified that the corrosion products on copper surfaces with smaller crystal grains (average size smaller than or equal to 75 µm), i.e. Cu-sheet and Cu-EP, comprised both cuprite and atacamite. No direct correlation can be drawn between the size of crystal grains (as observed by metallographic examination) and the type of corrosion product observed.
The size of selected individual cuprite (Cu2O) grains were measured at larger (FE-SEM) magnifications (5000-times to 10000-times) and were determined to be 0.28-1.17 µm on Cu-sheet, between 1.00 and 1.78 µm on Cu-OF, and from 1.32 to 1.48 µm on Cu-EP. No distinctive conclusion can be drawn between the size of the crystal grains, as observed by metallographic examination, and the size of the corrosion products grown at the surface of each of the copper samples.
Conclusions
Four different forms and grades of copper (99.90% or more) were studied microscopically, electrochemically (in a 0.1 M NaCl aqueous solution, oxic conditions at ambient temperature) and spectroscopically, in order to study the effect of microstructural properties on the corrosion performance of copper. The various forms and grades of copper were chosen in order to assess any differences in their corrosion rates.
It was shown that the microstructural properties of the various forms of copper differed, both in terms of the size and orientation of crystal grains in the crystal grain lattice, as well as with respect to the presence of Cu2O and P2O5 inclusions. The largest crystal grains, sized up to 150 μm, were found in the Cu-OF copper, while Cu-wire and Cu-EP had the smallest crystal grains of size 5-20 μm. Cu-wire contained the largest number of non-metallic inclusions. The microstructure affects the electrochemical properties of the different forms of copper. Namely, polarisation resistance changed in accordance with the size of the copper crystal grains. The polarisation resistance, measured on freshly ground copper upon immersion to 0.1 M NaCl after stable OCP was reached, was: for copper with larger crystal grains, sized 100-150 μm (16.4 ± 2.8 kΩ cm2) and it was higher than that of Cu-wire, with crystal grains sized 10-20 μm (4.9 ± 0.6 kΩ cm2). Statistical methodology was used in order to differentiate between the corrosion properties of the copper samples. It is essential to test samples with the same (or very similar) chemical compositions yet different microstructures in order to reliably estimate the corrosion rate of copper in different corrosion systems. In our study, the corrosion rate of Cu exposed to 0.1 M NaCl solution varied greatly, from 123 ±13 μm/year for Cu-wire, to 26 ± 4 μm/year for Cu-OF, 15 ± 3 μm/year for Cu-sheet and 8 ± 2 μm/year for Cu-wire. Spectroscopic investigations showed differences in the corrosion products after 30 days exposure to a 0.1 M NaCl aqueous solution. Cuprite was found on the Cu-OF sample, which had the largest crystal grains and minimal inclusions in the microstructure, while cuprite and atacamite were found on Cu-sheet and Cu-EP. When comparing corrosion rates estimated using different forms of high-purity copper, it is essential to study the microstructural and electrochemical properties of each form, so that the underestimation or overestimation of copper corrosion rates in a defined corrosive environment is controlled.
Footnotes
Acknowledgements
The help of Dr. Erika Švara Fabjan with FE-SEM analysis is acknowledged and greatly appreciated. The help of Viljem Kuhar with the work on metallography is acknowledged.
Disclosure statement
No potential conflict of interest was reported by the author(s).