
Abstract
Corrosion-induced degradation in marine steel structures is highly dependent on the surrounding environmental conditions and sea water compositions that varies significantly around global sea water bodies. This research investigates the corrosion behaviour of ship-grade steels exposed under different sea water compositions and environmental conditions typical of the Arabian Sea. More, environmental conditions spanning those anticipated for the shipping structures operating in the highly saline and warmest regions in the Arabian Sea have been simulated in laboratory-based experiments by using heated and aerated artificial sea water. Following their exposures, the corrosion performance of coupons has been investigated using the standard weight loss and a new dimensional metrology-based approach. Besides, the corrosion products formed on the steel surfaces have been characterised using various analytical techniques. Considerably higher corrosion losses and maximum corrosion depths were observed in the nutrient-rich polluted sea waters than those recorded in the natural sea waters, as well as in the simulated artificial sea water conditions.
Keywords
Introduction
Corrosion-induced degradation accounts for the highest failure incidents of offshore steel assets including shipping structures, despite the application of protective measures, such as corrosion-resistant paint schemes, and cathode protection measures [1,2]. The rate of corrosion in submerged steel structures is highly dependent on the severity of sea environmental conditions (e.g. water temperature, depth, flow velocity, etc.), biological activities, and chemical constituents (dissolve oxygen (DO), salinity, pH, pollutants, etc.) in the sea water [3 5]. Previously published literature reveals that the sea water temperature is one of the most significant corrosion contributing factors in the degradation of marine steel structures [6 8].
Variation in the sea water surface temperature ranges between −2°C near the poles to around 35°C near the equator [4,9]. Similarly, considerable variations in the other corrosion contributing factors (i.e., DO, salinity, pH) have also been reported with the increase in the temperature, nutrient level, and pollutant contents in the sea water [10,11] that results in high corrosion rates. Additionally, these variations increase uncertainties in determining the complex, interdependent relationships among the environmental factors, their overall effect on the rates of corrosion, prediction modelling, and the subsequent reliability-based inspection/maintenance plans [12–15].
The published research literature reveals that the corrosion rate in submerged steel structures approximately doubles for every 15-20°C rise in sea water temperature [4,9,14], therefore, comparatively higher rates of corrosion have been observed in the warmest sea waters (e.g. the Arabian Sea) [7,13,16]. The DO concentration, salinity level, pH level, water velocity, chlorides, sulphates, microbiological agents, and nutrients particularly the dissolved inorganic nitrogenous (DIN) compounds in the sea water are also considered to be influential for corrosion in the offshore steel structures [12,14,17 25].
Uniform (general) and localised (pit) corrosion are the most common forms of corrosion mechanisms that may result in strength reductions, load resistance capacity, and loss of integrity [26]. Over the years, researchers have proposed various empirical, deterministic, probabilistic, and phenomenological corrosion models to predict the rate of corrosion in the submerged steel structures. These models are predominantly based on statistical corrosion data from the field and laboratory-based corrosion experiments [5,12,27 33].
In practice, the corrosion measurement methods typically involve the mean corrosion rate calculations using a standard weight-loss method [27,28]. Although this method provides a good approximation for the uniform corrosion losses, however formulation of design criteria, life estimation, inspection, and maintenance planning becomes challenging with the average loss data. Prediction models formulated using the average corrosion loss data potentially increase the failure risks in offshore structures (e.g. ship's hull, ballast tanks), where the probability of loss of integrity/containment is more of interest than the limit states for structural strength [15]. Also, in practice, the regions of deepest corrosion depths (pits) often lead to early perforations, and containment losses in submerged ship structures, and pipelines [34,35].
In this paper, a new dimensional metrology (DM) based approach has been used to measure the corrosion-induced thickness losses on steel coupons exposed to various sea water compositions. The corrosion products accumulated on the corrosion test coupons under different sea water conditions have been characterized using scanned electron microscopy (SEM), energy-dispersive spectroscopy (EDS), and X-ray diffraction (XRD). The effect of various physical factors, sea water constituents including the nutrients, biological and pollutant species on the overall corrosion process, identification of elements/compounds in the corrosion deposits, and their morphologies have been investigated in detail.
Experiment and methods
Material selection and experimental conditions
Elemental compositions (wt-%) of (a) steel coupons used for laboratory corrosion test and (b) steel coupons used for field corrosion test.
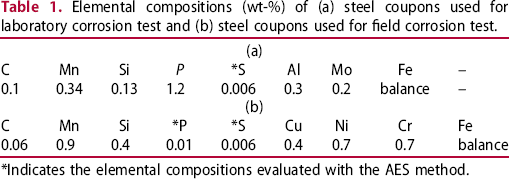
*Indicates the elemental compositions evaluated with the AES method.
For field experiments, steel coupons were cut from the large plates into a size of 100 mm × 90 mm × 3.5 mm each. The coupon surfaces were abraded with the sandpaper of various sizes (300-400 UK grit size) for removal of mill scales to a possible extent, followed by degreasing and washing with white spirit, acetone, and deionised water. The coupons used for the laboratory corrosion test were cut into a dimension of 100 mm × 50 mm × 3.5 mm, followed by surface grinding/machining (600 UK grit size wheel) and post-immersion surface cleaning, mentioned previously. Coupons were placed vertically in a submerged position with the help of a non-metallic (nylon) cords. Post corrosion coupons were cleaned mechanically (softwood wedges), and chemically in a heated (80°C) solution of NaOH and zinc, as per the ASTM standard G1-03 [36], followed by ultrasonic washing.
The sea water quality during the laboratory-based corrosion tests was maintained and continuously monitored using a multi-meter (HANNA-9128). Temperature controller, water circulation, filtration, and level (sea water) control mechanisms were installed in a non-metallic corrosion tank (1.8 m3 capacity). Figure 1 shows the arrangement for the laboratory corrosion test.
Corrosion test equipment used for the laboratory-based experiments. Here, (a) corrosion tank along with the suspended steel coupons (b) HANNA-9128 Multi-meter (c) ultrasonic washing equipment.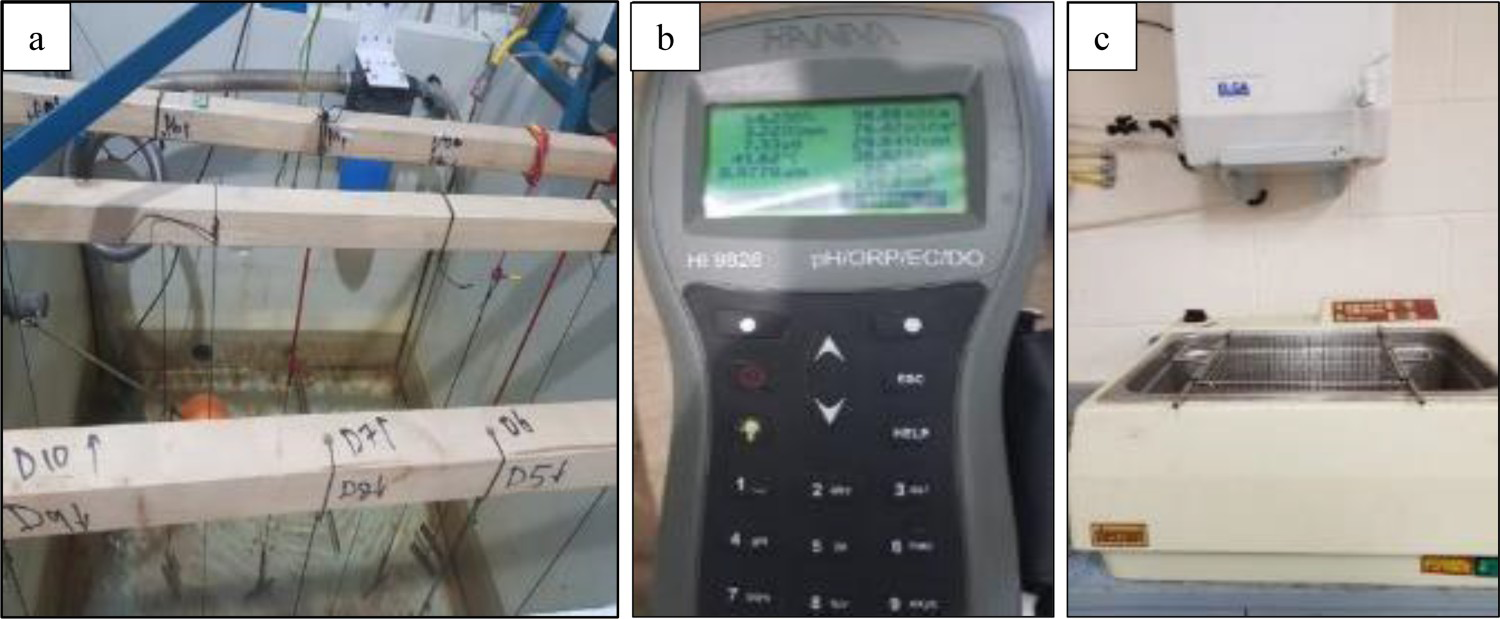
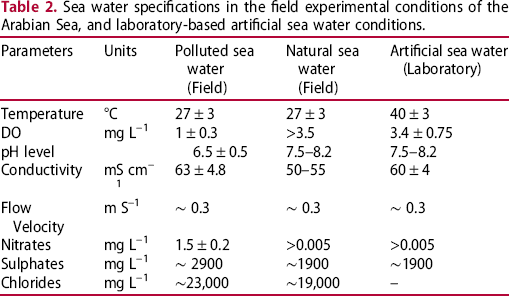
Sea water specifications in the field experimental conditions of the Arabian Sea, and laboratory-based artificial sea water conditions.
Methods of thickness loss measurement
Dimensional metrology (DM) approach
In the DM approach, accurate measurements of the dimensions of test coupons prior, and post-exposure to the corrosive environment were taken. A contact metrology technique was used (with a digital micrometer, and a vernier gauge) to measure the plate dimensions and thickness at various positions. After completion of the exposure period again the measurements of plate thickness were taken at the predetermined positions, as shown in Figure 2.
Schematic of the DM pattern developed for measuring thickness losses across the coupons. The shaded dots indicate the positions of plate thickness measurements.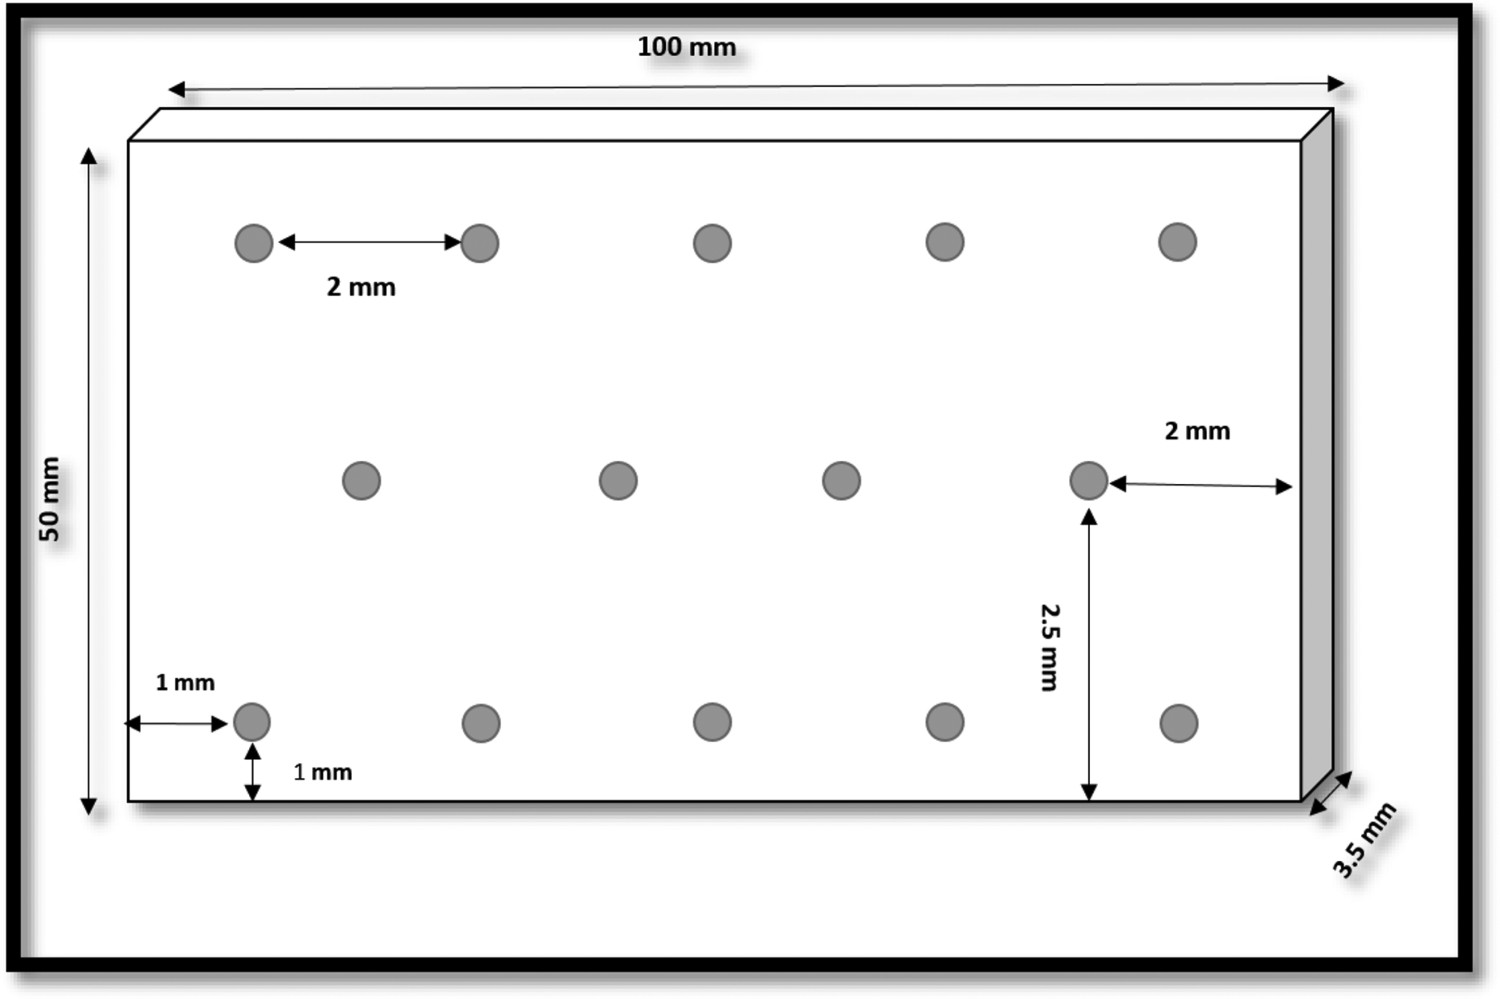
After collection of the samples from sea water, the known positions and their nearest vicinities were re-measured for the thickness losses. With the DM approach, various features of the thickness loss data including mean, minima/maxima, standard deviation and cumulative distribution of corrosion depths have been calculated and analysed, as a function of the duration of exposure.
Standard weight-loss approach
The standard weight-loss method [37,38] is also used to calculate the average corrosion rates. Equation (1) refers to the standard weight-loss method based on total mass loss.
Analytical tools
During this research, the SEM, EDS, and XRD techniques were used for the characterisation of corrosion products. Salient of this analytical investigation include:
Identification of the corrosion morphologies (e.g., iron oxides) using SEM Elemental composition (wt-%) of steel alloys and the corrosion product using EDS Identifying chemical compounds in the corrosion products (particularly iron oxides) using XRD
The TESCAN VEGA3 was used for SEM and EDS analysis, which has a thermionic emission source (tungsten filament) that combines the SEM imaging and live elemental composition analysis, using TESCAN's Essence software. Before the SEM/EDS examination, the corrosion products were applied with an ultra-thin coating of electrically conducting metal (e.g. gold) before placing them in the SEM chamber. The SEM imaging was carried out under full vacuum conditions using both SE and BSE mode, whereas low vacuum mode for used for the EDS analysis.
For XRD analysis, the Siemens X-ray diffractometer (D5005) with a copper X-ray source was used which is available with the XRD commander (version 2.4.1) software for controlling the system. The generator settings were set at 40 kV and 30 mA, and data collected over a 2θ range of 10°–90°. The duration of each run was about 1 hour.
Results
Post-corrosion macrographs
Figure 3 illustrates corroded and chemically cleaned steel coupons exposed in the laboratory-based artificial sea water conditions. Here, the anodic corrosion deposits were mainly comprised of bright reddish rust layers during the early exposure days which gradually transformed to a brownish and blackish colours with the increase in the exposure period. The cathodic regions were mostly covered with yellowish, greyish protective layers that resisted the corrosion loss since the early exposure days.
Macrographs of the corroded steel coupons along with chemically cleaned coupons recovered from artificial sea water at ∼40°C.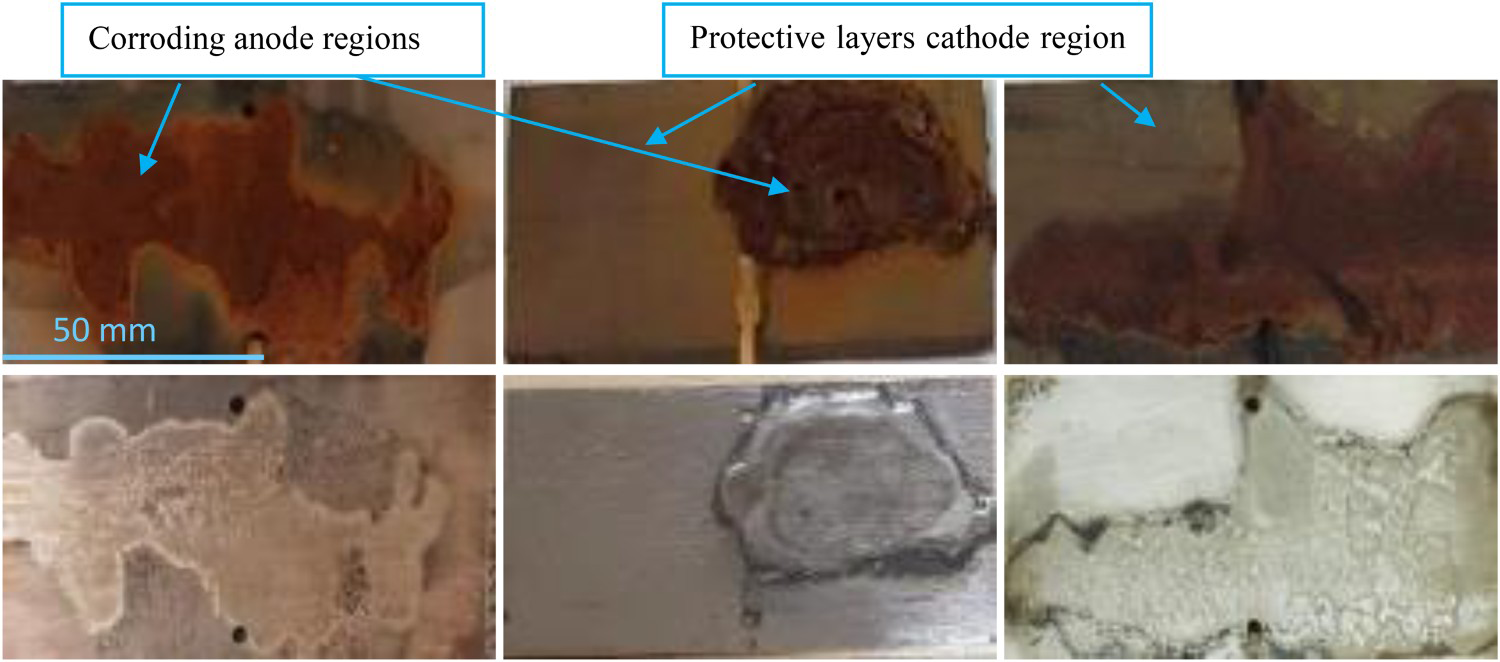
Figure 4 illustrates corroded and chemically cleaned steel coupons exposed to the field conditions of the Arabian Sea. In the polluted sea waters of the Arabian Sea, post corrosion coupons were deposited with a blackish surface layer probably reflecting the presence of excessive pollutant content. Contrarily, the natural sea water immersed coupons were observed with the maximum surface depositions, predominantly marine biofouling, and algal growth. During the field experiments, the thickness loss patterns observed on the steel coupons were more like the uniform corrosion.
Macrographs of the corroded and chemically cleaned steel coupons recovered from field sea water conditions of the Arabian Sea. Here, (a-d) coupons from polluted sea waters (e-f) coupons from natural sea water.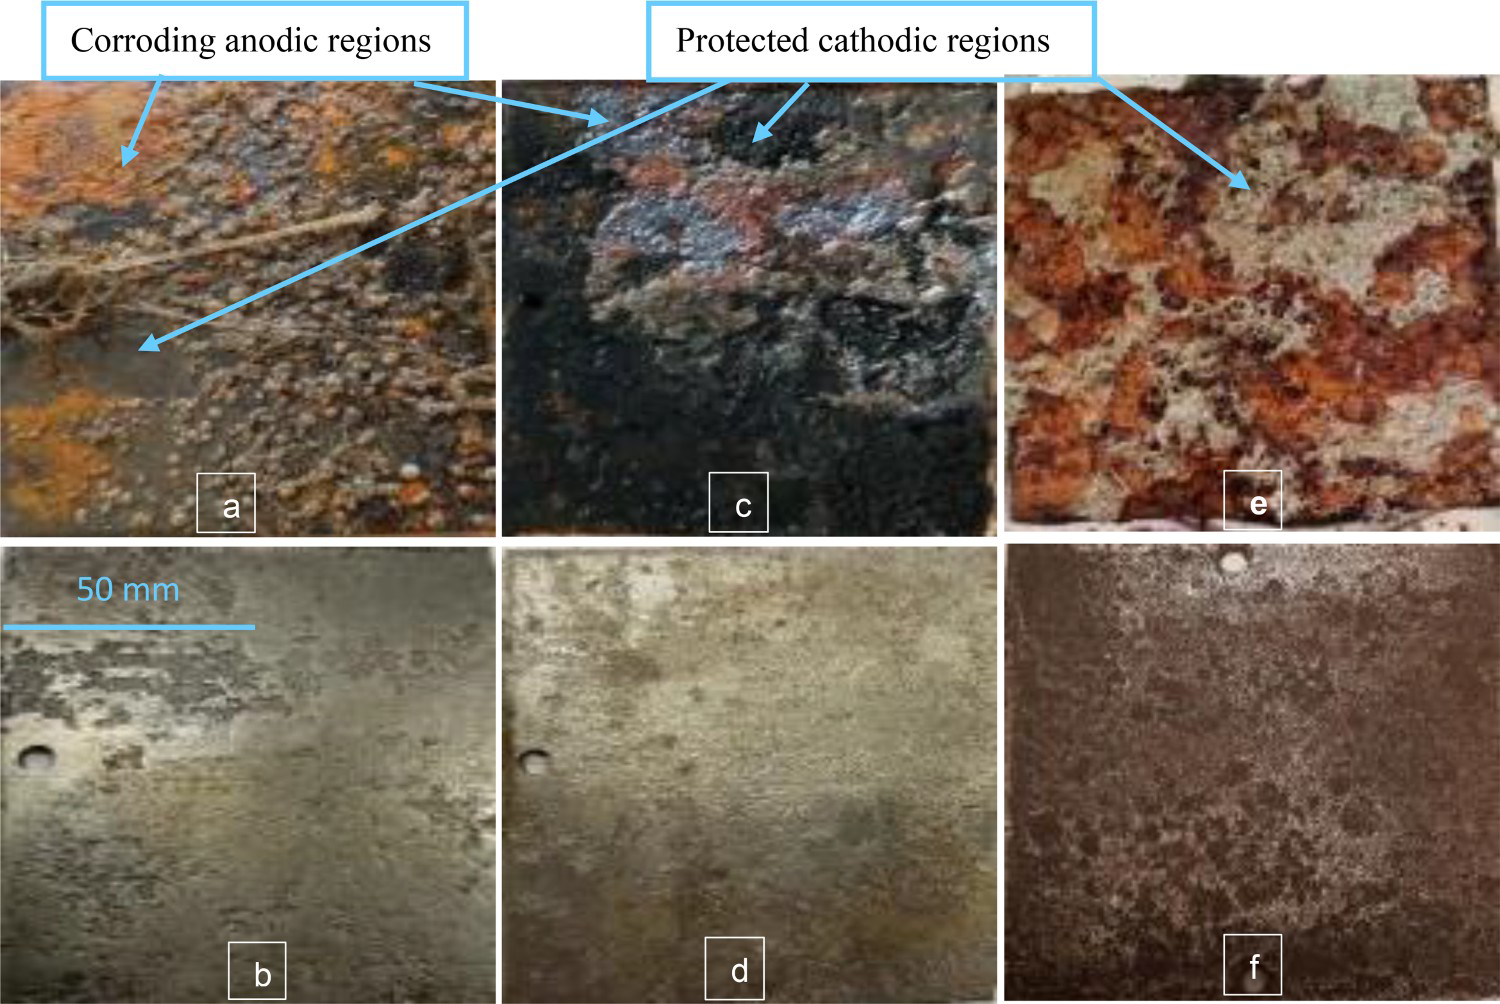
Laboratory corrosion test results
In the laboratory-based experiments, duplicate coupons were recovered frequently between 20-228 days of immersion. The average corrosion rates and corrosion losses calculated using Equations (1) and (2) are shown in Figures 5 and 6, respectively.
Average corrosion rates calculated for steel coupons using the standard weight-loss method. Average corrosion losses calculated for steel coupons using the standard weight-loss method.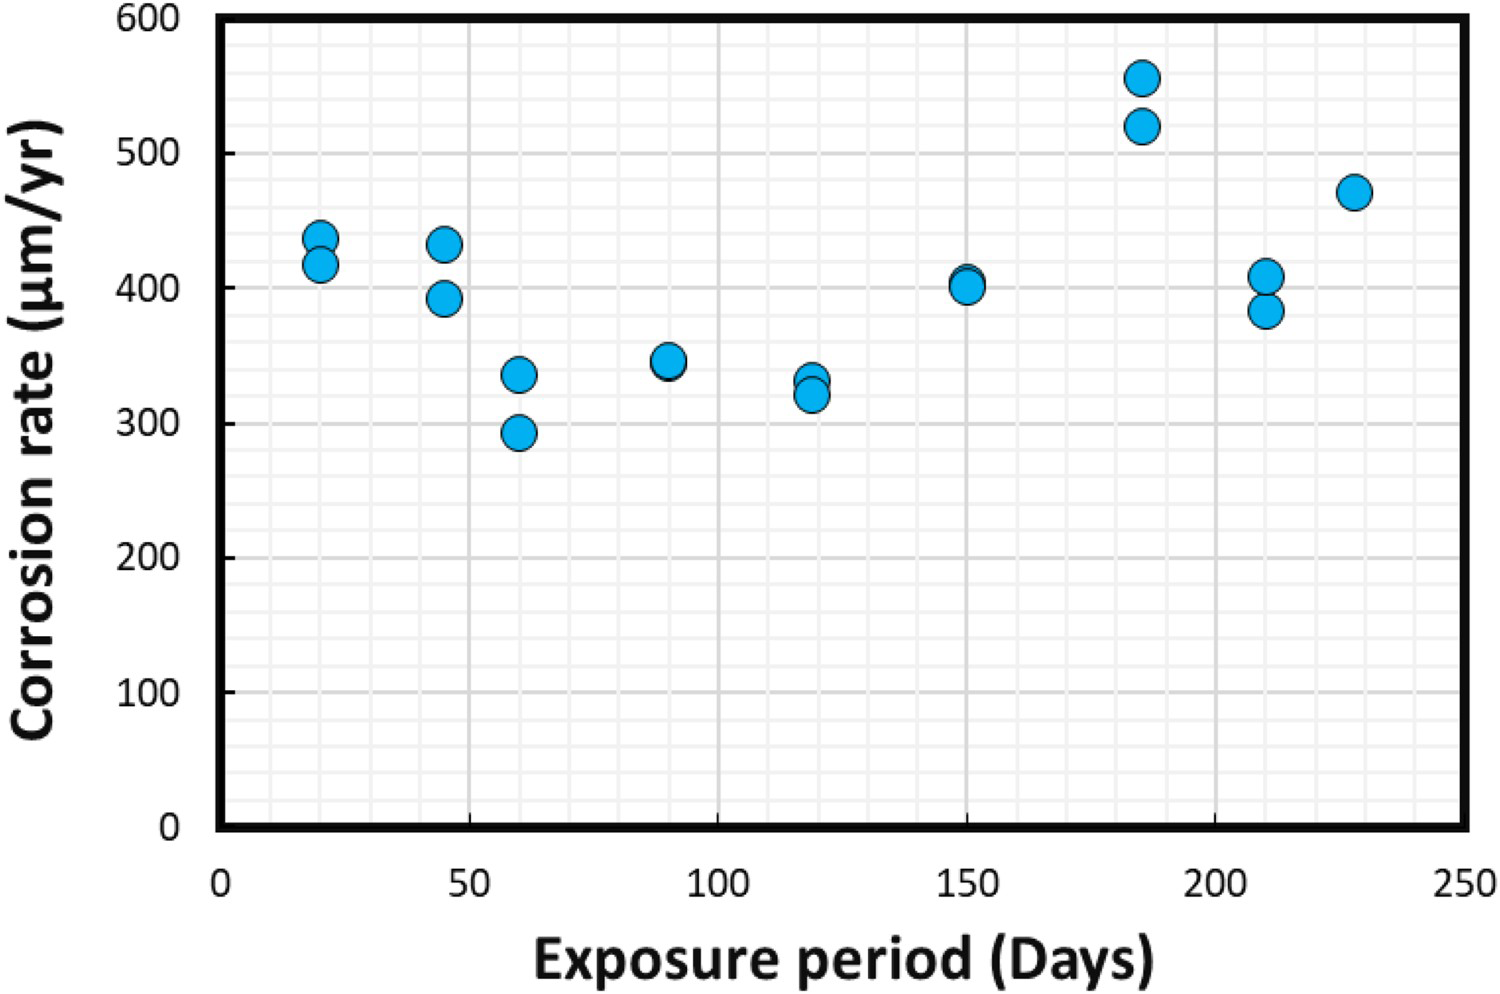
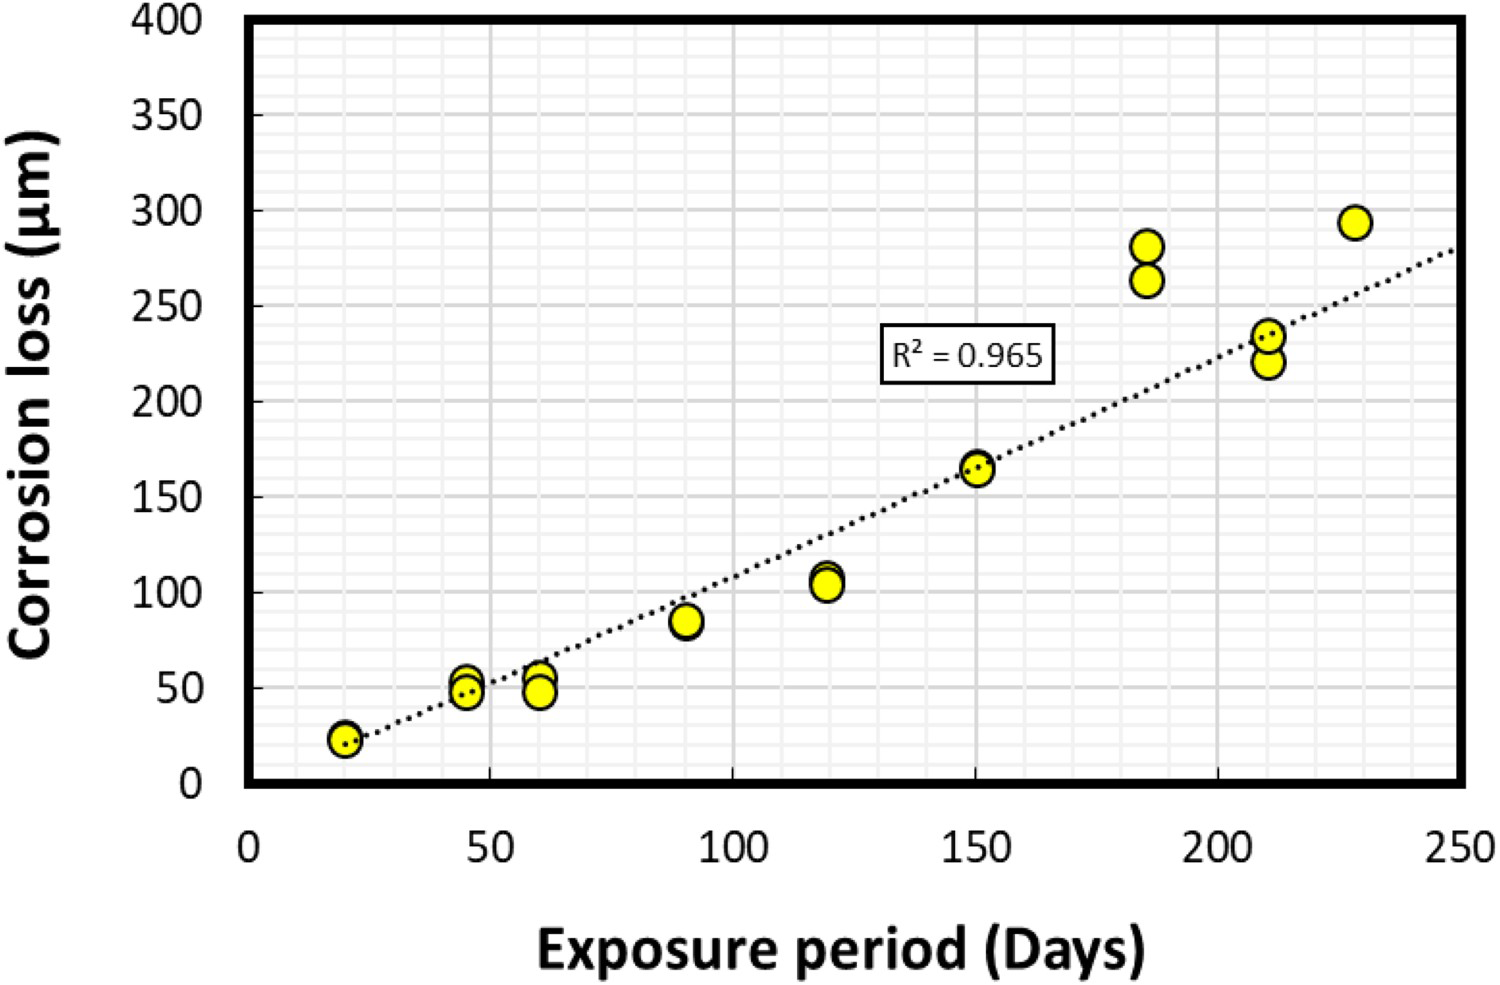
Figure 7 shows the cumulative probability (%) and the standard normal probability (standard deviation-SD) of the corrosion losses observed on the steel coupons and calculated with the help of the DM approach. In this study, a total of 28 positions were observed for thickness loss on each coupon.
Corrosion losses measured using the DM approach. Here, (a) cumulative probability distribution (%) and (b) the standard normal probability (SD). Legends indicate coupon number/immersion period (in days).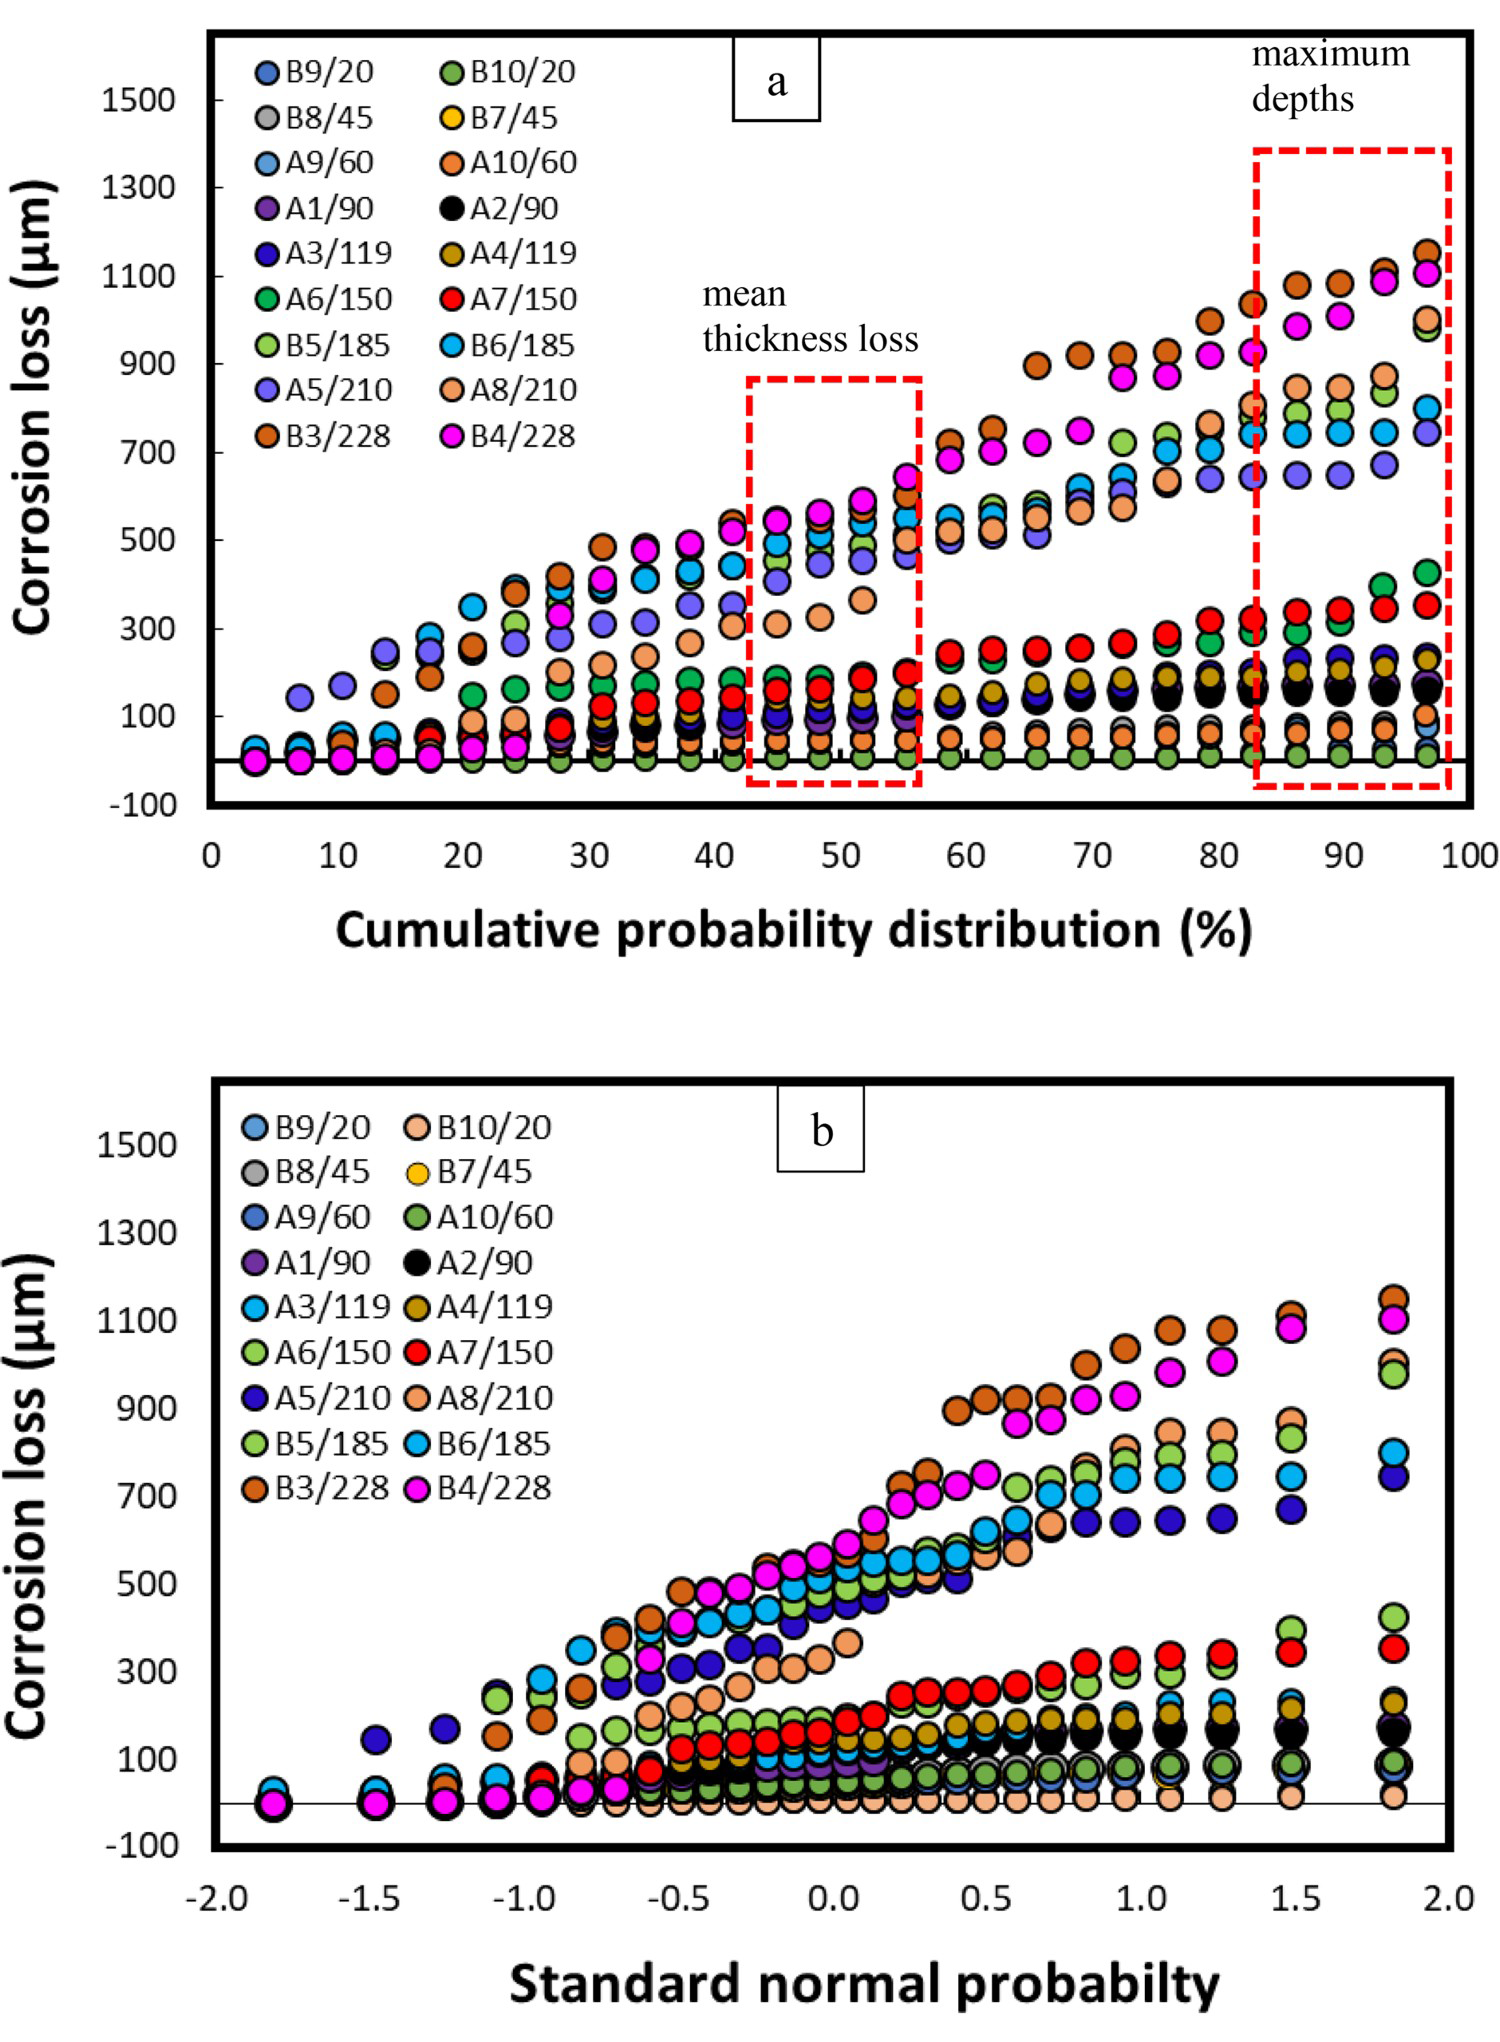
Figure 7 also provides comprehensive statistical details of the corrosion pattern (including mean, median, maximum depths, and data scatter, etc.) which otherwise cannot be obtained with the conventional standard weight-loss method.
Figure 8 illustrates average corrosion losses and maximum corrosion depths calculated with the DM and standard weight-loss method. The difference of average corrosion losses calculated with the standard weight loss and DM methods is significant, particularly after the first 150 days of exposure. The corrosion losses (both average corrosion and maximum depths) increased rapidly after 150 days probably because of the initiation of the anaerobic phase of corrosion, where localised depths increase quickly under the influence of biological activities, also known as microbiological induced corrosion (MIC) [15,39].
Comparison of mean corrosion losses and maximum corrosion depths calculated using both DM and the standard weight loss methods. The comparative corrosion losses have been calculated as a function of exposure period using (a) line graph (b) bar graph. Here, the legend ‘Mean corrosion-DM’ is the average corrosion loss calculated by taking the average of the corrosion depth data obtained with the DM-based approach, whereas ‘standard mean corrosion’ is the corrosion loss calculated with the standard weight-loss method.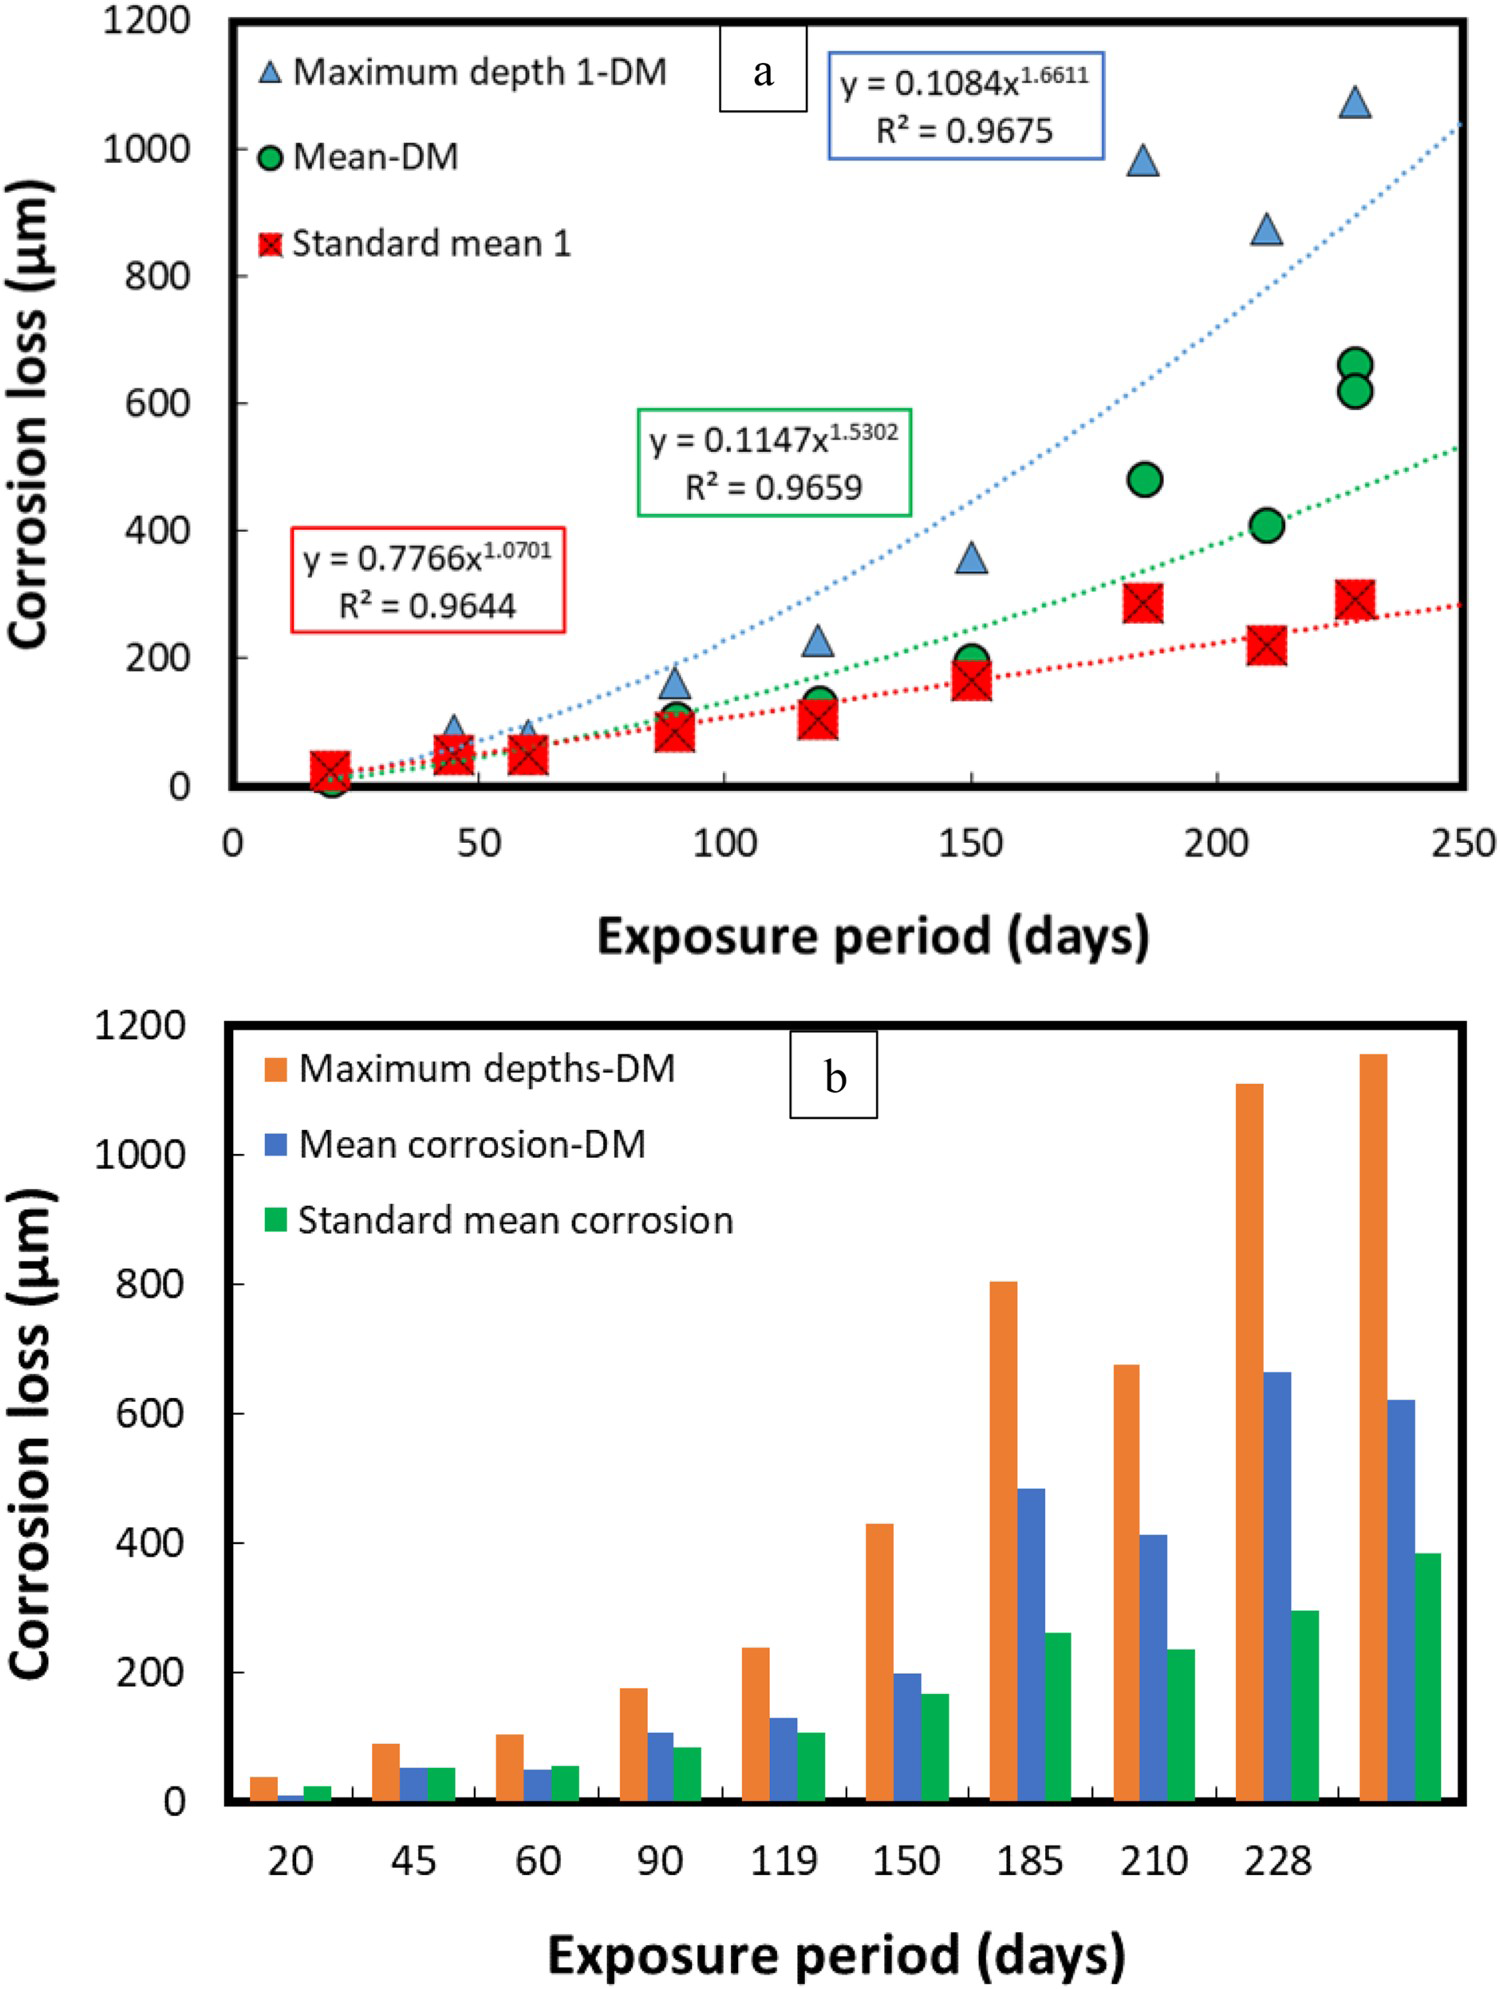
The maximum corrosion depths have reached up to 1200 µm within just 228 days of sea water exposure, whereas the average corrosion losses calculated with the standard weight-loss method were approximately 300 µm. A significant difference is also evident in the average corrosion losses calculated with the standard weight-loss and the DM techniques, respectively. More this difference increases further with the exposure periods mainly because of the rapid increase in the corrosion depths in the anaerobic phase (about 150 days at a sea water temperature of 40°C) [15].
Field corrosion test results
Figure 9 shows the average corrosion rates and corrosion losses observed during the field experiments in the natural sea water, and polluted sea water conditions of the Arabian Sea (standard weight-loss method). A significant difference in corrosion rates and corrosion losses was observed between the two field experimental conditions where higher corrosion losses were experienced in the polluted sea waters (represented by P1, and P2) than those recorded in the natural sea water (represented by N) conditions.
Corrosion parameters calculated using the standard weight-loss method in the natural sea water (N), and polluted sea water (P1, P2) conditions of the Arabian Sea. Here (a) average corrosion rates (b) average corrosion losses.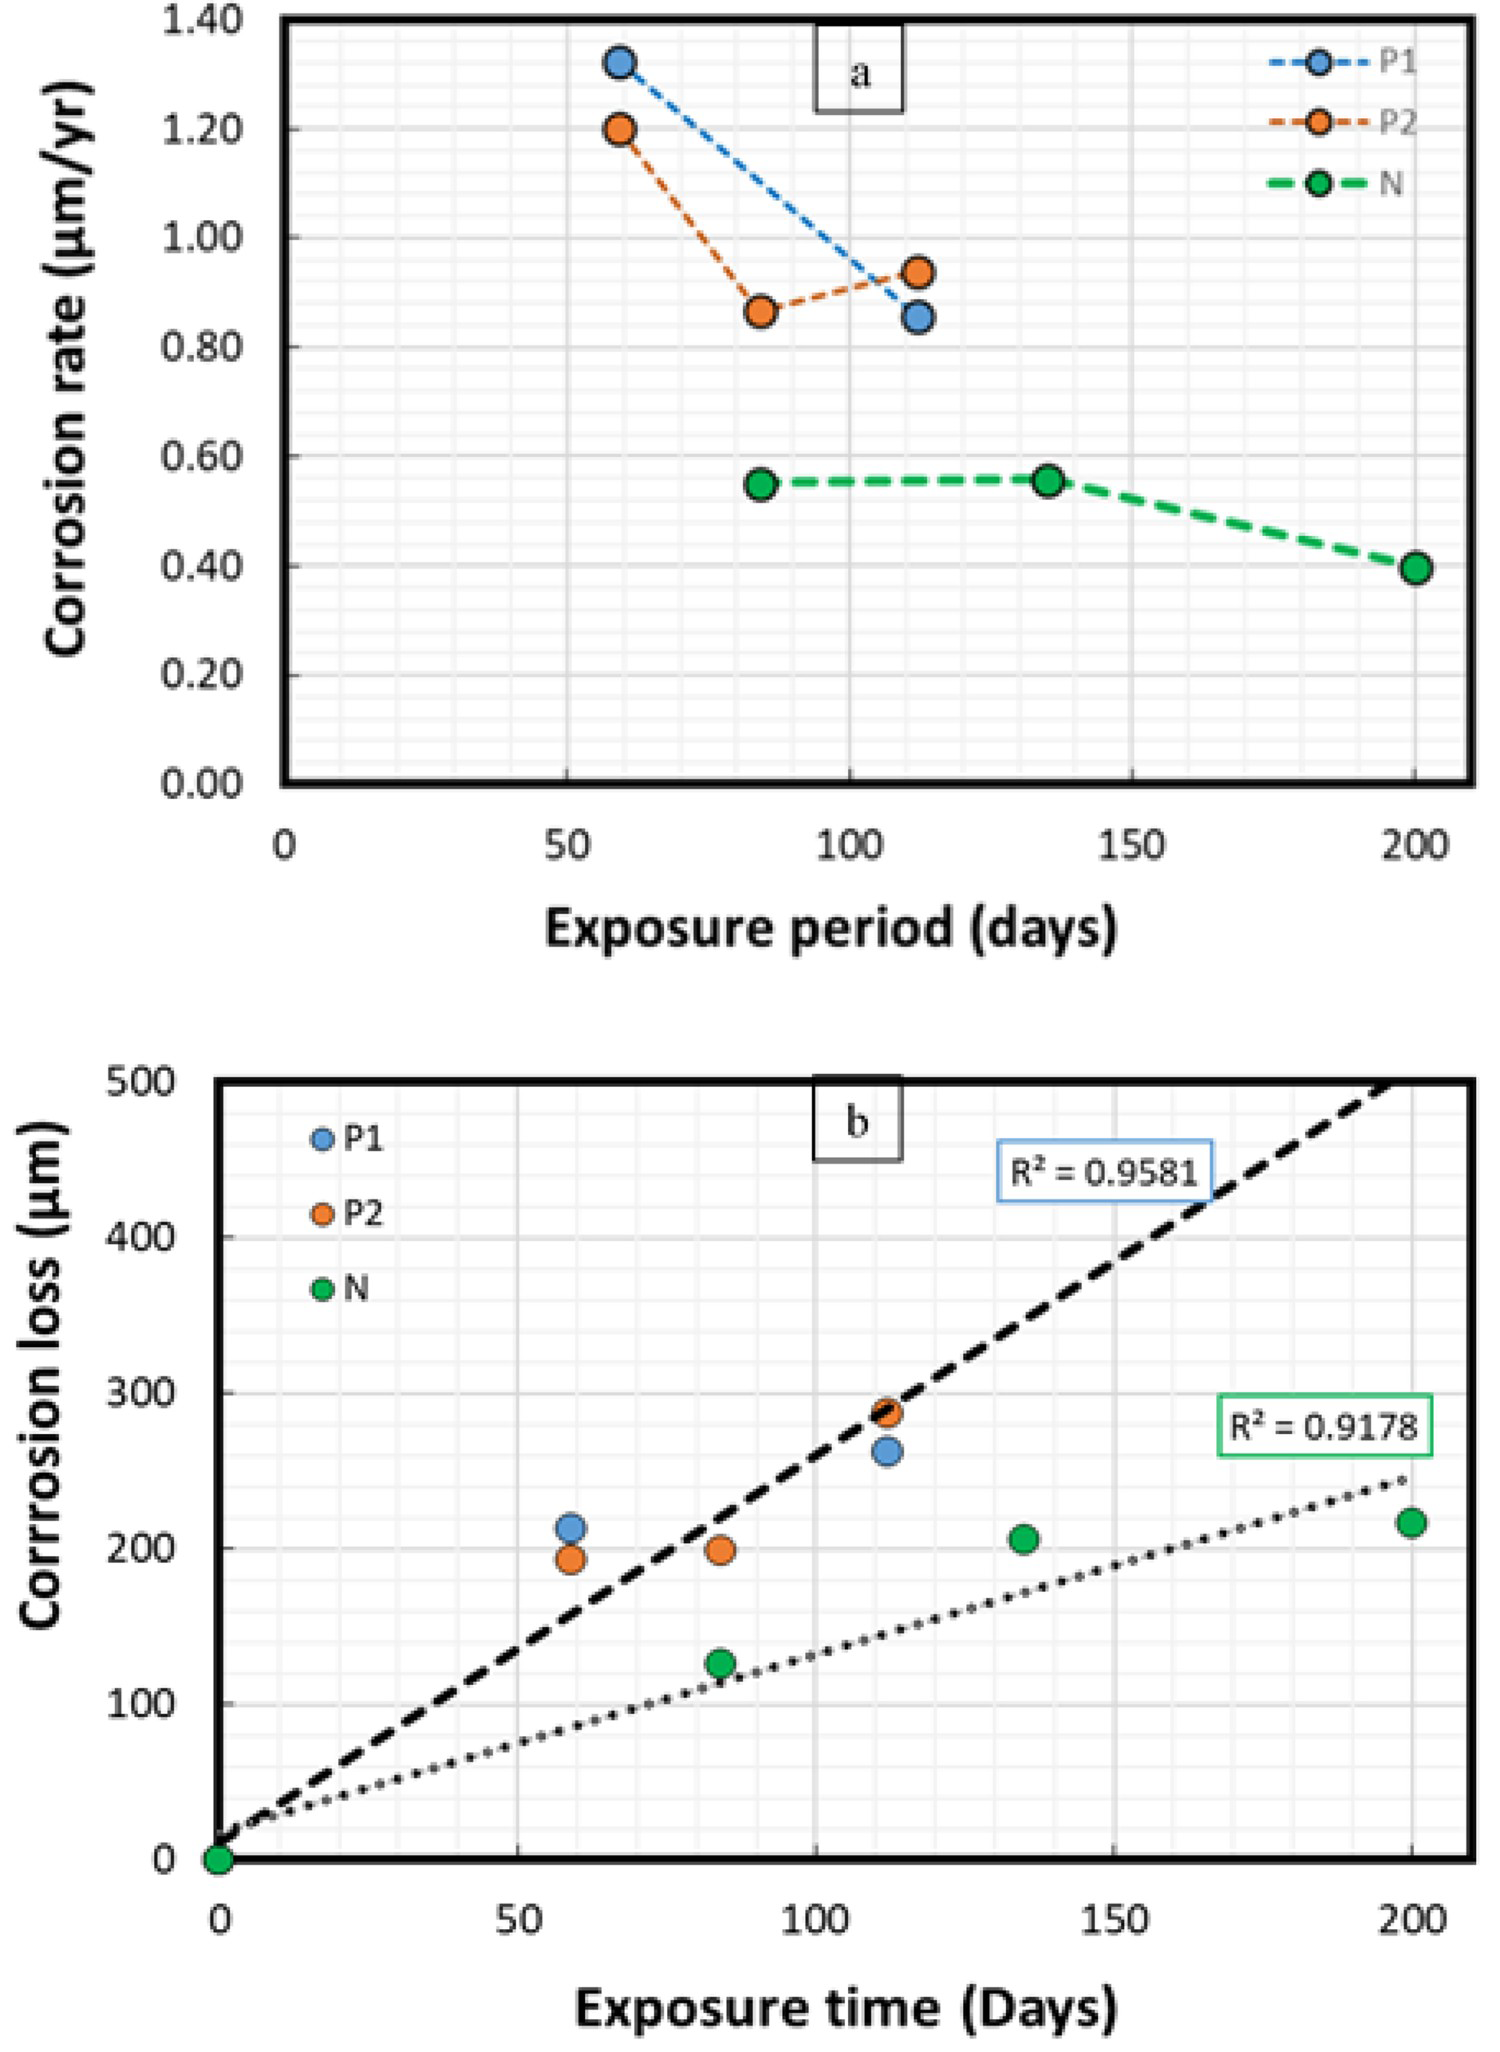
Similarly, the DM-based cumulative probability (%) of the corrosion losses both for polluted and natural sea water conditions is illustrated in Figure 10.
Cumulative probability (%) of corrosion losses calculated for steel coupons submerged in (a) polluted sea waters (b) natural sea waters in the Arabian Sea.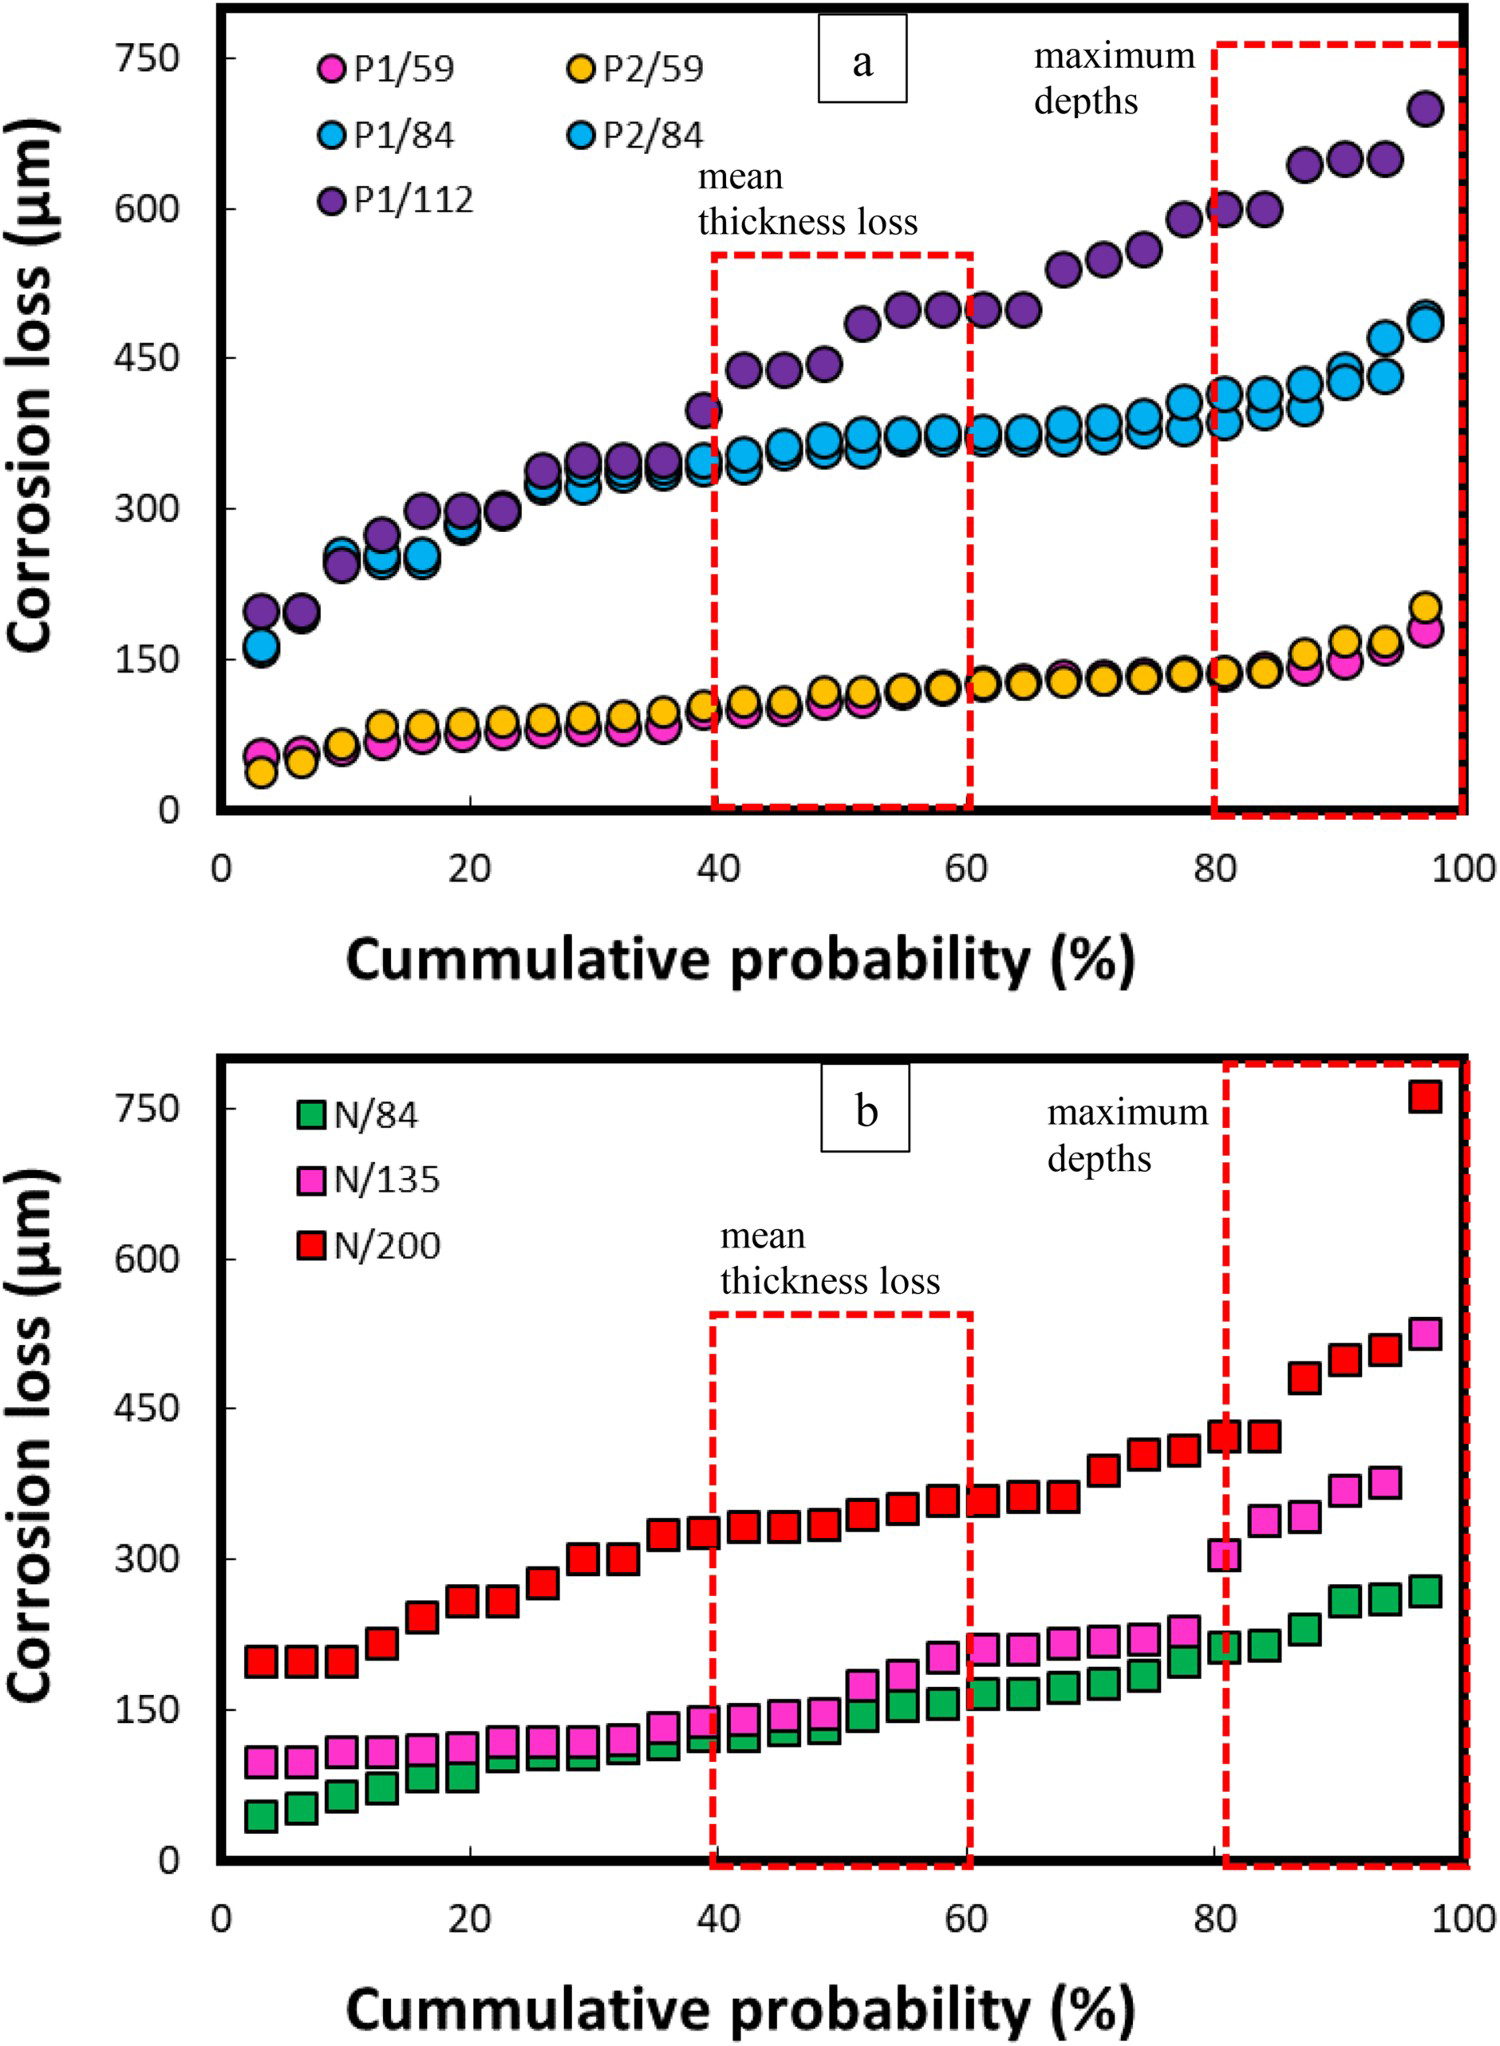
Figure 10 indicates that for the same immersion period, considerably higher corrosion losses (both mean and maximum depths) were observed in the pollutant-rich sea waters than those in the open, natural sea water conditions. In natural sea water conditions, even after 200 days of immersion period, the maximum corrosion depths reached up to 550 µm, except for a single point (i.e. at 750 µm), whereas, during the polluted sea water conditions, the maximum depths of up to 700 µm were experienced in just 112 days.
Characterisation of rust product
Figure 11 illustrates SEM micrographs for the corrosion products accumulated on the steel coupons submerged in the field conditions and laboratory sea water conditions, respectively. The magnifications of the micrographs between 4000 and 20,000× have been acquired for clear identification of the typical iron oxide phases.
SEM micrographs of the corrosion products acquired from steel coupons exposed in (a, b) pollutant-rich sea water (c, d) natural sea water (e, f) artificial sea water conditions.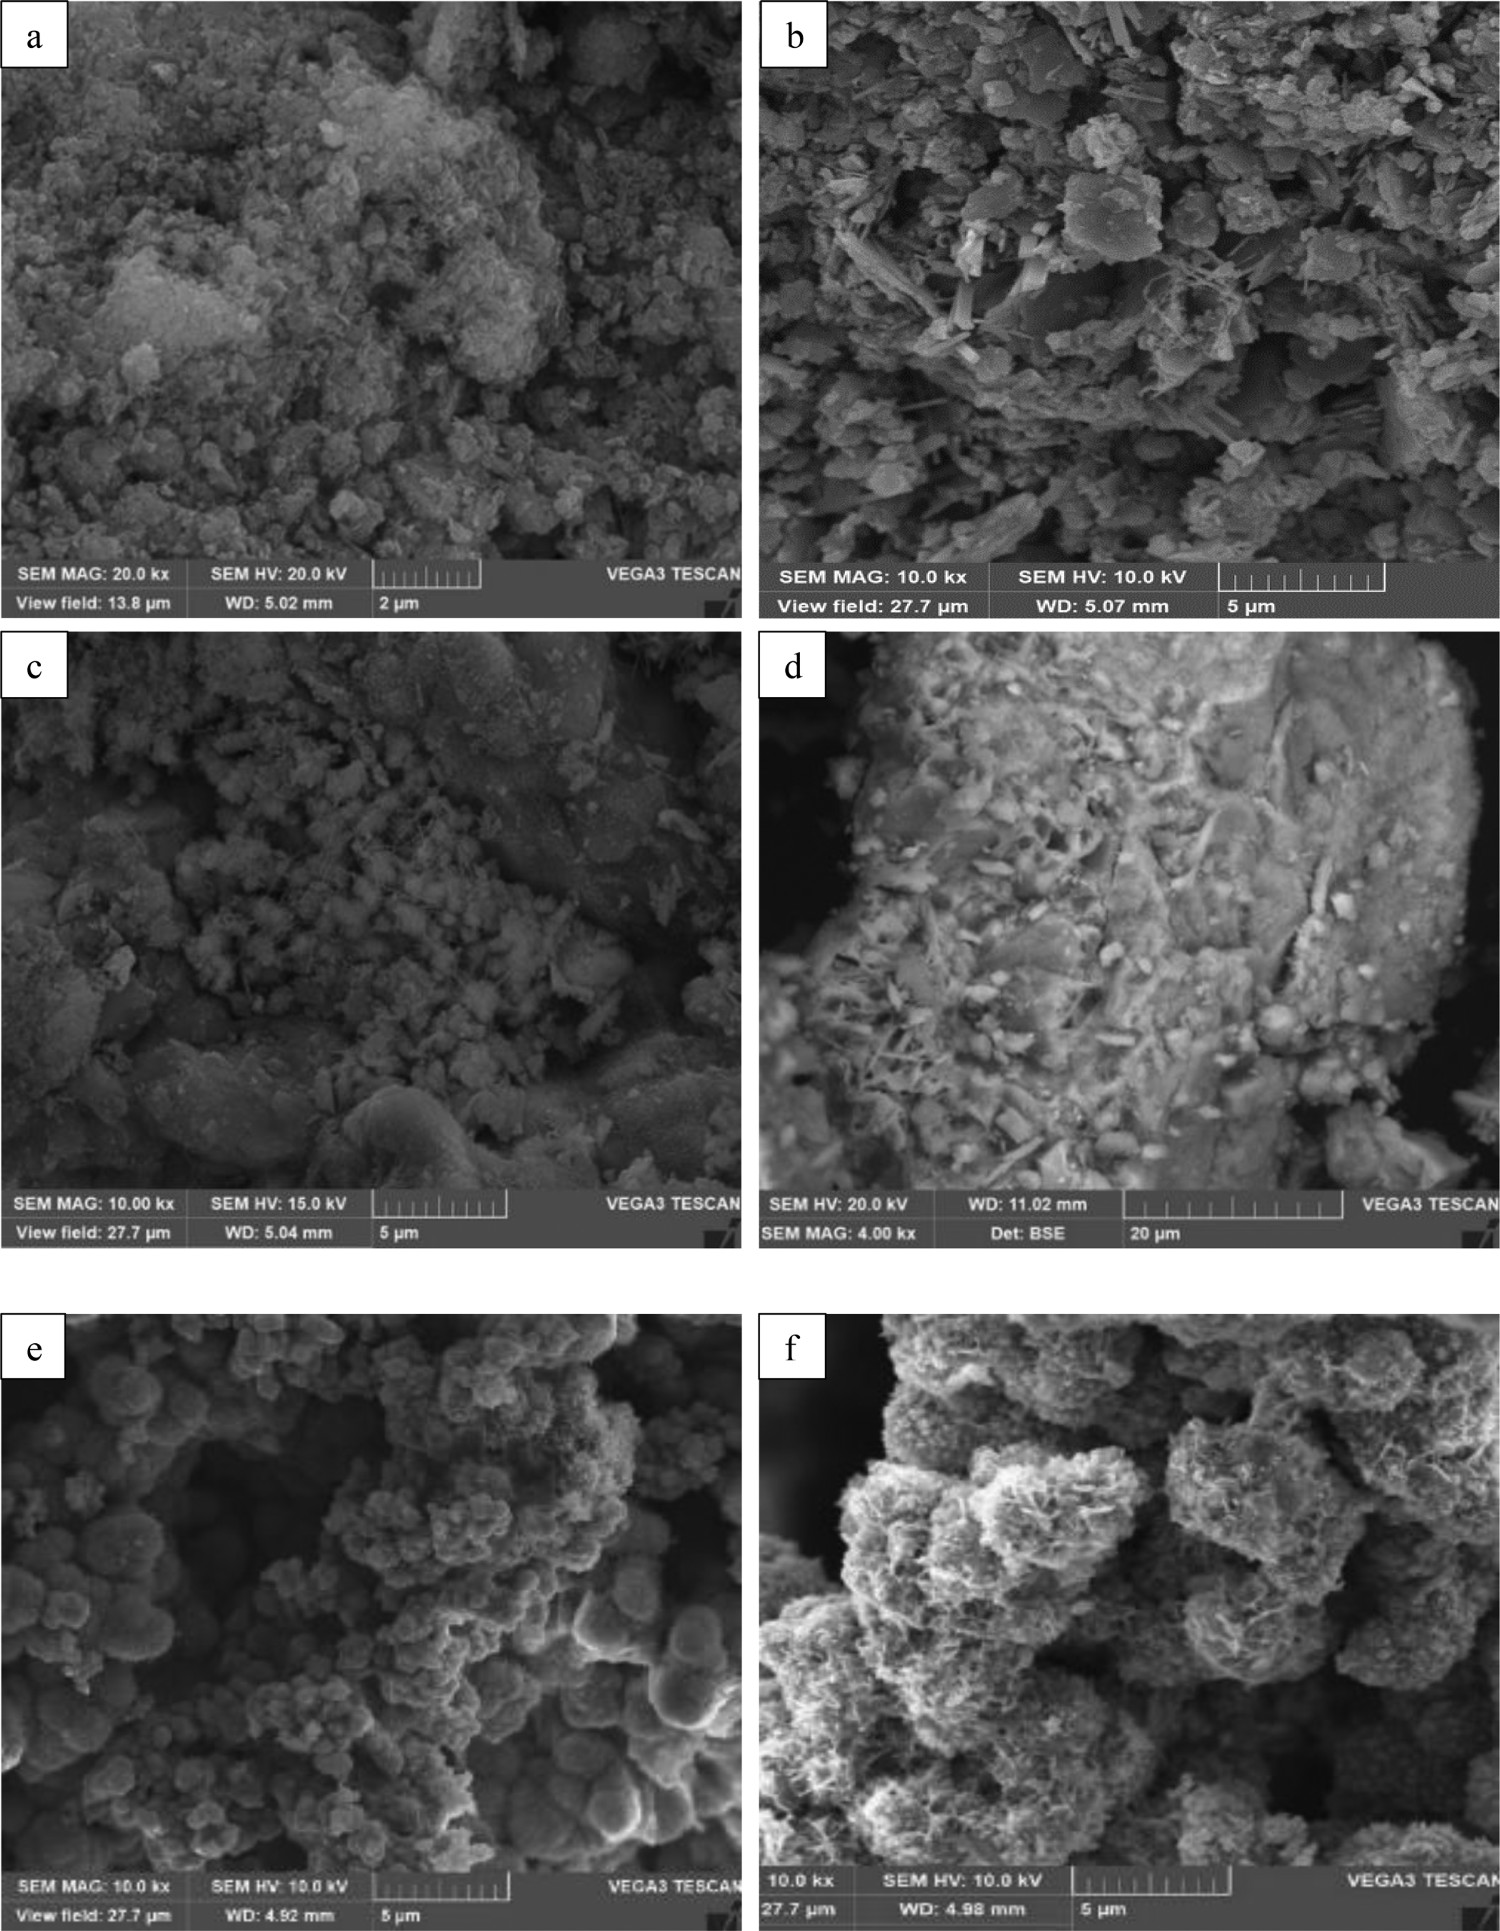
The distinct iron/oxygen-rich oxide phases are visible in the SEM micrographs similar to the cotton balls, globules, spongy globules, needle shapes, blackish, tabular hexagonal crystals, and irregular rod-shaped morphologies. These shapes have been mainly attributed to the prominent iron oxide phases such as goethite, lepidocrocite, magnetite, akaganeite, hydrated ferric oxides, and iron–sulphur [40–43]. The iron oxide phases in the polluted sea waters are not visible prominently in the micrographs probably due to the amalgamation of the biofouling with the pure rust phases. In the natural sea water conditions, goethite, lepidocrocite and magnetite phases are more prominent, whereas typical cotton balls, spongy and flowery structures appeared in the artificial sea water conditions which are normally attributed to the goethite, lepidocrocite, and feroxyhyte structures [42,44].
The EDS results in Figure 12 show the elemental compositions (wt-%) of the corrosion products formed on the steel coupons submerged in different environmental conditions (in field and laboratory tests).
EDS results demonstrating the elemental compositions (wt-%.) of the corrosion products on steel coupons exposed to (a) polluted sea waters (b) natural sea waters (c) artificial sea waters.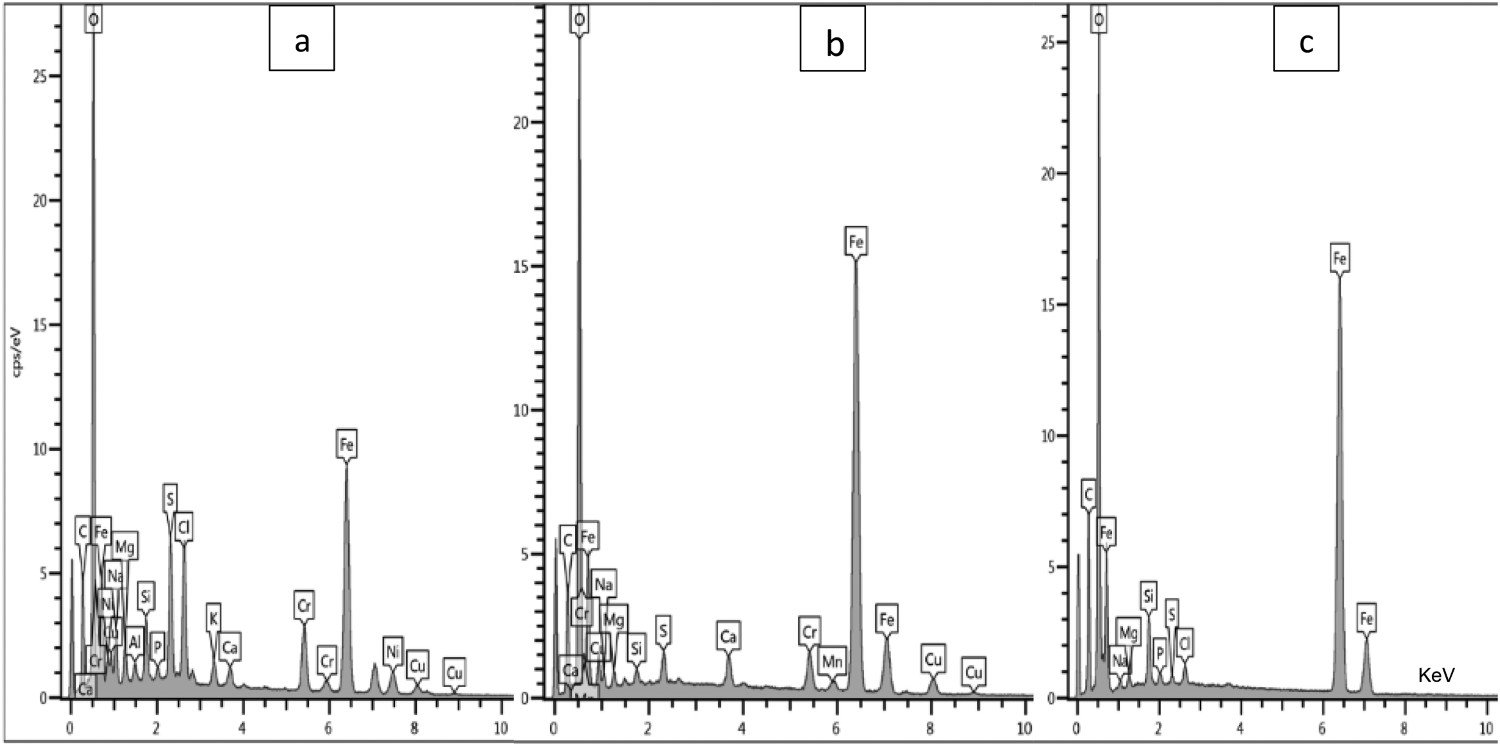
Elemental composition (wt-%) of the corrosion compounds collected from various field and artificial sea water experimental sites.
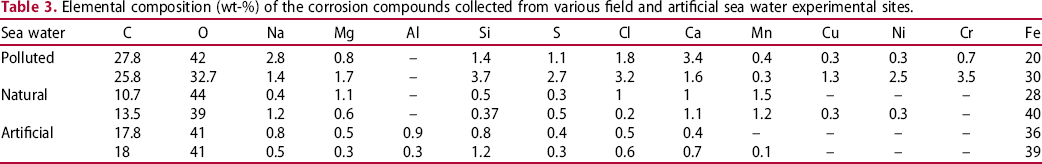
The EDS (Table 3) results indicate comparatively higher sulphur (∼2.7%), chloride (∼3.2%), and calcium (∼3.4%) contents in the corrosion products recovered from the polluted sea waters than those exposed in the natural sea water of the Arabian Sea and artificial sea waters.
Figure 13 shows XRD spectra for the corrosion products observed during the field conditions in the Arabian Sea. The presence of dominant iron oxide phases e.g. goethite, lepidocrocite, magnetite, were detected in both environmental conditions (pollutant-rich sea water and natural sea water).
XRD results for the corrosion products collected from steel coupons submerged in the (a) polluted sea water (b) natural sea water conditions in the Arabian Sea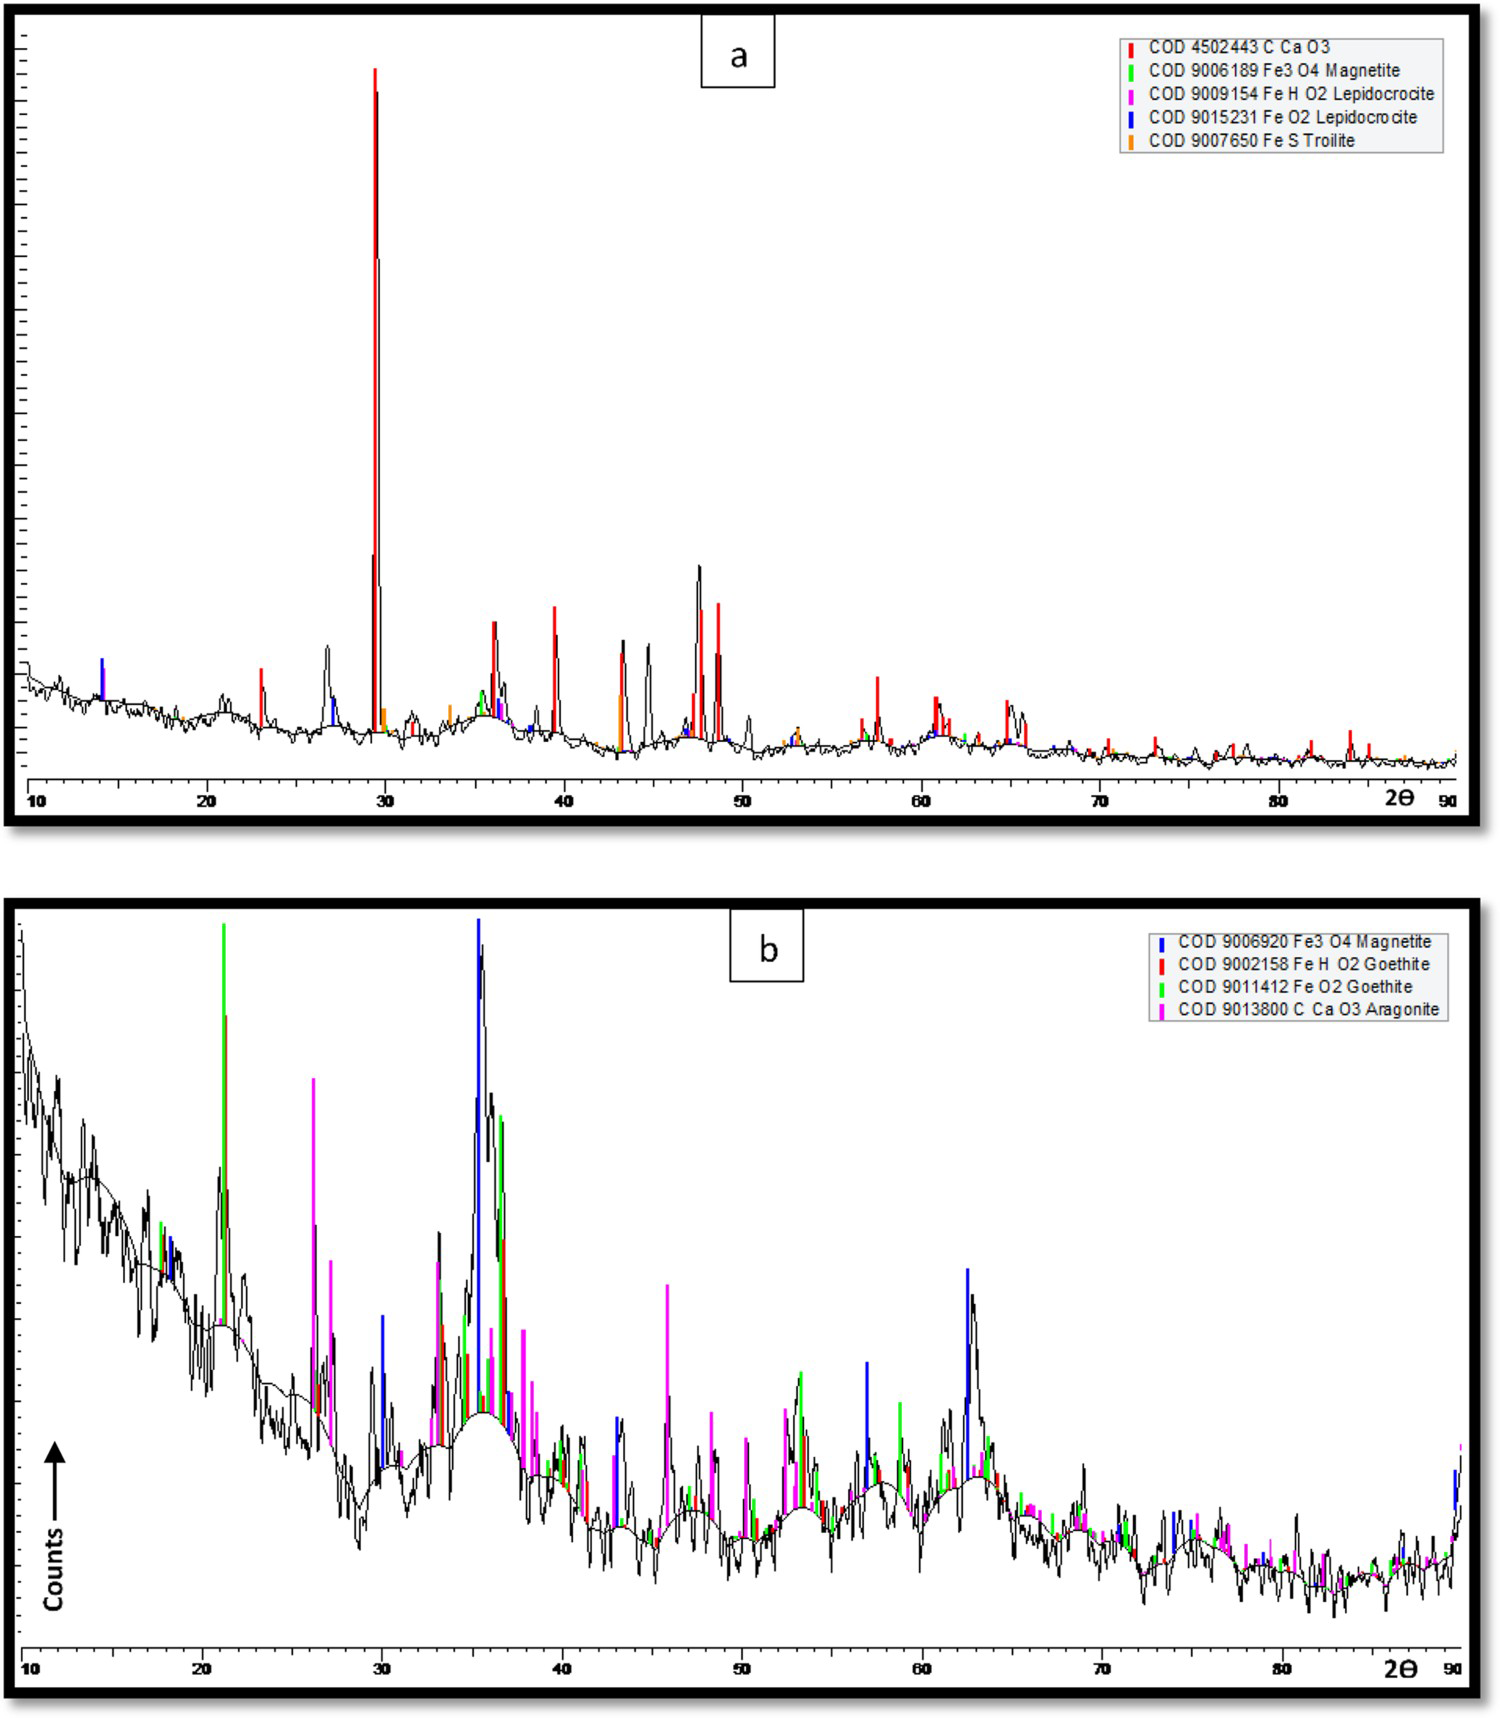
Additionally, aragonite, calcite, and silicon oxides were also detected in the corrosion layers in polluted and natural sea water conditions. Strong aragonite peaks were observed in the pollutant-rich sea water environment with traces of iron oxides and iron-sulfide. Magnetite, goethite, and aragonite were the major compounds observed during the tests in the natural sea waters. As the EDS results in Table 3 indicate the highest carbon and calcium content in polluted sea water conditions probably indicating the presence of calcium carbonates. Hence, the XRD results in Figure 13(a) supplements the rich presence of the polymorphs of calcium carbonates in the polluted sea water conditions.
Figure 14 represents XRD results for the corrosion products collected at the anodic and cathodic regions of the steel coupons exposed in the artificial sea water conditions.
XRD results for the corrosion products observed on the steel coupons during the corrosion tests in artificial sea water at 40°C. Here, (a) corrosion products from the anode regions and (b) protective corrosion products accumulated on the cathode regions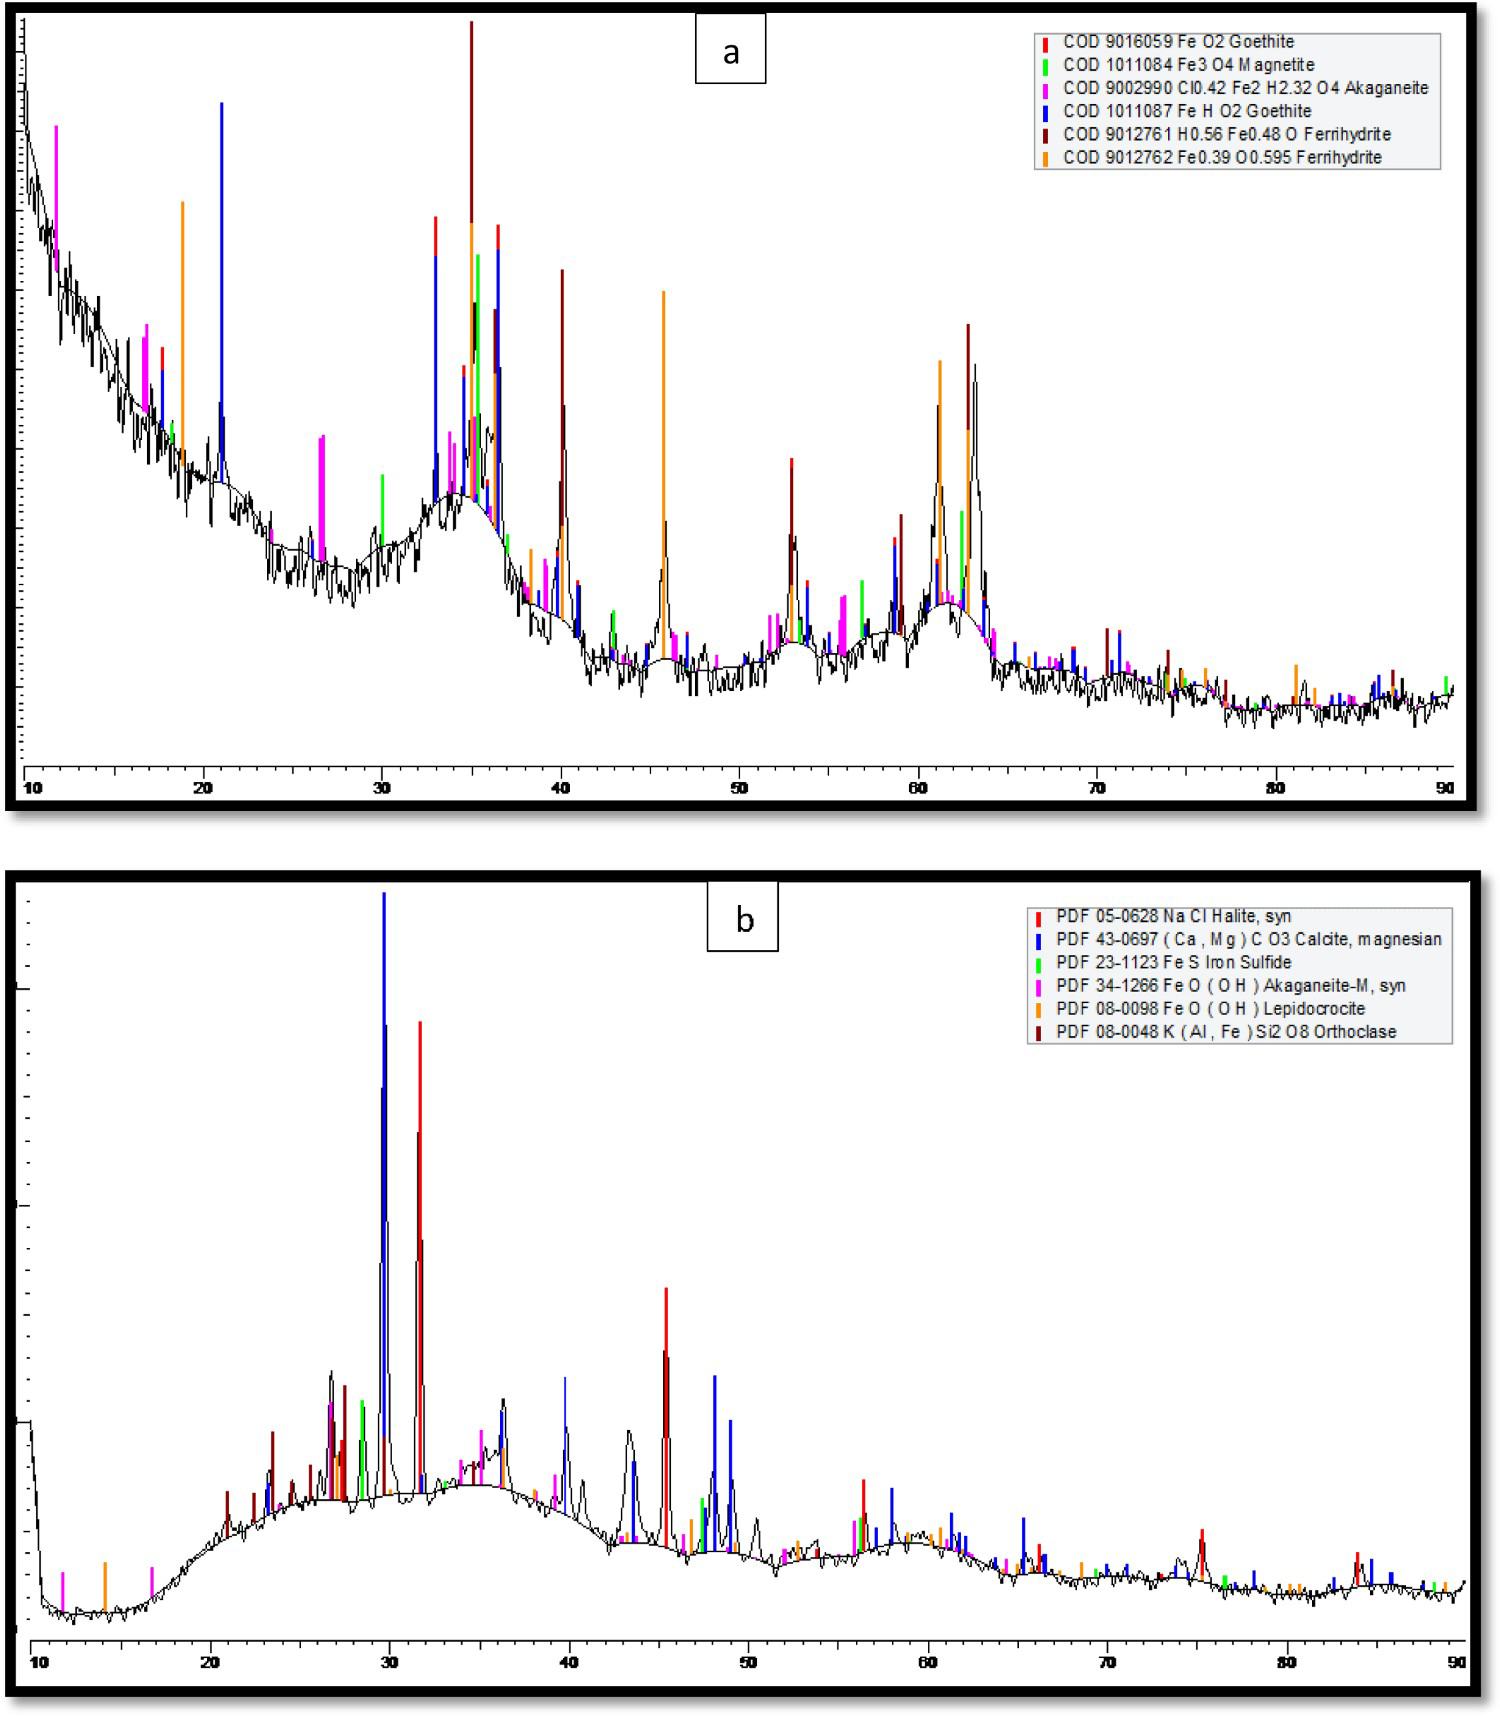
The strong peaks of ferrihydrite and goethite were observed along with the small peak of akaganeite and magnetite in the corrosion products collected from anode regions. The yellowish protective layers deposited on the cathode regions of the coupons from the early days of immersion and that remained intact throughout the immersion period hence, protected the steel surface against any loss of metal. The XRD analysis of this yellowish/greyish protective layer (Figure 14(b)) revealed the presence of halides (NaCl), calcite, and dolomite as major compounds, whereas, traces of akaganeite, iron sulphide, and orthoclase (KAlSi3O8) were also observed.
Discussion
The corrosion rates/losses (mean corrosion and maximum depths) were significantly at variance between the natural sea water conditions and the pollutant-rich sea water site in the Arabian Sea even though some of the potential corrosion contributing factors, such as sea water temperature, velocity, salinity level, submerged depths were similar in both field experimental conditions. On the other hand, several other influential corrosion accelerating factors, such as DO concentration, DINs (nitrates), and pH level were found to be significantly different (see Table 2).
The DO concentration in the natural sea water conditions was above 3.5 mg L–1, whereas it is hardly around 1 mg L–1 in the polluted sea water site (see Table 2). Although, the DO concentration in the natural sea water conditions is considered to be proportional to the rate of corrosion in the marine steel alloys [17,45], however, mixing of pollutant content considerably decreased the DO concentration [46]. In these conditions, anaerobic corrosion factors such as various biological agents including SRBs set in very early particularly in the presence of high nutrients, and DINs compounds [8,47]. Subsequently, the corrosion reaction takes place at a rate much higher than typically found in the oxygenated natural sea water conditions [17,48]. In this research, the corrosion process observed in the polluted coastal sea water conditions of the Arabian Sea resembles the most with such conditions, where the steel coupons were exposed to the detrimental impact of low DO, low pH, and high nutrient and sulphur-containing compounds from the early immersion period till the initiation of early anaerobic corrosion phase. Subsequently, the mean corrosion rates/losses and maximum thickness depths were approximately twofold higher than those observed in the natural sea water conditions.
One of the most promising corrosion contributing factors observed in the polluted sea waters of the Arabian Sea is the DIN content, mostly in the form of nitrates (1.5 ppm NO3–N). According to the published research literature, the presence of DINs in sea water in the form of nitrates, nitrites, and ammonia, with/without sulphur-containing compounds have considerable effects on the long-term corrosion process by elevating the corrosion rates in marine steel and cupronickel alloys [10,19,49 54]. The concentration of DINs observed in the polluted sea water conditions of the Arabian is significantly higher than those reported in the available research literature (0.07-0.7 ppm), for their significant contribution towards the corrosion process [10,19,49 51]. Previous research studies conducted on mild steel and a cupronickel 90/10 alloy in the Arabian Sea conditions revealed significantly higher average corrosion rates/losses near the polluted coastal sea water waters [9,52].
The EDS results in Table 3 also demonstrate the highest chloride content in the polluted sea water regions than that observed in the natural and artificial sea water corrosion tests. In this research, an EDS result has shown chloride content of up to 6% in the corrosion products formed in the polluted sea water. The high corrosion losses on steel coupons observed during the polluted sea water corrosion tests principally corroborate with the steel corrosion losses observed in the previous research studies in presence of rich DINs, sulphur-containing compounds, or chlorides in the sea waters [19,25,40,55–58]. The high chloride content in the iron oxide layers can lead to the formation of akaganeite, green rust (Cl–), and ferric/ferrous chloride compounds which play a significant role in the accelerated corrosion rates, particularly during short-term exposures. Presence of oxidising species in a chloride-rich condition can provide a favourable condition for elevated localised corrosion. The chloride ions also tend to attack the passivation ability of rust layers formed on the marine steel surfaces [59,60].
Similarly, the presence of sulphur-containing compounds (including hydrogen sulphide) in the sea waters is also reckoned for accelerated corrosion rates in steel structures [3,17,55,61,62]. Large presence of sulphides in the form of green rust may favour the colonisation of the corrosion layers with the SRBs that subsequently serve in formation of MIC in submerged steel structure [63]. In this research, comparatively highest sulphur content was always observed in the corrosion products recovered from coupons submerged in the polluted sea water sites (See Table 3 and Figure 1).
In this study, the average corrosion rates in the natural sea water conditions were reduced from 0.55 mm/year after 84 days to around 0.43 mm/year after 200 days of exposure. Whereas, in the polluted sea waters, the average corrosion rates reduced from 1.32 mm/year after 59 days to around 0.87 mm/year after 112 days. During the laboratory corrosion tests, corrosion rates ranged between 0.4 and 0.53 mm/year for the experimental period of up to 365 days. Despite higher sea water temperature (40°C), the average corrosion losses in the laboratory-based conditions remained lower than the field conditions (27 ± 3°C), potentially due to the absence of known biological, and pollutant factors in the controlled laboratory conditions. The average corrosion rates/losses observed in the natural sea water and laboratory-based conditions were found comparable despite the sea water temperature difference of around 10°C. However, maximum corrosion depths on steel coupons (1.2 mm) observed in the laboratory corrosion test after 200 days were significantly higher than those observed (0.78 mm) in the natural sea water conditions. The corrosion losses observed at various exposure conditions in this research are not very different from the results reported for the two-sided corrosion of steel coupons/structures exposed in the various field/laboratory-based sea waters or those corrosion models based on the field corrosion data [18,55,64,65].
The decrease in early high corrosion rates with time was common in all three conditions including those in the pollutant sea water conditions. However, the bimodal corrosion trends, i.e. a sharp increase in the thickness losses, possibly during the early anaerobic phase was found more intensely in the laboratory corrosion tests, where a sharp increase in the rate of corrosion (both average corrosion and maximum depths) was noticed after early 150 days of immersion. In the field corrosion test, this increasing corrosion trend was not very prominent probably due to the limited period of exposure, as a function of sea water temperature based on which the shift in corrosion process from aerobic phase to the rapidly rising anaerobic phase (phase 3) has been determined in the literature [15,66,67]. Nevertheless, the bimodal corrosion trend as a function of sea water temperature has been reported for both uniform and localised corrosion of steel alloys in various research studies [41,50,62,63].
The thickness loss measurements using the DM approach provided corrosion (loss) data of superior quality, which would otherwise be missing or underestimated with the conventional average weight-loss procedures. The cumulative probability (%) and standard normal probability plots, yielded by the DM approach are very useful in comprehending the overall trends in structural thickness loss, as a function of environmental severity. The DM approach can be instrumental in the formulation of prediction models for general and localised corrosion, as well as during the risk/reliability estimation, development of inspection, and maintenance plans; mainly based on the probability of loss of integrity (or containment).
Characterisation of the corrosion products with the help of SEM/EDS and XRD techniques was instrumental in the identification of various crystalline phases particularly the iron oxides, the composition of elements, and identification of dominant compounds in the corrosion products. It has also provided very useful information to correlate the presence of corrosion-sensitive elements/compounds in the corrosion products with the overall corrosion rates.
In the laboratory corrosion tests, the analytical (SEM, EDS, and XRD) techniques provided a greater inside of the anodic and cathodic reactions by identification of respective corrosion products at each anode (mainly ferrihydrite, goethite, lepidocrocite) and cathode ends (calcite, magnesian, and halide, etc.). Here, the protective layers on the cathode region provided excellent resistance for the transport of free ions between the sea water and steel surface. Their protective nature in reducing the overall corrosion rates in marine steel is also supported by the previously published literature [14,66,68,69].
Conclusion
For the same exposure periods, significantly higher corrosion rates/losses were observed in the polluted sea water than those recorded in the natural sea water of the Arabian Sea despite the similarity in the surface preparation methods, steel compositions, immersion conditions, and sea water temperature. The difference of sea water quality between the two field experimental sites and their subsequent effect on the rate of corrosion process was attribute to the large presence of DIN (nitrates), sulphur and chloride-containing compounds in the deoxygenated, polluted sea waters. Significant sulphur, and chloride content (wt-%) in the corrosion products collected from the polluted seawater site was also verified by the analytical technique (EDS). The presence of such elements and associated compounds in the anoxic conditions potentially cause a rapid instigation of MIC, despite the short-term exposures. In this research, the authors have found that the influence of nutrients, particularly DINs and sulphur-containing compounds present in the sea water is not limited to long-term corrosion only. They may equally influence the rate of short-term corrosion process. The DM approach provided more realistic and superior quality data regarding corrosion parameters and their statistical analysis, which is instrumental to formulate data-driven corrosion prediction models and risk/reliability analysis for marine assets. The laboratory corrosion tests conducted with artificial sea water to simulate the sea water conditions spanning those anticipated for the natural sea waters of the Arabian Sea provided a meaningful source of information about the marine corrosion mechanism in steel alloys. It provided a great opportunity to understand the individual effect of potential environmental factors (physical or chemical) on the rate of the corrosion process. The insignificant presence of potential biological factors could be one good reason for reduced mean corrosion losses in the laboratory conditions despite the elevated sea water temperature (40°C). These laboratory corrosion tests provided greater confidence to investigate the influence of only physical and chemical environmental factors on the all corrosion process. It helped to quantify the influence of individual factors on the corrosion process as well as to evaluate the interdependent relationship among these factors (physical and chemical), and in turn on the rate of the corrosion. This research provides further avenues of corrosion-related research, particularly the extended duration corrosion tests both in the field condition of the Arabian Sea and in the laboratory conditions are required for a better understanding of the corrosion mechanism in the polluted conditions. Future research plans include further laboratory-based corrosion experiments at different temperatures, with/without the combined presence of DIN (nitrates, ammonia, etc.) and sulphur-containing compound followed by the comparison of corrosion losses and subsequent corrosion prediction modelling.
Footnotes
Acknowledgement
The support of Cranfield University (SWEE), United Kingdom, National University of Sciences & Technology, (PNEC) Pakistan, and Karachi Shipyard and Engineering Works are acknowledged with gratitude.
Disclosure statement
No potential conflict of interest was reported by the author(s).