
Abstract
In order to effectively implement measures against the adverse effects of large earthquakes on telecommunication conduits, it is important to elucidate which conduit is vulnerable. Telecommunication conduits consist of pipe bodies and joints, and as is well known the joints are weaker than the bodies against seismic loading. Hence, the seismic performance of the conduits depends on the performance of the joints. To maintain conduits properly, the corrosion rate of conduits’ joint in the field must be determined. Several sites were selected and investigated for the amount of stagnant water in manholes. Next, the stagnant water test specimens were collected and observed for the extent of corrosion inside via a pipe camera, and subsequently analysed collected water test specimens. Moreover, the solution resistances and polarisation resistances using the AC impedance method and carbon steel coupons were measured. The experiments revealed differences between the measured values recorded at the different sites. It was also found that some data were related to corrosion on the inside of the conduits.
This paper is part of a supplementary issue from the 17th Asia-Pacific Corrosion Control Conference (APCCC-17).
Introduction
The East Japan Great Earthquake caused severe damage to the underground facilities of Nippon Telegraph and Telephone Corporation (NTT). NTT's underground conduits were also damaged for 60 km of NTT's conduit facilities. However, only conduits of the early-generation type were damaged. The present underground conduits showed no damage because of the expansion and contraction function [1]. NTT intends an effective use of the existing stock. To efficiently improve the reliability of networks at earthquakes, it is necessary to locate where the early-generation conduits are weak against earthquakes and require seismic measures. Carbon steel conduits of the early-generation account for a great percentage of NTT's conduits. The purposes of this research work are to quantify the performance deterioration of such carbon steel pipes attributable to corrosion and to enable the forecasting of deterioration owing to aging.
Telecommunication conduits are connected between underground manholes, as shown in Figure 1. It is known that corrosion inside a conduit mainly causes clogging and adversely affects seismic performance. Conduits are installed in various types of manholes, so the estimated corrosion rates can vary. For these reasons, the focus of the study was the manhole environment.
Conduits and manholes.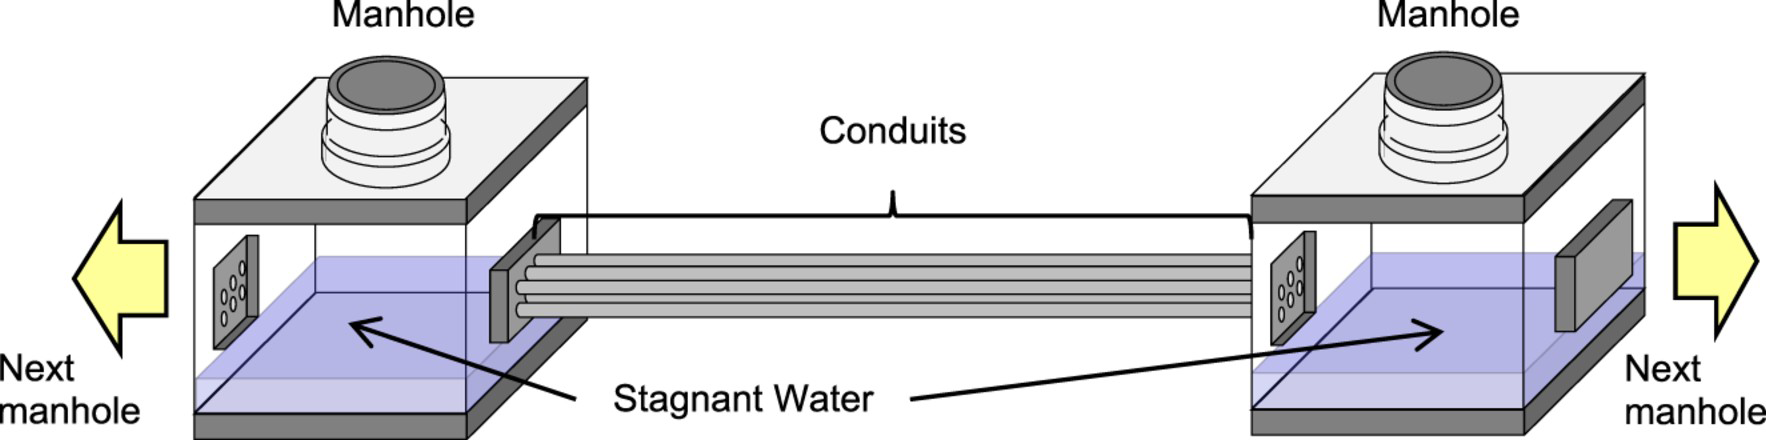
Joint performance affected by corrosion
In order to confirm the corrosion effects on the conduits, joint performance test was carried out. In the test this time, the mean value was 213.8 kN and the standard deviation was 25.8. As against this, the mean value of brand new joints was 233.4 kN as shown in Table 2. The buried joints were found to have the performance of 91.6%, compared with brand new conduits. For research excluding tolerance, it seemed necessary to perform a corrosion rate test after preparing for the non-destructive examination of joint performance [2].
The tested test specimens were taken apart and their corrosion status was also checked. Specific focus was mainly on the inner surfaces of conduits and the screw surfaces. When inspected visually, the test specimens showed no corrosion at the surfaces of engaged screws among the test specimens. The rustproofing agent applied to screw parts might have functioned well where the screws were engaged. Figure 2 shows an example of screw surface.
Example of the surface of screw.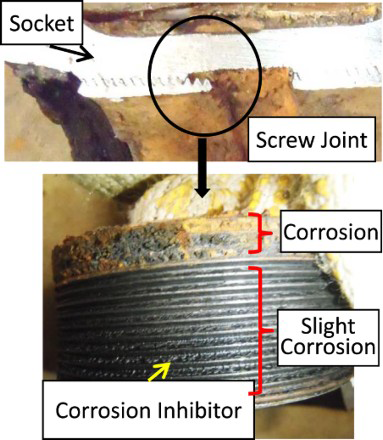
On the other hand, the inner corrosion status showed some differences. Figure 3 shows some cases of inner corrosion. The test specimens could be quantitatively classified into two. One is comparatively suffering severe corrosion where almost the entire surface is corroded. The other is almost free of corrosion. By assuming a normal distribution, a t-test was performed to investigate a difference between test specimens of severe corrosion and slight corrosion. The mean value was 192.6 kN about the test specimen of severe corrosion and 218.0 kN about the test specimen of slight corrosion. The test specimens showed a difference as significant as p < .005. Judging from these observation results, the performance of a joint is very possibly affected by a decrease of the cross-section that is attributable to the inner corrosion of conduit pipe thread.
Examples of inner corrosion.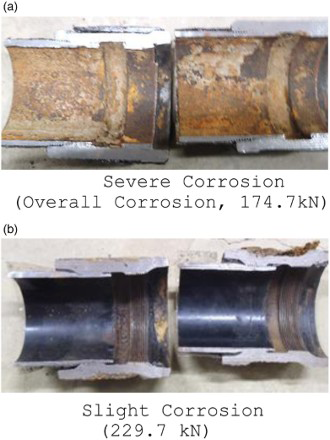
Estimation of speed of manhole corrosion by stagnant water
Research of the inner corrosion rate estimation method
NTT has a large stock of low-carbon steel pipes manufactured in the 1960s and 1970s. Although most of the pipes have remained sound, corrosion will clog some of them and make them vulnerable to earthquakes loading [3]. To avoid these problems, it is important to establish a simple method of obtaining the amount and rate of corrosion in individual conduits in the field.
Some manholes contain stagnant water that comes from a groundwater source or rain. In this research work, to obtain the corrosion rate in the field, the relationship between water quality and corrosion rate was investigated. In previous studies, ions and pH were usually measured to evaluate corrosion in the field [4]. To investigate water quality, ion, DO, and pH were analysed. In addition, the corrosion rates were obtained in terms of polarisation resistance measured with the AC impedance method and low-carbon steel coupons and compared with the water quality data and conduit photographs with polarisation resistance.
Experiment
Water quality analysis
Test specimens were drawn from a clear upper layer of stagnant water. The parameters analysed were  , Cl−,
  ,
,  , pH, and DO.
  was measured by indophenol blue absorptiometry. Cl−,
  , and
, and  were measured by anion ion chromatographs. DO was measured by the diaphragm electrode method. pH was measured by the glass electrode method.
Corrosion rate and solution resistance
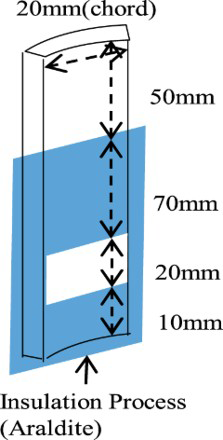
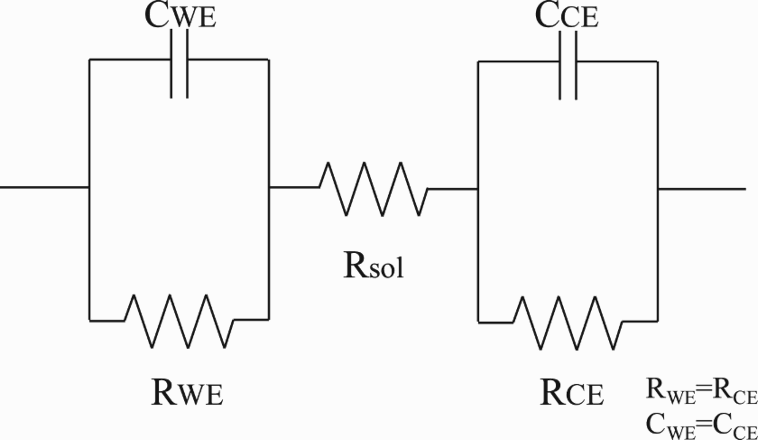
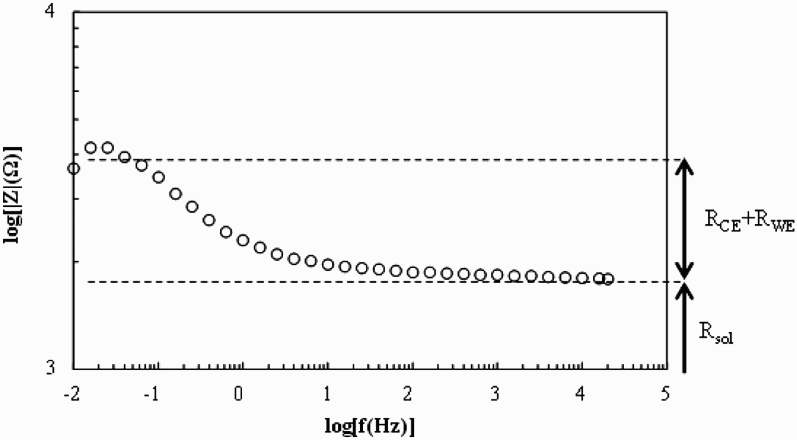
It is known that the corrosion rate varies inversely with the polarisation resistance [5]. The polarisation resistance of low-carbon steel for a conduit was obtained using the AC impedance method (2-electrode method) [6], as shown in Figure 4. The electrodes used were made from a conduit, as shown in Figure 5. The frequency range in the measurement was 10−20 kHz, and the amplitude was 10 mVp-p. The electrodes were immersed in stagnant water for 10 min before measurement, and the electrical potential was measured for 100 s. Five points were measured on each decade. The equivalent circuit used in the 2-electrode method is shown in Figure 6. Polarisation resistance (=R WE =R CE) and solution resistance (R sol) were determined from a Bode diagram, as shown in Figure 7[7].
2-electrode method. Electrode. Equivalent circuit. Example of Bode diagram.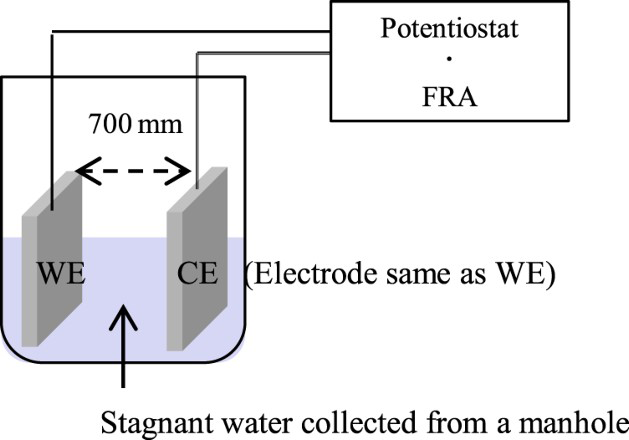
Investigated manholes
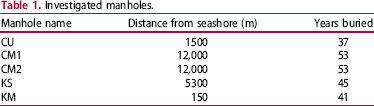
To obtain a variety of data, five manholes at different sites were investigated in this study. The site of each manhole is shown in Figure 8. Manhole and conduit data are shown in Table 1. Each manhole was photographed with conduit nearest to the bottom of the manhole after collecting a water test specimen.
Manhole locations. Investigated manholes.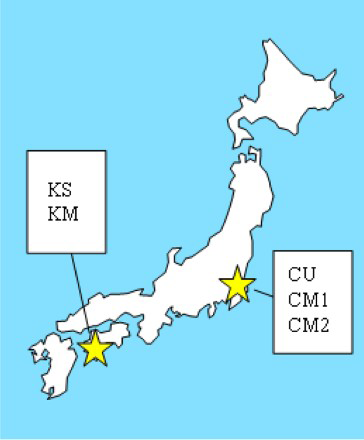
Corrosion rate estimation results and discussion
Water analysis and polarisation resistance
 at any of the sites, the amount of Cl−,
  , and
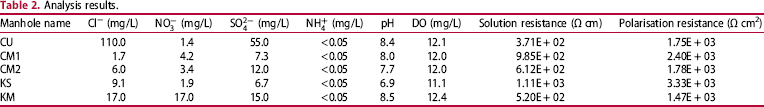
, and  were different at each location. All the test specimens were neutral and contained a fairly large amount of DO.
Analysis results.
 (mg/L)
 (mg/L)
 (mg/L)
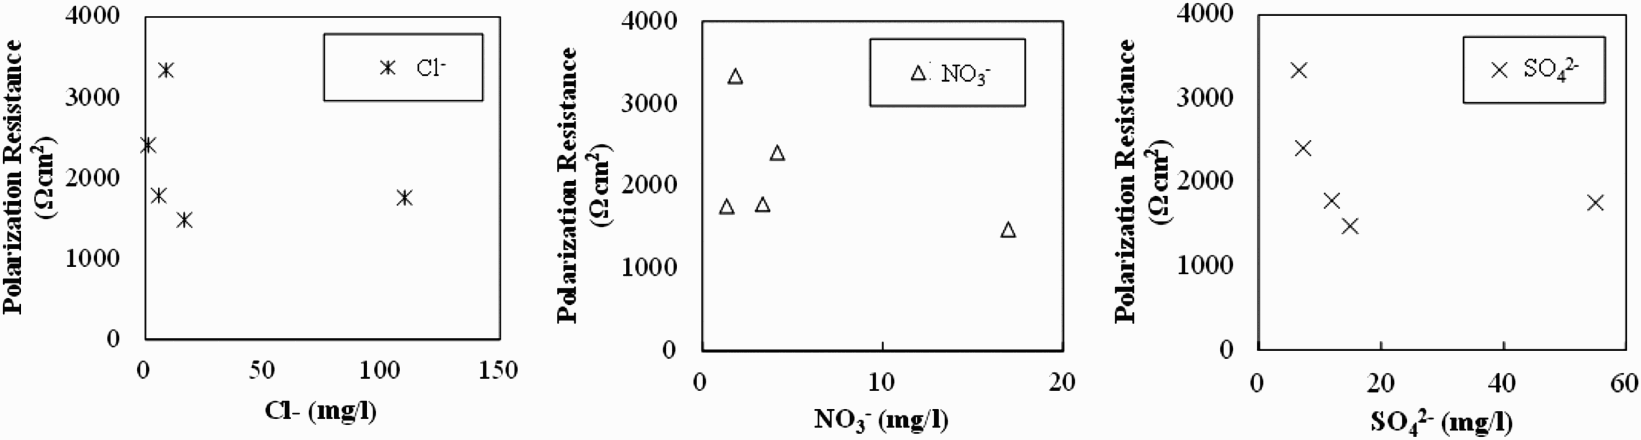
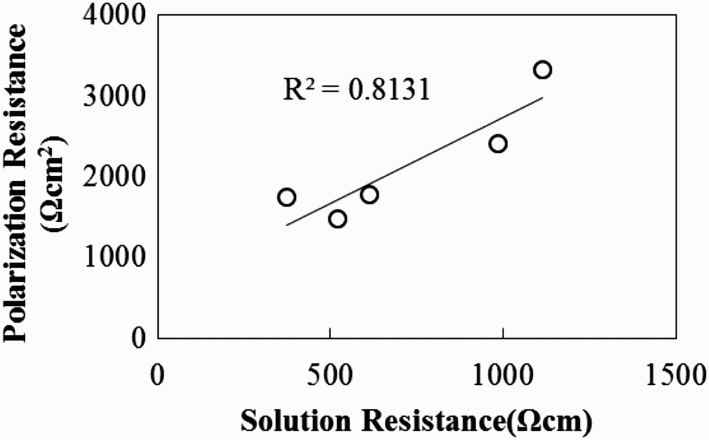
Polarisation resistance has a known relationship with corrosion rate, and attention was focused on the relationships of ions, solution resistance, and polarisation resistance. The relationship between the ions and polarisation resistance are shown in Figure 9. This result showed that the ions were largely unrelated to polarisation resistance. There may be too little Cl− and Relationship between ions and polarisation resistance. Solution resistance versus polarisation resistance. to have an influence on corrosion rate. The solution resistance was also different at each site. Solution resistances and polarisation resistances have a correlation, and the relationship is shown in Figure 10. These results suggest that ions may have a limited effect on corrosion in this situation although ions affect solution resistance; therefore, it is important to measure solution resistance when estimating polarisation resistance in telecommunication conduits.
Comparison of corrosion in conduits with polarisation resistance
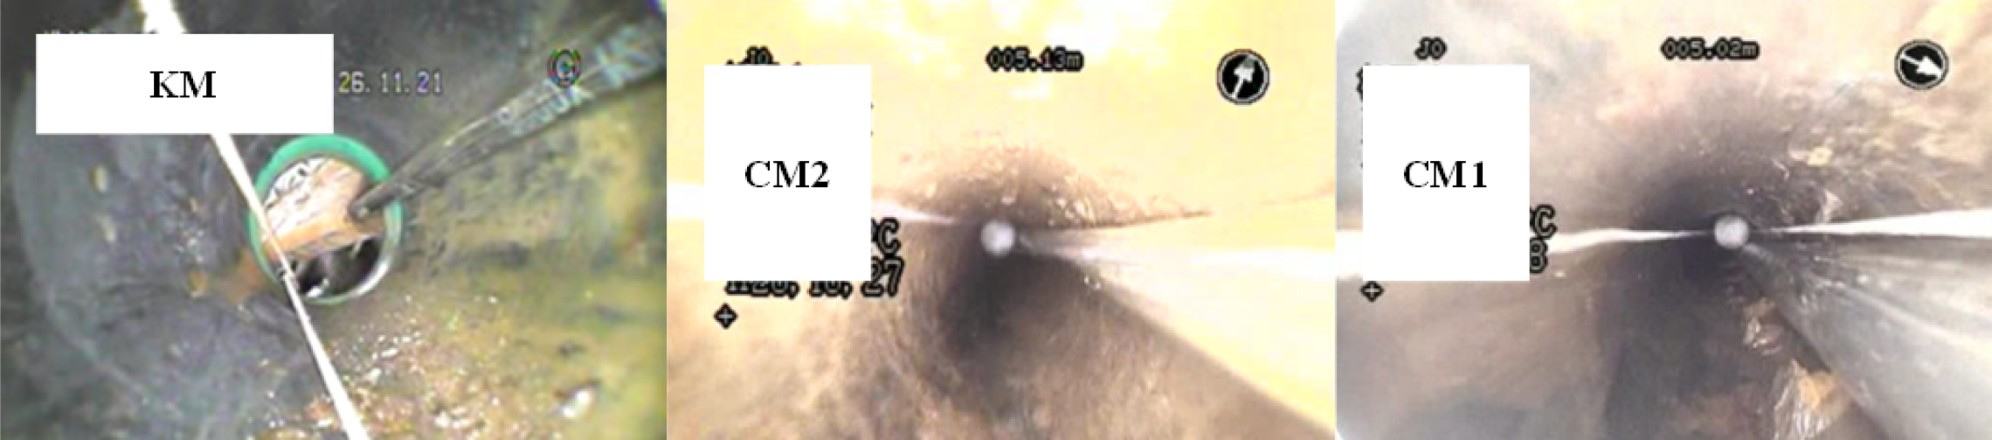
To confirm that polarisation resistance indicates corrosion in a conduit, the results were compared with the photographs. Conduits were investigated at CU, and KS submerged in the stagnant water. In addition to this, conduits were also investigated, which were not completely submerged at KM, CM1, and CM2. The conduits were divided into two groups based on these criteria.
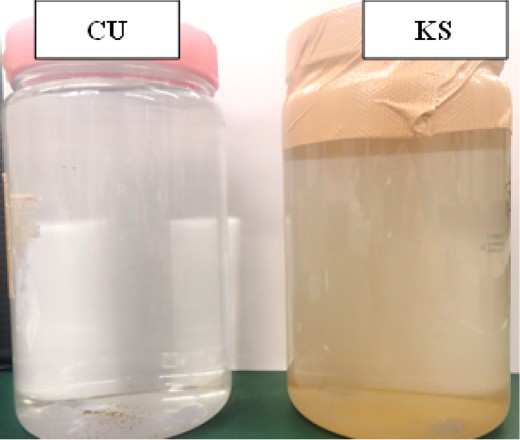
Figure 11 shows the corrosion in conduits at CU and KS. Both conduits have rust along their entire length. However, in the conduit at KS, there was soft mud, and the stagnant water includes small brown particles, as shown in Figure 12. Our observation revealed that the rust at CU was more extensive than that at KS. The polarisation resistances in Table 2 indicate these situations. Figure 13 shows the corrosion at KM, CM2, and CM1. Although there was little rust on the conduits, some rust was observed on the conduit at KM. Polarisation resistance may indicate this corrosion when the number of years each conduit has been buried is taken into account.
Corrosion on conduit (CU, KS). Stagnant water. Corrosion on conduit (KM, CM2, CM1).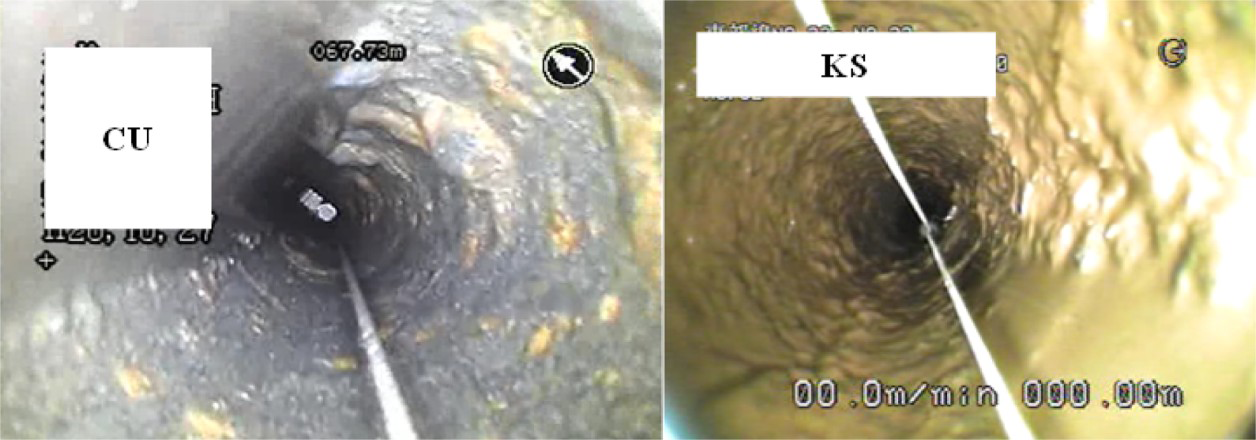
Corrosion rate estimation method
Water analysis data, polarisation resistance, solution resistance, and observed corrosion were reported on a conduit in individual telecommunication manholes. Based on these data, the polarisation resistance was compared with photographs and the water quality data. The following results were obtained:
In the studied situation, ions had a limited effect on corrosion. Solution resistance correlated with polarisation resistance. Polarisation resistance obtained by AC impedance method with low-carbon steel coupon can indicate the corrosion of conduits.
This research clearly indicated the tendency of corrosive effects on early-generation conduits. Future investigations on manholes in the field using the same methods hold a promise of improving the accuracy of forecasting conduit performance across different environments.
Conclusion
This research study was conducted to check the seismic performance of telecommunication conduits about deterioration caused by corrosion. Joints were collected from conduits actually buried for 30-49 years and performed a test of imposing a static load to produce tensile force in the axial direction. Test results and corrosion status of pipe threads sampled as test specimens were surveyed. These results were used to forecast performance deterioration by considering the corrosion rate.
According to the performance test results, the buried joints had lost about 9% of performance on average. However, the dispersion was also wide. Some joints were found to have deteriorated in performance while some showed performance equivalent of brand new conduits. As to the corrosion status, there was almost no rust on the surfaces of pipe threads but inside the pipe threads. The corrosion type was not severe macro-cell corrosion but overall microcell corrosion. The test specimens severely rusted inside showed a tendency for performance deterioration. Judging from these facts, corrosion inside pipe threads might have caused the performance deterioration of joints. It was possible to forecast the deterioration of seismic performance with the passage of time by considering the internal corrosion rate.
Lastly, relationships between the quality of water in individual telecommunication manholes, polarisation resistance, and corrosion rate were evaluated for better performance deterioration forecast. Consequently, it was found possible to check the tendency of conduit corrosion rate by measuring polarisation in actual manholes as proposed in this research. Further investigations need to be carried out on actual manholes by the same method to improve the accuracy.
Footnotes
Acknowledgements
For this research, very useful advice was received from Takanobu Suzuki (Researcher at Toyo University) and staff of Civil System Project, NTT Access Network Service Systems Laboratories: Fumihide Sugino (Department Manager), Mamoru Kanayama (Chief Researcher), and Norihiro Fujimoto (Researcher). Also the cooperation received from JFE Techno-Research Corporation about our experiment is acknowledged.
Disclosure statement
No potential conflict of interest was reported by the authors.