
Abstract
In this paper, the importance of mass transport in localised corrosion process is demonstrated using two examples describing the corrosion behaviour of two types of cut-edge electrodes regarding, (i) the sacrificial dissolution of a sacrificial Zn coating on steel (galvanised steel) and (ii) the release of inhibitors from a primer on an aluminium alloy (AA2024). In the two cases, in situ pH imaging with an ion-selective microprobe is used to confirm, (i) the role of corrosion products on the galvanic current profiles and (ii) the competition between the inhibition and the triggering of the local corrosion activity around intermetallic particles. It is illustrated how the experimental results can be supported by a 2D mass transport modelling.
This paper is part of a supplementary issue from the 17th Asia-Pacific Corrosion Control Conference (APCCC-17).
Introduction
General background
Mass transport is governing the actual electrochemical processes. Even if the electrochemical reactions are controlled at the metal–electrolyte by kinetic processes the corrosion phenomena, the balance between the cathodic and the anodic reactions will depend strongly of the mass transport of reacting species [1].
In electrochemical studies, the objective is mainly to separate hydrodynamics [2] (mass transfer) from electrochemical reactions, whereas in corrosion, as described in this paper, the studies are more focused on the links (coupling) between mass transfer and reactions. From an experimental point of view, specific methods were designed to limit as far as possible the influence of mass transfer or to control it, to reach the actual electrochemical kinetics. It is, for example, the practical objective of the rotating disk electrode. The mass transfer theory [2] was applied to optimise mass balance during the electrochemical process as illustrated by rotating ring disk electrode (RRDE) [3], permitting the detection of products formed by electrode reactions and providing a steady-state method for investigating coupled chemical reactions.
In corrosion science, even if the same techniques have been used to define the mass balance during dissolution or repassivation phenomena (RRDE [4] or channel flow double electrode [5]), they remain very difficult to apply to localised corrosion phenomena.
Study of the effect of mass transfer in localised corrosion
At local scale, i.e. at the micrometric scale corresponding to the scale of the microstructure or to the scale of microscopic defects as described in Figure 1, the effect of the mass transfer in electrolyte is strongly influenced by the physical nature of electrolyte which can, for example, consist in:
a thin film of electrolyte: in this case the oxygen diffusion will be strongly dependent of the thickness of the electrolyte and will be at the origin of the complex description of corrosion processes in atmospheric corrosion [6] a trapped electrolyte: in confined media the oxygen diffusion from the outer to the inner part of the assembly will induce differential aeration which can induce various forms of corrosion as function of the possible reactions outside the ‘crevice’, as could be found for a painted or unpainted aluminium alloy [7]. On the other hand the mass transport of anion (chloride anion) is a critical factor controlling the electroneutrality inside the trapped electrolyte (Figure 1(c)). a droplet of electrolyte: mass transport inside a droplet of water on iron has been described long time ago by Evans by pH indicators showing the effect of the preferential aeration at the outer ring of the droplet [8]. Nevertheless, more complex models are needed to predict the nature of mass transport between droplets which can or cannot coalesce as it is the case in real atmospheric conditions [9]. Typical features of localised corrosion geometry leading to the amplification of the effect of the mass transport of reacting species. (a) Local trenching around coarse IM particles (S or
 phases) at the origin of local trenching on AA2024. ORR reaction will occur on these IM particles after their selective dissolution (Cu enrichment) and the mass transfer will control the change of the pH (alkalisation) on the surrounding area of the particles explaining the local trenching. (b) Typical feature observed during the propagation of a pit on stainless steel. Ohmic drop and salt film precipitation are controlling the evolution of the shape of the pit. (c) Corrosion in assembly governed by the size of the gap between plates (typically in in the range of 100 µm). The mass transport of chloride will maintain the electroneutrality inside the trapped electrolyte.
Regarding corrosion processes, especially pitting corrosion phenomena, the pioneering works of Isaacs [10] and Beck [11] suggesting that the corrosion rate is possibly controlled by the diffusion rate of metal ions out of a pit, were experimentally supported by potentiostatic experiment on one-dimensional (1D) artificial pits. More recently, this experimental approach (1D artificial pit) was revisited using synchrotron X-ray methods for characterising the chemistry and morphology localised corrosion sites in situ [12].
Corrosion processes described in this paper
In this paper, two examples have been selected to illustrate the strategies for probing and modelling the effect of mass transfer of chemical species inside electrolyte considering two typical cases of localised corrosion
self-healing on galvanised steels cut-edges (Figure 2(a)) release of inhibitors from the pigments trapped in a primer coating after a mechanical scratch (Figure 2(b)). Localised corrosion phenomena under mass transfer control. (a) Electrochemical reactions observed on the cut-edge of hot-dipped galvanised steel sheets. (b) Inhibition at the surface of a fresh metal inside a scratch on a coated aluminium alloy (AA2024) (Figure (b) is adapted from Scholes et al. [13]).
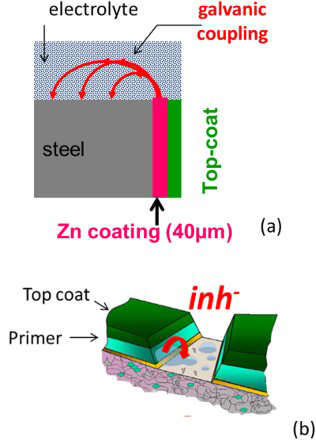
Galvanised steel
Cut-edge characterisations presented in this paper were performed on hot-dipped galvanised steel sheets obtained from ARCELOR MITTAL: the steel and coating thicknesses were, respectively, 5 mm and 40 µm. Aluminium was the major alloying element in the zinc coating, with a concentration between 0.1 and 0.2 wt-%. The steel sheet was cut into coupons of 30 × 15 mm that were embedded vertically in an epoxy resin cured at room temperature. The exposed cut-edge was polished with SiC paper up to the grade 4000 and then, with diamond solution up to the grade 1 µm. The polishing was finished by cleaning with ethanol in an ultrasonic bath for several minutes. An optical observation of the surface with a microscope was performed in order to ensure that the coating was not damaged during the polishing.
Primer-coated AA2024
The cut-edge geometry was chosen to mimic the behaviour of a scratch on a coated sample (see Figure 3(a)). Cut-edge electrodes were machined from rolled plates (100 mm × 70 mm × 4 mm) of an AA2024-T3 coated or not on one side with a chromate-inhibited primer (20-µm thick). The exposed area (4 mm × 10 mm) corresponds to the ST-SL (ST = short transverse; SL = long transverse direction) face of the machined plate.
Cross-section view of (a) a real scratch on an industrial-coated metallic substrate; (b) the same coated metallic plate (coated only by the primer on one face) exposed to the electrolyte on its section. Configuration (b) is defined as a cut-edge electrode (not to scale).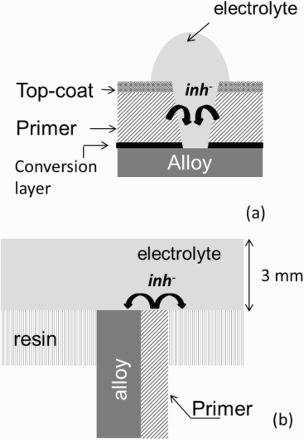
The cut-edge electrodes, which were embedded in a resin, were mechanically ground with successively finer grades of SiC papers lubricated with water. Finally the specimens were polished with a 3 µm diamond paste on cloth polishing pads using alcohol as the lubricant to avoid any selective dissolution of the intermetallic (IM) particles of which the reactivity will be studied.
Local probe techniques and FEM simulation
Current distribution measurements
A commercial scanning vibrating electrode (SVET) (from Applicable Electronics™) was used with the ASET software (Science Wares™). Pt/Ir alloy (80/20%) microelectrodes (Micro Probe, Inc.) were used. These microelectrodes consisted of an insulated Pt-Ir wire with a Pt black deposit at the tip on the order of 20 µm diameter. This deposit leads to an increase of the tip capacity to ca. 10 nF, allowing in the same time an increase in the signal-to-noise ratio [14]. The microelectrode is vibrated at different frequencies (between 200 and 400 Hz) in the parallel and perpendicular direction to the surface, with an amplitude on the order of 60 µm (peak to peak). This experimental setup allows mapping of current over corroding surfaces for electrolyte thicknesses lower than 5 mm. In the present study, the electrolyte thickness was 3 mm. As shown in a previous study this thickness, relevant for corrosion studies in aerated conditions, corresponds to a full immersion condition [15].
The setup is equipped with two cameras, perpendicular and parallel to the sample surface to adjust the probe height and electrolyte thickness. For all experiments, the electrolyte thickness was 3 mm.
Scans were performed perpendicularly to the cut-edge length at heights of 150 µm. The choice of this working distance depends essentially on the magnitude of the current density on the electrode surface: the lower this current, the lower must be the probe height [16]. In the present situation of a galvanic coupling in free potential conditions, the probe height must also be sufficiently low in order to detect an electric field. Moreover the probe height must not be too low in order to limit any artefact, resulting from conductivity gradient next to the electrode surface. Then current profiles are measured inside a medium of non-uniform concentration. For simplicity, only the normal component of the current density vector will be considered.
Basically, the microelectrode probes an electric potential drop  in the electrolyte corresponding to a given vibration amplitude di. If the conductivity κ of the medium is constant and uniform, then the local current density Ji can be expressed with Ohm's law, considering a constant electric field in the spatial domain covered by the tip of the microelectrode

Chemical gradient measurements
The SIET (scanning ion-selective electrode technique) which can measure ion concentrations at picomolar levels, in aqueous media, is the most efficient technique to measure the chemical gradients in the frame of mass transport analysis inside a stagnant electrolyte. In this work, pH profiles were measured as they are representative of ORR
pH profiles were performed using liquid-membrane pH microelectrodes. Borosilicate capillaries (WPI Inc., Ref. 1B150-4) were pulled in a manner to get tapered tips with an internal diameter of 10 µm after polishing. Silanisation sequence of the capillary was similar to that described in Ogle et al. [19]. The capillary was filled with a phosphate (KH2PO4 + Na2HPO4/KCl 0.1 M) buffer solution (pH = 7), except in its sharpened end that was filled with an ionophore resin (cocktail A Fluka – 95297 – Hydrogen Ionophore II). The capillary was mounted on an Ag/AgCl half-cell (WPI ref. MEH7). This pH electrode was fixed on the stage of the 3D motor micromanipulator of the SVET equipment. The potential difference between the pH electrode and a conventional SCE was amplified and recorded using the ASET software. A calibration of the pH electrode indicated a Nernstian response without hysteresis (E SCE = −0.057.pH + 0.418) in the pH range 3-10. As for SVET scans, pH profiles over the cut-edge were performed at a height of 150 µm, with steps of 25 µm, and a measurement period of 1 s/point. Because of the greater sensibility of this technique to electrolyte convection caused by the sensor displacement, a waiting period of 6 s was maintained after each step. In these conditions, the duration of a single line scan was longer than for SVET measurements, i.e. about 20 mn. To be sure of the accuracy of the measurements, the pH probes are always calibrated before and immediately after the end of each experiment.
Two-dimensional modelling
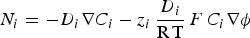
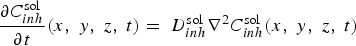
To describe mass transport effect on corrosion processes, coupled electrochemical-transport-reaction (CETR) models were developed to introduce chemical species as carriers for the current in the electrolyte. Ionic currents were calculated by accounting for charge carriers motion in solution, which obeys to the Nernst–Planck equation in the absence of convection effects
The aqueous chemical species considered are function of the system; for example for galvanised steel the species are Na+, Cl−, H+, OH−, O2, Zn2+, ZnOH+, Zn(OH)2(aq), Zn(OH)3 −, CO2, HCO3 −, CO3 2−, ZnCO3(aq).
The mass balance relationship in a stationary mode for each species i is given by
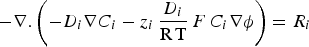
For each simulation, homogeneous chemical reactions must be considered, with their respective equilibrium constants. The reverse forward and backward reaction rate constants of these chemical reactions are imposed sufficiently high so as to maintain chemical equilibria in the whole domain. The fulfilment of local chemical equilibrium was checked a posteriori, comparing the reaction quotient of each reaction with its equilibrium constant. The electroneutrality condition

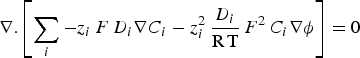
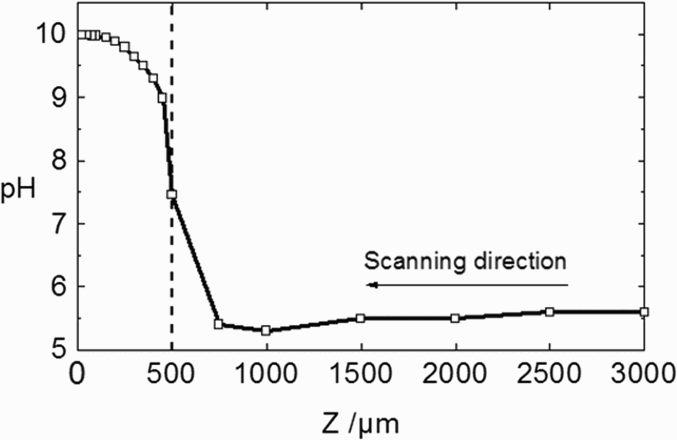
Figure 4 shows the typical geometry used for the CETR model and the corresponding meshing. Finite element method (FEM) simulations were performed, taking into account a diffusion layer. When this diffusion layer is considered, the electrolyte domain is divided into two parts by an inner boundary. From experimental pH probing profile measurements in the vicinity of a metallic electrode surface, the thickness of the diffusion layer was estimated to be approximately 500 µm (Figure 5).
Schematic of the meshing in FEM modelling of diffusion of inhibitor ions. The concentration gradients are located in the diffusion layer δconv (thickness = 500 µm). pH profile normal to the steel surface during immersion of a coated steel cut-edge in a 0.03 M NaCl solution (from Thébault et al. [20]).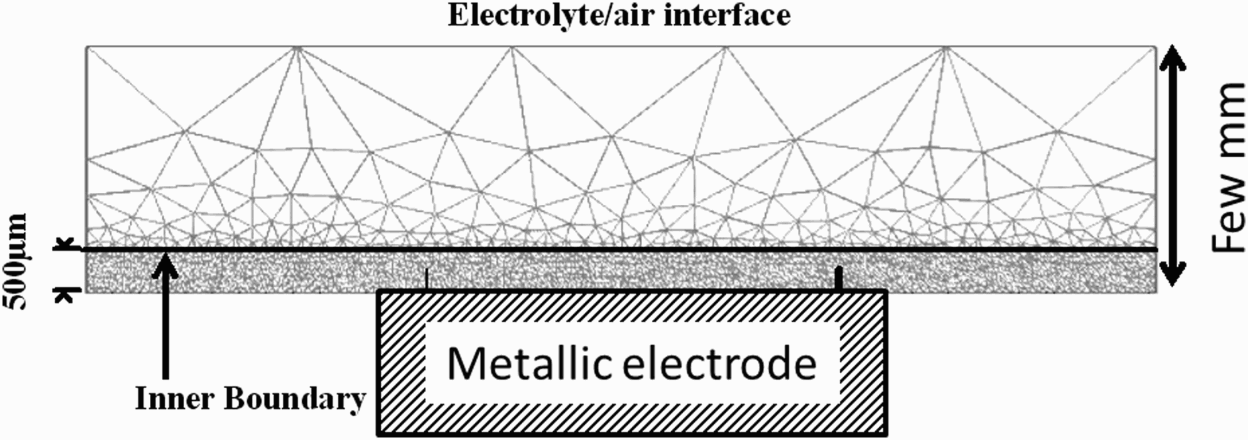
This diffusion layer results from natural convection occurring in a bulk electrolyte. In the inner subdomain, the current is transported by both diffusion and migration. The other subdomain corresponds to the bulk solution where a uniform concentration for all species is imposed thanks to the specific inner boundary conditions fixed between the two subdomains (detailed below). Meshing is refined at the close vicinity of electrodes boundaries, where the highest fluctuations of these variables are expected.
Experimental results
Zinc-coated steel cut-edges
Typical SVET responses observed on cut-edges immersed in chloride solution are represented in Figure 6. The main question, in the analysis of SVET profiles, was to define the origin of the ‘zero current’ domain (area II) which is not possible to explain considering only the pure galvanic effect of the sacrificial Zn coating. The only way to explain this feature was to introduce the effect of mass transfer which can be evidenced by SIET measurements and validated by CETR modelling.
In situ optical image and normal current density profile recorded 50 µm above a zinc-coated steel cut-edge after 40 mn of immersion in a 0.03 M NaCl solution (from Thébault et al. [21]).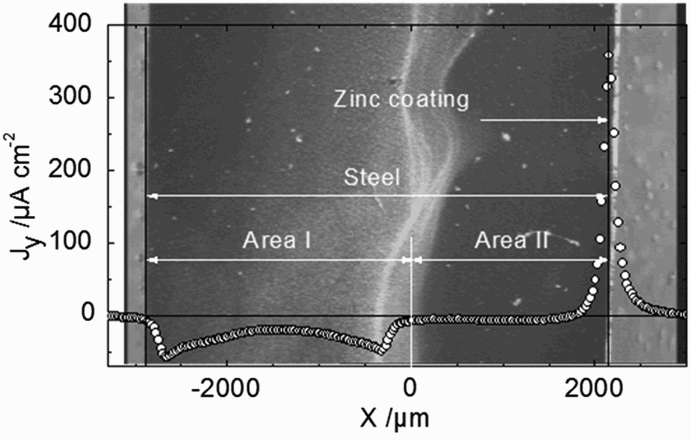
The pH profile (Figure 7) is in agreement with an alkaline pH, resulting from oxygen reduction observed over the steel surface and no net acidification over the zinc coating because of the weak acidity of Zn2+. The experimental pH profile was compared with the calculated pH profile using the CETR model in two situations: first, assuming no cathodic inhibition on the steel surface, and a second, taking into account the total cathodic inhibition occurring over a distance of 1900 µm next to the zinc coating. This distance corresponds to the limit over which precipitation of white corrosion products is observed, and to a cathodic peak current observed in SVET experiments (see Figure 6), resulting from horizontal diffusion of oxygen. It can be seen that a good agreement between experimental and simulated pH profiles is obtained only when a cathodic inhibition is considered over a certain distance of the steel surface.
pH distribution 150 µm above the cut-edge after 3 h of immersion in 0.03 M NaCl solution (from Thébault et al. [20]). (square) = experimental profile;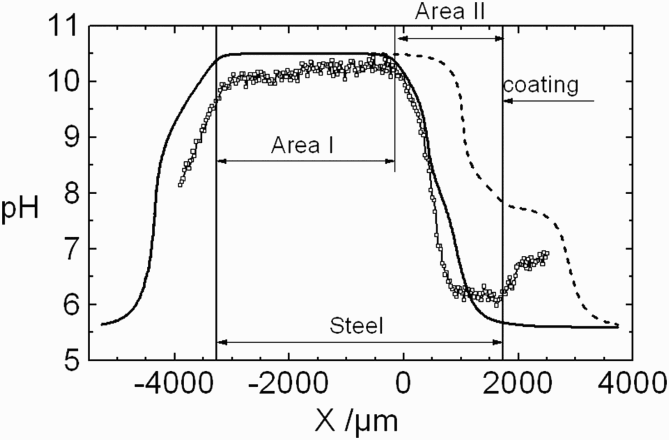
From FEM simulation, the mass transport of Zn species appears as a critical parameter. Figure 8 shows simulated stability domains of several solid phases, with and without consideration of a cathodic inhibition on the steel surface next to the zinc coating (i.e. on area II).
Stability domains of solid phases deduced from FEM simulations. Supersaturation limits are represented by curves below which precipitation is likely to proceed: (a) in the absence of cathodic inhibition; (b) when cathodic inhibition is assumed over a distance of 1900 µm from the zinc coating (ZnCO3(s) is not likely to precipitate in these conditions) (from ref [20]).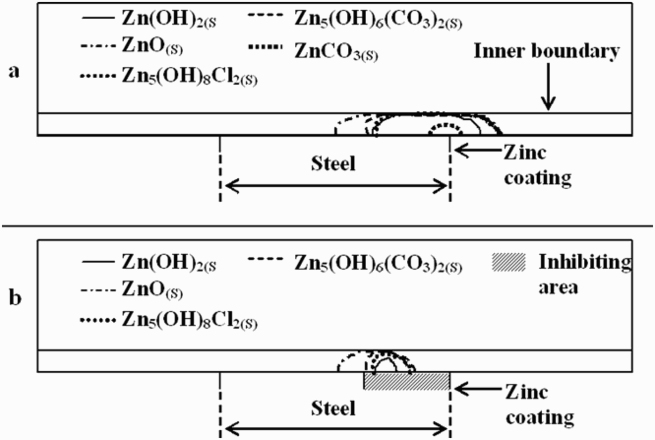
Primer coating on light alloys
Corrosion behaviour in the presence of a protective coating
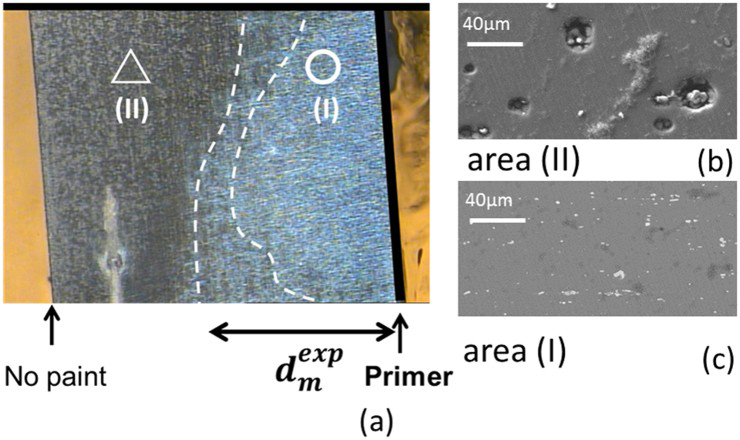
A cut-edge electrode (4 mm) protected on only one face by the primer, as defined in the experimental section, was immersed in 0.5 M NaCl (pH = 6.5) at the open circuit potential. In situ and ex situ observations of the surface show that the edge of the electrode close to the coating (area (I) in Figure 9(a)) is protected, whereas the edge without paint is preferentially attacked (area (II) in Figure 9(a)). Inside the area (II) which represents about one-third of the electrode, localised trenching around IM particles is clearly identified (Figure 9(b)). This experiment clearly confirms that there exists a critical distance ( Immersion at open circuit potential of a cut-edge electrode coated on only one side in a 0.5 M NaCl solution (4-mm width). (a) Top view (optical) of the surface of the electrode showing two areas corresponding, respectively, to the area (II) far away from the coating and the area (I) close to the inhibitor containing coating. (b) and (c) SEM views of the microstructure after immersion. In area (II) local activation by trenching of the IM particles can be detected, whereas in area (I) no damage can be found. Δ and ○ spots indicate the location of the pH measurements given in Figure 6(b) (from Oltra et al. [22]). pH probing above the electrode surface of the cut-edge electrodes after immersion in a 0.5 M NaCl solution (see Figure 9(a)) (from Oltra et al. [22]). (a) Schematic view of the measurement. (b) Normal pH profiles above the coated cut-edge electrode (○ = area I) and (Δ = area II) (area I and II are defined in Figure 9(a)). in Figure 9(a)) at which the chromates released from the chromate-inhibited primer cannot compete with the localised corrosion, which is triggered by the ORR at selectively dissolved IM particles. It can be assumed that this length is controlled by the mass transfer of chromates inside the solution after release from the primer. Normal pH probing above the electrode surfaces of the cut-edge electrodes after immersion in a 0.5 M NaCl solution are schematised in Figure 10(a).
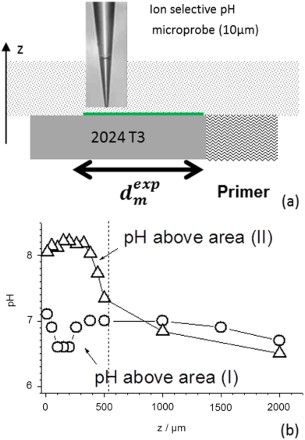
Under short periods, normal pH profiles on the coated cut-edge electrode highlight that ORR is inhibited only in the vicinity of the coated face (area I) (see profile ○ in Figure 10(b)), whereas the IM particles remain active far away the coating (area II) (see profile Δ in Figure 10(b)) as observed on the unprotected cut-edge electrode. These latter results confirm the efficiency of pH probing (normal pH profile) for imaging the competition between the local trenching which occurs very rapidly and the release of chromates from the primer.
Two-dimensional modelling of mass transfer control of inhibition
To support the existence of a critical distance for localised corrosion (boundary between areas I and II in Figure 9(a)) corresponding to a critical time for which the chromate concentration is not sufficient to inhibit the corrosion process, an FEM modelling of mass transport, in the electrolyte, of the inhibiting ion was tested.
In a pioneering work [23], the ‘hierarchy’ of localised corrosion attack of IM particles was defined. The authors defined a succession of stages (hierarchy) which appeared to be related to the activity of the IM particles. For the S-phase, they mentioned that initially the S-phase particles corrode very quickly by dealloying followed by trenching; this process is completed after 5 min (Figure 11).
Definition of a critical time (tIM) for the triggering of trenching for the most sensitive phase of an AA 2024-T3 (S phase) (adapted from Boag et al. [23]). AA2024-T3 specimens were immersed for various times up to 120 min in 0.1 M NaCl. The development of the corrosion around isolated IM particles was monitored by SEM-EDS analysis as function of time of immersion (from Oltra and Peltier [24]).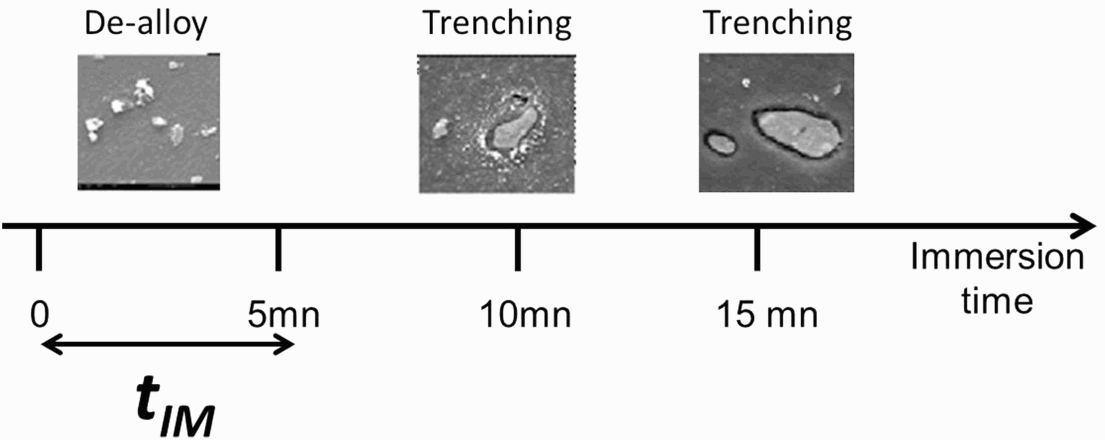
FEM simulation of the diffusion in the bulk electrolyte of inhibitors ions leached from the primer coating was performed for the most efficient leaching regime, i.e. the instantaneous leaching from a freshly exposed primer (such as after a scratch). This regime was characterised by an apparent flux F max for Cr207 − ions deduced from ICP-AES measurements to be around 2.10−3 mol m−2 s−1 [24]. As in the case of cut-edge on galvanised steel, the mass transport regime which is assumed to exist in a quiescent solution imposes the existence of a diffusion boundary layer in natural convection, δ conv, fixed at 500 µm (see Figure 4). The evolution of the chromate concentration gradient as function of time has been calculated by solving Fick's second law (Equation (6)) for only one inhibitor ions (inh = Cr2O7 −) assuming all the concentration gradient confined in the diffusion layer, δ conv, estimated at 500 µm in thickness for a quiescent solution.
 (inhibitor concentration in solution) and
  (diffusion coefficient of the inhibitor ion in solution).
 was fixed to 10−9 m2 s−1.
All 2D simulations are numerically performed using an FEM, implemented in the ‘Chemical Engineering’ module of the COMSOL® software package (Figures 4 and 12(a)).
FEM modelling of the mass transport of the released inhibitor from of a localised source (cross-section of the paint film exposed to the electrolyte: same conditions than in Figure 9) (from Oltra et al. [22]). (a) Schematic of the meshing in FEM modelling of diffusion of inhibitor ions. The concentration gradients are located in the diffusion layer δ conv. (b) Definition of the threshold value C pass for chromate inhibition for an Al 2024 –T6 in 0.6 M NaCl (from Peltier et al. [18]). (c) The intersection of the iso-concentration line,  (x,0,t) = 10−5 M with the line t(x,0)= 5mn defined a transition above which the cut-edge cannot be protected because the critical concentration C pass (>10−5 M) is not reached before 5 min (tIM). This transition defines the critical distance (
 ).
).
Considering
the diagram presented in Figure 12(c), explained why if inhibitors cannot reach the metallic surface beyond  in a time shorter than the critical time (tIM), IM particles, S-phases in particular will be activated.
This critical distance  , around 2 mm, corresponds to the contrast defined by optical observations (Figure 9(a)) and confirmed by pH probing (Figure 10(b)) showing two typical areas at the surface of the cut-edge electrode painted on only one face. It can be concluded that
  is closed from
  confirming the mass transport of the inhibiting ion (Cr2O7 −) is, as can be expected, a critical step in corrosion inhibition. Consequently, the very simple experiment described in Figure 9, which can be complemented by local pH probing, could be used to test rapidly, for the example, the aging of a primer coating (test on a depleted coating) or to compare the efficiency of non-chromate functional coatings on the corrosion resistance of self-repairing aircraft structures.
Conclusion
Using local chemical (SIET) and electrochemical (SVET) probe techniques, the importance of the mass transfer upon the protective properties of a sacrificial zinc coating (for large steel to zinc surface area ratio) and the efficiency of inhibitor ions release from a primer coating on an aluminium alloy were highlighted probing the corrosion of the same type of cut-edge electrode.
In situ surface pH probing under open circuit potential conditions confirms the structuration of the exposed surfaces due to precipitation of corrosion products for galvanised steel and the localised corrosion of IM particles above a critical distance of the primer coating. This latter can be explained by the fact that inhibitors cannot reach the metallic surface beyond  in a time shorter than a critical time, tIM, characterising the high sensitivity of IM particles. These experimental results were supported by 2D mass transport modelling considering the regime of convective diffusion in a quiescent solution. A basic diffusion model was used in the case of inhibitors, whereas a more complex model based on the solution of the complete Nernst–Planck equation was applied to predict the localisation of the precipitation of the Zn corrosion products.
Footnotes
Acknowledgements
The author thanks B. Vuillemin for his contribution to the supervision of the PhDs.
Disclosure statement
No potential conflict of interest was reported by the author.