
Abstract
Sigma phase generally precipitates in duplex stainless steel during slow cooling, which usually causes loss in both corrosion resistance and fracture toughness. To develop a non-destructive method to detect the sigma phase in duplex stainless steel for in situ use in the quality management of large structures, the double-loop electrochemical potentiokinetic reactivation behaviour of continuously cooled duplex stainless steel SUS329J4L at different cooling rates was investigated under different conditions. The polarisation condition with the solution of 0.5 M H2SO4 + 0.01 M KSCN + 0.5 M NaCl and the potential scanning rate of 0.83 mV s−1 were determined as suitable and sensitive.
This paper is part of a supplementary issue from the 17th Asia-Pacific Corrosion Control Conference (APCCC-17).
Keywords
Introduction
When duplex stainless steel is slowly cooled from a near solution annealing temperature, sigma (σ) phase usually precipitates and results in loss of toughness and corrosion resistance [1–5]. In particular, even a small amount of σ phase, such as 2-3%, in duplex stainless steel can cause significant embrittlement at room temperature [1–3], which largely restricts the utilisation of the steel. Therefore, it is important to know the amount of σ phase in steel [1 -13] and accordingly to determine the critical cooling rate during thermal treatments required for processing and fabrication [2,6,7]. For detecting σ phase precipitation in duplex stainless steel, there are several methods such as the metallographic examination, the impact test, and the ferric chloride test, which are conducted in accordance with ASTM A923 tending to determine the presence of detrimental intermetallic phase for mill products [14,15]. In the previous study [16], the authors found different sensitivities in detecting the presence of σ phase among the above three tests on continuously cooled SUS329J4L steel. The result indicates that the impact test is sensitive enough to respond instantly to minute change of the σ precipitation. However, this method is destructive for steel; therefore, it is not suitable to be applied in ready-made huge structures.
On the other hand, like the vicinity of chromium carbide in sensitised austenitic stainless steel, it is considered that a chromium-depleted region should also form around the chromium-enriched σ phase [6,17]. Therefore, the detection of the chromium-depleted region directly relates to the detection of σ phase, which gives a possibility that we can try to use the electrochemical potentiokinetic reactivation (EPR) test to detect the presence of σ phase in duplex stainless steel easily [18,19]. Číhal and Štefec reviewed the development of electrochemical potentiokinetic reactivation method and indicated a possibility that EPR test could be used to examine the decomposition of ferrite to intermetallic compounds of σ phase and carbides [19]. Davison and Redmond tried the EPR test to a duplex stainless steel of 2205 (ASTM A240) aged at 1116 K from 300 s to 1.2 ks and concluded that no reactivation peak was found [15]. Lopez et al. performed EPR in a testing a solution containing 0.01 M KSCN + 2 M H2SO4 + 0.5 M NaCl on duplex stainless steel of UNS S31803 after aging at 948 and 1173 K for several hours. Their results indicated that the EPR ratio seemed proportional to the σ content [17]. These results showed that the EPR condition applied to the duplex stainless steel should be modified, because the ordinary solution of 0.5 M H2SO4 + 0.01 M KSCN is only just suitable for austenitic stainless steels containing less chromium [18,20]. The solution is not aggressive enough to trigger the reactivation of the passive film containing higher contents of chromium and molybdenum. If a modified EPR test condition with high sensitivity for detecting the σ phase in duplex steel is confirmed, it is useful to develop an in situ method to detect the presence of the σ phase in ready-made large machines or structures.
In this study, after the SUS329J4L duplex stainless steel was cooled at several continuous cooling rates from the solution annealing temperature, the double-loop EPR (DL-EPR) polarisation measurement was carried out on the steel under various conditions. The EPR ratios were compared as well as the observation of the dissolution of the chromium-depleted region, and the optimum measurement condition was chosen for obtaining high detection sensitive of σ phase.
Experimental
Specimen, heat treatment and impact test
Chemical composition of SUS329J4L duplex stainless steel except iron (wt-%).

DL-EPR test
Various conditions used in EPR measurement.
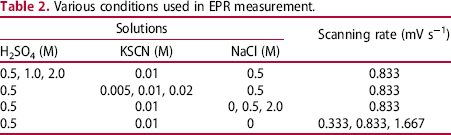
The DL-EPR test was performed in a typical three-electrode electrochemical cell, where a platinum plate was used as the counter electrode and a saturated calomel electrode (SCE) was used as the reference electrode. The working electrode of the specimen was polished by a 2000 grit paper following with ultrasonic cleaning in acetone. Before the EPR test, the electrode surface was sealed with a silicone sealant leaving only a test surface of about 100 mm2. The test cell was put in a water bath set at a constant temperature of 303 ± 2 K. The solution was deaerated by nitrogen gas bubbling for 1.8 ks before the polarisation and through the polarisation. In the polarisation, the specimen was kept at the open circuit potential (OCP) for 0.3 ks, following a cathodic polarisation at −1.0 V (vs. SCE) for 60 s and again kept at the OCP for 0.3 ks. After that, the polarisation started with potential sweeping rate of 0.83 mV s−1 from −0.6 to 0.3 V and then the scan of potential was reversed to −0.6 V.
Figure 1 shows a schematic DL-EPR curve, where I a is the forward peak of activation current and I r is the backward peak of reactivation current. The EPR ratio was obtained from I r/I a. After the DL-EPR test, the surface of polarised specimen was observed with the scanning electron microscope.
A schematic DL-EPR curve.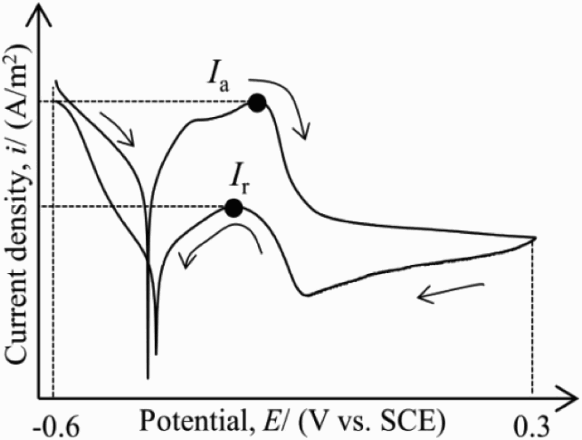
Results and discussion
XRD analysis and impact test
Figure 2 shows the XRD patterns of the SUS329J4L duplex stainless steel after being continuously cooled at various cooling rates ranging from 0.02 to 1.0 K s−1. Both the ferrite (α) phase and austenite (γ) phase were detected in each specimen. Moreover, the diffraction peaks from the sigma (σ) phase appeared from the specimens cooled at 0.2 K s−1 and under, and their intensity tended to increase with decreasing cooling rate. This result indicates the formation of σ phase in the steel when the slower cooling rate was applied at 0.2 K s−1 and under. Much slower cooling rates were applied, more σ phase was precipitated. In general, the σ phase is produced together with a new austenite (γ′) phase from the original α phase. As a result, much more chromium and molybdenum elements are enriched in the σ phase, together with the new γ′ phase with less chromium and molybdenum [10,12,21]. Furthermore, it is believed that there is a chromium-depleted vicinity around the σ phase [6,17], which should cause prior dissolution there, although no direct composition analysis can be found up to now.
XRD patterns of steel being cooled at various cooling rates.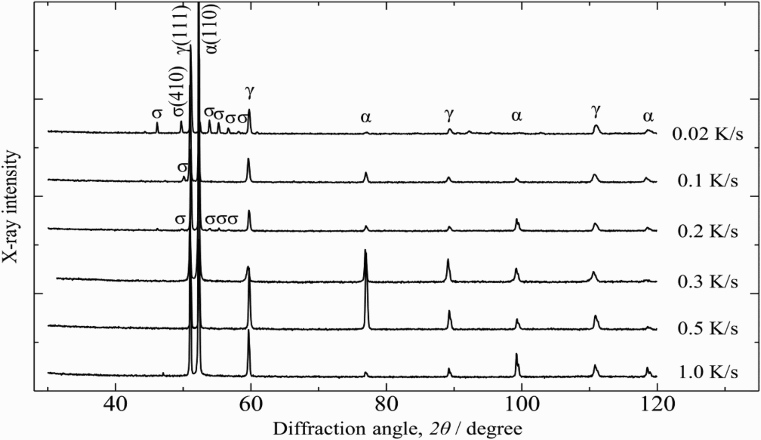
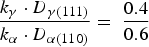
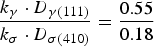
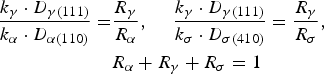
The σ phase quantification using the XRD results was approximately calculated out as follows [22]. First, the ferrite area and austenite area of the corresponded peaks detected from the continuously cooled steel at 1.0 K s−1 were determined by the metallographic observation at the ratio of γ: α = 0.4:0.6, considering there is none of (or only much little of) σ phase. The identification of σ, γ and σ phases in metallographic observation was performed by both the EDS and the electrolytic etching analyses in KOH solution. The relationship is expressed by Equation (1).
XRD peak area and sigma phase percentage, obtained from XRD patterns of steels being treated at various cooling rates.
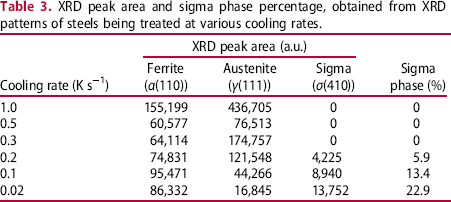
Figure 3 shows the Charpy absorbed energy values of steel being cooled at various cooling rates. Once the absorbed energy reduced sharply at 0.5 K s−1 and under, it lowers gradually with the decreasing cooling rate. The absorbed energy variation corresponds well with the content of precipitated σ phase as being detected in the XRD analysis. The fractured surface appearances showed ductile fracture at 1.0 K s−1, quasi-cleavage fracture at 0.5-0.1 K s−1 and cleavage fracture at 0.02 K s−1. Chen et al. introduced a ductile/brittle boundary in a 2205 duplex steel containing 2-5% sigma phase with an impact value of 32 J in a full-size Charpy specimen [3]. It is assumed that the σ phase-induced embrittlement is involved in this case, and 0.2 K s−1 may correspond to the definition of ductile/brittle boundary given in Figure 3.
Cooling rate, rc/(K s−1).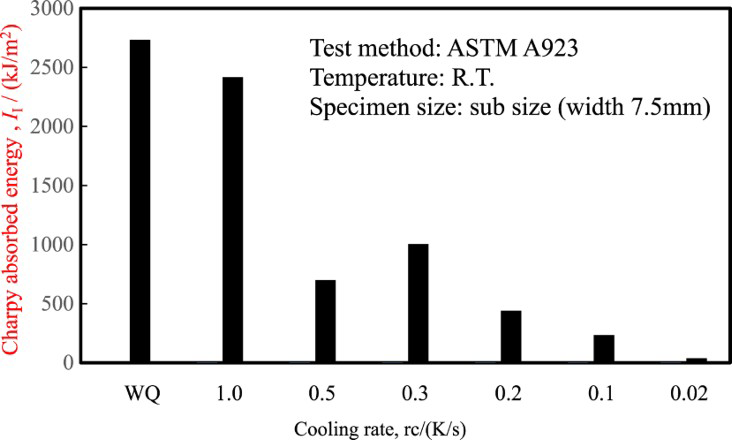
Polarisation and EPR ratios of steel cooled at 0.1 K s−1
The steel being cooled at 0.1 Ks−1 with a small amount of σ phase was chosen as the standard specimen to check the efficiency of various EPR polarisation conditions. The standard solution of 0.5 M H2SO4 + 0.01 M KSCN was used as the standardised condition in comparison.
Scanning rate
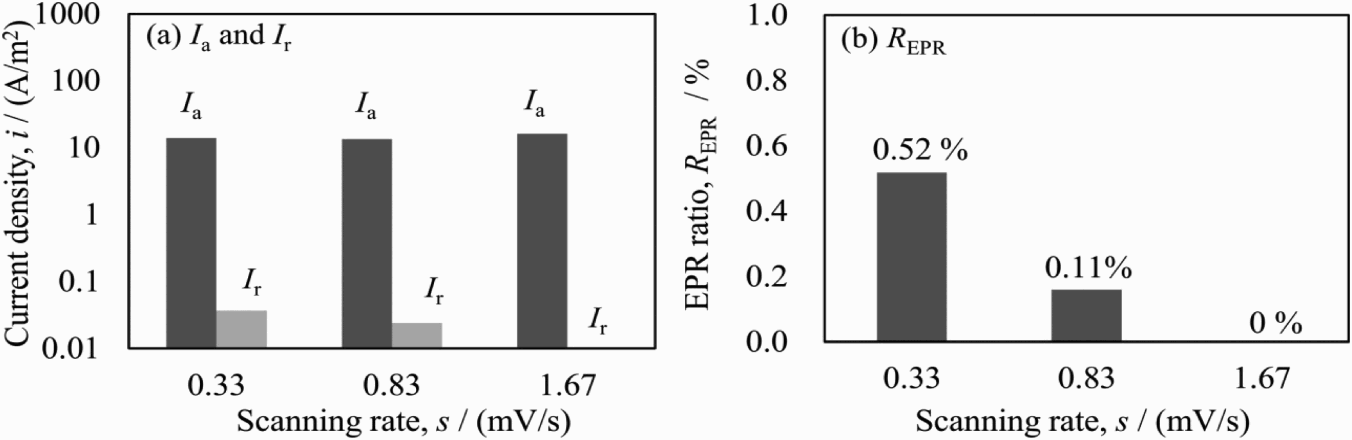
EPR polarisation was carried out with different potential scanning rates of 0.33, 0.83 and 1.67 mV s−1 on the specimen being cooled at 0.1 K s−1 in the standard solution of 0.5 M H2SO4 + 0.01 M KSCN. The polarisation curves are shown in Figure 4. In the forward scanning, two current peaks, which correspond to the active dissolution from the α phase (about −0.34 V) and the γ phase (about −0.25 V) appeared [23–26]. In the active zone, both general corrosion from the entire surface and selective corrosion from grain boundaries and chromium-depleted regions might occur. In the backward scanning, the passive current density was lower than that from the forward scanning, meaning the formation of the passive film on the surface. The reactive dissolution of the steel appeared during the backward scanning of potential. The reactive current value was lower than that of the active one; therefore, the dissolution was considered as mainly from the chromium-depleted region adjacent to σ phase. Therefore, the EPR ratio (I r/Ia) can be used to present the content of σ phase. The reactive current changed with different scanning rates and the obtained EPR ratio is shown in Figure 5. The slower scanning rate was applied, the higher I r and EPR ratio were obtained, and no reactive dissolution occurred at the scanning rate of 1.67 mV s−1. It is considered that the longer stay of the potential in the reactivation region at a slower scanning rate should have caused the easy dissolution of metals around the σ phase. Meanwhile, the value of I a did not change with the scanning rate, perhaps due to the less passive film after the cathodic polarisation at −1.0 V for 60 s. Although higher EPR ratio can be obtained at 0.33 mV s−1, the 0.83 mV s−1 is chosen as suitable in the following measurement, considering the much longer measurement time at 0.33 mV s−1. The cathodic current in the negative loop, during anodic polarisation at reverse scanning should be related to the dissolved oxygen in solution.
DL-EPR polarisation curves at various scanning rates in solution of 0.5 M H2SO4 + 0.01 M KSCN. EPR parameters (I a, I r, R EPR) obtained at different scanning rates in solution of 0.5 M H2SO4 + 0.01 M KSCN.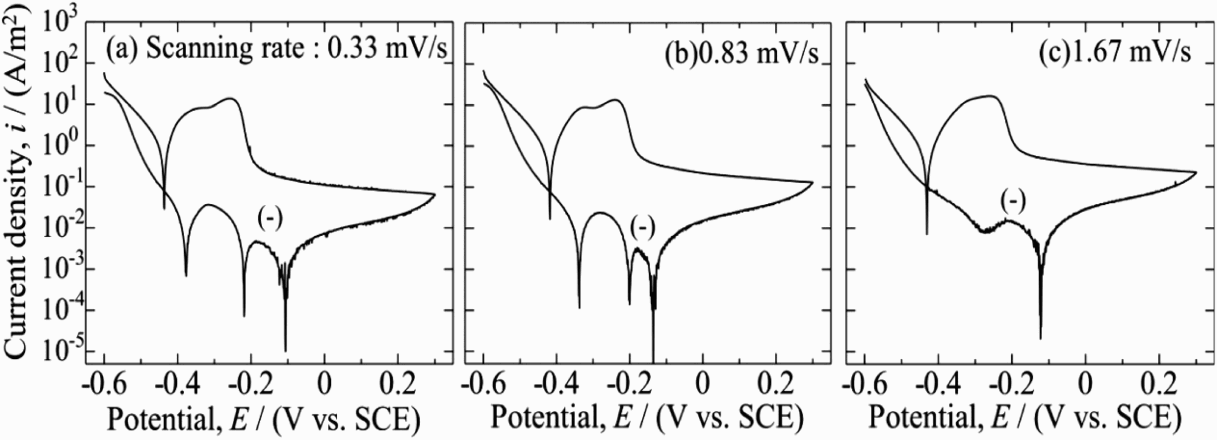
NaCl concentration
Figure 6 shows the EPR ratios obtained in solutions of 0.5 M H2SO4 + 0.01 M KSCN + x M NaCl with various NaCl concentrations at the scanning rate of 0.83 mV s−1. Both I a and I r increased with the increase in the NaCl concentration; however, the increment ratio of I r was much larger than I a, which resulted in the higher EPR ratios at the NaCl concentration of 0.5 and 2.0 M. Cl− ions in solution generally attack the entire surface in the active region, which resulted in gradual increase in I a. On the other hand, in the reactivation region, Cl− might mainly promote the dissolution of metals from chromium-depleted zones adjacent to σ phase, which easily caused the larger increment of I r. Therefore, the addition of NaCl in the solution is helpful to obtain higher EPR ratio on the duplex steel. As a result, the largest EPR ratio was obtained by adding 0.5 M NaCl in the solution.
EPR parameters (I a, I r, R EPR) obtained in solutions of 0.5 M H2SO4 + 0.01 M KSCN + x M NaCl with different concentrations of NaCl.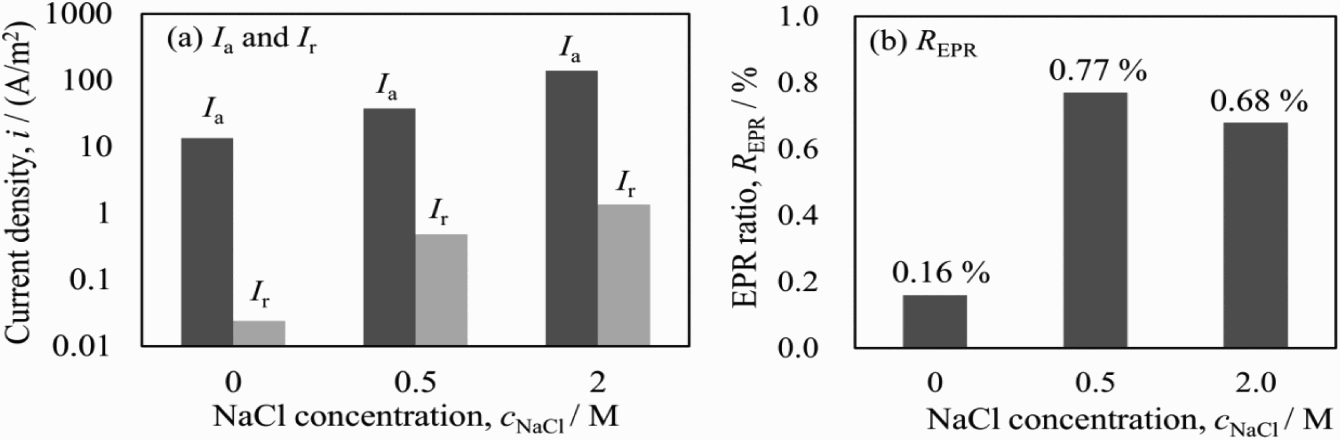
H2SO4 concentration
Figure 7 shows the EPR ratios obtained in solutions of x M H2SO4 + 0.01 M KSCN + 0.5 M NaCl with various H2SO4 concentrations at the scanning rate of 0.83 mV s−1. I a increased slightly with the H2SO4 concentration from 0.5 to 1.0 M, which corresponds to the corrosion from the entire specimen surface, especially when the cathode polarisation was applied at −1.0 V to remove the passive film before the EPR test. Higher concentration of H2SO4 plays a role in promoting dissolution at active region. On the other hand, no obvious change can be found in I r, which means that the reactive dissolution from the chromium-depleted region is relatively immune to be accelerated by more protons. This resulted in the higher EPR ratio in H2SO4 concentration of 0.5 M. In addition, the solution with 2.0 M H2SO4 was also tried. However, it was considered as unsuitable, because the corrosion frequently occurred at and around sealant of specimen in the polarisation.
EPR parameters (I a, I r, R EPR) obtained in solutions of x M H2SO4 + 0.01 M KSCN + 0.5 M NaCl with different concentrations of H2SO4.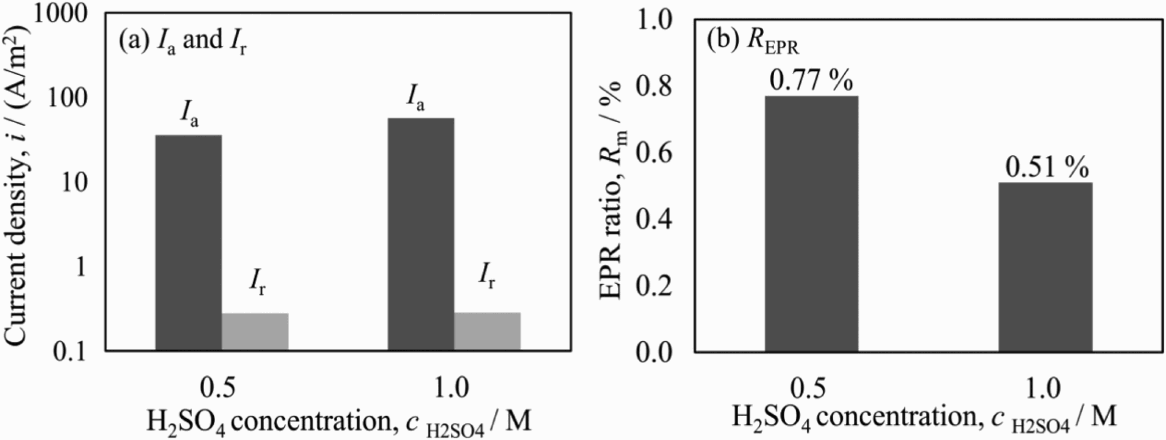
KSCN concentration
Figure 8 shows the EPR ratios obtained in solutions of 0.5 M H2SO4 + x M KSCN + 0.5 M NaCl with various KSCN concentrations at the scanning rate of 0.83 mV s−1. With the increase in the KSCN concentration, no substantial change can be found in I a. On the other hand, I r sharply increased with the KSCN concentration from 0.002 to 0.005 M and then kept slow increasing in 0.01 and 0.02 M KSCN. This indicates that KSCN can be activated in the same manner as NaCl, but not at the active potential. On the other hand, much large amount of SCN− can also cover the chromium-depleted region, which weakens the promotion of the dissolution of metal [27]. As a result, the largest value of the EPR ratio was obtained at 0.01 M KSCN.
EPR parameters (I a, I r, R EPR) obtained in solutions of 0.5 M H2SO4 + x M KSCN + 0.5 M NaCl with different concentrations of KSCN.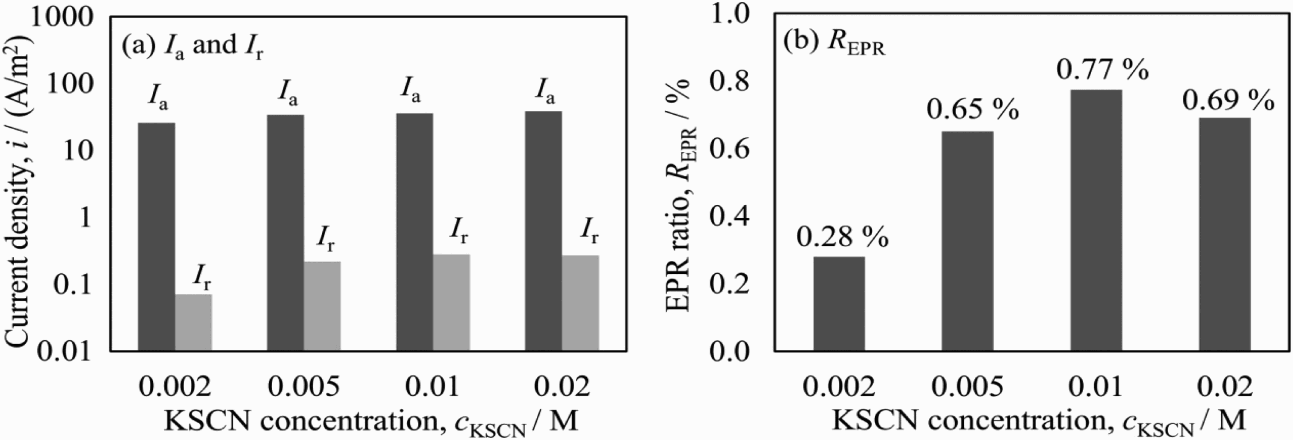
According to the above measurements, the suitable condition for getting large EPR ratio on the specimen cooled at 0.1 K s−1 should be the solution of 0.5 M H2SO4 + 0.01 M KSCN + 0.5 M NaCl and the scanning rate of 0.83 mV s−1. It is expected to detect the presence of σ phase in the steel with high sensitivity.
EPR ratios of steel cooled at various cooling rates
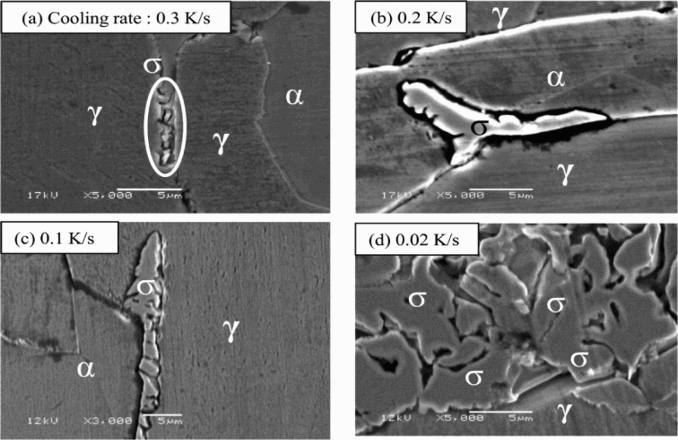
Figure 9 shows the activation current, reactivation current and EPR ratios of several specimens when cooled at various cooling rates, in the selected EPR solution of 0.5 M H2SO4 + 0.01 M KSCN + 0.5 M NaCl at the scanning rate of 0.83 mV s−1. The reactivation current trends down with the increase in cooling rate. There is a faint reactivation current at 0.5, 1.0 K s−1 and no reactivation was found at 0.3 K s−1. On the other hand, obvious reactivation current was found at 0.2 K s−1 and under. Furthermore, a remarkable increase in both activation and reactivation current was recognised at 0.02 K s−1. Many features of reactivation current correspond to the Charpy impact test; therefore, the EPR ratios could be interpreted as the degree of degradation in duplex stainless steel due to the precipitated σ phase. The specimen surfaces after the EPR polarisation are shown in Figure 10. According to this observation, the precipitated σ phase was found in either of the specimens and the amount of σ phase decreased with the increase in the cooling rate. Moreover, the dissolution around the σ phase was clearly confirmed, indicating the presence of a chromium-depleted region.
EPR parameters (I a, I r, R EPR) of specimens with different cooling rates obtained in solutions of 0.5 M H2SO4 + 0.01 M KSCN + 0.5 M NaCl at 0.83 mV s−1. SUS329J4L surfaces after DL-EPR measurement with γ, α and σ phase as well as the dissolution around σ phase.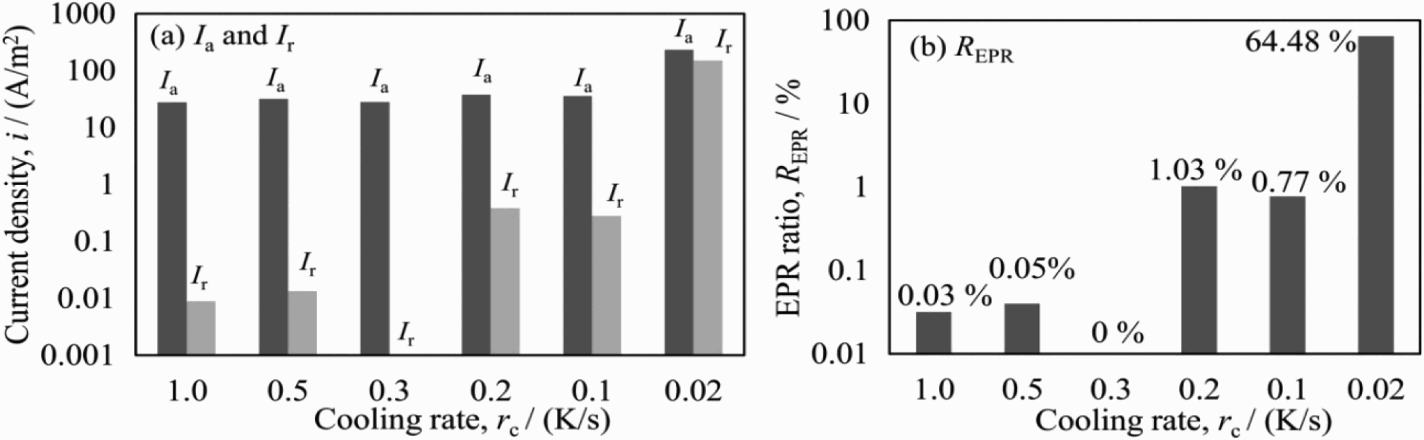
When such EPR polarisation was applied on large structures using a small cell being attached to the structure surface out of laboratory and without any sample preparation, it is possible to determine the presence of σ phase in duplex stainless steel structure. This will be helpful in saving the maintenance cost and improving the safety of machines and structures. Of course, the DL-EPR ratio mainly responds to the vicinity of the chromium-depleted region but not the σ phase itself. Therefore, the EPR ratio varies with either of the shape, the distribution as well as the amount of σ phase in the steel. Moreover, in long duration of isothermal aging, if recovery of chromium from adjacent ferrite (α) or new austenite (γ′) phase occurs through diffusion, the EPR ratio should be also verified. Therefore, the application of this method to other thermal processes should be carefully evaluated. Although the modified DL-EPR method in this work is still a postulation for solving the problems in detecting σ phase, it is at least useful to judge the critical cooling rate corresponding to the precipitated σ phase.
Conclusions
To detect the presence of the sigma phase precipitated during continuous cooling in SUS329J4L duplex stainless steel, the XRD analysis and DL-EPR test were carried out. In the DL-EPR test, potential scanning rates and various solutions were applied on duplex stainless steel continuously cooled at various cooling rates. The following results are obtained.
In the XRD analysis, sigma phase precipitation was detected in the SUS329J4L duplex stainless steel when the steel was continuously cooled to the room temperature at cooling rates of 0.2 K s−1 and under. The amount of sigma phase increased with the decrease in the cooling rate. The highest reactivation ratio was obtained on the 0.1 K s−1 continuously cooled SUS329J4L steel when using the EPR solution of 0.5 M H2SO4 + 0.01 M KSCN + 0.5 M NaCl at the potential scanning rate of 0.83 mV s−1. By applying the optimum modified DL-EPR condition, 0.5 M H2SO4 + 0.01 M KSCN + 0.5 M NaCl solution at the potential scanning rate of 0.83 mV s−1, on the duplex stainless steel treated at the cooling rates ranging from 1.0 to 0.02 K s−1, the presence and the amount of the precipitated sigma phase in SUS329J4L steel was detected with high sensitivity.