
Abstract
This work focuses in monitoring the corrosion processes on copper in a slightly saline environment under oxic conditions, which simulated the first part of high-radioactive waste disposal in bentonite. Besides coupled multi-electrode arrays (CMEA), also electrochemical impedance spectroscopy measurements were implemented. It was expected that this combination of methods would define the general corrosion rate, as well as the spatio-temporal evolution of anodic and cathodic processes. Anodic currents measured by CMEA showed that the corrosion rates decreased with time. Since maximum anodic activity switched between the electrodes, this situation was not individually valid for all the electrodes. At the end of exposure, different spectroscopic techniques were applied in order to identify the modes of corrosion and types of corrosion products. Uneven general corrosion without evident pits was indicated.
This paper is part of a supplement on the 6th International Workshop on Long-Term Prediction of Corrosion Damage in Nuclear Waste Systems.
Introduction
Copper is the material chosen for the fabrication of nuclear waste disposal containers in both the Scandinavian and the Canadian high-level radioactive waste disposal programs. Copper as a material has also been considered for Japan, Korea, and other European locations (the Czech Republic, the UK), but decisions about its use have not yet been made. In a geological repository copper canisters will be backfilled with compacted bentonite clay [1]. In the multiple barrier approach, copper, next to bentonite and an inner iron-based container, forms a barrier to the release of radionuclides.
Copper corrosion in a deep geological environment has been studied extensively [1–5].The initial rate of Cu corrosion will be determined by factors such as moisture, oxygen, temperature and the presence of aggressive groundwater [1]. In the longer term the corrosion process will evolve towards a steady state at a rate depending on the corrosive environment (chemical composition, pH, resistivity), and the metallurgical properties of the container.
The purpose of this research was to study the corrosion behaviour of copper in a bentonite environment, saturated with saline groundwater at an open-circuit potential under oxic conditions by means of a coupled multi-electrode array. Its aim was to detect the type of corrosion attack, and to evaluate the corrosion rate.
The advantage of coupled, multi-electrode array (CMEA) measurements over other methods is that they allow simultaneous spatial and temporal measurements of electrochemical processes at locally addressed sites. They also allow the monitoring of the real-time processes that take place on the electrode surfaces under selected conditions. Measuring with different types of electrode arrays seems to be an advance in the study of electrochemical noise (EN). The first type of such arrays consisted of uncoupled electrodes, i.e. a so-called wire beam electrode [6,7]. Coupled electrode arrays, which allow measurements of partial corrosion currents, appeared slightly later [8]. At the very beginning, they were used for the study of the spatio-temporal electrochemical behaviour of metals in different electrolytes [8,9]. Later on, they were used to study crevice corrosion [10,11], corrosion evolution under coatings and in soil [8], and for the monitoring of steel corrosion in concrete [12]. Different names are still used, but the term ‘coupled multi-electrode array’ (CMEA) has been accepted for the type of array configuration where the distribution of anodic and cathodic currents over time can be followed.
Scully's group has worked intensively on the study of the pitting corrosion of copper in a drinking-water environment [13–15]. In chlorinated drinking water, the coupled multi-electrode array method was able to detect pitting corrosion under certain water chemistry conditions that could not be predicted from a comparison of open-circuit potential to critical potentials alone, because of the coupling of anodic and cathodic reactions [13]. Furthermore, it was shown that CMEAs can enable the detection of localised and severe corrosion events in potable water when compared to the pit charge obtained from upward potential scans. This is because short-lived pits might not be detectable by final visual analysis, so that CMEA was shown to be an advanced detection technique for pitting by investigating the individual electrochemical properties of anodes and cathodes formed on a micrometer length scale [14].
Our previous studies were conducted mainly with the aim of studying the corrosion behaviour of Cu waste containers in the early emplacement period, when oxidising conditions could prevail due to the oxygen trapped upon sealing of the deep geological repository. The possibility of monitoring copper corrosion in bentonite by using copper electrical resistance probes has been shown by the authors [16,17], where electrochemical impedance spectroscopy was used as a supporting method to monitor the corrosion rate during a 4-year exposure period [18]. Post analysis showed that the copper underwent localised general corrosion with corrosion rates of less than 1 µm/year [19]. Since our monitoring techniques provided answers on a micro scale with averaging the corrosion events on the working electrode, the next step was considered to be the observation of the spatial and temporal activities of copper in a bentonite environment by the use of copper CMEAs.
In this study, the use of CMEA for monitoring copper corrosion in bentonite saturated with saline groundwater in the oxic period was demonstrated. Measurements with a CMEA sensor were monitored for 4 weeks. Electrochemical impedance spectroscopy was implemented on various combination of connected electrodes at the end of exposure period, in order to compare the localised and general electrochemical results. Finally, microscopic and spectroscopic investigations of the surface modifications after exposure in the bentonite/saline groundwater were investigated. An attempt to correlate the nature of the electrochemical results and the corrosion products was made.
Experimental
Preparation of the samples, solutions and methods
Copper electrode wires with a diameter of 1.40 mm were assembled, in epoxy resin, into a 5 × 5 matrix (Figure 1). In total, 25 electrodes were electrically coupled together with zero resistance ammeters (ZRAs) to form the galvanically coupled electrode surface. Currents were measured at a frequency of 1 Hz and a ±50 µA range. 16 bit A/D converter was used, which resulted in a 1.526 nA resolution.
Schematic presentation and a photograph of the copper CMEA system.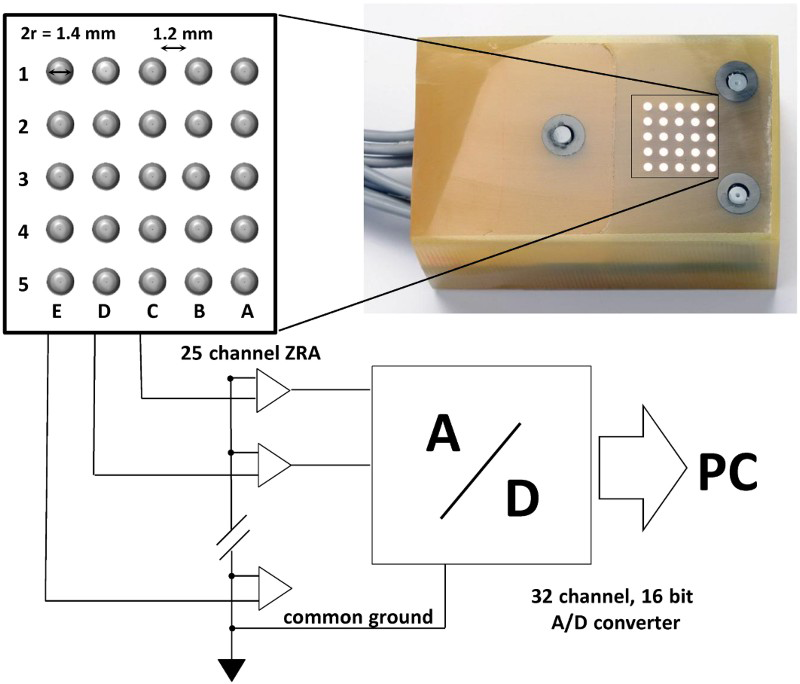
The nominal surface area of one copper electrode was 0.0154 cm2, and that of the whole CMEA matrix was 0.385 cm2. The edge-to-edge distance between the electrodes was 1.2 mm. Prior to the measurements, the specimens were abraded with 1200-grit emery paper, ultrasonically degreased in ethanol for 3 min, and then dried. The exact structure of the array, as well as the electrical configuration for the measurements, has been described in our previous work [12].
The saline groundwater was prepared from analytical grade chemicals so that it resembled the groundwater from Aspö Groundwater Laboratories, which we used in previous research. The Aspö groundwater consisted of 0.181 mM Cl–, 0.44 mM HCO3 –, 4.6 mM SO4 2– and 0.005 mM HS–. Among the cations, 10 mM Na+, 0.28 mM K+, 47.3 mM Ca2+ and 2.4 mM Mg2+ were present [2]. For the preparation of the simulated groundwater solution, only sodium compounds were used. The pH of this simulated groundwater was 7.2 at 21°C.
The bentonite slurry was prepared by mixing 45 g of bentonite into 200 mL of groundwater until a thick and homogeneous suspension was obtained. The main mineral constituent in bentonite clay (Wyoming bentonite, MX-80, ∼75% montmorillonite) is sodium montmorillonite, with a sheet-like crystal structure [2]. The bentonite slurry was poured into a pond, designed over copper electrodes. The pond had dimensions of approximately 7 × 10 cm. A 1.5-cm-thick slurry layer was poured over the CMEA electrodes and covered with a parafilm in order to avoid drying out. The overall exposure time was 4 weeks (29 days).
A three-electrode corrosion cell was used, with four (4) Cu electrodes connected into one working electrode. The exposed area was 0.06 cm2 for four electrodes and 0.015 cm2 for one electrode (system P7). An Ag/AgCl electrode served as the reference electrode and graphite as counter electrodes. A Gamry ref 600 + potentiostat/galvanostat, with a FRA module, was used for the electrochemical impedance spectroscopy measurements. The frequency scan ranged from 65 kHz to 5 mHz at 10 points per decade with an AC amplitude of ±5 mV. The absolute impedance and phase angle were measured at each frequency. The impedance measurements were carried out at open-circuit potential (OCP) at the end of the 4-weeks long experiments (29th day). The impedance data were interpreted on the basis of equivalent electrical circuits, using the Zview (Scribner) program for fitting experimental data.
SEM/EDS and Raman analysis
A low-vacuum JEOL 5500 LV, JEOL, JAPAN (Japan) scanning electron microscope, equipped with energy-dispersive spectroscopy (EDX) Oxford Inca (Oxford Instrument Analytical, UK), was used to observe the surface products formed, using an accelerating voltage of 20 kV. The amount and type of corrosion damage was evaluated.
The Raman spectra were obtained with a Horiba Jobin Yvon LabRAM HR800 Raman spectrometer coupled to an Olympus BXFM optical microscope. The measurements were performed using a 632-nm laser excitation line, a 100 × objective lens, and a 600-grooves/mm grating, which gave a spectral resolution of 1.99 cm–1/pixel. The power at which the samples were set was 0.14 mW. A multi-channel, air-cooled CCD detector was used, with integration times of between 20 and 35 s. The spectra are presented without a baseline correction.
Results and discussion
CMEA measurements
The electrode events on the copper CMEAs were monitored during 29 days of exposure in bentonite, soaked with saline groundwater. As can be seen from Figure 2(a), the cathodic and anodic activity is high during the first week of exposure. During this period, the cathodic and anodic activity switched several times between the electrodes (Figure 2(b,c), 1st day, 5th day). The maximum anodic current densities were up to 80 µA cm−2, but it is clear that these high currents were not persistantly generated at a particular electrode. Thereafter, up until the end of the first 15 days, the anodic fluctuations were roughly between 20 and 40 µA cm−2, whereas the maximum cathodic current densities were approximately –20 µA cm−2, with some short-lived peaks of up to –5 µA cm−2. In the last part of the exposure, the anodic currents were significantly reduced, and the exchanging of anodic and cathodic sites between the electrodes was also minimised (Figures 2(b,c), 29th day).
CMEA measurements for 29 days in bentonite/saline groundwater environment; (a) the measured partial currents; (b) a detailed view of the activities for 25 electrodes on the 1st day, 5th day, and the last day of exposure; (c) a detailed view on the 1st day, 5th day, and the last day of exposure.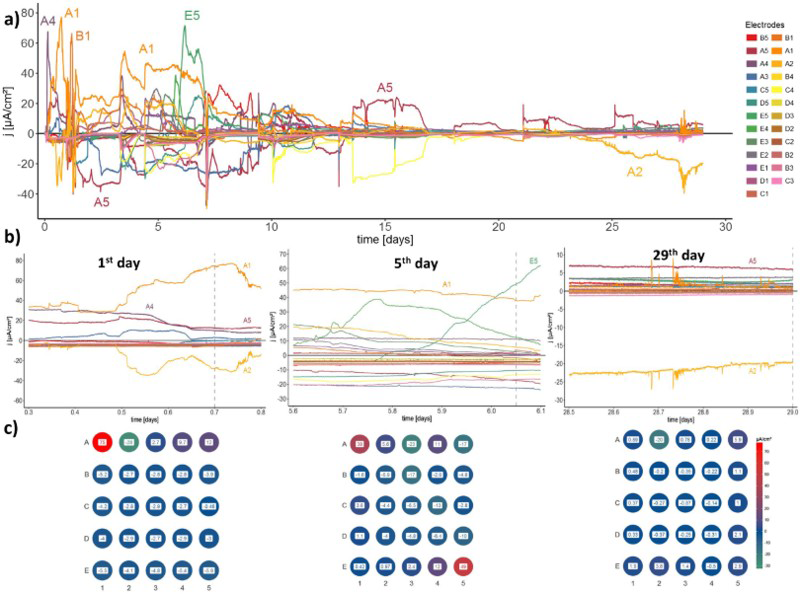
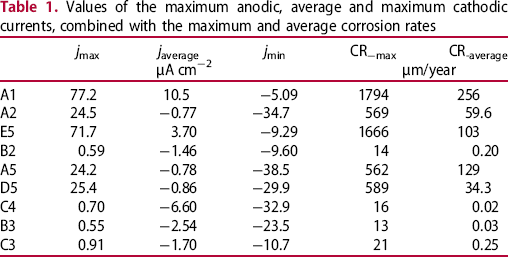
Values of the maximum anodic, average and maximum cathodic currents, combined with the maximum and average corrosion rates
From the current densities measured on the copper CMEA electrodes, the corrosion rate was calculated. The corrosion rate CR, in μm/year, was calculated using Faraday's law [20,21] as follows
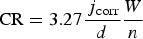
The maximum and average corrosion rates (in µm/year) are presented for selected electrodes in Table 1. The maximum corrosion rates are a simple transformation of the maximum anodic currents, using Equation (1). The average corrosion rates were estimated by time integration of the anodic electrochemical currents, which were consequently divided by the entire time of exposure and transformed to a corrosion rate according to Equation (1). The average corrosion rates (in µm/year) for all the individual electrodes are presented in Figure 3(a). It can be seen that a few electrodes exhibited relatively high corrosion rates (above 100 µm/year). The corrosion rates of some electrodes were modest (between 30 and 120 µm/year), whereas the corrosion rates of most of the other electrodes were fairly low. Although no distinct pattern of intensively corroded electrodes could be defined, it is clear that they are located at the edge of the array. It can be seen from the measured anodic currents (Figure 2(a)), however, that the anodic activities on these electrodes were not coincident. Moreover, only one or two of the electrodes (not close together) corroded actively at the same time.
(a) The average corrosion rate on individual electrodes during the 29-day exposure to oxic conditions in bentonite/saline groundwater slurry, and (b) the sum of the anodic current density and the corrosion rate during the exposure over the entire area of the electrodes.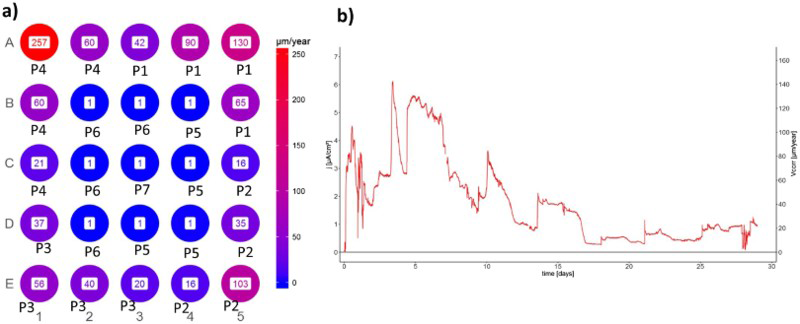
The general corrosion behaviour of copper in the bentonite slurry was indicated by the sum of all the measured anodic currents, which is presented as an anodic current density over the entire area of the electrodes (Figure 3(b)). It can be seen that, after a few initial spikes, the total current decreased from roughly 140 to nearly 10 µA cm−2. Certain fluctuations appeared, however, during the exposure. A comparison with the partial anodic currents (Figure 2(a)) showed that these fluctuations are related to the births of anodic activity on the individual electrodes. The highest overall corrosion rate was approximately 140 µm/year, whereas the average corrosion rate of all the electrodes in the CMEA during the exposure period was roughly 60 µm/year. The overall corrosion rate at the end of the experiment was close to 20 µm/year.
SEM and spectroscopic analysis
The morphology of the corrosion products that developed on the copper after the 29-day exposure to the bentonite/groundwater slurry was observed by SEM (Figure 4). From observations of the corrosion products on the surface of the 25 copper electrodes, it can be assumed that uneven general corrosion took place. Three types of morphological products were found on the electrodes. The majority of the electrodes were covered with very fine, round-shaped corrosion products, with particles having sizes of 1-2 µm, similar to the ones shown in Figure 4(a). Only a few electrodes are covered with well-defined rhomboidal crystals of sizes 10-15 µm (Figure 4(b)). Some electrodes were found to have an irregular distribution of small and larger crystals.
SEM images of the corrosion products after 5 weeks of copper exposure to the bentonite/saline groundwater solution in oxic conditions, and their electrode activity for electrode A1 (a), electrode A5 (b) and electrode B3 (c).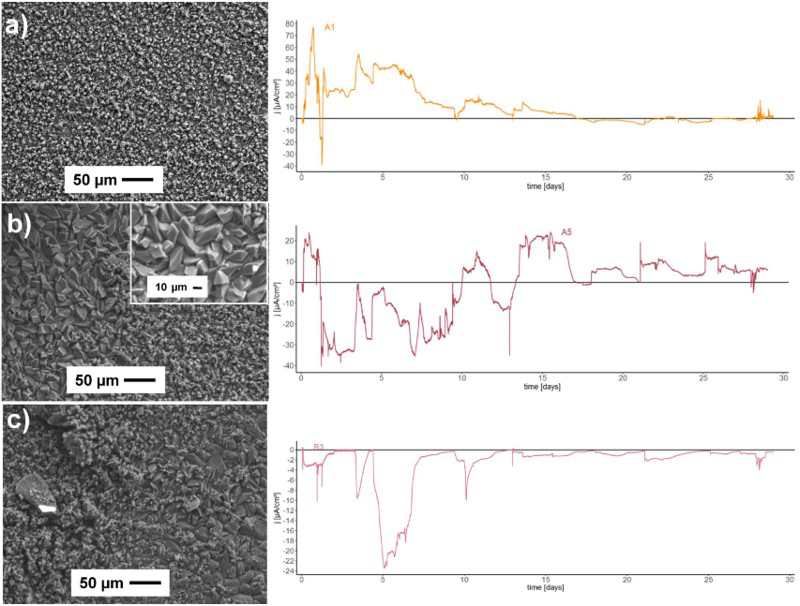
Several different, mostly anodically behaving (electrodes A1 and A5) and the most cathodically behaving (electrode B3) electrode areas were analysed. By analysing the measured current at individual electrodes, it was possible to observe that the long anodic intervals at the beginning of the exposure time led to the formation of fine round particles of cuprite film (Figure 4(a)). During the cathodic intervals at the beginning of exposure time and the intense anodic activity towards the end, large rhomboid-shaped crystals developed (Figure 4(b)). The mostly cathodic activity generated a non-homogeneous structure of different morphologies (Figure 4(c)). No pitted areas were found during the analysis of the SEM images.
It should be mentioned that, similarly as in our study of steel corrosion [22], the electrodes in the CMEA were also analysed by the X-ray computed tomography (CT). However, no visible damage was observed on the individual copper electrodes. Since the three-dimensional resolution (1 voxel) of the analysis was 4 µm, the interpretation of these results was somewhat limited. The total damage of the most corroded electrode (A1), which was estimated from the measured anodic current, was roughly 25 µm (over the entire area of 0.385 mm2). It could be expected that any distinct localisation of this corrosion damage (larger or deeper pits) would also be detected by the CT analysis. Since no such localised corrosion damage was observed and the average currents were different for individual electrodes, uneven general corrosion was indicated as the main type of damage.
The results of Raman analysis showed that the main corrosion product was cuprite; the Raman spectra are presented in Figure 5. The fine round particles on electrode A1 were found to be cuprite. The main bands for the cuprite are positioned at 146, 216, 522 and 618 cm–1. A detailed characterisation is given in a paper by some of the authors of this study [23]. On electrode A5, calcite was found, with the main bands positioned at 150, 280, 711 and 1083 cm–1. The calcite covered the corrosion products from the copper surface, since they could not be rinsed off after exposure in the bentonite. Otherwise, the rhomboid-shaped crystals were assumed to be cuprite. Their morphology is very similar to that previously reported in a study of copper exposed to bentonite slurry [24]. Similarly, the bands for cuprite and calcite were found on electrode B3 (Figure 5(c)). No sulphides were found or detected, although they were expected due to the consistency of the groundwater solution which contains small amounts of sulphides. Also, no cupric(II) corrosion products such as paratacamite were found after the 29-day exposure in the bentonite that was soaked with saline groundwater [24].
Raman spectra of the corrosion products of the copper electrodes after 5 weeks of exposure to the bentonite/saline groundwater solution in oxic conditions. (a) the corrosion products on electrode A1, (b) the corrosion products on electrode A5 and (c) the corrosion products on electrode B3.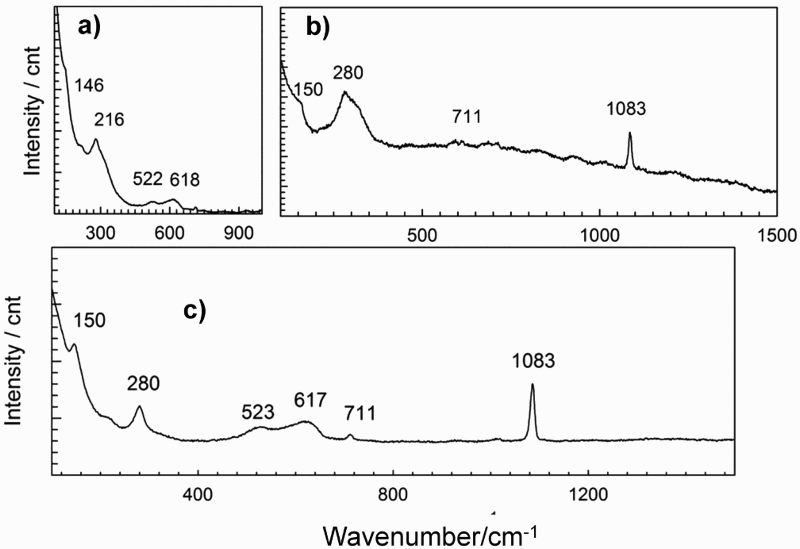
Electrochemical impedance spectroscopy
Electrochemical impedance spectroscopy (EIS) was implemented on various combinations of the connected electrodes at the end of the exposure time. Four electrodes were connected together to make a single working electrode. Their arrangement is schematically presented in Figure 3(a) as the mark ‘Px’. It is well known that EIS measurements provide results about the present electrochemical condition of an electrode, but this state can also be the result of previous activities. The Nyquist and Bode plots of the EIS spectra measured at the end of the exposure time are presented in Figure 6.
Nyquist and Bode plots on the copper array – each measurement was performed on four coupled electrodes, denoted as Px (x = 1-7) in Figure 3(a).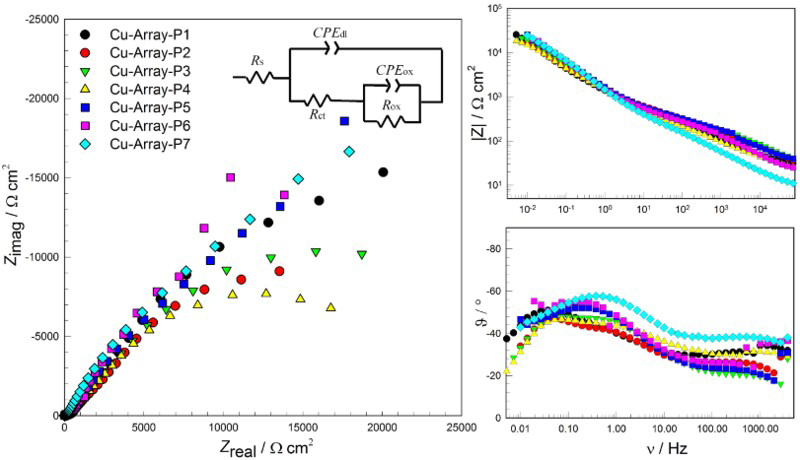
Polarisation resistances (R), current density (j corr) and corrosion rates (CR) estimated from the EIS spectra, and the corrosion rates CR1 and CR2 obtained from the CMEA measurements.
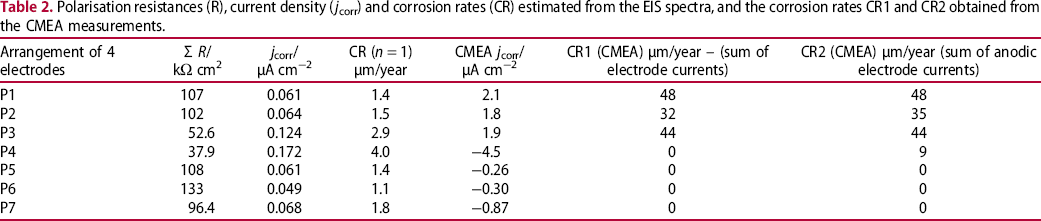
The last three columns of Table 2 present the electrochemical parameters obtained from the CMEA measurements at the end of the experiment. Electrochemical current density of each Px was calculated as a sum of all electrochemical currents measured on four electrodes in the arrangement, and averaged over the entire area of the arrangement. It can be seen that at a larger part of the arrangements, the sum of electrochemical currents was negative (cathodic). Consequently, corrosion rate CR1 was estimated by Equation (1): it is evident that cathodic currents resulted in corrosion rate 0. CR2 was estimated as a sum of only anodic currents in the arrangement, thus certain differences between CR1 and CR2 could be observed.
It is obvious that corrosion rates obtained by EIS do not correspond well with those estimated from CMEA measurements. On the other hand, it can be noticed that localisation of maximal (P4, P3) and minimal corrosion rates (P6, P5) obtained by EIS correspond fairly well with sum of electrochemical current from CMEA. It is evident that corrosion current densities obtained by EIS are significantly lower that those estimated from CMEA measurements. It could be concluded that EIS with the chosen electrical equivalent circuit can measure a non-equilibrium between anodic and cathodic currents, but does not detect the sign of this non-equilibrium.
Conclusions
In the present study the use of a CMEA was presented for monitoring copper corrosion in bentonite, saturated with saline groundwater. The study was performed using electrochemical impedance spectroscopy (EIS) and spectroscopic techniques in order to determine the corrosion products. It was found that:
The CMEA measurements showed relatively high corrosion rates, where the maximum anodic activities moved between the electrodes, thus confirming that no electrode showed a permanent anodic activity. Overall corrosion activity decreased during the exposure time. Certain fluctuations in the corrosion rate could be related to the birth of anodic ativity at particular electrodes. The average electrode activity measured by CMEA was roughly 60 µm cm−2. No disctinct pattern of intensively corroded electrodes could be defined, although it was observed that the electrodes with maximum corrosion damage were located at the edges of the copper array. The corrosion rates estimated from the EIS method were lower than those estimated from the CMEA. It can be assumed that EIS in the chosen configuration can measure the electrochemical non-equilibrium, but does not detect its direction. The corrosion products on the CMEA electrodes were versatile: fine rounded particles of cuprite were found on the electrode which behaved anodically at the beginning of the exposure time, and larger rhomboidal crystals were found on the electrodes with initial cathodic activity. A non-homogeneous distribution of different morphologies was found on the cathodically behaving electrodes. On the copper electrodes that were exposed to bentonite slurry in a groundwater solution under oxic conditions, no clear local type of corrosion was found. According to this observation and main characteristics of CMEA measurements, it could be concluded that the dominant process was uneven general corrosion.
Footnotes
Acknowledgements
The help of the laboratory staff – Viljem Kuhar and Aleš Česen – is hereby gratefully acknowledged.
Disclosure statement
No potential conflict of interest was reported by the authors.